Structural Studies of Some Bacterial Lipopolysaccharides...
49
Structural Studies of Some Bacterial Lipopolysaccharides and Extracellular Polysaccharides using NMR Spectroscopy and Mass Spectrometry Semiha Dag Faculty of Natural Resources and Agricultural Sciences Department of Chemistry Uppsala Doctoral thesis Swedish University of Agricultural Sciences Uppsala 2005
Transcript of Structural Studies of Some Bacterial Lipopolysaccharides...

Structural Studies of Some Bacterial Lipopolysaccharides
and Extracellular Polysaccharides using NMR Spectroscopy and
Mass Spectrometry
Semiha Dag Faculty of Natural Resources and Agricultural Sciences
Department of Chemistry Uppsala
Doctoral thesis Swedish University of Agricultural Sciences
Uppsala 2005

2
Acta Universitatis Agriculturae Sueciae
2005:45 ISSN 1652-6880 ISBN 91-576-7044-7 © 2005 Semiha Dag, Uppsala Tryck: SLU Service/Repro, Uppsala 2005

3
Abstract
Dag, Semiha. Structural Studies of Some Bacterial Lipopolysaccharides and Extracellular Polysaccharides using NMR Spectroscopy and Mass Spectrometry. Doctor’s dissertation. ISSN 1652-6880, ISBN 91-576-7044-7 The thesis presents structural studies of the O-specific chains from lipopolysaccharides, LPS, isolated from the bacteria Hafnia alvei strain PCM 1200, PCM 1203 and PCM 1205 and Plesiomonas shigelloides strain CNCTC 144/92 (O75:H5) as well as studies of extracellular polysaccharides, EPS, isolated from Butyrivibrio fibrisolvens strains I1 and 12. The main methods used, alone or in combination, for solving the structures have been chemical degradation procedures, mass spectrometry (MS) and nuclear magnetic resonance (NMR) spectroscopy.
In the studies of Hafnia alvei it was established that the O-deacetylated O-specific polysaccharide isolated from LPS from H. alvei strains 1200 and 1203 possess the same composition and sequence as the O-deacetylated H. alvei strain 1205, i.e. a glycerol teichoic acid-like polymer having a repeating unit composed of a pentasaccharide unit. Serological tests revealed immunochemical similarities between the LPS of the Hafnia alvei strains PCM 1200, 1203 and 1205.
In the studies of Plesiomonas shigelloides strain CNCTC 144/92 it was concluded that the O-specific chain is composed of a trisaccharide repeating unit with the following structure: [→2)-β-D-Quip3NHR-(1→3)-α-L-Rhap2OAc-(1→3)-α-D-FucpNAc-(1→] in which the R was determined as 3-hydroxy-2,3-dimethyl-5-oxo-pyrrolidine-2-carboxylic acid. The structure of the core part of the LPS was determined to be composed of a non-phosphorylated octasaccharide.
The structure elucidation of the EPS produced by Butyrivibrio fibrisolvens strain I1 revealed a hexasaccharide repeating unit with a unique substituent consisting of glucitol phosphate where the glucitol was 4,6 substituted to a pyruvic acid acetal.
The structure elucidation of the EPS produced by Butyrivibrio fibrisolvens strain 12 also revealed a hexasaccharide repeating unit with a unique substituent of glyceric acid phosphate where the glyceric acid was substituted with a glutamic acid. Keywords: lipopolysaccharides, extracellular polysaccharides, NMR, MS, structural analysis, Hafnia alvei, Plesiomonas shigelloides, Butyrivibrio fibrisolvens. Author’s address: Semiha Dag, Department of Chemistry, SLU, Box 7015, SE-750 07, Uppsala, Sweden. E-mail: [email protected]

4

5
Contents
Introduction .........................................................................................9 Carbohydrates........................................................................................................9 Bacteria and their surface polysaccharides .......................................................9
Lipopolysaccharides (LPS).................................................................................10 Extracellular polysaccharides and Capsular polysaccharides (EPS/CPS) ..........................................................................................................10 Taxonomic classification ....................................................................................11 Serological classification ...................................................................................11
Aims of this thesis ..............................................................................................11 Structural analysis of complex carbohydrates ................................................12 Purification and isolation of PS ........................................................................12 Chemical degradation of PS ..............................................................................13
De-lipidation ......................................................................................................13 De-acylation .......................................................................................................13 Partial acidic hydrolysis.....................................................................................14 Monosaccharide composition.............................................................................14 Linkage analysis .................................................................................................15 Determination of phosphorous content ..............................................................16
Separation and isolation.....................................................................................16 Analytical methods .............................................................................................17
Nuclear magnetic resonance (NMR) spectroscopy.............................................17 Mass spectrometry..............................................................................................20
Hafnia alvei (Paper I) ...................................................................21 Introduction..........................................................................................................21 The structures of O-antigens of Hafnia alvei strain PCM 1200, PCM 1203 and PCM 1205.................................................................................21 Plesiomonas shigelloides (Paper II)......................................25 Introduction..........................................................................................................25 Structural studies on the O-antigen and core of Plesiomonas shigelloides strain O74:H5 (CNCTC 144/92). ...............................................25 Butyrivibrio fibrisolvens (Paper III and IV) ....................32 Introduction..........................................................................................................32 Structural studies on the extracellular polysaccharide produced by Butyrivibrio fibrisolvens strain I1 (Paper III)............................................32 Structural studies on the extracellular polysaccharide produced by Butyrivibrio fibrisolvens strain 12 (Paper IV)...........................................40 Concluding remarks......................................................................45 References ...........................................................................................46 Acknowledgements ........................................................................49

6
Appendix
Papers I-IV
This thesis is based on the following papers, which will be referred to by their Roman numerals: I. Dag S., Niedziela T., Dzieciatkowska M., Lukasiewicz J., Jachymek W.,
Lugowski C. and Kenne L. The O-acetylation patterns in the O-antigens of Hafnia alvei strains PCM 1200 and 1203, serologically closely related to PCM 1205. Carbohydr. Res. 2004, 339, 2521-2527
Reprint was made with permission from the publisher Elsevier II. Niedziela T., Dag S., Lukasiewicz J., Dzieciatkowska M., Jachymek W.,
Lugowski C. and Kenne L. Lipopolysaccharide of Plesiomonas shigelloides serogroup O74:H5 (Strain CNCTC 144/92). Structural analysis of the lipopolysaccharide including the O-antigen, its biological repeating unit, the core oligosaccharide, and the linkage between them. (Manuscript)
III. Dag S., Cotta M. A. and Kenne L. Structural studies on the extracellular
polysaccharide produced by Butyrivibrio fibrisolvens strain I1. (Manuscript) IV. Dag S., Cotta M. A. and Kenne L. Structural studies on the extracellular
polysaccharide produced by Butyrivibrio fibrisolvens strain 12. (Manuscript)

7
Abbreviations
Alt Altrose COSY Correlated spectroscopy CNCTC Czechoslovak National collection of Type Cultures Da Dalton DEPT Distortionless enhancement by polarization transfer DMSO Dimethylsulfoxide DNA Deoxyribonucleic Acid EI Electron Ionization ELISA Enzyme-linked immunosorbent assay EPS Extracellular polysaccharide ESI-MS Electrospray Ionisation mass spectrometry FAB-MS Fast atom bombardment mass spectrometry Fuc Fucose (6-deoxy-galactose) Gal Galactose GC Gas chromatography Glc Glucose GPC Gel permeation chromatography Gro Glycerol HMBC Heteronuclear multiple bond correlation HR-MAS High resolution-magic angle spinning HSQC Heteronuclear single quantum coherence Kdo 3-deoxy-D-manno-oct-2-ulosonic acid. L,D-Hep L-glycero-D-manno-heptose LPS Lipopolysaccharide MALDI-TOF Matrix-assisted laser-desorption/ionisation time-of-flight MS Mass spectrometry m/z Mass-to-charge ratio NMR Nuclear Magnetic Resonance NOE Nuclear Overhauser Effect NOESY Nuclear Overhauser effect spectroscopy OS Oligosaccharide PAGE Polyacrylamide gel electrophoresis PCM Polish Collection of Microorganisms PMAA Partially methylated alditol acetates PS Polysaccharide Rha Rhamnose (6-deoxy-mannose) Qui Quinovose (6-deoxy-glucose) SDS Sodium Laurylsulfat SEC Size exclusion chromatography TFA Trifluoroacetic acid TOCSY Total correlation spectroscopy

8

9
Introduction
Carbohydrates
The bulk of carbohydrates exist in the form of polysaccharides (PS). They make up most of the organic matter on earth and have multiple roles in all forms of life. They serve as storage materials, structural components and protective substances. For example, starch and glycogen provide energy reserves for some cells and chitin and cellulose provide support for the skeletons of arthropods and plants respectively. Many polysaccharides have multiple roles or have still unknown functions. The large structural variation in combination with the natural heterogeneity complicates the identification and structural determination of PS. Some of the most interesting polysaccharide structures in nature are found in or in the region of the bacterial cell walls since bacteria synthesise many polysaccharides of diverse composition [1, 2]. Bacteria and their surface polysaccharides
Bacteria are classified as Gram-positive or Gram-negative depending on the structure of their outer membranes. Gram-positive bacteria have a relatively thick cell wall consisting of multiple layers of protective peptide-polysaccharide conjugates, peptidoglycans. Gram-negative bacteria, in contrast, have a much thinner cell wall consisting of a single layer of peptidoglycan between the inner and outer lipid bilayer membranes (Fig. 1).
LPS Repeating unit
Inner coreOuter core
O-S
peci
fic C
hain
Cor
eLi
pid
A
Outer membrane
Inner membrane
Periplasm
EPS/CPS (if present)
Phospholipids
LipoproteinsPeptidoglycan
KdoHeptosesHexoses
Fig. 1. Schematic representation of the cell envelope of a Gram-negative bacterium.

10
The surface of these bacteria is covered with lipopolysaccharides (LPS). Some bacteria produce capsular or extracellular polysaccharides (CPS/EPS). They may also have flagella which are long filaments used for motility but they will not be discussed further here. The topic of this thesis is structure determination of the O-specific chain of LPS from strains of Hafnia alvei (Paper I) and Plesiomonas shigelloides (Paper II) as well as the repeating units of the EPS from two Butyrivibrio fibrisolvens strains (Paper III and IV).
Lipopolysaccharides (LPS)
The presence of LPS in the outer membrane confers stability to the bacterial membrane, protection against bacteriophages and the action of certain antibiotics, as well as protection against the host defence mechanism during infections [3]. A LPS consists of a polysaccharide part and a lipid part that anchors the molecule in the outer membrane. The complex structure of LPS can be further divided into the O-specific chain (also known as O-antigen), the core oligosaccharide and lipid A (Fig. 1).
The O-specific chain is the part of the LPS that shows the largest variation between species and the part that evokes a specific immune response. It stimulates production of antibodies able to recognise that particular O-chain. Some bacteria do not produce an O-chain and these LPS are sometimes called rough-type LPS. The name is derived from the characteristic rough edges of the obtained colonies when growing the bacteria on agar plates. When the O-antigen is present the edges of the colonies are smooth and therefore these LPS are sometimes called smooth-type LPS. The O-antigen consists of repeated oligosaccharide units and is attached to the core. The core oligosaccharide is divided into the outer core (the part that is linked to the O-specific chain) and the inner core (the part that is linked to lipid A). The core part has a complex structure consisting of heptoses and hexoses. It is joined to lipid A region by 3-deoxy-D-manno-octulosonic acid, Kdo, which is an eight carbon sugar. The core structure is relatively conserved for each type of bacteria and its biological function is not clear. The structure of lipid A is even more conserved than that of the core. The lipid A part is responsible for endotoxic propeties, pyrogenicity, complement activation, adjuvancy and B lymphocyte mitogenicity [3, 4]. Extracellular polysaccharides and Capsular polysaccharides (EPS/CPS)
Polysaccharide capsules are structures found on the cell surface of a broad range of bacterial species. The CPS is like the LPS covalently attached to the cell wall while the EPS molecule appear to be released onto the cell surface with no discernable means of attachment. The EPS and CPS are also like the O-antigen in the LPS built up oligosaccharide repeating units into homo- or hetero-polymers. The structure of the repeating unit varies between different strains and the introduction of branched polysaccharide chains and substitution of both organic and inorganic molecules gives additional structure complexity.

11
Taxonomic classification
Taxonomy is the practice of classifying plants and animals according to their presumed ancestral. Different methods can be used to identify the origin of an organism. Determining the morphology, biochemical characteristics, serology or genotyping together or in combinations are examples of ways of classifying species into distinct groups. Structural analyses of extracellular polysaccharides are also helpful in the taxonomic classification of biological organisms. For example in the study of B. fibrisolvens the species was divided into two distinct taxonomic groups depending on the presence or absence of an acidic sugar [5]. Serological classification
The antibody-carbohydrate interaction may be used as a tool for classification of organisms into different serogroups. It has so far been one of the main ways of distinguishing, for example, the different strains of the organism of P. shigelloides [6]. The method is based on the antigenic differences in bacterial surface molecules. The antibodies raised against the O-antigens are the basis on classifying strains into different O-serogroups. Serogroups can also be characterised by e.g. their differences in the flagella (H-antigen) or differences in their capsular polysaccharide (K-antigens). For example, in serotype O74:H5 of P. shigelloides the serogroup O of the strain is defined by the O-antigen in the LPS and H by the H-antigen i.e. the flagella. The differences in the O-specific chain can range from different sugars to slight differences in only O-acetyl substitutions.
The term cross-reactivity is used when an antigen reacts with antibodies raised against another antigen. Cross-reactivity can be used as help in the serological classifications when studying similarities between different strains coming from the same bacteria. This will show that the two antigens probably have some feature in common. To visualise this interaction different methods are available. The immunoblotting and enzyme-linked immunosorbent assay (ELISA) methods have been used in these studies [7]. In immunoblotting LPS is first separated by sodium dodecyl sulphate/polyacrylamide gel electrophoresis (SDS/PAGE). The SDS is added preventing LPS form forming aggregates and to make the solution conductive. In electrophoresis charged molecules in solution are separated by their migration in an electric field. To visualise the bands on the obtained gel silver staining is used. The resolved LPS are then transferred to a nitrocellulose membrane for identification of individual antigens by specific antisera, so called blots. With the method of ELISA quantification of the antigen-antibody reaction is possible. Aims of this thesis
To facilitate the understanding of the immunochemical properties of bacteria and for classification of organisms, structural analysis of polysaccharides is helpful. In this thesis the structures of the O-antigen from Plesiomonas shigelloides strain CNCTC 144/92 (Paper II), Hafnia alvei strains 1200, 1203 and 1205 (Paper I) were studied as well as the extracellular polysaccharides from Butyrivibrio fibrisolvens strain I1 and 12 (Paper III and IV). Although these different types of

12
bacteria have different structures, origins and functions, they have been analyzed by similar methods.
Structural analysis of complex carbohydrates
The first step in structural analysis of bacterial polysaccharides (Fig. 2) is to purify and isolate the polysaccharide. It is possible to study whole bacterial cells but to simplify the structural analysis the polysaccharide (PS) is, if needed, chemically degraded into oligosaccharides (OS) or even down to monosaccharides. In different stages the degraded material is separated and analysed with suitable methods.
PurificationIsolation
Analytical methods
Chemical degradation
Separation
Phenol extractionEnzymatic treatmentDialysis
EPS/LPSDe-lipidation (PS) De-acylation (PS )Partial hydrolysis (OS) Hydrolysis (Monosaccharide)
MS and NMR
SEC, Bio-Gel P-10DEAE Sephadex A-50
Fig. 2. Rough scheme for structural analysis of bacterial polysaccharides. Purification and isolation of PS
The isolation of pure samples is essential for a successful investigation of carbohydrates. The analytical data of complex components such as carbohydrates mixed with impurities make the interpretation difficult. In Fig. 3 the main steps for purification of LPS from bacterial polysaccharides are presented. The isolation of LPS/EPS from dry bacterial mass is conventionally initiated with phenol/water extraction [8]. In this step the proteins are removed with the phenol-phase and LPS/EPS remains in the water-phase together with salts and nucleic acids (DNA/RNA) of both high and low molecular weight. To remove salts and low molecular DNA/RNA from the LPS/EPS, dialysis with pore size of 12 000 Da can be used.

13
Fig. 3. The main steps for purification of bacterial LPS. The weight values 18 g, 2 g and 0.1 g in the figure represent the results obtained from the isolation of LPS from P. shigelloides strain 144/92.
The LPS/EPS remains inside the bag while small molecules diffuse through the pores of the dialysis bag. In the case of EPS the proteins, RNA and DNA were also enzymatically degraded by treatment of RNAse, DNAse and protease K and then dialysed. In the case of LPS the remaining contaminants of high MW nucleic acids were removed from the LPS by ultracentrifugation. In this step LPS forms aggregates and precipitate during the centrifugation. The nucleic acids of high MW remain in the supernatant. In the case of EPS the sample was passed through glass-wool and then through a micro-filter of 0.45 µm. The samples were then freeze-dried and saved for structural studies. Chemical degradation of PS
De-lipidation
To increase solubility and to simplify the analysis of LPS, the lipid part is usually removed. This is achieved by mild acidic hydrolysis, which selectively cleaves the ketosidic linkage of Kdo. In this thesis mild hydrolysis was performed by using 1% HOAc at 100 °C for 30-45 min. The detergent SDS was added to the solution to prevent aggregate formation of LPS. The hydrolysis time can thus be reduced and the cleavage of other sensitive linkages such as furanosidic linkages is prevented. De-acylation
Substitution with O/N-acyl groups is very common in bacterial polysaccharides [2]. It is not unusual that the native PS is non-stoichiometrically acylated, which consequently leads to increased complexity of the NMR spectra. Therefore removal of the acyl groups is desirable. In this thesis the removal of the O-acyl groups was mostly performed by treatment with 12.5% aqueous NH3 solution over night at room temperature or with 25% aqueous NH3 solution for 4 h at 40 °C. Comparison of the PS 1H NMR spectrum before and after the O-deacylation may allow for the assignment of the O-acyl location in the native material. N-deacylation may be achieved by treatment with sodium hydroxide or with hydrazine.
Dry bacteria18 g
Phenol Extraction
Dialysis Ultra-
centrifugation2 g
Freeze-drying
0.1 g
ProteinsLPS high MW
SaltsDNA/RNA low MWDNA/RNA high MW
LPS
SaltsDNA/RNA low MWDNA/RNA high MW
LPS
DNA/RNA high MWLPS
LPS

14
Partial acidic hydrolysis
Oligosaccharides are more easily characterised by NMR and MS than polysaccharides. Polysaccharides can be degraded to oligosaccharides by acidic hydrolysis that can be very specific for certain kinds of linkages. Furanosidic linkages are sensitive and can be cleaved selectively. Glycosidic linkages of 6-deoxyhexoses and acetamidosugars are more sensitive to acid than those of other hexoses [9]. Pyruvic acid acetal linked to a glycosyl residue is also sensitive to acid. In Paper II PS were treated with 48% hydrofluoric acid at room temperature over night or at 4 °C for 4 days to obtain oligosaccharides. The obtained OS was analysed by MALDI-TOF MS for mass and sequence determination. Phosphate groups present in the repeating unit are also removed by aqueous 48% HF, a method used in Paper III. Smith degradation is another method to degrade PS to OS. Smith degradation is used to simplify the elucidation of the repeating unit by selective removal of some of the residues. This procedure can be applied when several overlaps of NMR signals or heterogeneity in the repeating unit is a hindrance in the structural studies. The Smith degradation involves sequential treatment of PS with NaIO4 (sodium metaperiodate), sodium borohydride and dilute acid [10]. The oxidation yields a product in which vicinal hydroxyl groups have been oxidised to aldehydes by cleavage of carbon-carbon bonds.
OH
OH
O
O
I
OH
OHO
OH O
O
R
R
R
R
R
R
NaIO4
H2O
Residues without any vicinal hydroxyl groups should thus remain unaffected. The reduction of aldehydes yields a polyalcohol. Mild acidic hydrolysis of these yields OS or PS that contain sugar residues and fragments of modified sugar residues. This method has been utilized in the determination of the B. fibrisolvens strain I1 (Paper III).
Monosaccharide composition
To determined the complete structure of a PS, the monosaccharide composition with their absolute and anomeric configurations, the linkage between monosaccharides, and if present, the structure and positions of non-carbohydrate and inorganic substituents have to be established. To determine the monosaccharide composition a method called sugar analysis can be used [11]. All glycosidic linkages in the polysaccharide are cleaved and several methods may be used to accomplish this. The rate of hydrolysis of glycosidic bonds can differ significantly. For example, 6-deoxyglycosides hydrolyses 10 times faster than glycosides while uronic acids are resistant to normal acid-catalysed hydrolysis because of the inductive effect of the carboxyl group [9]. In this thesis two methods have been used to degrade PS; acidic hydrolysis and methanolysis. Solutions of strong acids such as hydrochloric, sulphuric or trifluoroacetic acid (TFA) can be used. TFA is easy to evaporate and therefore preferable. The monosaccharides are then reduced by NaBH4 or NaBD4 to alditols to simplify the chromatogram obtained from gas chromatographic (GC) analysis. The mutarotation is hereby

15
prevented and a single derivative for each monosaccharide is formed. To increase the volatility, the alditols are acetylated. The derivatives are identified from retention times compared to standards and by their mass spectra.
O
OSugar3
OH
OHO
OH
Sugar1O
OH
HOHO
OH
H+
OH
H- H
CH2OH
O
HHO
OHH
OHH
CH2OH
H
CH2OAc
OAc
HAcO
OAcH
OAcH
CH2OAc
Ac2O
Methanolysis usually causes less degradation of the liberated monosaccharide than normal acidic hydrolysis. It is performed with hydrogen chloride in methanol, which gives the methyl glycosides, and in the case of uronic acids the methyl esters or lactones. These can be analysed by GC after e.g. acetylation or trimethylsilylation. The disadvantage of this method is that each sugar gives rise to multiple peaks due to anomerisation and different ring size e.g. α/β mixtures of both furanosides and pyranosides.
O
OH
HOHO
OHOMe
HO
OH
HOHO
OHH
OMe
HO
OMe
H
H
H OH
HO HO
H
HOHO
H
OMe
H
H OH
HO HO
H
HO
α-pyranoside β-pyranoside α-furanoside β-furanoside
Sugars can either have the D or the L configuration. To establish their absolute configuration, monosaccharides are subjected to acid-catalysed reaction with optically active 2-butanol or 2-octanol [12, 13]. The glycosides obtained are then trimethylsilylated or acetylated and analysed by GC. The obtained diastereomers from the D- and L-isomers have different GC retention times and can be distinguished with the help of authentic standards [12, 13]. These methods are sensitive and easy to use if no unknown monosaccharides are present which requires the synthesis of standards.
A complementary procedure for identification of the monosaccharide constitution of complex carbohydrates is nuclear magnetic resonance (NMR) spectroscopy, which will be discussed in later. This method requires more material compared to the methods descried above, but it is non-destructive. The anomeric configuration and ring size can be determined by NMR alone but not the absolute configuration. However if the absolute configuration of one sugar residue is known then the absolute configuration of the adjacent residues can be determined by analysis of he 13C glycosylation shifts and NOEs at the glycosidic linkage.
Linkage analysis
Methylation analysis is a well-known chemical method for determination of the linkage position of sugar residues in a polysaccharide. Although this information

16
can be obtained non-destructively by NMR spectroscopy, methylation analysis is still used alone or in combination with NMR spectroscopy. The polysaccharide is treated with dimethylsulphinyl anion to de-protonate the hydroxyl groups yielding polyanion. The alkoxy groups are reacted with methyl iodide and a fully methylated polysaccharide is obtained. The sample is then hydrolysed, reduced and acetylated to produce volatile partially methylated alditol acetates (PMAA). The PMAA are identified from their retention times on GC as well as their characteristic electron ionization (EI) mass spectra [14]. In this thesis the reduction was performed with NaBD4 to label C-1.
O
O
Sugar3
OH
OHO
OH
Sugar1
O
OMe
HOMeO
OMe
H+
OH
H
CHDOH
OMe
HMeO
OHH
OHH
CH2OMe
O
O
Sugar3
OMe
OMeO
OMe
Sugar1
MeI
Base H
CHDOAc
OMe
HMeO
OAcH
OAcH
CH2OMe
Ac2OD-
The linkage analysis of sugars with carboxyl function causes problems as the carboxyl group is converted to a non-volatile sodium carboxylate. By the method of Taylor et al. [15] the carboxyl function -COOH can be reduced to a -CH2OH group forming neutral sugars. The reduction of the polysaccharide was carried out by coupling the carboxyl group to a water-soluble carbodiimide at pH 4.75 followed by addition of NaBH4 or NaBD4. The reaction was repeated once.
O
O
H
H
O
H
O
OHH
H
OH
CH3H
O
HO
O
O
H
H
O
H
O
OHH
H
OH
CH3H
HO
reduction
Determination of phosphorus content
Several bacterial polysaccharides contain phosphoric monoester or diester groups [2]. To determine the content of phosphorus in biological matter one can use the colour that is formed through reduction of a phospho-molybdate complex [16]. The absorbance of the solution is measured by spectrophotometry at 820 nm. This procedure was used in Paper III to detect phosphates. The references used were in the range of 2.5-20 µg of phosphorous. The nucleus of 31P has a magnetic moment and can therefore also be studied by NMR spectroscopy. Separation and isolation
The LPS is degraded and the material is separated and isolated by different methods. Size exclusion chromatography (SEC) has been used to separate long PS chains from shorter O-antigen chains and from core oligosaccharides. SEC was also used to isolate methyl glycosides and degraded PS. SEC, also known as gel

17
permeation chromatography (GPC), is an accepted technique for characterising polymers. It separates molecules on the basis of their size relative to the pores in the packing particles. However, closer consideration reveals that the size of the molecule also depends on primary and secondary structural factors. Packing particles can be polymers of e.g. acrylamide or more hydrophilic agarose or dextran. When separating O-antigens or degraded PS the SEC was performed on Bio-Gel P-10 or Bio-Gel P-2 with the fractionation range of 1500-20000 Da and 100-1800 Da, respectively. The packing material was equilibrated with a 0.05 M pyridinium acetate buffer (Paper I and II) or with water (Paper III and IV). The eluates were detected with a differential refractometer. Data was accumulated on a PC with the software Picolog Recorder (PicoLog for Windows, Pico Technology Ltd, UK). Obtained fractions were studied by NMR spectroscopy and MS.
When separating the acidic extracellular polysaccharide (Paper III and IV) the anion exchanger DEAE Sephadex A-50 was used. The structure of this gel is cross-linked dextran and it has a great porosity prepared for large molecules Mw>30 000. The ion exchange group is the positively charged diethyl-(2-hydroxy-propyl)aminoethyl which is attached to glucose units in the matrix by stable ether linkages. The eluation was obtained by a gradient of 0-1.0 M NaCl. The detection of the fractions was done by the phenol-sulfuric acid method where the overall carbohydrate content of the sample was measured colourimetrically [17].
Gas chromatography was used in monosaccharide-, linkage- and absolute- determination of the sugars (Paper II-IV). The obtained products from the different methods were separated on a column with (5% phenyl)–95% methylpolysiloxane. The ionisation method used was EI and the detector used was a quadropole mass spectrometer. Analytical methods
Nuclear magnetic resonance (NMR) spectroscopy
NMR is widely used for structure analysis of carbohydrates. About 1 mg of isolated sample can be enough for a complete structural assignment. The method is non-destructive and relies on the magnetic properties of some nuclei. In this thesis the NMR active isotopes 1H, 13C, and 31P nuclei are used for structural analysis. NMR experiments are often performed in D2O to reduce the complexity of the obtained NMR spectra since deuterium and protons are not observed at the same frequency. Protons of hydroxyl, carboxyl, amine and amide groups are exchanged with deuterium and simpler spectra are obtained. However, to achieve 100% exchange of deuterium with water protons is difficult and usually an intense, broad signal obtained from HDO is found in the spectrum. Signals from HDO can be reduced by repeated lyophilisation of the sample with D2O, which also leads to a better use of the dynamic range of the spectrometer. By changing the temperature the HDO signal can be shifted in order to visualise other overlapped signals. By increasing the temperature the signal shifts upfield. In addition the viscosity of the sample is reduced and the line width of the resonances is reduced. If the temperature is reduced the HDO signal shifts downfield and the rate of proton/deuterium exchange is reduced which makes it possible to determine the
18
chemical shifts of non-exchanged hydroxyl and amide protons. This procedure has been applied in Paper II to assign all hydroxy and amide protons in the repeating unit.
By 1D 1H-NMR, the number of sugar residues and their anomeric configuration can be determined. The number and type of methyl groups is also determined. In a 1D 1H-NMR spectrum signals from methyl groups in the δH 1.2-2.3 ppm region reveal the presence of 6-deoxy sugars, O- and N-acetyl groups and substituents such as 1-carboxyethyl ethers. The connectivity between the nuclei in a residue and the connectivity between the nuclei of different residues can be obtained with 2D NMR. In these studies COSY, TOCSY, HSQC-DEPT, HSQC-TOCSY, HMBC and NOESY experiments have been used. Homonuclear COSY and TOCSY spectra are useful in the identification of individual monosaccharide residues. In a heteronuclear spectrum, like HSQC-DEPT, all signals in the spectra represent a direct correlation between a carbon and a proton. The DEPT sequence allows the differentiation between CH and CH3 (positive signals) from CH2 protons (negative signals), which is helpful in the structural determination. HSQC-TOCSY experiments are useful and give additional spreading in the carbon dimension, which may simplify the assignment of the individual spin systems when overlaps in the proton dimension are present. HMBC experiments establish multiple-bond correlation also through the glycosidic bonds and together with NOESY experiments information on linkages and sequences are obtained.
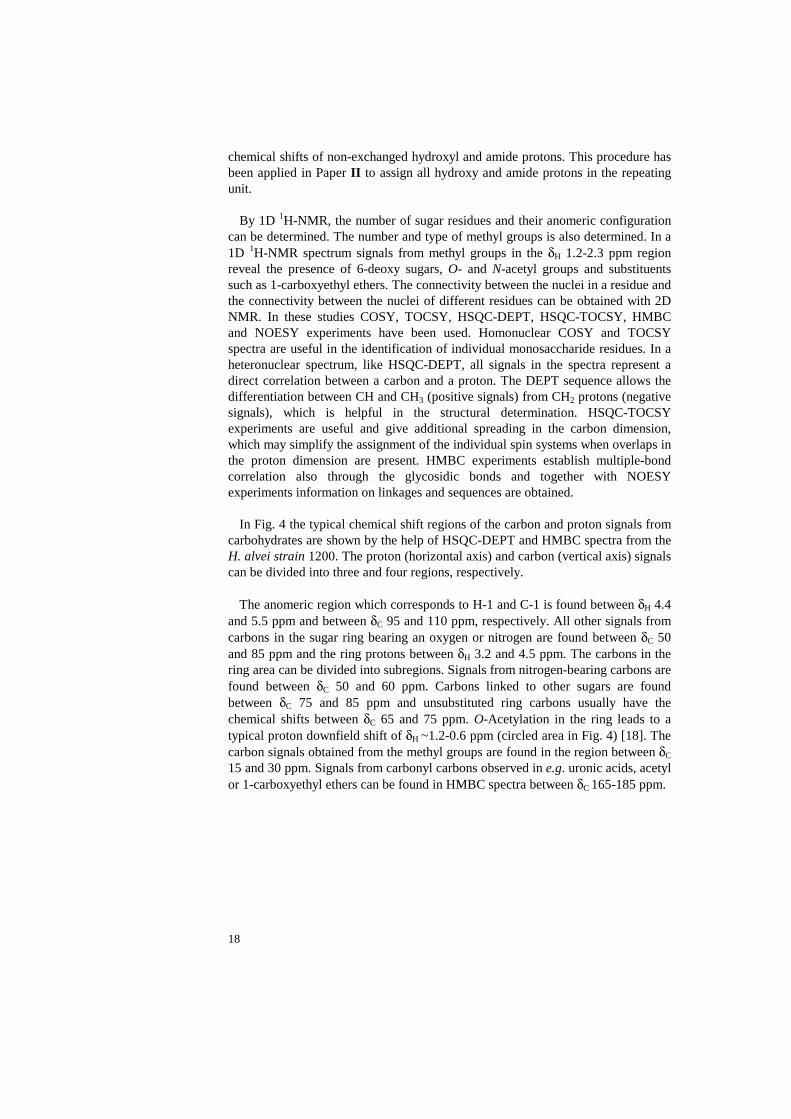
In Fig. 4 the typical chemical shift regions of the carbon and proton signals from carbohydrates are shown by the help of HSQC-DEPT and HMBC spectra from the H. alvei strain 1200. The proton (horizontal axis) and carbon (vertical axis) signals can be divided into three and four regions, respectively.
The anomeric region which corresponds to H-1 and C-1 is found between δH 4.4 and 5.5 ppm and between δC 95 and 110 ppm, respectively. All other signals from carbons in the sugar ring bearing an oxygen or nitrogen are found between δC 50 and 85 ppm and the ring protons between δH 3.2 and 4.5 ppm. The carbons in the ring area can be divided into subregions. Signals from nitrogen-bearing carbons are found between δC 50 and 60 ppm. Carbons linked to other sugars are found between δC 75 and 85 ppm and unsubstituted ring carbons usually have the chemical shifts between δC 65 and 75 ppm. O-Acetylation in the ring leads to a typical proton downfield shift of δH ~1.2-0.6 ppm (circled area in Fig. 4) [18]. The carbon signals obtained from the methyl groups are found in the region between δC 15 and 30 ppm. Signals from carbonyl carbons observed in e.g. uronic acids, acetyl or 1-carboxyethyl ethers can be found in HMBC spectra between δC 165-185 ppm.

19
5
5
4
4
3
3
2
2
1
1
100 100
80 80
60 60
40 40
20 20
13C
(pp
m)
5 4 3 2 11H (ppm)
185 185
175 175
165 165
Carbonyl carbons
Anomeric carbons
Ring carbons
Methyl carbons
Met
hyl p
roto
ns
Rin
g pr
oton
s
Ano
mer
ic p
roto
ns
Fig. 4. The typical chemical shift ranges of signals from the carbon and proton in carbohydrates. The upper spectrum is an HSQC-DEPT spectrum and the lower is an HMBC spectrum obtained from H. alvei strain 1200. Circled area is where signals obtained from acetylated ring carbons my appear.
By measuring the coupling constant 3JH1,H2 the anomeric configuration of a gluco-pyranosyl residue can be determined. If the 3JH1,H2 value for this residue is 3-4 Hz the anomeric configuration is α and if the value is 7-8 Hz then the configuration is β. If the glycosyl residue has the manno-configuration (chair configuration D-4C1 or L-1C4) the distinction between the α- or β-form is not straightforward since the couplings are less than 3 Hz and usually not resolved in the spectra because of the line broadening. In these cases the 3JC1,H1 values can be used. They are 168-174 Hz for α-pyranosyl residues and 160-167 Hz for β-pyranosyl residues [19].
High resolution-magic angle spinning (HR-MAS) [20] can be used to obtain a higher resolution of spectra for a variety of samples that would otherwise result in

20
poorly resolved spectra such as samples with reduced mobility e.g. bacterial cells and LPS. HR-MAS has in these studies been utilised to confirm that the structure of the O-antigen or core is intact and not degraded during the work up procedures Paper I and II. A Bruker HR-MAS probe SB BL4 was used to generate NMR spectra from bacterial cells and LPS. Sample amounts of 2-3 mg were placed into a magic angle spinning rotor made of ZrO2, with the outer diameter of 4 mm and were carefully mixed with 12 µl of D2O. The samples were run at 23 °C using one dimensional T2-filtered experiments with the Carr-Purcell-Meiboom-Gill (CPMG) pulse-sequence [21], using acetone (δH 2.225 ppm) as standard. The rotor was spun at the rate of 5 kHz. Mass spectrometry
In this thesis gas chromatography-mass spectrometry (GC-MS), matrix assisted laser desorption/ionisation time-of-flight mass spectrometry (MALDI-TOF MS), fast atom bombardment mass spectrometry (FAB-MS) and electrospray ionisation ion trap mass spectrometry (ESI-ITMS) have been employed. In GC-MS volatile molecules are identified by their GC-retention times and by their EI mass spectra. MALDI-TOF MS, FAB-MS and ESI-ITMS are mild desorption and ionisation methods compared to EI. They make it possible to analyse PS, OS and monosaccharides with detection limits ranging from picomolar to femtomolar. Prominent molecular ions are obtained and the mass spectrum provides molecular weight or even sequence information, which is helpful for the structural analysis of LPS. GC-MS was used to analyse the monosaccharide composition obtained from the different degradation methods mentioned before i.e. the alditol acetates, the partially methylated alditol acetates and the pertrimethylsilylated (+)- or (-)-2-butyl glycosides.
m/z1200 3000
Inte
nsity
1306.3
1939.31493.3
2572.21639.3 2126.3
O O ONHR
OH
CH3
CH3
OH
OH
OHCH3
NHAc
OO
O
300 146 187
Repeating unit 633
Fig. 5. MALDI-TOF mass spectrum of O-deacetylated PS from P. shigelloides 144/92 treated with 48% hydrofluoric acid. The MALDI-TOF mass spectra were obtained in the positive mode with 2,5-dihydroxybenzoic acid as matrix.

21
MALDI-TOF MS was used in the studies to determine the mass of the repeating unit of the polysaccharides. For example, the MALDI-TOF mass spectrum obtained from O-deacetylated polysaccharide from P. shigelloides 144/92 treated with 48% hydrofluoric acid showed a mass difference of 633 Da between the main peaks at m/z 1306.3, 1939.3 and 2572.2 corresponding to the mass of the repeating unit (Fig. 5). The sequence of the repeating unit and the masses of the individual monosaccharide components in the repeating unit were also possible to determine.
High resolution FAB-MS was used for the elemental analysis of the substituent found in the studies of P. shigelloides strain 144/92 (Paper II) and B. fibrisolvens strain 12 (Paper IV). ESI-MS was used to identify the isolated substituent in the repeating unit of the B. fibrisolvens strain I1 (Paper III).
Hafnia alvei (Paper I)
Introduction
Hafnia alvei is a Gram-negative bacterium and a member of the family Enterobacteriaceae. There are reports from Finland [22], Canada [23] and Bangladesh [24] were H. alvei has associated with diarrhoea. H. alvei has a serotyping scheme including 39 O-serogroups [25, 26]. Serological characterisations of some core regions of some H. alvei strains have been performed. The differences and similarities of H. alvei strains 1200 and 1203 were described and compared to previously reported H. alvei strain 1205 [27]. The strains show serological relation with each other but are classified separately [28] therefore the structures of the O-antigens of these strains were of interest and the structural studies of them were preformed.
The structures of O-antigens of Hafnia alvei strain PCM 1200, PCM 1203 and PCM 1205
The bacteria H. alvei strain PCM 1200, PCM 1203 and PCM 1205 were derived from the collection of the Institute of Immunology and Experimental Therapy, Wroclaw, Poland. LPS was isolated by phenol-water extraction and cross-reactions of the LPS of H. alvei strains 1200, 1203 and 1205 were analysed by immunoblotting and ELISA [7]. Polyclonal antibodies were produced against bacterial cells of H. alvei PCM 1200 and PCM 1203. The immunoblotting and ELISA tests both demonstrated that the antibodies against the O-antigen of H. alvei strains PCM 1200 reacted strongly with homologous LPS and those of strains PCM 1203 and PCM 1205. Likewise, the antibodies against the O-antigen of H. alvei strains PCM 1203 showed reaction with homologous LPS and cross-reaction with LPS of strains PCM 1200 and PCM 1203.
The lipid A part was cleaved off from the LPS by mild acidic hydrolysis and released long O-antigen chains (PS) were separated from the shorter core

22
oligosaccharides by fractionation on SEC. The O-antigen from strains 1200, 1203 and 1205 of H. alvei were studied by NMR (Fig. 6).
1D 1H-NMR and 2D HSQC-DEPT spectra recorded for O-antigens from H. alvei strains 1200, 1203 and 1205 showed a pentasaccharide repeating unit. The sugar residues were designated by A-E according to decreasing chemical shifts of the anomeric proton as can bee seen in Fig. 6. Furthermore one 6-deoxysugar and one or two O-acetyl groups, depending on which H. alvei strain studied, was identified in the spectra. In the spectra of strain 1200 and 1205 one signal obtained for the methyl protons of an acetyl group was present. In strains 1203 signals from two O-acetyl groups were observed in the spectrum. Integration of the N-acetyl region in the 1D 1H-NMR spectra indicated three N-acetyl groups in the repeating unit giving rise to signals spread between δH 1.97-2.08 ppm.
3.63.84.04.24.44.64.85.0 ppm 1.21.41.61.82.02.2 ppm
1200
1203
1205
C-1A-1 E-1
B-1
C-3D-1C'-1
E-6
C-OAc
C-1
A-1 E-1B-1
C-3D-1C'-1
E-6
C-OAc
C-1A-1 E-1
B-1
C-3D-1C'-1
E-6
C-OAc
A-OAc
A'-1
Fig. 6. 1H-NMR spectra on O-antigens from H. alvei strain 1200, 1203 and 1205. Experiments were run in D2O at 30°C.
The corresponding 13C signals (δC 22.9-23.4 ppm) were found in the HSQC-DEPT spectrum. The 1H-NMR spectra of the PS from H. alvei strains 1200, 1203 and 1205 contained signals with different integral intensities that indicated non-stoichiometric acetylation. The polysaccharide was O-deacetylated and studied by NMR. The obtained NMR spectra for the studied H. alvei strains 1200, 1203 and 1205 were identical after O-deacetylation and the chemical shifts obtained for the proton and carbon signals in the O-deacetylated repeating unit are presented in Paper I.

23
The chemical shifts were in good agreement (|∆δ| < 0.03 ppm in 1H and |∆δ| < 0.2 ppm in 13C) with the corresponding values of H. alvei strain 1205 previously reported [27]. The 1H and 13C signals observed in the spectra from H. alvei strains 1200, 1203 and 1205 were assigned from 1D 1H-NMR spectra together with 2D HSQC-DEPT, COSY, TOCSY and HMBC spectra. 1D 31P-NMR verified the presence of the glycerol teichoic acid like element in the O-deacetylated O-antigens from H. alvei strain 1200 and 1203 using strain 1205 as reference. Residue A was assigned as a 3-substituted α-D-GlcpNAc, residue B as a terminal α-D-Glcp, residue C as a terminal β-D-GlcpNAc, residue D as 2,3,4-substituted β-D-Galp and residue E as 3-substituted β-D-Quip4NAc.
The positions of the N-acetyl groups in the native PS were not determined due to the complexity. However the spectra obtained from O-deacetylated strains the assignments of 1H and 13C signals of methyl groups of N-acetyls were possible. NMR spectra of O-deacetylated polysaccharides were compared with spectra from native strains in order to determine the position of O-acetyl groups. Chemical shift differences, ∆δH and ∆δC, between O-deacetylated and native polysaccharide of H. alvei strain 1200, 1203 and 1205 were compared with literature values of mono-O-acetylated methyl α- and β-D-glycosides [18] (Table 1) where the signals with significant changes in the chemical shifts (|∆δH | >1.7 ppm and |∆δC|>0.48 ppm) were found. Table 1. 1H and 13C chemical shift differences between the O-deacetylated and the native PS of H. alvei strains 1200, 1203 and 1205 in comparison with literature values of mono-O-acetylated methyl α- and β-D-glycosides [18]. The literature values are the chemical shift differences relative to their parent glycoside. Positive differences indicate downfield shifts.
C-1/H-1 C-2/H-2 C-3/H-3 C-4/H-4 C-5/H-5 C-6/H-6
Residue ∆1 ∆2 ∆3 ∆4 ∆5 ∆6 1200, 1203* and 1205
C β-D-GlcpNAc-(1→ 13C -0.4/-0.3* -1.6 1.7/1.8* -2.3 -0.2 0.0
Methyl 3-O-Ac-β-D-Glcp 13C -0.2 -1.7 1.8 -1.7 0.0 -0.2
C β-D-GlcpNAc-(1→ 1H 0.12/0.13* 0.08/0.09* 1.45/1.46* 0.21/0.23* 0.10 -0.02/0*
Methyl 3-O-Ac-β-D-Glcp 1H 0.10 0.18 1.49 0.19 0.10 0/ 0.02
1203
A →3)-α-D-GlcpNAc-(1→ 13C 0.3 0.3 -0.5 0.1 -1.9 3.1
Methyl 6-O-Ac-α-D-Glcp 13C 0.1 -0.1 -0.2 0.0 -2.3 2.9
A →3)-α-D-GlcpNAc-(1→ 1H -0.4 0.06 0.0 -0.01 0.2 0.48/ 0.56
Methyl 6-O-Ac-α-D-Glcp 1H -0.01 0.01 0.01 0.06 0.21 0.53/ 0.54
* Delta values obtained from H. alvei strain 1203.
Deshielding leads to a downfield shift in the spectrum as can be seen for C-3 (∆δC3 1.7 ppm) of residue C in H. alvei strain 1200 and 1205 as well as for 1203 but with a slight shift of 0.1 ppm (∆δC3 1.8 ppm). In strain 1203 of H. alvei there is additionally a downfield shift of C-6 in residue A (∆δC6 3.1) indicating an O-acetyl group at this carbon.

24
In H. alvei strain 1200 and 1205 one acetyl group is attached to O-3 of residue C (β-D-GlcpNAc). H. alvei strain 1203 has two acetylation sites of which one is at O-3 of residue C (β-D-GlcpNAc) and one at O-6 of residue A (α-D-GlcpNAc). In Fig. 7 the structures of H. alvei strain 1200 and 1203 are presented.
OCH2OH
OHO
O
O
NHAc
R2
AcNHO
OH
CH3
O O
P
O
OHO
HO
O
HO
OOH
HOH2C
HO
O
R1
NHAc
CH2OH
OH
A
D
B
EGro
P
R1 R2
Strain 1200
Strain 1203
OH
O
OAc (50-80%)
COAc (50-70%)
OAc (50-80%)
Fig. 7. The structure of the repeating unit of the O-antigen of H. alvei strain 1200 and 1203.
Studies of the O-acetylation of O-specific polysaccharides are normally done on the isolated PS. When isolating the PS from its lipid part the material is exposed to mild acidic hydrolysis leading to the possible loss of O-acetyl groups or O-acetyl migration to neighbouring position. One way to check an intact polysaccharide is to compare it with the polysaccharide still integrated in the bacterial cell wall. Therefore HR-MAS 1H-NMR was run on intact bacteria and the obtained spectra were compared with spectra of the isolated O-antigen PS in order to determine possible migrations or losses of O-acetyl groups. All the O-acetyl groups determined in the NMR spectra from O-specific polysaccharides from H. alvei strain 1200, 1203 and 1205 were in good agreement with the one obtained from the bacterial cell.
It is concluded that native O-antigen of H. alvei strains 1200, 1203 and 1205 differs in the number, position and the degree of O-acetyl groups attached to a common backbone. The acetylation degree is determined on the basis of the inte-grated intensities of the appropriate 1H-NMR signals obtained for the native PS.
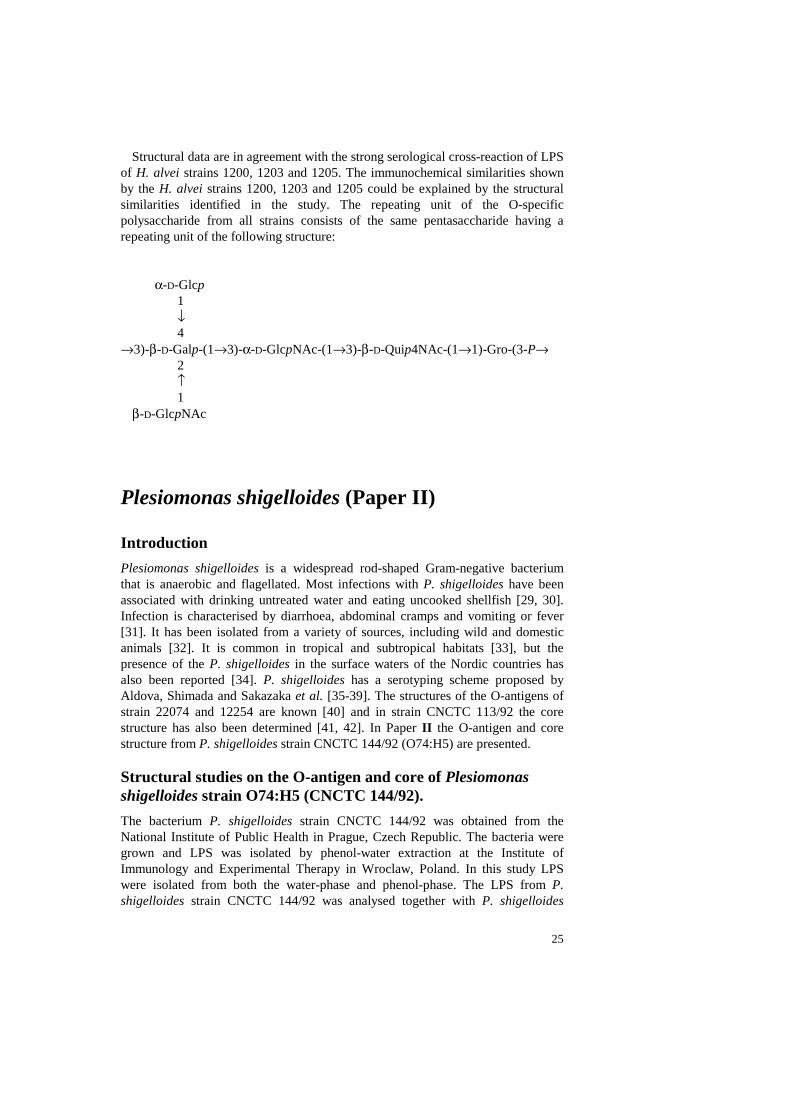
25
Structural data are in agreement with the strong serological cross-reaction of LPS of H. alvei strains 1200, 1203 and 1205. The immunochemical similarities shown by the H. alvei strains 1200, 1203 and 1205 could be explained by the structural similarities identified in the study. The repeating unit of the O-specific polysaccharide from all strains consists of the same pentasaccharide having a repeating unit of the following structure: α-D-Glcp 1 ↓ 4 →3)-β-D-Galp-(1→3)-α-D-GlcpNAc-(1→3)-β-D-Quip4NAc-(1→1)-Gro-(3-P→ 2 ↑ 1 β-D-GlcpNAc
Plesiomonas shigelloides (Paper II)
Introduction
Plesiomonas shigelloides is a widespread rod-shaped Gram-negative bacterium that is anaerobic and flagellated. Most infections with P. shigelloides have been associated with drinking untreated water and eating uncooked shellfish [29, 30]. Infection is characterised by diarrhoea, abdominal cramps and vomiting or fever [31]. It has been isolated from a variety of sources, including wild and domestic animals [32]. It is common in tropical and subtropical habitats [33], but the presence of the P. shigelloides in the surface waters of the Nordic countries has also been reported [34]. P. shigelloides has a serotyping scheme proposed by Aldova, Shimada and Sakazaka et al. [35-39]. The structures of the O-antigens of strain 22074 and 12254 are known [40] and in strain CNCTC 113/92 the core structure has also been determined [41, 42]. In Paper II the O-antigen and core structure from P. shigelloides strain CNCTC 144/92 (O74:H5) are presented. Structural studies on the O-antigen and core of Plesiomonas shigelloides strain O74:H5 (CNCTC 144/92).
The bacterium P. shigelloides strain CNCTC 144/92 was obtained from the National Institute of Public Health in Prague, Czech Republic. The bacteria were grown and LPS was isolated by phenol-water extraction at the Institute of Immunology and Experimental Therapy in Wroclaw, Poland. In this study LPS were isolated from both the water-phase and phenol-phase. The LPS from P. shigelloides strain CNCTC 144/92 was analysed together with P. shigelloides

26
strains CNCTC 113/92 by SDS/PAGE and silver staining as a rough test for visualising similarities.
144
A B
113 144 113 Fig. 8. A. Silver-stained SDS/PAGE of LPS isolated from P. shigelloides strain 144/92 and 113/92. B. Immunoblots of LPS reacted with antiserum against P. shigelloides strain 113/92 serum.
In Fig. 8A the pattern of the ladderlike bands indicates high molecular weight components which is characteristic for smooth-type LPS. The different lines observed correspond to LPS fractions consisting of different numbers of oligosaccharide repeating units. The repeating unit of P. shigelloides strain 144/92 is smaller than that of strain 113/92 determined roughly from the narrower spacing of the bands in SDS/PAGE for P. shigelloides strain 144/92 (Fig. 8A). Another rough test in visualising similarities is the use of immunoblotting. There was no positive immunoblot showing antigen-antibody reaction between P. shigelloides strain 144/92 and antibodies raised against P. shigelloides strain 113/92 (Fig. 8B).

27
1.52.02.53.03.54.04.55.05.5 ppm
A'A BH2 B
B'
CRH'' RH'
rH'' rH'
RH'' RH'rH'' rH'
RH'' RH'rH'' rH'
rH'' rH'
OAc
NAcNAc'
NAc'
NAc'NAc
NAc
A
BC
A
I
II
III
Ia
Fig. 9. 1H-NMR spectra from obtained fractions from P. shigelloides strain 144/92. I) O-specific chain. Ia) O-deacetylated O-specific chain. II) Shorter O-specific chains. III) core and one repeating unit. The substituent R is designated r when present as a single repeating unit in the core.
The LPS was de-lipidated by mild acidic hydrolysis and the released O-antigen was separated by SEC. The obtained fractions were studied by MS and NMR spectroscopy. According to their similarity analysed by NMR, fractions were pooled into fraction I (Fig. 9 I and Ia), II (Fig. 9 II), III (Fig. 9 III) and IV.

28
The monosaccharide composition of fraction I, containing long chain O-antigens, was analysed by sugar analysis revealing the presence of Rha and FucNAc. Linkage analysis by methylation analysis showed that these sugars are 3-substituted. The absolute configuration of Rha was identified by the method of Gerwig et al. [12] as L-Rha. The assignments of 1H and 13C signals in the spin system for each sugar residue were performed using homo- (COSY, TOCSY, NOESY) and heteronuclear (HSQC-DEPT, HMBC) two-dimensional techniques. The HSQC-DEPT spectrum obtained for O-deacetylated O-antigen from P. shigelloides strain 144/92 indicates a repeating unit composed of a trisaccharide. Further data in the spectrum verify the presence of three deoxysugar residues and two amide groups. The assigned data on native PS and O-deacetylated (fraction I) are given in Table 2, where the sugar residues are designated from A to C according to decreasing chemical shifts of the anomeric proton. Additionally, one non-sugar substituent was denoted as R or r. The anomeric configurations of the residues were determined by coupling constants. 1JC1,H1 for α-FucpNAc (A) is 180 Hz, α-Rhap2OAc (B) 171 Hz and β-Quip3NHR (C) 160 Hz. Table 2. 1H and 13C NMR chemical shifts of the P. shigelloides strain CNCTC 144/92 O-specific PS. Spectra were obtained for D2O solution at 30 °C. Acetone (δH 2.225 ppm, δC 31.05 ppm) was used as internal reference. Primed residues represent native repeating units and non-primed are repeating units without the O-acetyl group.
Residue H-1 H-2 H-3 H-4 H-5 H-6 NAc/OAc CO C-1 C-2 C-3 C-4 C-5 C-6 A' →3)-α-D-FucpNAc- 5.54 4.30 3.70 3.80 3.89 1.27 2.13 96.2 48.7 77.7 71.6 67.9 16.2 23.2 175.0 A →3)-α-D-FucpNAc- 5.61 4.30 3.70 3.84 3.89 1.27 2.05 JC1,H1 of 180 Hz 95.8 48.7 77.7 71.7 67.9 16.2 23.0 174.6 B' →3)-α-L-Rhap-(1→ 4.92 5.09 4.04 3.53 3.83 1.23 2.14 99.8 72.5 78.9 71.5 69.9 17.6 21.1 173.7 B →3)-α-L-Rhap-(1→ 4.83 4.00 3.89 3.47 3.80 1.23 JC1,H1 of 171 Hz 102.0 71.0 78.9 71.5 69.9 17.6 C' →2)-β-D-Quip3NR- 4.81 3.56 3.98 3.22 3.521 1.22 105.0 74.2 57.1 73.6 73.7 17.7 C →2)-β-D-Quip3NR- 4.81 3. 62 3.98 3.27 3.52 1.30 JC1,H1 of 160 Hz 105.0 74.2 57.1 73.7 73.7 17.7 H'/ H'' CH3' CH3'' R'/R 2.42/2.71 1.46 1.35 175.3 71.7 78.9 45.5 179.7 18.6 23.1 The TOCSY spectrum obtained for O-deacetylated fraction I revealed information about the stereochemistry of the three sugar residues (Fig. 10).

29
5.0
5.0
4.5
4.5
4.0
4.0
3.5
3.5
3.0
3.0
1H (ppm)
1.6 1.6
1.4 1.4
1.2 1.2
1.0 1.0
0.8 0.8
1 H (
ppm
)
A'H6-H5
C'H6-H1 C'H6-H3 C'H6-H2 C'H6-H4
B'H6-H2 B'H6-H3 B'H6-H5 B'H6-H4
C'H6-H5
Fig. 10. Expanded TOCSY spectrum (mixing time 90 ms) of O-deacetylated P. shigelloides 144/92. Cross-peaks in the TOCSY spectrum was assigned with the help of the program SPARKY [43].
In the TOCSY spectrum the protons in residue B (Rhap), observed from the methyl group, give rise to only four out of five possible cross-peaks due to small scalar couplings between the anomeric H-1 and H-2 (Fig. 10, 11). In residue A (FucpNAc) the magnetic transfer dies out between H-4 and H-5. The unknown sugar residue C gives TOCSY signals from all protons in its spin system, which indicates a gluco-configuration. All protons are thus placed in at dihedral angles of approximately 180° i.e. axial-axial relation. There are also intra NOE correlations between H-1, H-3 and H-5 of residue C. Additional NOE data between H-2 and H-4 support the gluco-configuration of residue C determined as Quinovose (Quip). Further NMR data (HSQC-DEPT, COSY) confirmed an amide at C-3.
O
OH3C
RHN
HO
O
O
H3C
HO
O
OH
NH
H3C
O
CH3
O
O
O
O
CH3H
H
H
H
H
H
H
H
H
H
H
H
HH
H
AB
C
Fig. 11. The magnetisation transfer throughout each spin system in the repeating unit of P. shigelloides 144/92 obtained by TOCSY with a mixing time of 90 ms.
Elemental composition of the R group was determined by chemical degradation, NMR analysis and MS analysis. Methanolysis was carried out on polysaccharide and residue C was isolated by Bio-Gel P-2. The elemental composition of the methyl glycosides of residue C was determined by high resolution FAB-MS to be C14H25O7N2, which was supported by [M+H]+ ion at m/z 333.1655. In Fig. 12, the structure of R and the repeating unit is presented. The dashed lines in Fig. 12

30
represent NOE observed from hydroxyl and amide protons run in water/acetone-d6 (85:15) solution at -10°C. The assignment of hydroxyl and amide protons was performed for a complete assignment of the structure and the obtained data can be used in the event of conformational studies. The NOE data obtained for the R group was insufficient to determine the absolute configuration. The chemical shifts of the hydroxyl and amide protons are found in Table 3. Table 3. Observed intra- and inter-residue NOEs from OH- and NH-protons of the O-deacetylated O-specific polysaccharide from P. shigelloides strain CNCTC 144/92.
Residue Intra Inter
Atom δ (ppm) Atom δ (ppm) Residue Atom δ (ppm) A →3)-α-D-FucpNAc- (O4)H 5.76 H2 4.32 (N2)H 8.61 NAc 2.05 B →3)-α-L-Rhap-(1→ (O2)H 6.00 H2 4.04 (O4)H 6.20 H4 3.49 H5 3.81 CH3 1.24 C →2)-β-D-Quip3NR- (O4)H 6.39 CH3 1.29 (N3)H 8.73 H2 3.65 R (N1)H 8.29 H4 3.28 R (O3)H 6.69 CH3'' 1.35 (N1)H 8.29 CH3' 1.48 C (N3)H 8.73
HMBC together with HSQC-DEPT and NOESY spectra confirmed the R group in residue C as the γ-lactam 3-hydroxy-2,3-dimethyl-5-oxo-pyrrolidine-2-carboxylic acid. This substituent has been found before in the LPS of Pseudomonas fluorescens, Agrobacterium larrymoorei and Pseudomonas putida [44-46]. Other related substances previously found are 3-hydroxy-3-methyl-5-oxoproline and 2,4-dihydroxy-3,3,4-trimethyl-5-oxoproline isolated from Vibrio cholerae O:5 and Vibrio anguillarum V 123, respectively [47, 48]. The possible precursor of the unusual substituent could be an amino acid. For example glutamate is the precursor to the amino acid proline and could also be the origin of this uncommon substituent. The configuration of two stereocenters in the substituent have not yet been determined although NOE is observed between the CH'3 and CH''3 (not drawn in Fig. 12). Bonds to CH'3 and CH''3 which are linked to the R substituent are relatively flexible in the residue. The NOE coming from these groups are not sufficient to determine the stereochemical relationship between the CH3 groups. They can be placed in either cis or trans position according to these results. Additional NOE is observed between the CH'3 group and proton H-3, H-4 and H-5 of residue A.

31
O
OH3C
HN
HO
O
O
O
H3C
HO
O
OH
NH
H3C
O
CH3
O
O
NH
O
CH'3CH''3
HO
OH
H''
H'
H
H
H
H
H
H
H
H
H
H
H
H
HH
H
1
23
45
Α
B
R
C
Fig. 12. Structure of the repeating unit of P. shigelloides 144/92 with dashed lines representing NOE obtained by hydroxyl and amide protons.
By comparison of chemical shift values from NMR spectra obtained from O-deacetylated and native material it was concluded that one acetyl group is present in the repeating unit, positioned at O-2 of residue B, due to a proton shift of 1.09 ppm downfield. MALDI-TOF MS indicated that the repeating unit consists of different populations. Some protons and carbons in the residues are effected by the non-stoichiometrical acetylation which contributes to a different surrounding and therefore give rise to slightly (⏐∆δΗ⏐ 0.01-0.07 ppm and ⏐∆δΗ⏐ 0.1-0.3 ppm) diffuse signals in the NMR spectra. The ratio of the O-acetylated repeating units varied depending on the origin of the native polysaccharide (water-phase, 56% and phenol-phase, 84%). Structural studies of core fractions III and IV and 1D HR-MAS 1H-NMR of intact bacteria are discussed in Paper II.
From the obtained data, the following structure was established as the repeating unit of P. shigelloides 144/92: [→2)-β-D-Quip3NHR-(1→3)-α-L-Rhap2OAc-(1→3)-α-D-FucpNAc-(1→] where the R group is 3-hydroxy-2,3-dimethyl-5-oxo-pyrrolidine-2-carboxylic acid.
The major (~23%) isolated oligosaccharide consisted of one repeating unit
(squared region shown in the structure below) and the core oligosaccharide (non-squared region). This undecasaccharide, shows the biological repeating unit, the type and position of the linkage to the core.
α-D-GalpA
1↓6
L-α-D-Hepp β-D-Glcp1 1↓ ↓7 4
β-D-QuipNR(1→3)-α- -Rhap-(1→3)-β-D-FucpNAc-(1→4)-α-D-GalpA-(1→3)-L-α-D-Hepp-(1→3)-L-α-D-Hepp-(1→5)-Kdo2↑1
D-α-D-Hepp
*L

32
The presence of the terminal β-D-Quip3NR-(1→ instead of the →2)-D-
Quip3NR-(1→ residue in the repeating unit as well as the β-1,4-linkage between the →3)-β-D-FucpNAc-(1→ and the core, which has the anomeric configuration inverted (*), showed the structure of the biological repeating unit of the O-antigen. The core oligosaccharide was not substituted by phosphate and was composed of an octasaccharide.
Butyrivibrio fibrisolvens (Paper III and IV)
Introduction
Butyrivibrio fibrisolvens is an anaerobic bacterium commonly found in the gastrointestinal tracts of ruminant animals [49]. Most strains of B. fibrisolvens produce extracellular polysaccharides (EPS) when grown on a defined medium [49] and many of these polymers contain unusual monosaccharide constituents. Neutral and acidic components of some isolated extracellular polysaccharides have previously been reported [5, 49] as well as some more detailed structure analysis of some strains. For example studies on B. fibrisolvens strain X6C61 [50] have shown the unusual sugar L-iduronic acid, strain 10b [51] and 49 [52] include two 1-carboxyethyl substituted sugars in the repeating unit and strain CF3 [53] contains an L-altrose. All investigated strains have one thing in common; the repeating unit involves at least one 1-carboxyethyl sugar. As the structures of these extracellular polysaccharides may serve to clarify the mutual relation among the numerous strains of Butyrivibrio fibrisolvens, these studies continue. Structural studies on the extracellular polysaccharide produced by Butyrivibrio fibrisolvens strain I1 (Paper III)
Component, including absolute determination, and linkage analysis of native, carboxyl-reduced and hydrofluoric acid treated EPS from B. fibrisolvens strain I1 indicated the presence of a hexasaccharide repeating unit composed of one terminal L-rhamnose, one terminal 3-O-(1-carboxyethyl)-D-glucose (Fig. 13), one 4-substituted D-glucose, one 3-substituted D-galactose, one 3,4-substituted D-galactose and one 3,4-substituted L-altrose residue.

33
40 60 80 100 120 140 160 180 200 220 240 260 28 30 320
1000
2000
3000
4000
5000
6000
m/z
43 75
101
118
129162
205
222292
336
OAc
OMe
O
OMe
OAc
OMe
CH3
D2C
118D
OMe265
75222
205
162
-60-60
161-32
Abu
ndan
ce
161
129
Fig. 13. EI-MS mass spectrum, obtained after methylation analysis, showing fragments from the terminal 3-O-(1-carboxyethyl)-D-glucose.
Evidence of a hexasaccharide repeating unit was supported by equal proportions of six proton signals in the anomeric region in the 1H NMR spectrum obtained from isolated EPS from B. fibrisolvens strain I1. Signals of typical acetyl groups were observed. Treatment of the EPS with diluted ammonia yielded an deacetylated product, which gave less complex NMR spectra. In the 1H NMR spectrum signals from three methyl groups were observed and identified as one lactyl group, one deoxysugar and one pyruvic acid acetal. Homo- and heteronuclear 2D spectroscopy were used in order to assign the 1H and 13C NMR signals from the six spin-systems. The six residues were denominated A-F in order of decreasing δH of the anomeric signals δH (5.25, 5.10, 5.08, 4.70, 4.66 and 4.60 ppm). The assignments were made on the basis of coupling constants, chemical shifts from NMR spectra, the chemical analyses and with results from degraded EPS. The following residues were found:
A B C
→4)-β-L-Altp-(1→ α-L-Rhap-(1→ →3)-β-D-Galp (1→
D E F
→4)-β-D-Glcp-(1→ →4)-α-D-Galp-(1→ 3-O-[1-carboxyethyl]-β-D-Glcp-(1→
H-1 and H-2 of the sugar residues were determined by 2D COSY experiment. From the 2D TOCSY experiments, with different mixing time, the rhamnose (B) was identified by the couplings from its methyl group. Furthermore, two gluco-configurations were determined (D, F), two galacto-configurations; with correlation up to H-4 (C, E), and one spin system (A) with correlations to H-3. The absolute configuration of rhamnose and altrose was determined to have the L-
configuration and the rest of the sugars the D-configuration. The anomeric configuration of the L-altrose was determined as β-configuration, due to the axial position of the anomeric proton determined from 1JC,H of 165 Hz [54], the small

34
3JH1,H2 of < 2 Hz and the NOE correlation between H-1 and proton H-5. The (S)-configuration at the acetal carbon in the pyruvic acid acetal was indicated by the carbon chemical shift of the methyl group at δC 25.9, which in a normal 4,6- substituted glucose is placed at an equatorial position [55, 56].
The EPS obtained by B. fibrisolvens strain I1 contained phosphorus detected both chemically [16] and with 31P NMR. The chemical analysis showed that the EPS contained approximately 3% of phosphorus per each repeating unit. The 31P NMR spectrum of the EPS showed a single resonance at δP 1.77 ppm. Dephosphorylation of EPS with aqueous HF (48%), followed by gel permeation chromatography yielded a polysaccharide. No degradation into oligosaccharides after this treatment were observed showing that the observed phosphodiester linkage could not be included in the main backbone chain of the repeating unit, hereby determined to be placed as a branch of the repeating unit.
The terminal 3-O-(1-carboxyethyl)-D-glucose residue F showed a three-bond correlation from the anomeric proton over the glycosidic linkage to C-3 of the 3,4- substituted altrose (A). Inter-residue NOE between H-1 in residue F and H-2 and H-3 in residue A established the following element in the sequence; F A
-[1-carboxyethyl]-β-D-Glcp-(1→3)-β-L-Altp-(1→
The altrose residue A showed a three-bond correlation from the anomeric proton
over the glycosidic linkage to C-4 of the 4-substituted galactose residue D and from C-1 to H-4 of the same residues. Inter residue NOE between H-1 in residue A and H-4 and H-3 in residue D further established following element in the sequence:
A D
→4)-β-L-Altp-(1→4)-β-D-Galp-(1→ 3 ↓ F 1
3-O-[-1-carboxyethyl]-β-D-Glcp
After HF-hydrolysis the already overlapping anomeric signals of B and C as well as D and E were even more overlapped in the proton dimension (Fig. 14B). Due to these overlaps it was difficult to distinguish them from each other making the interpretation of the HMBC and NOE signals uncertain.

35
4.4 4.2 4.0 3.8 3.6 3.4 3.2
ω2 - 1H (ppm)
85
80
75
70
65
60
ω1
- 13
C (
ppm
)
BC2-H2
CC2-H2
FC2-H2
AC2-H2
BC4-H4CC5-H5
LactylC2-H2
AC3-H3 DC2-H2
BC5-H5
DC3-H3
DC4-H4
FC3-H3
EC4-H4
EC3-H3
DC5-H5
EC2-H2
FC5-H5
FC4-H4
AC4-H4
CC3-H3
BC3-H3
AC5-H5CC4-H4EC5-H5
A B
5.4
5.4
5.2
5.2
5.0
5.0
4.8
4.8
4.6
4.6
ω2 - 1H (ppm)
106 106
104 104
102 102
100 100
98 98
96 96
ω1
- 13
C (
ppm
)
AC1-H1
BC1-H1
CC1-H1
DC1-H1
EC1-H1
FC1-H1
Fig. 14. Expanded HSQC-DEPT spectra of the ring proton region (A) and the anomeric region (B) of deacetylated and HF-treated EPS from B. fibrisolvens strain I1. Experiments were preformed at 70ºC and pD 7. Cross-peaks in the HSQC-DEPT spectrum were assigned with the help of the software SPARKY.
Smith degradation was used to simplify the elucidation of the repeating unit by selective removal of some of the residues. This method was applied on deacetylated EPS. In the suggested repeating unit in Fig. 15, residues B and D are the only monosaccharides with vicinal hydroxyl groups that would be expected to be degraded by the Smith degradation.
The suggested repeating unit in Fig. 15 was in good agreement with the expected
products from Smith degradation. The intact sugar monomers obtained after the Smith degradation were 3,4-substituted L-altrose (A), 3- and 3,4-substituted D-galactose (C, E) and terminal 3-O-(1-carboxyethyl)-D-glucose (F).

36
O
HO
O
OH
OH
O O
OH
OO
HOOH
CH2OH
O
OOH
CH2OH
H
COOHCH3
O
O
HO
OH
CH2OH
OH3C
HO
O
HO
HO DDD
D
OO
O
O
OH
OH
OO
OH
O
O
HOOH
CH2OH
O
OOH
CH2OH
H
COOHCH3
O
O
HO
OH
CH2OH
OH3C
HO
O
HO
HO
OO
O
HO
OH
OH
OO
OH
O
HO
CH2OH
O
OOH
CH2OH
H
COOHCH3
O
HOOH
CH2OH
O
HO
HO D
OHO
Oxidation followed by reduction
Hydrolysis
HO
OH
A
F
C
B D
E
OH
Fig. 15. Smith degradation of deacetylated EPS from B. fibrisolvens strain I1.
The terminal L-rhamnose (B) was cleaved off and 4-substituted D-glucose (D) was degraded to erythritol and the PS was as a result degraded into a pentasaccharide. The pentasaccharide was isolated on Bio-Gel P-2 column. 1D and 2D NMR were run on the isolate and the chemical shifts obtained from the HSQC-DEPT experiments are presented in Table 4. Table 4. Assignments for HSQC-DEPT spectra obtained of deacetylation, HF-treated and Smith degraded EPS from B. fibrisolvens strain I1.
Chemical shifts (ppm)
Sugar residue H-1 H-2 H-3 H-4a/H-4b H-5 H-6a/H-6b C-1 C-2 C-3 C-4 C-5 C-6
A →3,4)-β- L-Altp-(1→ 5.13 4.10 4.25 4.03 3.96 ~3.7/~3.9
99.0 69.1 78.4 71.9 74.7 62.0 C →4)-α-D-Galp-(1→ 5.06 3.89 3.97 4.20 4.21 ~3.76 /~3.88
101.2 70.1 70.9 79.4 71.9 62.0
D →2)-D-Erythritol 3.78 3.87 3.86 3.68/3.73
61.5 81.2 72.5 63.7 E β-D-Galp-(1→ 4.57 3.58 3.64 3.91 3.66 3.76 /3.76
105.5 72.7 74.2 70.0 76.2 62.1
F 3-O-[1-carboxyethyl]-β- D-Glcp-(1→
4.58 3.36 3.41 3.52 3.43 ~3.72/~3.83
102.5 73.4 85.5 70.8 77.1 62.0
1-carboxyethyl - 4.33 1.41
-a 79.2 19.7
a Not determined due to small amounts.

37
The isolated pentasaccharide obtained from the Smith degraded EPS was
analysed by MALDI-TOF mass spectrometry (Fig. 16). A peak at m/z 866.2 for [M+Na]+ supported the suggested structure of the pentasaccharide unit.
m/z800 1200
Inte
nsity
40
0
866.
26 O
HO
OH
OH
O O
OH
O
HO
CH2OH
O
OOH
CH2OH
H
COOHCH3
O
HOOH
CH2OH
O
HO
HO D
OHO
OH
C31H53DO26Exact Mass: 843,30O
HO
OH
OH
O O
OH
O
HO
CH2OH
O
OOH
CH2OH
H
COOHCH3
O
HOOH
CH2OH
O
HO
HO D
OHO
OH
C31H53DO26Exact Mass: 843,30
Fig. 16. MALDI-TOF mass spectrum of the pentasaccharide obtained from Smith degradation of EPS produced by B. fibrisolvens strain I1. MALDI-TOF MS was run in the positive ion mode using 2,5-dihydroxybenzoic acid (DHB) as matrix.
In the 2D HSQC-DEPT spectrum obtained from deacetylated native EPS from B. fibrisolvens strain I1, the number of C-H signals in the ring region was not in agreement with expected for a hexasaccharide repeating unit. Four extra positive signals and two extra pair of negative signals were present in the spectrum, denoted with H (in bold face, Fig. 17). In Fig. 17A the 2D HSQC-DEPT spectrum obtained from deacetylated EPS including the pyruvic acid acetal is shown. The spectrum in Fig. 17B is obtained after liberation of the pyruvic acid acetal under mild acidic conditions. After the removal of the pyruvic acid acetal the four intensive positive signals of residue H at δH/δC 3.93/73.0 (H-2), 3.98/71.1(H-3), 4.00/73.7 (H-4), 3.81/65.8 (H-5) and negative peak at 3.84/4.02/69.0 (H-6a/b) had shifted within the ring proton region to δH/δC 3.73/71.5 (H-2), 3.89/71.0 (H-3), 3.86/73.8 (H-4), 3.86/70.5 (H-5) and 3.64/3.73/63.4 (H-6a/b), respectively.

38
4.4 4.2 4.0 3.8 3.6 3.41H (ppm)
85
80
75
70
65
60
13C (ppm)
BC2-H2CC2-H2
FC2-H2
AC2-H2
BC4-H4
CC5-H5
LactylC2-H2
AC3-H3
DC2-H2
BC5-H5
DC3-H3
DC4-H4
FC3-H3
EC4-H4
EC3-H3
DC5-H5
EC2-H2
FC5-H5
FC4-H4
AC4-H4
CC3-H3
BC3-H3
AC5-H5CC4-H4
EC5-H5
EC6-H6ab
HC1-H1aHC1-H1b
HC6-H6aHC6-H6b
HC2-H2
HC3-H3
HC4-H4
HC5-H5
CC6-H6ab
DC6-H6ab
FC6-H6aFC6-H6b
AC6-H6aAC6-H6b
4.4 4.2 4.0 3.8 3.6 3.41H (ppm)
BC2-H2
CC2-H2
FC2-H2
AC2-H2
BC4-H4
CC5-H5
LactylC2-H2
AC3-H3
DC2-H2
BC5-H5
DC3-H3
DC4-H4
FC3-H3
EC4-H4
EC3-H3
DC5-H5
EC2-H2
FC5-H5
FC4-H4
AC4-H4
CC3-H3
BC3-H3
AC5-H5CC4-H4 EC5-H5
EC6-H6ab
HC1-H1aHC1-H1b
HC6-H6aHC6-H6b
HC2-H2
HC3-H3
HC4-H4
HC5-H5
CC6-H6ab
DC6-H6ab
FC6-H6aFC6-H6b
AC6-H6aAC6-H6bA B
Fig. 17. Expanded HSQC-DEPT spectra of B. fibrisolvens strain I1 run at 70ºC pD 7. (A) Deacetylated EPS including pyruvic acid acetal. (B) Deacetylated and mild hydrolysed EPS without the pyruvic acid acetal. Signals were assigned with the help of SPARKY. Signals related to the substituent H are marked in bold face.
In order to establish the structure of the substituent with the unidentified extra signals, deacetylated EPS was subjected to base under harsh condition. By the alkali treatment it is possible to hydrolyse phosphodiesters if an adjacent hydroxyl group is present. The hydroxyl group participate in the hydrolysis through a five membered cyclic phosphate intermediate, giving a mixture of monoesters. The obtained products after the base treatment were separated on Bio-Gel P-2, yielding one fraction containing EPS. No phosphates were detected in the isolated EPS as determined by 31P NMR. There were no signals present from the pyruvic acid nor from the residue H as determined by 1D and 2D NMR. The obtained alkali treated EPS was similar to that of HF-treated EPS with the exception of a slightly more degraded EPS in the latter case. A low molecular weight fraction obtained from the Bio-Gel P-2 separation was analysed by ESI-ITMS1 which showed predominantly sodiated molecules at m/z 275.2 and m/z 355.1. The calculated theoretical monoisotopic mass of one pyruvic acid acetal and one hexitol is 252.1 Da in good agreement with the suggested residue A in Fig. 18. The exact mass of 332.1 Da corresponds to this mass plus one additional phosphate group (residue B and C in Fig. 18). Hence the extra signals in the spectrum were identified as originating from a hexitol. The NMR chemical shifts from the isolated substituent determined by 2D COSY and HSQC-DEPT suggested a hexitol substituted with a pyruvic acid acetal. NMR data suggested the pyruvic acid to be linked either to O-1 and O-3 or to O-4 and O-6 of the hexitol.
In order to identify the hexitol in the EPS, two starting materials were used. A small amount of EPS and a small amount of the isolated substituent were dephosphorylated with 48% HF. After the removal of HF the sample was acetylated and run on GC-MS. The hexitol was determined to be glucitol by comparison of retention time and mass fragments with standards.

39
150 200 250 300 350 400 450 500
0
0.5
1
1.5
2
2.5
x 105
m/z
275.2
297.2355.1
Rel
ativ
e in
tens
ity (%
)
[A+Na] +
[C+Na] +[B+Na] +
H
C
OH
HHO
OH
OHH
C
H
OH
H
H O
H
CH3
O
OH
6
5
4
3
2
1
A
H
C
OH
HHO
OH
OHH
C
H
O
H
H O
H
OH
P OHO
CH3
O
OH
6
5
4
3
2
1
B
OH
OH
P OH
C
O
HHO
OH
OHH
C
H
OH
H
H O
H
CH3
O
OH
6
5
4
3
2
1
C
Fig. 18. Fragments obtained from ESI-ITMS1 experiments run in positive mode.
In the 13C-NMR spectrum, the signal obtained from C-1 (δC 67.1 ppm) of residue H was split due to spin-spin couplings of JC-P of 4.7 Hz. In a 1H-31P HSQC spectrum, a 31P correlation to proton H-1 (δH 4.00, 4.10 ppm) of residue H and to H-6 (δH 4.04 ppm) of residue E, suggesting the phosphate group to be positioned at O-1 of the glucitol (H) and to O-6 of 3,4-substituted β-D-Gal (E).
In order to determine the glucitol substitution at C-1 or C-6 a method for determination of the absolute configuration of chiral glycerol residues [57] was adapted. Pyruvic acid acetals were removed by mild hydrolysis of EPS before the obtained primary alcohol was oxidised. The product was then dialysed against water, lyophilised and HF (48%) treated. The obtained oxidised product was evaporated and acetylated and then analysed by GC-MS. The sample was compared to authentic samples obtained from D-glucurono-3,6-lactone and D-glucono-1,5-lactone. The D-glucurono-3,6-lactone was first base treated to open the lactone and then reduced with NaBH4. Both standards were treated with HF (48%) in order to obtain the same type of lactone configuration as the analyte, before acetylation and GC-MS analysis. The glucitol (H) in the repeating unit was substituted at O-1 to the phosphate group and at O-4 and O-6 to the pyruvic acid acetal, as show as residue B found in Fig. 18. The phosphodiester was also substituted to O-6 of residue E. Thus, the established structure of B. fibrisolvens strain I1 is as follows.
→4)-β-L-Altp-(1
α-D-Rhap
→4)-β-D-Galp (1 →4)-β-D-Glcp-(1→3)-α-D-Galp-(1
3-O -[1-carboxyethyl]-β-D-Glcp
→
1
3
→1
3
→
6
PD-Glc-ol-1-
COC HH3 2
6 4

40
The presence of an acidic component is not unusual in the extracellular
polysaccharides produced by B. fibrisolvens polysaccharides [49-53, 58, 59]. It is also common to find phosphodiesters connecting to an alditol in the bacterial polysaccharides [2], but the extracellular polysaccharide of B. fibrisolvens strain I1 was found to contain a glucitol, which is an unusually long alditol. This alditol has not been reported until now as a component of B. fibrisolvens and it is also rare in EPS from other bacterial species. The glucitol phosphate element has been found in the group-specific PS of group B Streptococcus [60]. The glucitol phosphate substituent of B. fibrisolvens strain I1 was additionally substituted with pyruvic acid making the structure even more unique. The pyruvic acid and the phosphate groups are well known components of other bacterial polysaccharides, but this combination has not, to our knowledge, been found before.
Structural studies on the extracellular polysaccharide produced by Butyrivibrio fibrisolvens strain 12 (Paper IV)
EPS from Butyrivibrio fibrisolvens strain 12 was enzyme treated and further purified on a DEAE-Sephadex A-50, using an aqueous NaCl gradient. The isolated ESP was viscous and gave broad lines in the NMR spectra even at 70°C (Fig. 19).
5.5 5.0 4.5 4.0 3.5 3.0 2.5 2.0 1.5 1.0 0.5 ppm
A
B
Fig. 19. 1H-NMR spectra of the EPS produced by Butyrivibrio fibrisolvens strain 12. (A) Enzyme treated EPS. (B) EPS isolated from DEAE-Sephadex A-50 column.
A butanoyl group was identified by 1D and 2D NMR experiment. In order to improve the quality of the NMR spectra, the polysaccharide was alkali treated removing O-acyl groups. After the alkali treatment the NMR spectra still showed broad lines. The polymers were partially hydrolysed yielding 1H- and 13C-NMR spectra of higher resolution showing six anomeric signals, which were designated A-F. Three substituents were designated with the letters x-z.
Sugar analysis showed that the extracellular polysaccharide from Butyrivibrio fibrisolvens strain 12 only contained D-galactose (A, C) and D-glucose (E, F) in the ratio of 1:1. In Table 5 data from linkage analysis obtained from native and

41
carboxyl-reduced polysaccharide from Butyrivibrio fibrisolvens strain 12 are presented. Table 5. The relative integrals from methylation analysis of (I) Deacylated and (II) carboxyl reduced EPS from Butyrivibrio fibrisolvens strain 12.
Sugar I II 2,3,6-tri-O-Me-galacitol 1 2 2,3,6-tri-O-Me-glucitol 1.3 0.6 2,3-di-O-Me-galacitol 0.6 0.4 6-O-(2-methoxy-1-methylethyl)-2,3-di-O-Me-hexitol - 1.1
As can be seen in Table 5 the methylation analysis of deacylated EPS (I)
revealed approximately one 4-substituted D-glucose (E), one 4-substituted D-galactose (A) and one 4,6-substituted D-galactose (C). After carboxyl reduction and methylation analysis (II) the presence of 4-substituted-6-O-(1-carboxyethyl)-D-galactose (D) and one additional 4-substituted D-galactose (B) were observed. The increased proportion of the 4-substituted D-galactose indicated one galacturonic acid in the parent polymer.
In the 1H-NMR spectrum six anomeric signals were present in the anomeric region. The six residues were denominated with the respect of decreasing anomeric δH i.e. δH/δC 5.44/100.6 (A), 5.08/100.3 (B), 5.01/101.1 (C), 4.96/101.2 (D), 4.60/104.3 (E) and 4.51/103.3 (F). The structure was established on the basis of coupling constants, chemical shifts from 1D and 2D NMR experiments, chemical analyses and with results from degraded EPS. The assigned NMR chemical shifts on deacylated and partially hydrolysed polysaccharide produced by Butyrivibrio fibrisolvens strain 12 are presented in Paper IV. The chemical shifts were obtained from an HSQC-DEPT spectrum shown in expanded version in Fig. 21A.
Signals of glutamic acid (z) were identified by NMR chemical shifts [61, 62] and verified by TLC analysis of isolated glutamic acid. Since glutamic acid was not released by alkali treatment this indicated that the glutamic acid was amide bound. The sequence of the sugar residues in the repeating unit was determined by HMBC and NOESY experiments. Through-bond heteronuclear connectivities from HMBC spectrum and inter-residue NOE connectivities from the NOESY spectrum made it possible to identify all six glycosidic linkages.
In the spectrum obtained from the HSQC-DEPT experiment, the number of C-H signals in the ring region was, like in Butyrivibrio fibrisolvens strain I1, not in agreement with expected for a hexasaccharide repeating unit. There was additionally one strong positive signal at δH/C 4.41/72.0 and one pair of negative signals at δH,H/C 4.21, 4.08/68.1. These extra proton signals showed COSY and TOCSY correlations to each other but not to any other protons. In the HMBC spectrum there were correlations from all these signals to one carbonyl group with the δC 173.4 ppm. This substituent was found to be a glyceric acid designated as residue x.

42
31P NMR spectrum of the B. fibrisolvens strain 12 showed a single resonance at δP 1.16 ppm. To identify and to localise the phosphate group a 2D 1H-31P HSQC experiment was run and in the obtained spectrum (Fig. 20) correlations from 31P to δH 4.41 (H-2), 4.21 (H-3b) and 4.08 (H-3a) of residue x and 3.94 (H-4) of residue F were observed. These data suggested that the phosphate group was linked to O-3 of the glyceric acid and to O-4 of residue F.
4.4
4.4
4.3
4.3
4.2
4.2
4.1
4.1
4.0
4.0
3.9
3.9
1H (ppm)
3 3
2 2
1 1
0 0
-1 -1
-2 -2
31P
(ppm
)
P1-xH2 P1-xH3b P1-xH3a P1-FH4
Fig. 20. 1H-31P HSQC spectrum of deacylated and partially hydrolysed EPS from Butyrivibrio fibrisolvens strain 12 obtained at 30°C and pD 5.4 using 85% H3PO4 as external reference. Cross-peaks in 1H-31P HSQC spectrum were assigned with help of the SPARKY program.
In order to isolate the substituent from the PS dephosphorylation of the EPS was performed by aqueous 48% HF, followed by SEC. PS and the substituent composed of glyceric acid, phosphate and glutamic acid were isolated. High resolution FAB-MS was used for the elemental analysis of the substituent. The obtained mass spectrum showed one dominating protonated molecular ion [M+H]+ at m/z 236.0701 which is in agreement with the expected mass of the substituent without the phosphate.
In Fig. 21 HSQC-DEPT spectra obtained before and after the HF-treatment of the deacylated and partially hydrolysed polymer are presented. In the HSQC-DEPT spectrum four additional positive minor peaks were observed at δH/δC 3.34/74.2, 3.50/76.4, 3.40/70.5 and 3.47/76.7. These signals were from the same spin system and were denoted with the letter f (Fig. 21). Residue f was identified as a terminal glucose.

43
4.5 4.0 3.51H (ppm)
80
75
70
65
60
55
13C (ppm)
EC2-H2
FC2-H2
FC3-H3
AC4-H4
BC4-H4
BC5-H5
CC4-H4
DC4-H4
yC2-H2
CC5-H5
FC4-H4
AC5-H5
EC3-H3EC4-H4
EC5-H5FC5-H5
DC5-H5 AC2-H2BC2-H2
CC2-H2DC2-H2
AC3-H3
BC3-H3
CC3-H3
DC3-H3
AC6-H6aAC6-H6b
CC6-H6b CC6-H6a DC6-H6ab
FC6-H6aFC6-H6b
xC2-H2
xC3-H3bxC3-H3a
EC6-H6aEC6-H6b
zC2-H2
fC2-H2
fC3-H3
fC4-H4
fC5-H5
4.5 4.0 3.51H (ppm)
80
75
70
65
60
55
13 C (ppm)
EC2-H2
AC4-H4
BC4-H4
BC5-H5
CC4-H4
DC4-H4
yC2-H2
CC5-H5
AC5-H5
EC3-H3EC4-H4
EC5-H5
DC5-H5
AC2-H2BC2-H2
CC2-H2DC2-H2
AC3-H3
BC3-H3
CC3-H3
DC3-H3
AC6-H6aAC6-H6b
CC6-H6b CC6-H6a DC6-H6ab
FC6-H6aFC6-H6b
EC6-H6aEC6-H6b
fC2-H2
fC3-H3
fC4-H4
fC5-H5
A B
Fig. 21. Expanded HSQC-DEPT spectra of B. fibrisolvens strain 12 run at 70ºC and pD 7. (A) Deacylated and partially hydrolysed EPS. (B) Deacylated, partially hydrolysed and HF-treated EPS. Signals were assigned with the help of SPARKY. Signals related to the substituent are marked in bold face. Signals from terminal glucose are marked in italic or bold italic.
After HF treatment all the signals obtained from residue F were shifted and signals obtained from residue f hade increased suggesting the removal of the substituent. The structure of the deacylated repeating unit of EPS produced by Butyrivibrio fibrisolvens strain 12 was determined to be as shown in Fig. 22.
O
OH
O
O O
HO
OH
CH2OH
O
HOOH
O
O
OH
HO
CH2OH
O
D
A
F
O
O
HO
B
O
O
HOOH
O
H
CH3
OH
O
O
HOOH
O
C
E
COOH
HN
C
OH
O
OH
CH2OH
O
P
O
OH
O
OOH
y
x z
Fig. 22. The structure of deacylated repeating unit of EPS from Butyrivibrio fibrisolvens strain 12.

44
Though there are differences between the investigated structures of the polysaccharides made by B. fibrisolvens, all the studied strains [50-53], except for B. fibrisolvens strain I1, share a common trisaccharide epitope: →4)-6-O-[(R)-1-carboxyethyl]-α-D-Galp-(1→4)-α-D-Galp-(1→4)-β-D-Glcp-(1→
The Butyrivibrio fibrisolvens strain 12 does share this common epitope. The
structure component consisting of a glyceric acid linked to a glutamic acid and to a phosphate group is unique and has not to our knowledge been reported before in this combination as shown below. Glu-N-1-Glyceric acid-3-P-4)-β-D-Glcp
1
↓
6
[→4)-α-D-Galp-(1→4)-β-D-Glcp-(1→4)-α-D-GalpA-(1→4)-α-D-Galp-(1→
4)-6-O-[(R)-1-carboxyethyl]-α-D-Galp-(1→]
None of the previously studied EPS of B. fibrisolvens has contained phosphate
groups in their structures. The structure of EPS from B. fibrisolvens strain I1 and 12 do share this phosphate element, which differs them from the other studied strains of B. fibrisolvens. Thus, the extracellular polysaccharides studied have both common and unique elements and compositions in their structure.

45
Concluding remarks
In the structural studies, O-specific chains produced by Hafnia alvei strains 1200, 1203 and 1205 were determined to give the same O-deacetylated structure. The immunochemical similarities shown by H. alvei strains PCM 1202, 1203 and 1205 could be explained by the structural similarities. This work has also shown that a small structural difference between strains such as only differen O-acetylation pattern can divide strains into different serogroups.
In the studies of Plesiomonas shigelloides strain CNCTC 144/92 it was concluded that the O-specific chain is composed of a trisaccharide repeating unit with the following structure: [→2)-β-D-Quip3NHR-(1→3)-α-L-Rhap2OAc-(1→3)-α-D-FucpNAc-(1→] in which the R group was determined as 3-hydroxy-2,3-dimethyl-5-oxo-pyrrolidine-2-carboxylic acid. The structure of the core part of the LPS was determined to be composed of a non-phosphorylated octasaccharide. The complete structure of the LPS of Plesiomonas shigelloides strain 144/92 is hereby determined, except for the Lipid A part. Lipid A is integrated in the bacterial cell wall and it is responsible for the endotoxic properties of LPS. The elucidation of this part is therefore in progress in order to get the complete structure of the Plesiomonas shigelloides strain CNCTC 144/92 (serogroup O74:H5) LPS.
The EPS produced by B. fibrisolvens strains I1 and 12 were determined to have unique structural elements. The structures of EPS from B. fibrisolvens strain I1 and 12 do share a phosphate containing element, which differs them from the other studied strains of B. fibrisolvens. The substituent in the repeating unit from B. fibrisolvens strain I1 has a glucitol phosphate where the glucitol is 4,6-substituted to pyruvic acid acetal. The substituent in the repeating unit from B. fibrisolvens strain 12 has a glyceric acid phosphate where the glyceric acid is amidically linked to glutamic acid. Thus, the extracellular polysaccharides studied here have both common and unique elements in their structures among B. fibrisolvens strains.

46
References
1. Knirel, Y. A. and Kochetkov, N. K., Biochemistry (Moscow), 59 (1994) 1325-1383.
2. Lindberg, B., Adv. Carbohydr. Chem. Biochem., 48 (1990) 279-318. 3. Rietschel, E. T. and Brade, H., Sci. Am., 267 (1992) 54-61. 4. Rietschel, E. T., Brade, H., Holst, O., Brade, L., Müller-Loennies, S., Mamat,
U., Zähringer, U., Beckmann, F., Seydel, U., Brandenburg, K., Ulmer, A. J., Mattern, T., Heine, H., Schletter, J., Loppnow, H., Schönbeck, U., Flad, H. D., Hauschildt, S., Schade, U. F., Di Padova, F., Kusumoto, S. and Schumann, R. R., Curr. Top. Microbiol. Immunol., 216 (1996) 39-81.
5. Mannarelli, B. M., Stack, R. J., Lee, D. and Ericsson, L., Int. J. Syst. Bacteriol., 40 (1990) 370-378.
6. Aldova, E. and Shimada, T., Folia Microbiol., 45 (2000) 301-304. 7. Lugowski, C., Niedziela, T. and Jachymek, W., FEMS Immunol. Med.
Microbiol., 16 (1996) 31-38. 8. Westphal, O. and Jann, K., Meth. Carbohydr. Chem., 5 (1965) 83-89. 9. BeMiller, J. N., Adv. Carbohydr. Chem. Biochem., 22 (1967) 25-108. 10. Goldstein, I. J., Hay, G. W., Lewis, B. A. and Smith, F., Methods Carbohydr.
Chem., 5 (1965) 361-370. 11. Sawardeker, J. S., Sloneker, J. H. and Jeanes, A. R., Anal. Chem., 37 (1965)
1602-1604. 12. Gerwig, G. J., Kamerling, J. P. and Vliegenthart, J. F. G., Carbohydr. Res.,
62 (1978) 349-357. 13. Gerwig, G. J., Kamerling, J. P. and Vliegenthart, J. F. G., Carbohydr. Res.,
77 (1979) 1-7. 14. Jansson, P.-E., Kenne, L., Liedgren, H., Lindberg, B. and Lönngren, J.,
Chem. Commun. (Stockholm Univ.), 8 (1976) 1-75. 15. Taylor, R. L., Shively, J. E. and Conrad, H. E., Meth. Carbohydr. Chem., 7
(1976) 149-151. 16. Chen, B. S., Toribara, T. Y. and Warner, H., Anal. Chem., 28 (1956) 1756-
1758. 17. Dubois, M., Gilles, K. A., Hamilton, I., Rebers, P. A. and Smith, F., Anal.
Chem., 28 (1956) 350-356. 18. Jansson, P.-E., Kenne, L. and Schweda, E., J. Chem. Soc., Perkin Trans. 1,
(1987) 377-383. 19. Bock, K. and Pedersen, C., J. Chem. Soc., Perkin Trans. 2, (1974) 293-297. 20. Fitch, W. L., Detre, G., Holmes, C. P., Shoolery, J. N. and Keifer, P. A., J.
Org. Chem., 59 (1994) 21. Meiboom, S. and Gill, D., Rev. Sci. Instrum., 29 (1958) 688-691. 22. Ridell, J., Siitonen, A., Paulin, L., Mattila, L., Korkeala, H. and Albert, M. J.,
J. Clin. Microbiol., 32 (1994) 2335-2337. 23. Ratnam, S., Infect. Immun., 59 (1991) 4744-4744. 24. Eserstam, R., Rajaguru, T. P., Jansson, P.-E., Weintraub, A. and Albert, M.
J., Eur. J. Biochem., 269 (2002) 3289-3295. 25. Sakazaki, R., Methods Microbiol., 14 (1984) 165-186.

47
26. Sakazaki, R. and Tamura, K., The Genus Hafnia, In The Prokaryotes, A. Balows, H. G. Truper, M. Dowokin, H. Win and K. H. Schleifer, Eds., Springer-Verlag: New York, 1992, p. 2816-2821.
27. Katzenellenbogen, E., Romanowska, E., Kocharova, N. A., Knirel, Y. A., Shashkov, A. S. and Kochetkov, N. K., Carbohydr. Res., 231 (1992) 249-260.
28. Romanowska, A., Katzenellenbogen, E., Kulakowska, M., Gamian, A., Witkowska, D., Mulczyk, M. and Romanowska, E., FEMS Microbiol. Immun., 1 (1988) 151-155.
29. Levy, D. A., Bens, M. S., Craun, G. F., Calderon, R. L. and Herwaldt, B. L., MMWR Morb. Mortal. Wkly Rep., 47 (1998) 1-34.
30. Van Houten, R., Farberman, D., Norton, J., Ellison, J., Kiehlbauch, J., Morris, T. and Smith, P., Infect. Med., 15 (1998) 495-497.
31. Bravo, L., Monte, R., Ramirez, M., Garcia, B., Urbaskova, P. and Aldova, E., Cent. Eur. J. Public-Health, 6 (1998) 67-70.
32. Aldova, E., Bernardyova, I. and Lavickova, M., Vet. Med., 45 (2000) 267-271.
33. Farmer III, J. J., Arduino, M. J. and Hickman-Brenner, F. W., The Genera Aeromonas and Plesiomonas, In The Prokaryotes, A. Balows, H. G. Trüper, M. Dworkin, H. Wim and K. H. Schleifer, Eds., Springer-Verlag: New York, 1992, p. 3012-3043.
34. Krovacek, K., Eriksson, L. M., González-Rey, C., Rosinsky, J. and Ciznar, I., Comp. Immunol. Microbiol. Infect. Dis., 23 (2000) 45-51.
35. Shimada, T. and Sakazaki, R., Jpn. J. Med. Sci. Biol., 31 (1978) 135-142. 36. Aldova, E., Zentralbl. Bakteriol., 265 (1987) 253-262. 37. Aldova, E., Syst. Appl. Microbiol., 15 (1992) 70-75. 38. Aldova, E., Benackova, E., Shimada, T. and Danesova, D., Syst. Appl.
Microbiol., 15 (1992) 247-249. 39. Shimada, T., Arakawa, E., Itoh, K., Kosako, Y., Inoue, K., Zhengshi, Y. and
Aldova, E., Curr. Microbiol., 28 (1994) 351-354. 40. Linnerborg, M., Widmalm, G., Weintraub, A. and Albert, M. J., Eur. J.
Biochem., 231 (1995) 839-844. 41. Czaja, J., Jachymek, W., Niedziela, T., Lugowski, C., Aldova, E. and Kenne,
L., Eur. J. Biochem., 267 (2000) 1672-1679. 42. Niedziela, T., Lukasiewicz, J., Jachymek, W., Dzieciatkowska, M.,
Lugowski, C. and Kenne, L., J. Biol. Chem., 277 (2002) 11653-11663. 43. Goddard, T. D. and Kneller, D. G., SPARKY ver. 3, University of California,
San Francisco, 2001. 44. Naberezhnikh, G. A., Khomenko, V. A., Isakov, V. V., Elkin, Y. N.,
Solovjeva, T. F. and Ovodov, Y. S., Bioorg. Khim., 13 (1987) 1428-1429. 45. Zatonsky, G. V., Kocharova, N. A., Veremeychenko, S. P., Zdorovenko, E.
L., Shashkov, A. S., Zdorovenko, G. M. and Knirel, Y. A., Carbohydr. Res., 337 (2002) 2365-2370.
46. Molinaro, A., De Castro, C., Lanzetta, R., Parrilli, M., Raio, A. and Zoina, A., Carbohydr. Res., 338 (2003) 2721-2730.
47. Eguchi, H., Kaya, S. and Araki, Y., Carbohydr. Res., 231 (1992) 147-158. 48. Hermansson, K., Jansson, P.-E., Holme, T. and Gustavsson, B., Carbohydr.
Res., 248 (1993) 199-211.

48
49. Stack, R. J., Appl. Environ. Microbiol., 54 (1988) 878-883. 50. Andersson, M., Ratnayake, S., Kenne, L., Ericsson, L. and Stack, R. J.,
Carbohydr. Res., 246 (1993) 291-301. 51. Andersson, L., Cotta, M. A. and Kenne, L., Carbohydr. Res., 338 (2003)
1571-1579. 52. Ferreira, F., Andersson, M., Kenne, L., Cotta, M. A. and Stack, R. J.,
Carbohydr. Res., 278 (1995) 143-153. 53. Ferreira, F., Kenne, L., Cotta, M. A. and Stack, R. J., Carbohydr. Res., 301
(1997) 193-203. 54. Bock, K. and Pedersen, C., Acta Chem. Scand., B (1975) 258-264. 55. Garegg, P. J., Lindberg, B. and Kvarnström, I., Carbohydr. Res., 77 (1979)
71-78. 56. Garegg, P. J., Jansson, P.-E., Lindberg, B., Lindh, F., Lönngren, J. and
Kvarnström, I., Carbohydr. Res., 78 (1980) 127-132. 57. Rundlöf, T. and Widmalm, G., Anal. Biochem., 243 (1996) 228-233. 58. Stack, R. J., Plattner, R. D. and Cote, G. L., FEMS Microbiol. Lett., 51
(1988) 1-5. 59. Stack, R. J., Stein, T. M. and Plattner, R. D., Biochem. J., 256 (1988) 769-
773. 60. Pritchard, D. G., Gray, B. M. and Dillon, H. C., Arch. Biochem. Biophys.,
235 (1984) 385-392. 61. Nord, L. I., Vaag, P. and Duus, J. Ø. Anal. Chem., 76 (2004) 4790-4798. 62. Pretsch, E., Clerc, T., Seibl, J. and Simon, W., Tables of Spectral Data for
Structure Determination of Organic Compounds, 2 ed., Springer-Verlag: Berlin, 1989.

49
Acknowledgements
I would like to thank, My supervisor Professor Lennart Kenne for sharing his great knowledge of carbohydrate chemistry and for giving a nice and decent atmosphere at the department with his “down to earth” attitude and humour. Professor Czeslaw Lugowski and Dr Jolanta Lukasiewicz for inviting me to Poland and introducing me to the world of bacterial polysaccharides. My two “watching” subsupervisors at distance Dr Tomasz Niedziela and Dr Roland Stenutz for support. All the present and former people at the Department of Chemistry for all their help and for good times at lunch breaks, coffee breaks and more…. Lars, Rolf, Lena, Suresh, Cristian, Corine, Susanna, Elena, Ulrika, Johan, Anders, Anders, Lasse, Jörgen, Kersti, Anton, Bernt, Daniel, Anette, Ylva, Somer, Jan, Gerald, Lill, Pia, Birgit, Ann-Sofi, Gulaim, Gunnar, Per, Camelia, Cecilia, Vadim, Ingmar, Tomas, Joanna, Frank, Stig-Arne, Ianric, Nils, Erik, Tom, Sweneric and Leif My family and friends outside the lab for friendship, love, joy and support. Sandra, Lars, Alex, Toros, Johanon, Canan, Anne, Baba, Peter and Liz Finally this work was supported by the Swedish Research Council for Environment, Agricultural Sciences and Spatial Planning and by the Faculty of Natural Resources and Agricultural Sciences