Structural Performance of Light-Frame Roof … Performance of Light-Frame Roof Assemblies Il....
34
United States Department of Agriculture Forest Service Forest Products Laboratory Research Paper FPL-RP-499 Structural Performance of Light-Frame Roof Assemblies II. Conventional Truss Assemblies Ronald W. Wolfe Timothy LaBissoniere
Transcript of Structural Performance of Light-Frame Roof … Performance of Light-Frame Roof Assemblies Il....

United StatesDepartment ofAgriculture
Forest Service
ForestProductsLaboratory
ResearchPaperFPL-RP-499
Structural Performanceof Light-Frame RoofAssembliesII. Conventional Truss Assemblies
Ronald W. WolfeTimothy LaBissoniere

Abstract
This report is the second (Part II) of a three-partseries that covers results of a full-scale roof assemblyresearch program. In this study, three trussed roofassemblies were tested to create a database that wouldaid development and verification of three-dimensionalstructural roof assembly models. Trusses used in thesetests are representative of conventional truss fabricationpractice. These roof assembly tests are an extension ofa previous study reported in Part I. In that study, thetrusses were designed to represent an extreme conditionin terms of truss stiffness variation within a single roofand a bias toward failure in wood members rather thanin connections.
Results reported in Part II provide information toanyone planning tests of roof assemblies and to thoseinterested in modeling roof assembly performance.Superposition tests are shown to provide a low-risk,accurate method of evaluating assembly response touniform loads within the elastic range.
Although these tests of conventionally designed roofassemblies displayed less load sharing, they did indi-cate about the same degree of average truss stiffnessincrease as a result of composite action between thetrusses and the sheathing. For assemblies tested in thisstudy, results support the premise that a load-sharingincrease of 15 percent for bending members used in arepetitive member assembly is conservative.
Keywords: Roof assembly, redundant, truss, metal con-nector plate, vertical load, load distribution, deflection,load capacity
ContentsPage
Introduction . . . . . . . . . . . . . . . . . . 1
Background . . . . . . . . . . . . . . . . . 1
Objectives and Scope . . . . . . . . . . . . . 2
Research Methods . . . . . . . . . . . . . . . 2
M a t e r i a l s . . . . . . . . . . . . . . . . . 2
Individual Truss and Assembly Design . . . . . 2
Test Facility . . . . . . . . . . . . . . . . 4
Loading System . . . . . . . . . . . . . . 6
Data Acquisition . . . . . . . . . . . . . 6
Test Procedure . . . . . . . . . . . . . . . 7
Individual Trusses . . . . . . . . . . . . . 7
Roof Assembly Stiffness Tests . . . . . . . 8
Full Assembly Loaded to Failure . . . . . 8
Results . . . . . . . . . . . . . . . . . . 8
Individual Trusses . . . . . . . . . . . . . 9
Truss Inspection . . . . . . . . . . . . . 9
Truss Tests . . . . . . . . . . . . . . . 9
Assembly Load Distribution . . . . . . . . 11
Individual Truss Load . . . . . . . . . . 11
Assembly Loads . . . . . . . . . . . . 11
Assembly Strength . . . . . . . . . . . 11
Analysis of Results . . . . . . . . . . . . . . 15
April 1991
Wolfe, Ronald W.; LaBissoniere, Timothy. 1991. Struc-tural performance of light-frame roof assemblies-II. Con-ventional truss assemblies. Res. Pap. FPL-RP-499.Madison. WI: U.S. Department of Agriculture, ForestService, Forest Products Laboratory. 32 p.
A limited number of free copies of this publicationare available to the public from the Forest ProductsLaboratory, One Gifford Pinchot Drive, Madison, WI53705-2398. Laboratory publications are sent to more than1,000 libraries in the United States and elsewhere.
The Forest Products Laboratory is maintained in coopera-tion with the University of Wisconsin.
Truss Stiffness . . . . . . . . . . . . . . 15
Assembly Effects . . . . . . . . . . . . . 15
Composite Action . . . . . . . . . . . . 17
Load Sharing . . . . . . . . . . . . . . 17
Distribution of Loads Within an Assembly. . . 19
Failure Modes and Sequence . . . . . . . 20
Conclusions . . . . . . . . . . . . . . . . . 20
Acknowledgments . . . . . . . . . . . . . . . 21
21
22
24
24
25
27
32
Literature Cited . . . . . . . . . . . .
Appendix A-Material Properties . . . . .
Appendix B-Load-Distributing Elements . . . .
Bearing Plates . . . . . . . . . . . .
Plywood Sheathing . . . . . . . . . .
Appendix C-Connections . . . . . . . .
Appendix D-Load-Sharing Evaluation . . . . .

Structural Performance ofLight-Frame Roof AssembliesIl. Conventional Truss Assemblies
Ronald W. Wolfe, Research General EngineerTimothy LaBissoniere. General Engineer
Forest Products Laboratory, Madison, Wisconsin
Introduction
The design methodology used for conventional light-frame roof assemblies has evolved over 150 years, blend-ing art and science. Prior to the 1950s, the mastercraftworkers made most decisions about form and func-tion on the basis of experience. This process, whileslow to accept innovation, provided a history of reli-able performance. In the 1950s, scientific developmentsin adhesives and mechanical connections began to havea significant effect on the design and construction oflight-frame roof assesmblies in the form of exteriorgrade panel products and metal plate connected woodtrusses. However, market demands limited their appli-cation to repetitive member assemblies that were simi-lar to the dimension lumber rafter and board sheathingsystems they replaced.
Trussed roof assembly design methodology has changedlittle over the past 30 years. Each truss is designed tocarry full tributary area load. The 15-percent load-sharing increase to the bending stress for repetitivemember use has less influence on the allowable loadon a truss than it does on a lumber rafter. Benefitsof diaphragm action of the sheathing are treatedas inherent and unquantified regardless of the typeof framing used. Light-frame roof assemblies arestill treated as a collection of independent structuralelements.
To provide a method to quantify the beneficial effectsof assembly interactions, analytical models are neededto show how assembly interactions affect assemblyload capacity. This study is part of a roof assemblyresearch program designed to provide the tools neededto evaluate assembly sensitivity to various design andconstruction variables. Results will be used to developand evaluate three-dimensional structural roof assemblymodels.
Background
This report is the second (Part II) of a three-part seriesthat covers results of a full-scale roof assembly researchprogram. Part I reported tests of individual trussesand full-scale roof assemblies. In these tests, trusseswere fabricated using 16-gauge steel metal connectorplates (MCPs) placed at critical locations where 20-gauge would normally be used and lumber that hadbeen sorted into three distinct stiffness categories.The purpose of that study was to force failure tooccur predominately in the wood members and toprovide a slightly exaggerated representation of howrelative truss stiffness affects load distribution withinan assembly. The third report (Part III) will evaluatethe performance of rafter roof assemblies.
The Part I report (Wolfe and McCarthy 1989) providesa survey of available literature on the structural perfor-mance of light-frame roof assembly and looks at the po-tential advantages of assembly interactions. The litera-ture review indicates that data on the structural perfor-mance of roof assemblies are limited from the viewpointof those interested in model development. Previous as-sembly tests have given little quantitative informationon the load-sharing characteristics of redundant assem-blies. The roof assembly tests described in the Part Ireport, although representing an extreme case for trussstiffness variability, indicate that load sharing couldbenefit the most limber truss, reducing its tributaryarea load by as much as 30 to 40 percent. The actualbenefit would depend on the correlation between trussstiffness and strength and assembly load distributionpatterns. Based on observations from limited tests andhistorical performance of light-frame repetitive memberroof assemblies, analytical models supporting the ac-knowledgment of assembly performance could have asignificant impact on reducing the cost/benefit ratio forthese assemblies.

Objectives and Scope
The roof assembly tests described in this report (PartII) were conducted to provide a basis for the develop-ment and verification of three-dimensional structuralroof assembly models. Tests were conducted on indi-vidual trusses and full-scale roof assemblies. Resultswere evaluated to assess assembly interaction effects ofindividual truss stiffness and strength.
Truss configurations selected were two Fink and onescissors (Fig. 1). The two Fink configurations wereselected to provide some direct comparisons with thetests reported in Part I. The scissors configuration wasselected to evaluate the ability of models to accuratelyrepresent the importance of horizontal restraint at thetruss reactions.
Research Methods
Tests to evaluate roof assembly performance includedtests of material properties, truss stiffness and strength,and full assembly load response. Material propertytests included bending stiffness of the lumber andplywood sheathing and moisture content and specificgravity of the lumber. Lateral nail tests were alsoconducted to evaluate the plywood sheathing to trussconnection and the performance of the MCPs. Testsincluded measurement of the load-deflection responseoutside and inside the assembly and the load capacityof individual trusses tested outside the assembly. Aseries of full assembly tests under vertically appliedloads were conducted in a three-dimensional testframe. All vertical reactions, some horizontal reactions,vertical deflections, joint deformations, sheathing-chordslip, and horizontal displacements at the reactions weremeasured and recorded by a computer.
The effects of assembly interactions were evaluated bycomparing the truss performance under the boundaryconditions imposed by the constructed full assembly tothose measured when the trusses were tested individ-ually. The small number of individual trusses testedmade it unfeasible to directly evaluate full assembly ef-fects on truss load capacity in this manner. However,by comparing load capacity of trusses tested in the fullassembly to those tested outside and by noting howloads are distributed in the full assembly, it is possibleto assess how an individual truss can affect the loadcapacity of the full assembly.
2
Materials
Raw materials for this study included lumber, MCPs,plywood sheathing, nails, and metal wind clips. Twohundred twenty-eight pieces of 2 by 4 No. 2 DenseSouthern Pine lumber were purchased from a local re-tailer. Although all the lumber was not grade stamped,it did appear to meet all the visual requirements ofthe grade. The MCPs, provided by the truss fabri-cator, were 20-gauge (0.36-in.-thick) galvanized steelwith a tooth length of 5/16 in. and a tooth density of9.1/in2. Forty-two 4- by 8-ft sheets of 15/32-in. three-ply Southern Pine plywood were supplied by industrycooperators, along with individual sheet stiffness val-ues determined according to ASTM D 3043 MethodC (ASTM 1981b). Plywood sheets, graded CD expo-sure 1, had an average bending stiffness of 1.8 × 10⁵ lbfin2/ft, with a coefficient of variation (COV) of 12 per-cent. Nails 2 in. long with a 0.113-in. diameter wereused to fasten the sheathing to the trusses and wereclassified 6d common. The wind clips used to hold thetrusses in place on the bearing plate were 20-gauge gal-vanized steel, such as those commonly found in com-mercial light-frame construction.
Prior to truss fabrication, each piece of lumber wasmarked with an identification (ID). Its modulusof elasticity (MOE) was also determined using anE-computer, an analytical device that determines MOEas a function of the natural frequency of vibration.Every tenth piece of lumber was also tested using acenter-point load on a simple span as a static check onthe vibration value.
Individual Truss and Assembly Design
Truss configurations used in this study were two Fink,one with a top-chord pitch of 6:12 and one with 3:12,and one scissors (Fig. 1). Differences between the Finkconfigurations in this study and those in the Part Ireport (Wolfe and McCarthy 1989) were the lumber,connections, and the lack of a top-chord splice. InPart I, (1) the lumber was selected to represent a wideMOE range for No. 2 Southern Pine, (2) 16-gaugeMCPs were used on critical joints to counteract thebias in favor of short-term-test steel failure, and (3)a splice joint in the top-chord panel adjacent to thepeak played a major role in the failure of the 6:12 roofassembly.
All trusses were designed with a span of 28 ft and aspacing of 2 ft on center, using No. 2 Dense SouthernPine lumber. In each case, the Truss Plate Institute(TPI) design specification was used to derive a designload given the lumber and truss configuration (TPI1985). The normal residential roof is designed for abottom-chord dead load of 10 lb/ft2 for the 3:12 Fink

Figure 1—Three truss configurations tested in this study: (a) 3:12 Fink; (b) 6:12 Fink; (c)6/3:12 scissors. All trusses designed to span 28 ft using No. 2 Dense Southern Pine and20-gauge metal connector plates. (ML90 5404)
3

configuration and 8 lb/ft2 for the 6:12 Fink and scis-sors configurations. Our tests were designed for loadto be applied only to the top chord with an equipmentdead load of about 7 lb/ft2. We asked the fabricatorto reevaluate the truss design loads with dead loads of7 lb/ft2 on the top chord and 1 lb/ft2 on the bottomchord. Thus, the design loads for this case were 31,38, and 38 lb/ft2 for the 3:12, 6:12, and scissors con-figurations, respectively. In each case, the most highlystressed members were in the top chord adjacent to theheel connection. For the 31-lb/ft2 design load, stresson these members ranged from 0.8 to 0.9 times the al-lowable stress. Stress was evaluated on the basis of thecombined stress index (CSI) described in the NationalDesign Specification (NFPA 1988). For the 38-lb/ft2
design loads, the CSI values ranged from 0.76 (6:12Fink) to 0.78 (3:12 Fink and scissors).
Assuming a linear relationship between load andCSI and that truss capacity is controlled by woodmember strength rather than connector strength, wemodified the manufacturer’s designated design load byextrapolating to a CSI of 1.0. This permitted directcomparison of truss performance in this study with thatgiven in the Part I report (Wolfe and McCarthy 1989).Thus, throughout this report, DSN is used to refer tothe top-chord load at critical CSI of 1.0 and indicatesloads of 80 lb/lin ft (3:12), 100 lb/in ft (6:12), and98 lb/lin ft (scissors).
Each roof assembly included eight trusses, 15/32-in.plywood sheathing, and a gable end. For each roofassembly, 12 trusses were individually tested in theorder they were taken off the pile as shipped fromthe truss plant. Four of the 12 trusses were tested tofailure; the remaining 8 were tested for stiffness onlyand were then fastened using 20-gauge wind clipsat 24-in. intervals along the bearing plate (Fig. 2).Trusses were held in position using 2 by 4 cross bracingwhile the sheathing was nailed in place. For each roofassembly, sheathing was applied so that full sheets wereadjacent to the peak and partial sheets were fastenedto the eaves. Sheathing patterns and the correspondingmeasured bending stiffness of each sheet are given inAppendix A. The gable end for each roof was madeusing one of the failed trusses sheathed with plywood.The gable end used for the 6:12 Fink roof was also usedfor the scissors roof.
For the three roof assemblies, only once did the relativestiffness of a truss influence its location in the assembly.Concern for possible lateral deformation of the scissorsassembly prompted us to use the stiffest scissors trusson the open end of the roof. The order in which indi-vidual trusses were placed in their respective assembliesis given in Appendix B.
4
Figure 2—Truss reaction detail showing metalwind clip used to fasten the truss to the LVLbearing plate. (ML89 5592)
Two sheathing nailing patterns were used to permitsome evaluation of nailing influence on assemblyperformance. The assemblies were first tested with6d common nails spaced 12 in. on center. Additionalnails were then added to reduce this spacing to 6 in.for a final series of stiffness tests and the test to failure.The 6:12 Fink assembly had the nails spaced 6 in. oncenter only at the edges of the plywood sheets duringits second set of stiffness tests and the test to failure.
Test Facility
A three-dimensional structural test facility (Fig. 3)(Boller 1972) was used for this study. The roof as-sembly test setup described in Part I (Wolfe and Mc-Carthy 1989) was modified slightly to accurately char-acterize individual truss as well as full assembly per-formance. Modifications were an improved individualtruss-bracing system, a stiffened reaction support wall,an addition of a gable end for each roof assembly, andadded data acquisition equipment to measure assemblyhorizontal reactions and connection displacements.
For the individual truss tests, a new bracing method(Fig. 4) was used to minimize interference betweenthe bracing and truss vertical deflection. Rather thanapplying lateral restraint directly to the truss chord, aplywood-stiffening element was fabricated to restrainchord deformation in the horizontal plane. The verticalloading rods were then held in place by running themthrough vertical sleeves fastened to the test frame.Restraint on the loading rods was transferred to the

Figure 3—Three-dimensional structural test facility containing a test roof assembly.(M87 00240-4)
Figure 4—Individual truss test bracing. Plywood board with attached 2 by 4 blocking was usedto confine the truss chord in a single plane, while the loading rods were held in alignment bypassing through a sleeved &ace attached to the test frame. (M86 0237-5).

top chord of the truss through the loading blocks,which had 16d nail points protruding 0.25 in. intothe top edge of the chord. By increasing the effectiveout-of-plane stiffness of the chord and placing lateralrestraints at 41-in. intervals along the chord, the Eulerbuckling load was conservatively estimated to be morethan 10,000 lb.
Reaction support walls were designed to evaluate theeffects of lateral restraint on roof stiffness. The trusseswere attached to bearing plates that were supportedvertically on load cells at each truss reaction location.Nineteen-foot-long pieces of laminated veneer lumber,cut to size and tested to determine MOE, were used forbearing plates. Bearing plate sections were 2 by 3 in.for the two Fink configurations and 2 by 4 in. for thescissors configuration. In the horizontal plane, thebearing plates (Fig. 3) were designed as pinned-endbeams with an 18-ft span. The middle truss reactionload cells were capable of measuring both vertical andhorizontal reaction forces; therefore, some tests wereconducted with a horizontal reaction at midspan of thebearing plate.
A steel C channel attached to the top of the loadcell at the middle truss reactions gave us the optionof allowing the bearing plate to move freely in thehorizontal plane or to be restrained. A wedge blockplaced between the bearing plate and the side of the Cchannel caused horizontal thrust reaction forces on thebearing plate to be transferred into the load cell.
Loading SystemThe loading mechanism and load-point locations overthe truss span were the same as those described inPart I (Wolfe and McCarthy 1989). In summary, loadswere applied at eight locations along the top chord ofeach truss through 20-in.-long load distribution blocks.Four loading rams with a 10-in. stroke and a 10,000-lbcapacity were used for each truss. The ram controlmanifold contained a control valve for every two rams,permitting roof load to be applied to half a truss spanat a time.
Data AcquisitionThe data acquisition system was expanded from thatdescribed in the Part I report (Wolfe and McCarthy1989) to include additional information on assemblyinteraction effects on truss stiffness and strength.For the individual truss tests, we included horizontalthrust measurements and joint deformations, adding5 channels to the individual truss data files. For theroof assembly tests, the expansion added 31 channels.Seven of these channels measured the peak deflectionson the interior trusses, four channels measured thesheathing-chord slip displacements, and 10 channels
6
measured joint displacements on two trusses. Fourreaction channels were added to measure horizontalthrust: two at the reactions of the fifth truss and twoon cables to measure bearing plate separation force.The support wall horizontal displacements, measuredusing dial gauges as reported in Part I, were measuredusing six potentiometers in this study.
Vertical deflections were measured using rotary linearresistance potentiometers (RLRPs) (resolution of±0.002 in.) attached to an overhead yoke. Lines usedto drive the potentiometer pulleys referenced pointsalong the centroidal axis of the top chord over thereactions, the top-chord node points, the peak, and atthe middle of two top-chord panels-adjacent to peakon north slope and adjacent to heel on south slope.For the full assembly tests, 0.5-in.-diameter holes weredrilled through the sheathing at these referenced pointsto permit access to the top chord.
Load cells measured vertical reactions and horizontalthrust. For the individual Fink truss tests, a 10,000-lbcapacity uniaxial load cell measured the north verticalreaction, and a triaxial load cell (5,000-lb capacityvertical, 2,000-lb capacity horizontal) measured thesouth end, measuring both vertical and horizontalreactions. Horizontal and vertical forces were measuredat both reaction points of the scissors trusses. For theassembly tests, the triaxial load cells were used onlyfor the fifth truss; however, cables attached to the wallbearing plates, in series with 1,000-lb capacity loadcells, also measured wall separation forces resultingfrom horizontal thrust. Other truss reactions in eachassembly were supported on uniaxial load cells. Inaddition to end reactions, each gable end had a thirdreaction support at midspan.
Sheathing-chord slip displacements were measured us-ing linear variable differential transducers (LVDTs)with a 0.1-in. working range and an accuracy of± 0.1 percent. The LVDTs were attached to the trusstop chord and reacted against a metal angle attachedto the sheathing. A total of 16 channels were dedicatedto sheathing-chord slip measurement, four channels pertruss for four alternate trusses.
Support wall displacements were measured to provideinformation on the truss boundary conditions. TheRLRPs, similar to those used for vertical deflectionmeasurements, were attached to the test frame andmeasured the movement of the bearing plate in the hor-izontal plane as the trusses were loaded. As reported inPart I, those measurements had been taken using a dialgauge that, for safety reasons, limited the readings tothe design load range of the assembly.
Deformations of the MCPs were measured for bothsingle truss and full assembly tests. For these

T r u s s h e e l
Sc issors t russ bot tom chord peak . ( Ind iv idua l t russ tes ts on ly )
Tens ion -web to bo t tom chord connec t ion
B o t t o m c h o r d s p l i c e
Figure 5—Truss joint displacement measurements taken for individual truss failure tests and twotrusses in each assembly. (ML90 5401)
measurements, RLRPs with a 2-in. range and anaccuracy of ±0.5 percent were attached to trusses asshown in Figure 5. They measured axial displacementat web-chord and bottom-chord splice connections,shear in heel connections, and rotation in the scissorsbottom peak web-to-cord connection. Measurementswere taken at (1) heel joints for all configurations,(2) tension-web to bottom-chord and bottom-chordsplice connections for the Fink configurations, and(3) bottom-chord peak connection for the scissorsconfiguration in both the individual truss and fullassembly tests. These measurements were taken forindividual trusses tested to failure and the fifth andeighth trusses from the west end in the full assemblytests.
Test Procedure
Tests were conducted in three phases. The first phaseevaluated individual truss performance. The secondphase tested the performance of each truss in the as-sembly loaded several ways. The third phase measuredthe stiffness and strength of the fully loaded assembly.
S c i s s o r s t r u s s t o p c h o r d p e a k . ( F u l l -sca le roof assembly tes ts on ly )
Individual TrussesThe purpose of the individual truss tests was to de-termine the stiffness of each truss and provide somebasis for judging the load capacity of each truss con-figuration. Of the 12 trusses fabricated for each config-uration, 4 were tested to failure and 8 were tested forstiffness in the individual truss loading setup.
As each truss was prepared for testing, it was given anID and was inspected for fabrication quality. A three-character ID was used to assist in the organization ofdata files. The first character differentiated individualtruss tests (T) from system truss tests (S). The secondcharacter designated the truss configuration (3 or 6 forFink and S for scissors). The third character was a testsequence identifier (1-9 and A-C). The truss inspectionconcentrated primarily on the quality of the joints.Characteristics surveyed included plate placement,embedment, joint gaps, and lumber defects in the areaof the connection.
Plate placement was evaluated on the basis of a trans-lational misalignment of the centroid of the plate withrespect to the center of the joint. These measure-
7

ments were taken at all heel and peak joints and at thetension-web to bottom-chord joints for the Fink trusses.Mislocations were measured in directions parallel-to-the-principle axes of an ideally placed plate using trans-parent templates. Plate rotations were not recordedunless they appeared to vary more than +5°.
Gap measurements focused primarily on heel andpeak joints. For the Fink trusses, readings were alsotaken at the compression-web to bottom-chord joints.All measurements were recorded as the average gapmeasured along the member thickness (1-1/2 in.) di-mension. At heel connections, readings were taken atpoints where the top and bottom surface of the bot-tom chord intersected the top chord. At peak con-nections, readings were taken only at the top becausethe bottom of the top chords was not accessible. Jointgaps and MCP misplacements are discussed further inAppendix C.
Individual trusses tested to determine relative stiffnesswere loaded to DSN. Loads up to DSN were applied inincrements of 0.25 × DSN and held for 1 min at eachload step to assure pressure equilibrium and a staticcondition prior to scanning the reaction and deflectionchannels. After testing, these trusses were used toconstruct the roof assemblies.
The individual trusses tested to failure were first loadedto DSN and then unloaded the same as the trussestested only for stiffness. They were then loaded asecond time, beginning with a ramp load to the designvalue. Loads were then increased in increments of0.25 × DSN up to 2.5 × DSN, and then the trusseswere continuously loaded to failure. Reactions anddeflections were scanned continuously during finalloading.
Roof Assembly Stiffness Tests
Before any loads were applied to the roof assembly, thereactions were adjusted to give a uniform distributionof the dead load. When the load cells were first placedunder the truss reactions, we found that the reactionforces ranged from 30 to 500 lb. By adjusting theheights of the reaction post in the center of each loadcell, we were able to narrow this range from 180 to220 lb. The difficulty of adjusting to a range of lessthan 40 lb did not appear to be worth the added effort.
Roof assembly stiffness tests were conducted in threeparts. First, each truss was loaded individually in theassembly to evaluate the influence of truss location andstiffness on load distribution. Second, sections of theroof were loaded to see how the assembly respondedto nonsymmetrical loads. Third, the full assembly wasloaded.
8
Tests of trusses loaded individually in the assemblywere conducted following the same procedure as thatused for trusses tested to DSN outside the assembly.As load was applied, reactions were measured for alltrusses in the assembly to characterize load influence ofeach truss assembly. To evaluate the effect of nail spac-ing, each truss was tested twice, once with sheathingnailed 12 in. on center and again with end nails spaced6 in. on center.
For each Fink assembly, the fifth truss was testedtwice to DSN to evaluate the effects of bearing platehorizontal restraint. For the initial 3:12 Fink assembly,a cable was used, attached to opposing bearing platesclose to the fifth truss, along with an attached loadcell to monitor horizontal thrust. After completing theseries of individual truss tests, this cable was removed,and the fifth truss was retested with the bearing plateallowed to move within the restraint imposed by thesheathing attachments. For the 6:12 Fink assembly,the bearing plates under the fifth truss were allowed tomove freely during the initial set of individual assemblytruss loadings. After these tests, the bearing plateswere constrained in the channel attached to the triaxialload cells, supporting the bearing plate under this trussto measure its horizontal reactions.
After each truss was tested, a uniform load was applied,first to half the roof and then to the entire roof. Duringthe full-span loading, the first eight trusses in theassembly were loaded. The gable end was not loadeddirectly. Each assembly loading sequence started at thedead load and increased in increments of 0.25 × DSNuntil the assembly reactions summed to DSN for theeight loaded trusses.
Full Assembly Loaded to FailureOnly the inner seven trusses were subject to directloading during the full assembly failure tests. Theloads were applied in increments of 0.25 × DSN, witha 1-min pause between scans. When loads exceeded2.0 × DSN, the data were scanned continuously todetect any failures that might occur between targetload levels.
Results
This study evaluated construction materials andthree roof assemblies. Primary emphasis, however,was placed on the structural performance of the roofassemblies. A summary of the material propertyevaluation is in Appendix A. Roof assembly test resultsinclude the stiffness and strength of individual trusses,the distribution of loads within each assembly, andthe strength and failure modes observed for the threeassemblies.

Individual Trusses
Truss InspectionNo major defects or fabrication errors were noted forany of the trusses prior to testing. Joint gaps for theFink configurations averaged under 1/16 in., withmaximum readings in the heel joints ranging up to3/16 in. Twenty percent of the gaps measured forthe scissors trusses were larger than cited by TPI as amaximum tolerance limit, 1/8 in., but no gaps exceeded3/16 in. Maximum MCP misplacements, expressedas a percentage of the corresponding connector platedimension, were 10 percent for the Fink trusses andonly 4 percent for the scissors. Average values werebetween 1 and 3 percent.
Truss TestsAlthough stiffness tests gave no indication of physicaldamage to the trusses, the 3:12 Fink trusses did exhibitslightly nonlinear load deflection behavior when loadedto DSN (Fig. 6). This was attributed to tighteningof gaps in compression joints and buckling of the topchord close to the heel joints. For subsequent trusstests, additional braces were added near the heels toprevent top-chord buckling.
Truss deflection profiles (Fig. 7) show that most ofthe vertical deflection occurred in the truss sectionsbetween the reactions and the first intersection ofthe chord and web element (node point). The smalldifference in the vertical deflections measured betweenthe two top nodes and the peak suggests that any ofthese readings or the average of the three readingscan indicate global truss deflection under uniformlydistributed load.
Table 1 lists individual truss ultimate loads and failuremodes. The Fink trusses exhibited consistent ultimatestrengths limited by failures at the heel connection.The scissors trusses, however, had a much greaterpropensity for twisting and buckling of the top chord.Modifications of the bracing system to prevent top-chord out-of-plane deformations caused wider variationin these results than was obtained for the Fink trusses.
Heel connection failures were due primarily to in-planeshear. For seven of the eight Fink trusses, the MCPsdeformed in shear, followed by plate tooth withdrawalfrom the chord. For Fink truss T61 and scissors trussTSA, however, twist in the top chord placed a trans-verse withdrawal force on the heel connection. Brac-ing added to restrain transverse force at the heel mayhave caused the failure mode to change for TSB. In thiscase, the peak buckled sideways. An out-of-square buttcut at the peak joint, giving wood contact on one sur-face and a 1/8-in. gap on the other, caused the peak
Figure 6—Load-deflection plots typical ofthe three truss configurations when testedindividualy. (ML90 5391)
Figure 7—Individual truss deflection profilesfor 3:12 Fink, 6:12 Fink, and scissors truss.(ML 90 5396)
to be pushed out of plane and the top chord to buckle.The final scissors truss, completely braced, failed whenthe king post pulled out of the MCP at the upper peak.
Shear displacements measured at the heel at maximumload were largest for the 3:12 trusses, with values aslarge as 0.25 in. For the 6:12 and scissors trusses,the largest heel displacement measured was 0.068in. Bottom-chord splice joints and web-chord jointsalso exhibited large displacements (>0.03 in.), but nofailures were at these joints. Finally, member rotationmeasurements at the bottom-chord peak joint of thescissors trusses were less than the range of significanceof the RLRP used to measure them. The largestreading showed a decrease in the angle between thebottom chord and the web chord of only 0.003 radian.
9

Table1—Comparison of truss stiffness and strength tests conducted inside and outside the assembly
Load (lb)Maximum
Assembly Slope Assemblytruss (lb/in) Single Assembly maximum Failure
3:12 FinkGableT31T32T33T34T35T36T37T38T39T3AT3BT3C
AverageCOVa (%)
6:12 FinkGableT61T62T63T64T65T66T67T68T69T6AT6BT6C
AverageCOVa (%)
ScissorsGableTS8TS2TS3TS4TS5TS6TS7TSlTS9TSATSBTSC
4,5104,8105,6805,0904,6005,9205,8506,1604,2804,8804,2304,690
5,0804,8904,0006,900
Average 5,060 5,220 5,740 5,230COVa (%) 13 20 17 26
4,4204,0904,0005,1303,6504,0403,9904,1604,6304,3903,8904,110
4,5304,360
4,540
4,270
4,210 4,4309 3
10,22014,14014,72012,41013,30014,61014,83013,99015,22014,14012,94012,280
4,4602,960
5,7805,280
4,2905,280
6,270 6,2705,920 5,9205,340 5,3405,850 5,8006,340 5,7205,640 4,750
5,8805,510
13,570 5,410 5,810 5,15010 10 7 19
3,900 3,2804,740 4,2104,900 4,5804,550 4,5504,280 4,2603,610 1,780
4,520
3,760
4,28010
4,231
2,980
3,57025
4,0704,9706,3006,6006,5606,9505,8804,560
4,5304,0704,9706,2606,1806,1006,9505,7502,240
2,280Heel connection-steel shear and pulloutHeel connection-steel shear and pullout
Wood bending-tension at knot
Wood bending-tension at knotNorth heel plate failureWood failure-tension at knotShear failure of north heel platesSteel failure-bottom chord splice
Heel connection pullout-top chord twistNo failure observedTension web-bottom chord connectionHeel connection-steel shear and pulloutTension web-bottom chord onnectionTension web-bottom chord connectionTension web-bottom chord connectionTension web-bottom chord connectionPeak connection-tension web pulloutBottom chord splice connection metal failureTooth pullout at the north heelSouth heel plate pullout and shear
Crack at knot found after testTop peak connection-plate pullout
Top peak connection-plate pulloutTop peak connection-plate pulloutTop peak connection-plate pulloutBottom peak connection-plate pullout
Buckling of the north top chordBuckling and twisting of top chordTop peak connection-plate pullout
a Coefficient of variation.
10

Assembly Load Distribution
Distribution of loads within the roof assemblies wasinfluenced by truss stiffness, truss location with pinnedends of the bearing plates and the gable end, andsheathing nail pattern. Load tests on individual trussesin each assembly provided a means of characterizingthese influences. Section and full assembly loadsprovide a basis for evaluating the superposition ofindividual truss load effects.
Individual Truss LoadFigures 8, 9, and 10 show how loads were distributedfrom individually loaded trusses in each of the threeroof assemblies. For example, a full-span load wasapplied to each truss individually and the resultingassembly reactions were recorded. The increase in theforce measured at each reaction was then divided bythe total load applied to the individual truss. Numbersshown in Figures 8, 9, and 10 indicate the percentageof applied load that was distributed to the truss at eachlocation when an individual truss in the assembly wasloaded. Several load levels within the design load rangeof the loaded truss showed little variation in the loaddistribution.
The magnitude of the distributed load varied with thelocation of the truss being loaded and the configurationof the trusses. For each assembly, a positive reactionresponse was measured for trusses up to five spacesaway from the loaded truss; beyond that, the trussreactions indicated a negative or upward response.The scissors assembly displayed the greatest tendencyto distribute load away from a loaded interior trussand the greatest tendency to distribute loads to thegable end and free-end trusses. Load distribution tothe adjacent truss varied little with configuration, butthe distribution of loads beyond three trusses away wasgreatest for the scissors assembly.
The free-end truss and gable end appeared to play agreater role in the performance of the scissors assemblythan the Fink assemblies. Figure 10 shows how whenthe third or fourth truss from either end was loaded, re-actions for the end truss or gable end were larger thanthose of the truss next to the end. In each case, thiscan be explained by the fact that load is transferredpast the interior trusses to the relatively stiffer free-endtrusses and the gable end. Loads carried by diaphragmaction of the sheathing caused the intermediate scissorsto spread as they deflected, but the gable end resistedhorizontal and vertical displacement.
An anomaly of the scissors assembly was a largerdeflection measurement for the free-end truss thanthe second truss when either the second, third, orfourth truss was loaded. The gable end stiffness in the
horizontal plane reduced spreading as a result of forcesdistributed through the bearing plate and sheathingdiaphragm for trusses on its end of the roof. Thisresulted in an increasing tendency for spreading withdistance from the gable end. One explanation for theincreased reactions and larger deflections of the endtruss is that a slightly heavier outward force causedit to spread more than the second truss and, thus, tohave a slightly larger peak deflection. As the end trussdeflected as a result of spreading, the overhang rotatedupward into the sheathing and picked up load from thesecond truss reactions.
In each phase of the assembly tests, horizontal displace-ment measurements taken along the bearing plates gavesome indication of how the importance of this restraintvaries with system configuration. In all cases, verti-cal load on an individual truss resulted in an outwardthrust on the bearing plate at its point of connection.Under individual truss loading, the largest bearingplate spread occurred on the free end of the roof; how-ever, under full assembly load, the spread in the middleof the roof was slightly larger than at the west end. Atdesign load on the full assembly, the maximum spreadwas about 0.3 in. for the scissors assembly, 0.10 in.for the 3:12 assembly, and 0.03 in. for the 6:12 assem-bly. The bearing plate stiffness and truss connection tothe bearing plate obviously had major impacts on loaddistribution.
Assembly LoadsVariations in truss deflection under full assembly loadwere influenced more by assembly interactions andtruss location with respect to the gable end than byrelative truss stiffness. Figure 11 shows the deflectionprofiles for the three roof assemblies under uniformassembly DSN load. In each case, the load was applieddirectly to the eight trusses and distributed to thegable end. Each profile shows the same pattern of trussdeflection increasing with distance from the gable endwith little variation as a result of relative stiffness. Thegable-end influence on truss deflection appears to besmallest for the 6:12 roof and largest for the scissorsroof.
The smooth pattern of truss deflections combinedwith variations in truss stiffness resulted in a slightlyerratic pattern for truss reactions (Fig. 12). Althougha relatively stiff truss is limited to less deflection thana limber truss, it may still pick up a larger share of theassembly load. The truss reaction patterns for the 6:12and scissors assemblies shown in Figure 12 demonstratethis effect.
Assembly StrengthTable 1 compares individual truss and full assemblyultimate loads. In the majority of cases, ultimate
11

Figure 8—Load influence matrices for the 3:12 Fink (a) and 6:12 Fink (b) and scissors roof(c) assemblies. Load distribution in each case is expressed as a percent of the total applied loadthat is picked up by each truss in the assembly. (ML88 5372, ML89 5545, ML89 5546)
12

Figure 8—con.
Figure 9—Deflection profiles for the 3:12 Fink,6:12 Fink, and scissors roof assemblies. Plotscompare truss deflections when the assembly wasloaded to DSN. In this case, the DSN load wasapplied to each truss in the assembly, and noload was applied to the gable end. (ML90 5386)
Figure 10—Reaction profiles for the 3:12, 6:12,and scissors roof assemblies. Plots compare thedistribution of assembly loads for the three roofconfigurations when each was loaded to its DSNvalue. The DSN load was uniformly applied toeach truss in the assembly. No load was appliedto the gable end. (ML90 5390)
13

Figure 11—Assembly effects on apparent truss stiffness. Stiffness, expressed as the sum oftruss reactions divided by vertical deflection, is larger in the assembly due to sheathing-chordinteraction and load redistribution to stiffer members. (ML90 5385)
Figure 12—Bearing plate spread measured under full assembly load. Sum of displacements of thenorth and south bearing plates regressed on assembly load to give bearing plate spread in inchesper thousand pounds at each of three locations. (ML90 5395)
14

truss loads occurred after the maximum assemblyload was reached. For the 3:12 Fink assembly, onetruss (T38) reached its ultimate strength before themaximum assembly load and carried less than halfits ultimate load when the assembly maximum loadwas recorded. The scissors assembly had two trusses(T51 and T57) that reached ultimate load beforethe maximum assembly load. Truss T51 reachedits maximum load 2-1/2 min and 501 lb before themaximum assembly load. For truss T57, ultimateload was recorded 8 s before the maximum assemblyload. The 6:12 Fink assembly had five trusses reachtheir ultimate load at the same time as the maximumassembly load, compared to two trusses in each of theother two assemblies.
The failure modes, compiled in Table 1, indicate aprevalent failure mode for each of the three configura-tions. The majority of 3:12 Fink assembly failures weredue to combined bending and tension in the bottomchords. The 6:12 Fink failures were almost exclusivelya result of tension-web pullouts at connections. Fiveof these pullouts occurred at the bottom-chord connec-tion. The scissors assembly failures were king post pull-outs at the upper peak. When one of these prevalentfailures occurred, loads were apparently redistributedto the same critical location on adjacent trusses. Thus,adjacent trusses have a tendency to fail in the samemode. This was confirmed by the rapid failures of adja-cent trusses in the 6:12 and scissors failure tests.
Horizontal displacements, sheathing-chord slip, andjoint deformation measurements for the load to failureare given in Appendix B.
Analysis of Results
The objectives of this study were to evaluate assem-bly interaction effects and to provide a basis for devel-opment and evaluation of assembly analytical models.Factors considered in evaluating interaction effects in-clude stiffness, strength, and failure mode of individualtrusses and roof assemblies. In each case, the evalua-tion relies on a comparison of individual truss and fullassembly performance. To enhance the analysis, refer-ence is made to the Part I report (Wolfe and McCarthy1989) that dealt with an extreme truss stiffness vari-ability, a bias toward wood failure, and symmetricalroof assemblies tested without the influence of a gableend. In this study, truss stiffness variation is repre-sentative of that found in a conventionally built light-frame trussed roof assembly. No attempt was made tobias the failure mode, and the roofs were constructedwith a gable end.
Truss Stiffness
Truss stiffness is primarily a function of the lumberstiffness. Joint displacements also influence truss stiff-ness. However, within the linear range of truss per-formance, truss deflection as a result of joint strain issmall in comparison to the strain in the wood members.For the trusses used in this study, lumber came from asingle source and was assigned to individual trusses bythe truss fabricator with no prearranged assignments.The average truss member MOE within a given con-figuration ranged from 1.89 × 10⁶ lb/in2 for the 6:12trusses to 1.92 × 10⁶ lb/in2 for the 3:12 trusses; COVranged from 18 to 19 percent. The average truss mem-ber MOE range from 1.57 × 10⁶ to 2.31 × 10⁶ lb/in2;COV ranged from 4 percent for the scissors to 10 per-cent for the 3:12 Fink trusses. Truss member MOE val-ues are given in Appendix A.
The slopes of the truss load-deflection plots (Table 1)are referenced as a measure of truss stiffness. Thedeflection value used to determine this slope wasthe average of the three node-point values. This issupported by the observation that truss deflectionprofiles (Fig. 7) appear relatively flat, with some slightvariations as a result of localized displacements overthe center portion of the truss. A least squares linearregression was used to determine the slope of the sumof the truss reactions compared to this average nodedeflection.
Table 2 gives three stiffness values determined for eachtruss used in a roof assembly. In each case, the stiffnessvalues were determined as the slope of the plot ofmeasured reactions compared to measured deflections.On the average, truss stiffness variability is less thanhalf that measured for the lumber. Naturally, thisvaried with the truss configuration. Lumber stiffnessCOVs for the three assemblies ranged from 18 to19 percent. Individual truss stiffness COVs ranged from4 to 11 percent. The higher COV determined for the3:12 configuration is primarily from the high stiffnessmeasured for one truss (T34). Without that truss,the COV would have been 5 percent. For the scissorstrusses, the higher COV reflects a true spread in thestiffness distribution.
Assembly Effects
The Part I report (Wolfe and McCarthy 1989) identi-fied two assembly interaction mechanisms-compositeaction and load sharing-that act to improve the ap-parent performance of trusses in an assembly over thatexhibited in individual tests. Composite action is de-fined as the interaction between the truss and the roofsheathing that serves to increase the stiffness of the topchord and thus of the truss. Load sharing is defined as
15

Table 2—Truss stiffness values determined as the slope of the load deflection curve for trusses tested individuallytested individually with those determined for trusses loaded as part of the assembly
Stiffness value (lb/in deflection)
Roof assembly
Truss location, west end CoefficientGable of variation
1 2 3 4 5 6 7 8 end Average (percent)
a Assembly A was constructed with sheathing end nailing spaced 12 in. on center.b Assembly B was constructed with sheathing end nailing spaced 6 in. on center.c Average ratios do not include values for the eighth truss as a result of influence of gable end.
an assembly attribute resulting from boundary condi-tions that force all trusses in the assembly to deflecttogether. This then serves to distribute a greater shareof the load to stiffer trusses and to reduce the apparentvariability in truss stiffness determined using tributaryarea loading assumptions.
Our assessment of roof assembly interactions assumesthat composite action provides the same stiffnessincrease for each truss but no increase in strength.Composite action stiffness increase is primarily anincrease in effective moment of inertia of the top chordof the truss. Conventional truss design assumes littleor no variability in top-chord or connection stiffness. Atruss designer would therefore expect little variabilityin the effect of composite action on truss stiffness. Asloads approached the roof assembly capacity, sheathing-chord slip measurements (App. B) showed that thenailed connections had been loaded well beyond the0.015-in. limit for their desired design values. Althoughthey continued to transfer load between the trussesand the sheathing, these connections were no longerrigid enough to provide composite action betweenthe truss chords and the sheathing. Therefore, wefeel that the composite action that provides an initialincrease in chord stiffness diminishes with increasedtruss deflection to the point that it does not provide asignificant increase in truss load capacity.
Load sharing, on the other hand, would be expectedto vary widely with relative stiffness of trusses within
16
a given assembly and its effects would increase as loadapproaches the assembly capacity. If load sharing isviewed as a transfer of load, either through plate or di-aphragm action of the sheathing, from limber to stiffertrusses, its effect would be to increase load for stiffertrusses and decrease it for limber trusses. Load shar-ing depends on the stiffness and span of the sheathingas well as relative deflection of adjacent trusses. Loadsharing does not occur until one truss deflects relativeto adjacent trusses. This may be due to truss stiffnessvariation, plastic deformation in a connection, or par-tial failure of a chord member. The load that is shedwill increase with relative displacement, an increase inthe relative stiffness of the sheathing, and a decrease inthe truss spacing.
For simplicity, our evaluation of composite action andload sharing attempts to support the premise thatthese two effects are mutually exclusive. Compositeaction initially serves to increase the effective stiffnessof the trusses, but it then diminishes as the trusses areloaded beyond design load. Load sharing influencesthe variability in effective truss stiffness by enforcingboundary conditions that limit relative displacement,and it influences assembly load capacity by shiftingload away from the weakest link.
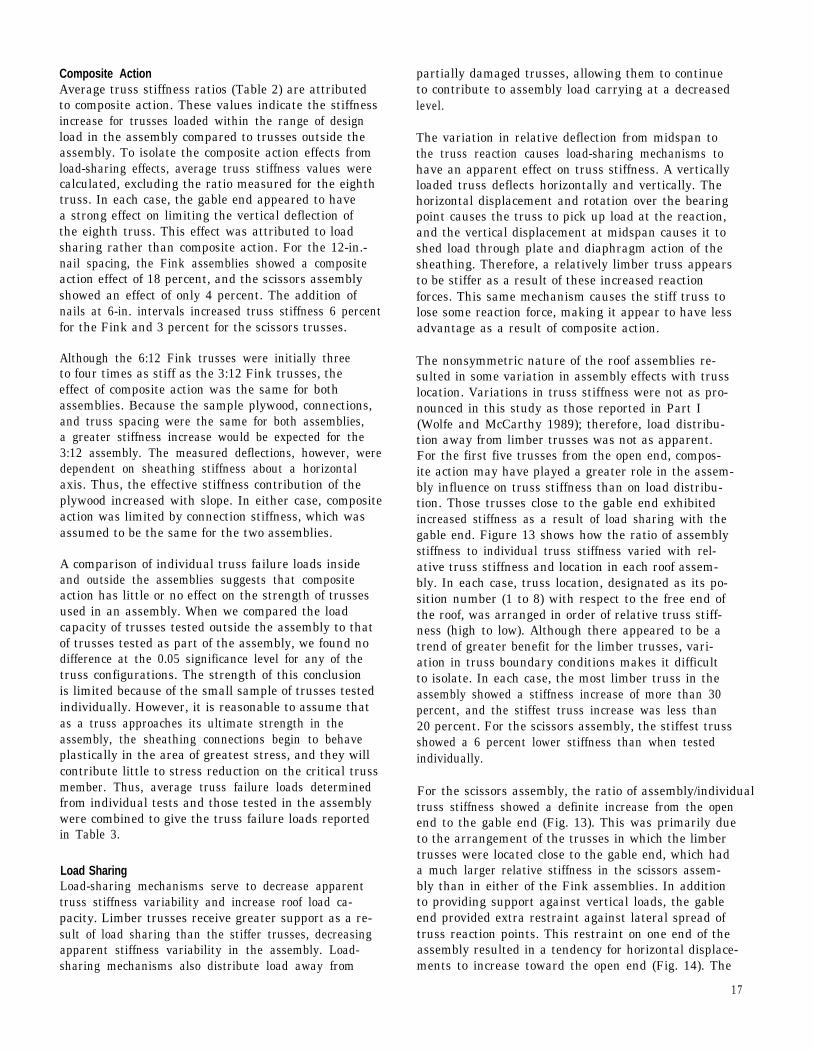
Composite ActionAverage truss stiffness ratios (Table 2) are attributedto composite action. These values indicate the stiffnessincrease for trusses loaded within the range of designload in the assembly compared to trusses outside theassembly. To isolate the composite action effects fromload-sharing effects, average truss stiffness values werecalculated, excluding the ratio measured for the eighthtruss. In each case, the gable end appeared to havea strong effect on limiting the vertical deflection ofthe eighth truss. This effect was attributed to loadsharing rather than composite action. For the 12-in.-nail spacing, the Fink assemblies showed a compositeaction effect of 18 percent, and the scissors assemblyshowed an effect of only 4 percent. The addition ofnails at 6-in. intervals increased truss stiffness 6 percentfor the Fink and 3 percent for the scissors trusses.
Although the 6:12 Fink trusses were initially threeto four times as stiff as the 3:12 Fink trusses, theeffect of composite action was the same for bothassemblies. Because the sample plywood, connections,and truss spacing were the same for both assemblies,a greater stiffness increase would be expected for the3:12 assembly. The measured deflections, however, weredependent on sheathing stiffness about a horizontalaxis. Thus, the effective stiffness contribution of theplywood increased with slope. In either case, compositeaction was limited by connection stiffness, which wasassumed to be the same for the two assemblies.
A comparison of individual truss failure loads insideand outside the assemblies suggests that compositeaction has little or no effect on the strength of trussesused in an assembly. When we compared the loadcapacity of trusses tested outside the assembly to thatof trusses tested as part of the assembly, we found nodifference at the 0.05 significance level for any of thetruss configurations. The strength of this conclusionis limited because of the small sample of trusses testedindividually. However, it is reasonable to assume thatas a truss approaches its ultimate strength in theassembly, the sheathing connections begin to behaveplastically in the area of greatest stress, and they willcontribute little to stress reduction on the critical trussmember. Thus, average truss failure loads determinedfrom individual tests and those tested in the assemblywere combined to give the truss failure loads reportedin Table 3.
Load SharingLoad-sharing mechanisms serve to decrease apparenttruss stiffness variability and increase roof load ca-pacity. Limber trusses receive greater support as a re-sult of load sharing than the stiffer trusses, decreasingapparent stiffness variability in the assembly. Load-sharing mechanisms also distribute load away from
partially damaged trusses, allowing them to continueto contribute to assembly load carrying at a decreasedlevel.
The variation in relative deflection from midspan tothe truss reaction causes load-sharing mechanisms tohave an apparent effect on truss stiffness. A verticallyloaded truss deflects horizontally and vertically. Thehorizontal displacement and rotation over the bearingpoint causes the truss to pick up load at the reaction,and the vertical displacement at midspan causes it toshed load through plate and diaphragm action of thesheathing. Therefore, a relatively limber truss appearsto be stiffer as a result of these increased reactionforces. This same mechanism causes the stiff truss tolose some reaction force, making it appear to have lessadvantage as a result of composite action.
The nonsymmetric nature of the roof assemblies re-sulted in some variation in assembly effects with trusslocation. Variations in truss stiffness were not as pro-nounced in this study as those reported in Part I(Wolfe and McCarthy 1989); therefore, load distribu-tion away from limber trusses was not as apparent.For the first five trusses from the open end, compos-ite action may have played a greater role in the assem-bly influence on truss stiffness than on load distribu-tion. Those trusses close to the gable end exhibitedincreased stiffness as a result of load sharing with thegable end. Figure 13 shows how the ratio of assemblystiffness to individual truss stiffness varied with rel-ative truss stiffness and location in each roof assem-bly. In each case, truss location, designated as its po-sition number (1 to 8) with respect to the free end ofthe roof, was arranged in order of relative truss stiff-ness (high to low). Although there appeared to be atrend of greater benefit for the limber trusses, vari-ation in truss boundary conditions makes it difficultto isolate. In each case, the most limber truss in theassembly showed a stiffness increase of more than 30percent, and the stiffest truss increase was less than20 percent. For the scissors assembly, the stiffest trussshowed a 6 percent lower stiffness than when testedindividually.
For the scissors assembly, the ratio of assembly/individualtruss stiffness showed a definite increase from the openend to the gable end (Fig. 13). This was primarily dueto the arrangement of the trusses in which the limbertrusses were located close to the gable end, which hada much larger relative stiffness in the scissors assem-bly than in either of the Fink assemblies. In additionto providing support against vertical loads, the gableend provided extra restraint against lateral spread oftruss reaction points. This restraint on one end of theassembly resulted in a tendency for horizontal displace-ments to increase toward the open end (Fig. 14). The
17

Table 3—Evaluation of the inherent load-sharing factor forthree roof assemblies
Weakesttruss Tributary area load
Load-sharingincrease
maximumTruss loada
at failure (lb)b (percent)
type (lb) 1 2 3 4 1 2 3 4
3:12 Fink 3,610 4,590 4,280 4,020 3,900 27 19 11 106:12 Fink 5,280 6,620 6,180 5,790 5,780 25 16 9 9Scissors 4,560 6,720 6,280 5,880 5,670 47 37 28 24
a Lowest maximum load measured for a truss that failedwhen loaded in the roof assembly.
b 1—seven loaded trusses are assumed to carry totalapplied load.2—free-end trusses carry half the tributary area loadof the seven loaded trusses.S-free-end truss and gable end each carry half tributaryarea load of the seven loaded trusses.4-neglect the gable end reactions in calculating total loadon the assembly and assume free-end truss carries halfthe load of each of the seven loaded trusses.
Figure 13—Assembly effects on truss stiffness.Plot of assembly individual stiffness ratios for alltrusses tested in the three assemblies comparedto relative individual truss stiffness within eachassembly. (ML90 5397)
combination of increased load and decreased horizon- leaving load sharing to account for variability about thetal restraint caused trusses on the open end to appear average. Figure 13 shows how the total assembly effectless stiff in the assembly than they did when tested and load sharing varied with relative truss stiffnessindividually. within an assembly.
The load-sharing increase for stiffness was estimatedby factoring out composite action effects from the totalassembly stiffness increase determined for each truss.Using the tributary area or as-loaded assumption forestimating truss stiffness gave an unrealistically largeadvantage to those trusses close to the gable end,so truss stiffness values were evaluated solely on thebasis of measured reactions. Composite action wascharacterized as the average stiffness increase (Table 2),
Figure 14—Maximum load-failure sequence.After each failure, assembly load dropped off.Upon reloading, subsequent failures occurredat load levels close to that of the first failure.(ML 90 5392)
Figure 13 is a composite of the assembly/individualstiffness ratio compared to relative individual trussstiffness for the three roof assemblies tested. Thescatter in these data was due in part to the effectsof the gable end that partially overshadows the load-sharing effects as a result of relative truss stiffnessand behavior variations between the Fink and scissorstruss. The data were derived using least squares linearregression to show the general trend. These results
18

suggest that for a truss stiffness COV of 10 percentwithin a roof, the average truss would be expected toshow 20 percent less deflection (strain) at a given loadin the assembly than outside the assembly.
Roof assemblies and individual trusses are normallyassumed to be weak-link structures for purposes ofdesign. Conventional truss design focuses on the ratioof induced stress to expected strength for each member.The expected member strength value is the estimatednear minimum value for the global population oflumber in the specified grade and species. As a result,the truss design load capacity is assumed to representa minimum value for all trusses made using similarmaterial and the same configuration. If a truss is tobe used in a repetitive member assembly, a 15-percentincrease is allowed for member bending stress, butthe weakest truss is still assumed to dictate the roofload capacity. This approach ignores the existence of amechanism by which loads may be distributed aroundareas of local weakness.
In this study, load sharing increased the assembly loadcapacity range from 9 to 47 percent, depending onassembly configuration and the assumptions used toevaluate tributary area truss load in the assembly. Us-ing the values in Table 1, we derived the load-sharingstrength increase as the ratio of maximum assemblytributary area load to weak-link-truss maximum load.As a result of differences in the boundary conditions,especially evident in the scissors trusses, the weak-linktruss was selected from those that failed in the assem-bly rather than those trusses tested individually tofailure. The tributary area loads were calculated infour ways to show the sensitivity to loading assump-tions. Resulting values of weak link, tributary area loadcapacity of the roof assembly, and the correspondingload-sharing factors are given in Table 3.
The weak-link values were representative of trussdesign values without load duration and factor of safetyadjustments. Dividing the weak-link maximum loadsby their respective design values gives values of 2.06,2.48, and 2.14 for the 3:12, 6:12, and scissors trusses,respectively. This is close to the duration of load andfactor of safety adjustment used for lumber bendingand tension stresses (2.1) and greater than that usedfor compression (1.9) (ASTM 1981a). Thus, the TPIdesign load derivation appears to be a reasonable weak-link predictor.
Four estimates of tributary area load cover a range ofinterpretations of load distribution in an assembly thatincludes trusses of identical stiffness. Estimates 1 and 2assume that the gable end represents an assemblyboundary condition that is part of the overall assemblyeffect. Estimate 1 assumes that only those trusses that
are loaded directly in the assembly carry load. In thiscase, the maximum assembly load was divided by 7.Estimate 2 assumes that the free-end truss carries 1/2the load carried by each of the other trusses. Estimate3 attributes 1/16 of the total load to the gable end aswell as the free-end truss and 1/8 of the load to each ofthe interior trusses. Estimate 4 is the same as estimate2 except that the load distributed to the gable end isnot included in the maximum assembly load.
Appendix D gives a similar evaluation of truss teststhat were presented in the Part I report (Wolfe andMcCarthy 1989). In that study, the truss design loadprovided a conservative estimate of weak-link truss loadcapacity as a result of using heavy gauge plates. Theresulting load-sharing increase values determined forthose trusses ranged from 13 to 29 percent for the 3:12assembly and 30 to 49 percent for the 6:12 assembly.
Values shown in Table 3 support the use of a load-sharing increase for load capacity of trusses designedfollowing TPI procedures and used in a repetitivemember assembly. In two of the three cases, weak-linkmaximum load occurred before assembly maximum.In all cases, the weak-link load capacity was less thanthe assembly tributary area load. Therefore, a designprocedure that attempts to predict assembly tributaryarea load capacity on the basis of weak-link individualstrength values should be able to recognize a benefit toassembly load sharing.
Distribution of Loads Within an Assembly
We found that the most convenient way to characterizeload distribution in the roof assembly was to expressthe sum of reactions for each truss in terms of thepercentage of total assembly load. Reactions expressedin this manner exhibited little variation with load level.Thus, the load distribution pattern expressed in thismanner was taken to be characteristic of the assembly.
We characterized the assembly load distribution pat-tern by measuring assembly response to the load placedon each truss. This approach provided the basis forevaluating the importance of truss relative stiffness andlocation. The resulting load distribution for each as-sembly can be expressed as the sum of influences ofeach truss loaded individually. Individual truss loadinfluence on assembly reaction is shown for the threeroof assemblies in Figures 8, 9, and 10. Superimpos-ing assembly responses to loads on each truss gives anestimate of how loads are distributed when the full as-sembly is loaded. Table 4 compares the superpositionprediction to measured response when all trusses areloaded simultaneously.
19

mum, they continued to provide significant contributionto assembly strength until the roof assembly failed.
Table 4—Average load carried by each truss in thefull assembly
Truss
Load (percent)a
6-in. nail spacing 12-in. nail spacing
Predicted Measured Predicted Measured Conclusions
This study provides a basis for future developments inthe evolution of analytical models and methods to moreaccurately predict the structural capacity of repetitivemember assemblies. Results show that repetitivemember roof assemblies behave like parallel systemsin which member deflections are controlled by assemblyinteractions. Thus, they carry load in proportion totheir stiffness rather than series systems in whichmember loads are uniformly distributed, and the weak-link value controls assembly capacity. These resultssuggest the need to focus on the correlation betweenstiffness and strength and to develop models to detectstrain limits on individual elements and connections inaddition to, or in place of, stress limits. Test methodsdemonstrated the advantages of using superpositionto evaluate load distribution and the shortcomings ofhydraulic loading systems to simulate assembly failureunder gravity loading.
The most significant conclusions from this study are asfollows:
1. The load distribution characteristics of a repetitivemember assembly under full design load may becharacterized without loading any individual trussto its full design load value. When design loadis applied along the top chord of an individualtruss, 40 to 70 percent of that load is distributed toadjacent trusses by the sheathing, rather than beingcarried to the reactions of the loaded truss. Bymeasuring all assembly reactions as load is appliedto one truss at a time and then superimposingassembly reactions measured for each truss load,the reaction response characteristics of the assemblyunder full assembly load may be determined. Thisapproach to assembly testing reduces the possibilityof truss damage as a result of excessive loading.
2. Two assembly interaction mechanisms contributeto the improved reliability of trusses used in arepetitive member assembly- composite actionand load sharing. Composite action between thesheathing and the top chord of a truss serves toincrease the effective stiffness by increasing theeffective moment of inertia of the chord. For theroof assemblies, the stiffness increase attributedto composite action was 24 percent for the Finkand 7 percent for the scissors. Tests indicated,however, that as load approached the capacityof the assembly, joint slip caused a reduction inthe composite action to the point that it did notcontribute to a strength increase.
a Predicted on the basis of superposition of assemblyresponse to individual truss loading.
Failure Modes and Sequence
For each roof, first-truss failure defined roof loadcapacity. Although they were not coincident events,results indicated that under a gravity-load situation,roof load could not have been increased after the initialfailure, which caused a drop in the hydraulic load asa result of a sudden increase in the deflection of oneor more trusses. Figure 14 shows the sum of verticalreactions compared to average vertical deflections of thetruss peaks during failure testing for each of the threeroof assemblies. The load on the assembly at the timeof the first failure (marked 1 on Fig. 14) approximatesthe ultimate load carried by that assembly. Ratios ofload at first failure to the ultimate load measured onthe assembly are 0.92 for the 3:12 Fink, 1.0 for the6:12, and 0.99 for the scissors. This analysis suggeststhat a gravity load, which would not decrease betweenfailures, would likely have led to a cascading sequenceof failures beginning with the first failure.
A survey of truss reactions through the sequence ofloading to failure indicates that although a few trussesdid reach a maximum load prior to the assembly maxi-
20
3.
4.
The first failure defined assembly failure mode. As-sembly interaction that restricts differential deflec-tion between trusses causes loads to be redistributedaround areas of local weakness when the entire as-sembly is loaded. Therefore, when the first trussfails, redistributed loads that concentrate in the areaof the first truss failure cause an immediate over-load in the same area of adjacent trusses. In thisstudy, although each assembly exhibited a uniquefailure mode, the majority of the failures within anassembly were the same.
The evaluation of interaction effects on strength sug-gests ratios of measured assembly strength to min-imum truss strength that range from 1.09 to 1.47,depending upon truss configuration and assumptionsmade on the strength of the weakest member. Theseratios for ultimate strength indicate that the 15 per-cent currently applied only to bending stress of indi-vidual elements could be applied to the entire truss,contingent on truss type and assembly configura-tion. Sensitivity analyses conducted using computermodels may be able to give a range of assembly in-crease factors, depending on assembly configurationvariables such as truss span, spacing, relative stiff-ness of the sheathing when compared to the trusses,sheathing to frame connections, and truss boundaryconditions.
Acknowledgments
The success of this study was strongly dependentupon the work and dedication of the Forest ProductsLaboratory, Engineering Mechanics Laboratory, staff.We give special recognition to Roy Traver for hisleadership in the construction and testing phases, MikeGrambsch for instrumentation, and Gary Larson fordata collection software development.
Funding for this study was provided in part by thewood industry and the U.S. Department of Agricul-ture. The Truss Plate Institute took a lead role in co-ordinating support from the industry. Half the fund-ing was supplied through USDA Competitive GrantNo. 86-FSTY-9-0180.
This study was conducted as part of a collaborativeresearch agreement between the USDA Forest Ser-vice, Forest Products Laboratory, and Forintek CanadaCorp. of Vancouver, B.C. The purpose of this cooper-ative effort was to provide the technical basis and ana-lytical tools to create a light-frame roof assembly designstandard to be used with load resistance factor designprocedures that are being developed in Canada and theUnited States.
The results listed in the Part I report of this researchprogram have been used in the development (Cramerand Wolfe 1989), verification (Varoglu 1985), andcalibration (Varoglu 1986; Lam and Varoglu 1988) ofexisting analytical models that analyze light-frame roofassemblies.
Literature Cited
21
Appendix A-Material Properties
Materials used in the roof assembly research programwere donated by the wood industry. The AmericanPlywood Association (APA) provided the plywoodsheathing along with their measurements of physi-cal and mechanical properties. The lumber used toconstruct the trusses was purchased with money con-tributed by the Wood Truss Council of America. Mois-ture content and modulus of elasticity measurementswere made at the Forest Products Laboratory (FPL)with the assistance of Don Percival of the Small HomesCouncil, University of Illinois, Champaign-Urbana,Illinois.
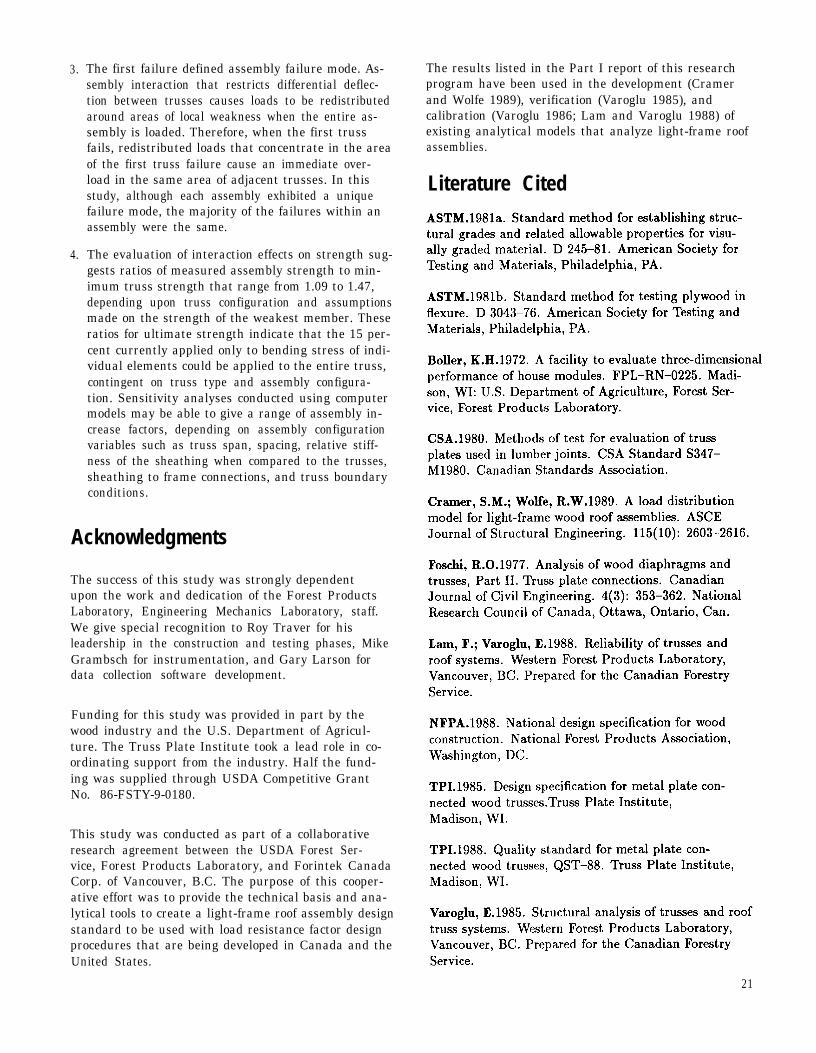
Modulus of elasticity (MOE) values were determinedfor all lumber and plywood sheathing before they wereused in the truss or roof system construction. Valuesmeasured for the plywood are shown in Table A-l, andthose measured for the lumber are shown in Table A-2.
The plywood used for the roof systems was 15/32-in.CD exterior grade sheathing with an APA span ratingof 16/4. Each plywood sheet was identified by apanel number as shown in Figure A-1. These numbersshow the placement of the individual sheets in the roofsystems.
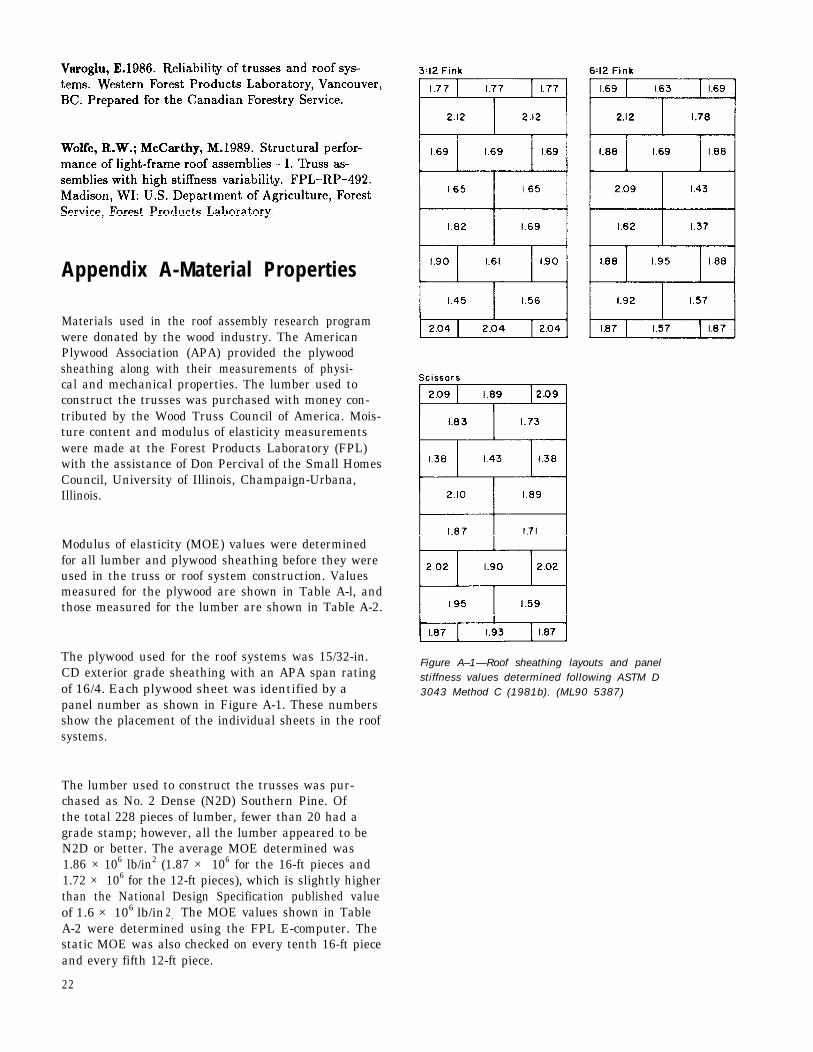
The lumber used to construct the trusses was pur-chased as No. 2 Dense (N2D) Southern Pine. Ofthe total 228 pieces of lumber, fewer than 20 had agrade stamp; however, all the lumber appeared to beN2D or better. The average MOE determined was1.86 × 106 lb/in2 (1.87 × 10⁶ for the 16-ft pieces and1.72 × 106 for the 12-ft pieces), which is slightly higherthan the National Design Specification published valueof 1.6 × 10⁶ lb/in2. The MOE values shown in TableA-2 were determined using the FPL E-computer. Thestatic MOE was also checked on every tenth 16-ft pieceand every fifth 12-ft piece.
22
Figure A–1—Roof sheathing layouts and panelstiffness values determined following ASTM D3043 Method C (1981b). (ML90 5387)

Table A-1–Plywood sheathing modulus of elasticity values”
MOE values (× 106 lb/in2)Top chord Bottom chord Web membersc
Trussb North South North South NT NC ST SC Average
2.502.41.662.091.451.621.562.232.52.052.12.53
T31T32T33T34T35T36T37T38T39T3AT3BT3C
1.622.22.132.551.311.882.201.842.41.772.01.78
1.781.91.302.051.451.191.671.872.11.531.82.00
T61 1.43 2.45 2.03T62 1.82 1.52 2.39T63 1.24 2.18 2.22T64 1.91 1.38 1.41T65 1.14 1.85 2.30T66 2.08 1.84 2.19T67 1.34 2.39 1.72T68 1.82 1.77 1.91T69 2.27 2.08 2.49T6A 2.01 1.43 2.01T6B 1.60 1.54 2.06T6C 2.09 1.49 1.58
2.22 1.85 1.62 1.96 2.032.2 2.1 2.3 2.0 2.21.92 1.68 2.38 1.26 2.531.55 1.85 2.50 2.22 1.261.53 2.56 2.00 2.03 1.981.52 1.68 2.38 1.26 1.501.72 1.62 1.68 2.08 2.031.66 1.72 1.50 1.28 1.282.3 2.3 2.5 2.1 2.42.84 1.62 2.17 1.98 2.562.0 1.9 2.1 1.8 2.01.88 1.72 1.70 1.28 1.85
1.69 1.96 1.98 2.01 1.791.43 1.58 1.98 2.51 2.081.43 1.90 2.17 1.92 2.011.40 1.82 1.42 1.70 1.502.46 2.12 1.77 1.98 2.731.43 1.86 2.37 1.79 2.172.06 2.07 2.22 1.61 1.981.86 1.96 2.14 1.33 2.281.73 2.26 2.28 1.47 2.591.47 2.23 2.13 2.18 2.381.91 2.18 2.21 1.65 1.831.56 1.21 1.41 1.35 2.00
1.952.141.862.011.791.631.821.672.312.071.971.84
1.921.911.881.572.041.971.921.882.151.981.871.59
a Values were measured using 16- and 12-ft lumber prior to being cutfor truss fabrication.
b MOE values for T32, T39, and T3B were determined by multiplyingaverage values found for corresponding members in other 3:12 trussesby the relative truss stiffness determined in individual truss tests.
c NT is north tension web; NC is north compression web; ST is southtension web; SC is south compression web.
Table A-2–Southern Pine lumber modulus of elasticity values
Top chordMOE values (× 106 lb/in2)
Web members Bottom chord
TrussNorth South North South North King South South Southa North South Aver-
1 2 3 post 3 2 1 age
TS1 2.55 1.93 1.33 2.37 1.73 2.21 1.93 2.28 — 1.98 2.15 2.05TS2 1.87 1.51 1.61 1.65 1.73 2.13 1.88 2.28 — 1.52 1.78 1.80TS3 2.11 1.62 — 1.77 1.39 1.98 1.92 2.37 — 2.61 2.17 1.99TS4 1.45 1.67 1.35 2.37 1.73 2.28 1.93 2.28 — 1.98 1.98 1.90TS5 1.88 1.09 2.23 1.65 2.54 2.21 1.88 1.65 — 2.27 2.2 1.96TS6 2.19 2.63 2.51 1.39 — 2.13 1.88 1.83 — 1.68 1.94 2.02TS7 2.42 1.81 1.86 2.14 1.52 2.28 2.54 1.42 — 1.71 1.6 1.93TS8 1.92 1.29 — 1.83 2.37 2.21 1.38 1.77 — 1.34 1.81 1.77TS9 1.31 1.6 — 2.14 2.37 1.98 1.93 1.77 — 1.69 1.87 1.85TSA 2.16 1.75 1.92 1.42 1.52 2.13 2.54 1.42 — 2.48 2.01 1.94TSB 1.58 1.85 2.18 1.83 1.52 2.28 1.38 1.77 — 1.57 2.25 1.82TSC 1.89 1.7 1.9 2.14 2.37 1.98 1.38 1.77 — 2.33 2.03 1.95
a No record of MOE.
23

Appendix B—Load-Distributing Elements
Loads were distributed away from limber or damagedtrusses in the roof assemblies through two major path-ways: the bearing plate and the plywood sheathing.The bearing plate contribution is a function of the trussattachment and the tendency for the truss to spreadlaterally when loaded. The sheathing contribution is afunction of relative stiffness of the sheathing and trussand rigidity of the sheathing connection. This appendixis a brief synopsis of the displacement measurementsthat were taken to give some measure of the functionof these two assembly components in the overall perfor-mance of a roof assembly.
Bearing Plates
Roof assembly bearing plates were pin connected tothe reaction walls to provide lateral restraint. Thestiffness of these bearing plates in the horizontal plane,about an axis perpendicular to the length and width,averaged 8.3 × 10⁶ lb/ in2 for the Fink roof assembliesand 19.8 × 10⁶ lb/in2 for the scissors assembly. Theseplates were vertically supported on load cells thatwere placed in line with each truss reaction. Whenthe trusses were loaded individually in the assembly,the bearing plate served as a load distribution beamwith multiple supports (individual trusses) and oneconcentrated load. When the assembly was loaded, itwas a pinned-end beam with nine concentrated loads.
Figures B-1 to B-3 show how the bearing plate movedunder loads applied to individual trusses. The threelines in each figure represent total spread betweenbearing plates on the west end, at midlength, and onthe east end of the roof. As each truss was loaded,these three readings reflected how much of the lateralforce was distributed to other trusses. In each case,when the truss on the west end was loaded, a largeportion of the horizontal thrust was transferred to thereaction wall through the bearing plate pin support.Measured displacements of the bearing plate under thewest-end truss reaction (0.019 in. for the 3:12 assembly,0.013 in. for the 6:12, and 0.047 in. for the scissors)represent bending of the plate and some movementof the cantilevered bearing plate pin support. In eachcase, when load was applied to an end truss, a veryslight negative (inward) movement was detected for thebearing plate on the opposite end.
Bearing plate spread at midlength was unique for thescissors assembly. For both Fink truss assemblies,the midlength spread went from zero for load appliedto an end truss to its maximum value (0.015 in. forthe 3:12 and 0.006 in. for the 6:12) for load applied
24
Figure B-1—Depicts the spread measuredbetween bearing plates at three locationsalong the length of the 3:12 roof as each trusswas individually loaded in the assembly. Themaximum spread of 0.04 in. was measured forthe truss on the west end when it was loaded to2,200 lb. (ML90 5398)
Figure B-2—Depicts the spread measuredbetween bearing plates at three locationsalong the length of the 6:12 roof as each trusswas individually loaded in the assembly. Themaximum spread of 0.026 in. was measured forthe truss on the west end when it was loaded to2,800 lb. (ML90 5393)
to the middle truss. For the scissors assembly, theindividual trusses provided less resistance to spreadingand midlength displacements ranged from 0.008 in.for load on the west-end truss to 0.013 in. for load onthe middle truss. When the eighth truss was loaded, alarge portion of the horizontal thrust was resisted bythe gable end that was a sheathed 6:12 Fink truss.
Table B-1 gives measurements of bearing plate spreadunder full assembly load. Values given represent theslope of bearing plate spread compared to assembly

Figure B-3—Depicts the spread measured
between bearing plates at three locations along
the length of the scissors roof as each truss
was individually loaded in the assembly. The
maximum spread of 0.095 in. was measured for
the truss on the west end when it was loaded to
2,750 lb. (ML90 5388)
Sheathing-chord slip measurements support the premisethat the sheathing-chord composite action was substan-tially reduced on critical trusses by the time the maxi-mum assembly load was reached. In general, the largestsheathing movement parallel to the chord occurred onthe ends of the roof. For those locations, the sheath-ing movement with respect to the chord was larger inthe panels adjacent to the peak than the panels nextto the heels. For interior trusses where we could readthe data, displacements were larger close to the heels.The majority of these measurements exceeded 0.015 in.prior to the maximum assembly load. This suggeststhat the nailed connections were stressed beyond theirelastic limit prior to failure of the roof, and thus, com-posite action should be discounted as a mechanism thatincreases the strength of a chord-carrying-bending mo-ment. Figures B-4 to B-9 are examples of the loadsheathing-chord slip behavior measured for the testassemblies.
Table B-l-Bearing plate separationexpressed as a ratio of horizontaldisplacement to total assembly load
Separation (× 10–6 in/lb)
Assembly West end Midlength East end
3:12 Fink 5.50 7.60 1.506:12 Fink 2.80 3.00 1.00Scissors 0.195 0.132 2.30
load. On the west end, the scissors spread was three tosix times that of the Fink assemblies.
Plywood Sheathing
To evaluate the importance of the diaphragm action ofthe sheathing in distribution load among trusses, weplaced LVDTs on four trusses and on the gable end ineach assembly to monitor movement of the sheathingrelative to the truss top chord. In each case, LVDTswere placed at the middle of each top-chord panel andreferenced a cantilevered foot that was attached to thesheathing.
Figure B-l—sheathing-chord slip measurementstaken for the seventh truss from the west end ofthe scissors roof during the full assembly load tofailure (ML90 5402)
Movement of the sheathing with respect to the chordwas not unidirectional; therefore, these measurements,oriented parallel to the chord, generated a lot of noise.In many instances, the noise overshadowed our unidi-rectional measurement.
25
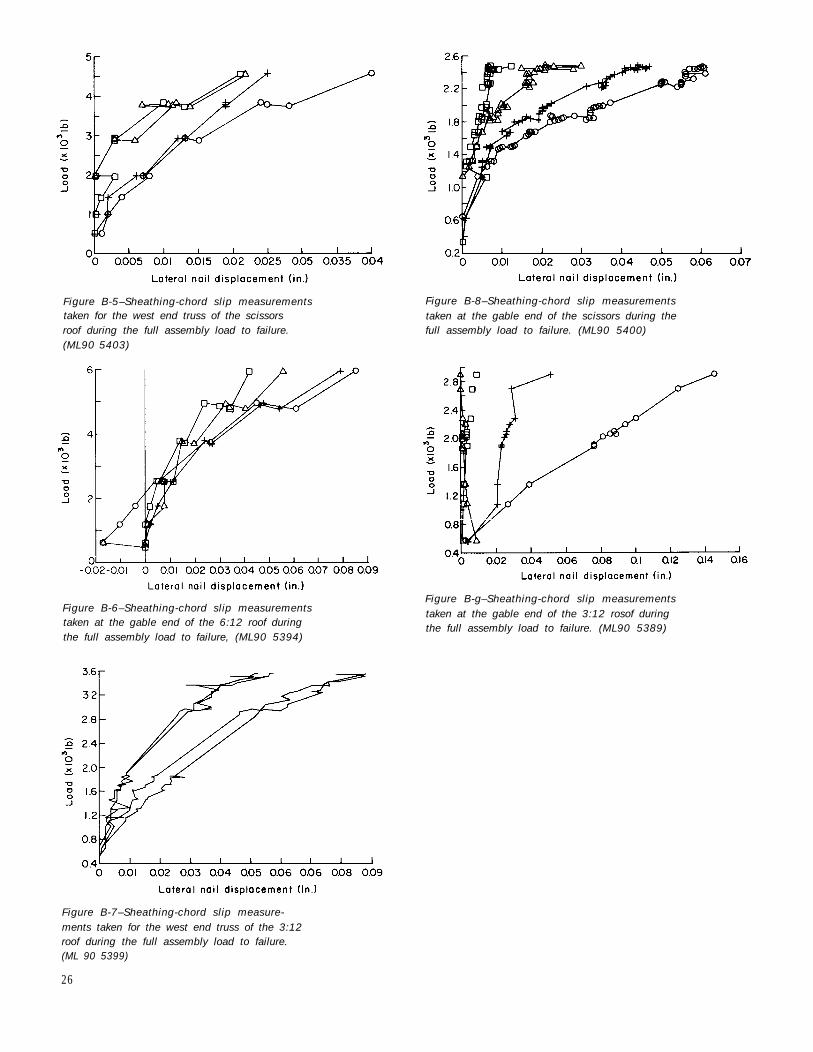
Figure B-5–Sheathing-chord slip measurementstaken for the west end truss of the scissorsroof during the full assembly load to failure.(ML90 5403)
Figure B-6–Sheathing-chord slip measurementstaken at the gable end of the 6:12 roof duringthe full assembly load to failure, (ML90 5394)
Figure B-7–Sheathing-chord slip measure-ments taken for the west end truss of the 3:12roof during the full assembly load to failure.(ML 90 5399)
26
Figure B-8–Sheathing-chord slip measurementstaken at the gable end of the scissors during thefull assembly load to failure. (ML90 5400)
Figure B-g–Sheathing-chord slip measurementstaken at the gable end of the 3:12 rosof duringthe full assembly load to failure. (ML90 5389)
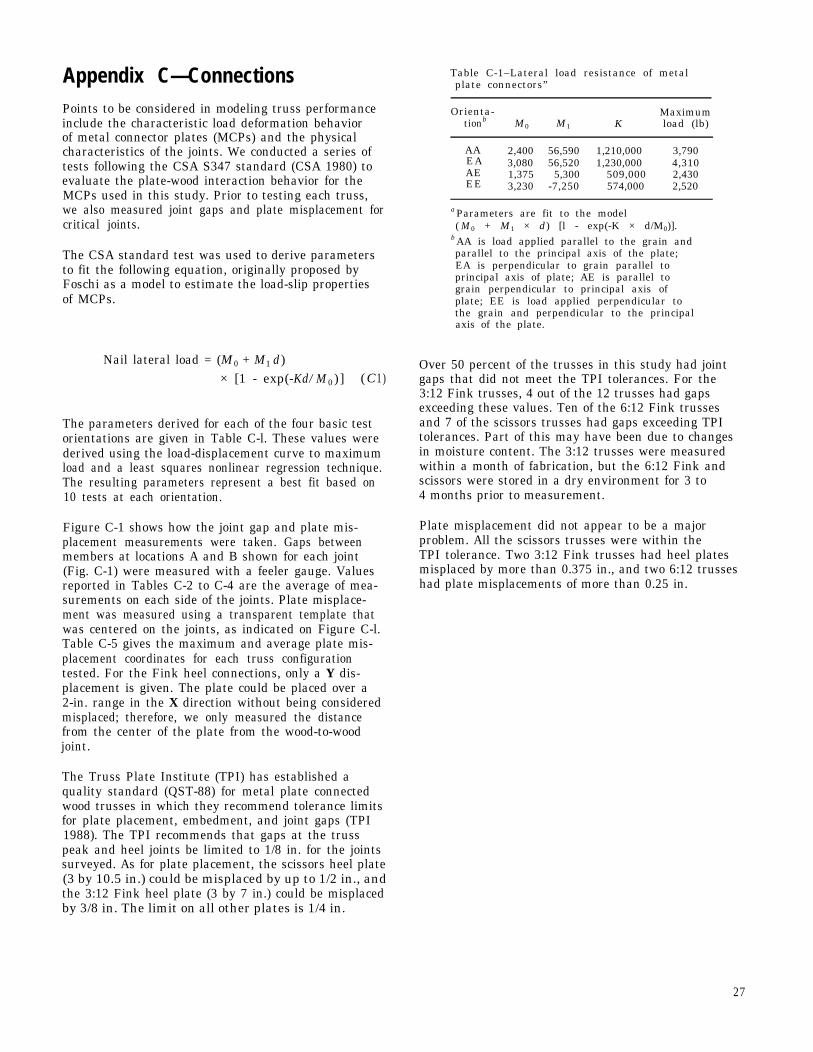
Appendix C—ConnectionsPoints to be considered in modeling truss performanceinclude the characteristic load deformation behaviorof metal connector plates (MCPs) and the physicalcharacteristics of the joints. We conducted a series oftests following the CSA S347 standard (CSA 1980) toevaluate the plate-wood interaction behavior for theMCPs used in this study. Prior to testing each truss,we also measured joint gaps and plate misplacement forcritical joints.
The CSA standard test was used to derive parametersto fit the following equation, originally proposed byFoschi as a model to estimate the load-slip propertiesof MCPs.
Nail lateral load = (M0 + M1 d)× [1 - exp(-Kd/M0) ] (C1)
The parameters derived for each of the four basic testorientations are given in Table C-l. These values werederived using the load-displacement curve to maximumload and a least squares nonlinear regression technique.The resulting parameters represent a best fit based on10 tests at each orientation.
Figure C-1 shows how the joint gap and plate mis-placement measurements were taken. Gaps betweenmembers at locations A and B shown for each joint(Fig. C-1) were measured with a feeler gauge. Valuesreported in Tables C-2 to C-4 are the average of mea-surements on each side of the joints. Plate misplace-ment was measured using a transparent template thatwas centered on the joints, as indicated on Figure C-l.Table C-5 gives the maximum and average plate mis-placement coordinates for each truss configurationtested. For the Fink heel connections, only a Y dis-placement is given. The plate could be placed over a2-in. range in the X direction without being consideredmisplaced; therefore, we only measured the distancefrom the center of the plate from the wood-to-woodjoint.
The Truss Plate Institute (TPI) has established aquality standard (QST-88) for metal plate connectedwood trusses in which they recommend tolerance limitsfor plate placement, embedment, and joint gaps (TPI1988). The TPI recommends that gaps at the trusspeak and heel joints be limited to 1/8 in. for the jointssurveyed. As for plate placement, the scissors heel plate(3 by 10.5 in.) could be misplaced by up to 1/2 in., andthe 3:12 Fink heel plate (3 by 7 in.) could be misplacedby 3/8 in. The limit on all other plates is 1/4 in.
Table C-1–Lateral load resistance of metalplate connectors”
Orienta-tionb M0 M1
MaximumK load (lb)
AA 2,400 56,590 1,210,000 3,790EAAE
3,080 56,520 1,230,000 4,3101,375 5,300 509,000 2,430
EE 3,230 -7,250 574,000 2,520
a Parameters are fit to the model( M0 + M1 × d) [l - exp(-K × d/M0)].
b AA is load applied parallel to the grain andparallel to the principal axis of the plate;EA is perpendicular to grain parallel toprincipal axis of plate; AE is parallel tograin perpendicular to principal axis ofplate; EE is load applied perpendicular tothe grain and perpendicular to the principalaxis of the plate.
Over 50 percent of the trusses in this study had jointgaps that did not meet the TPI tolerances. For the3:12 Fink trusses, 4 out of the 12 trusses had gapsexceeding these values. Ten of the 6:12 Fink trussesand 7 of the scissors trusses had gaps exceeding TPItolerances. Part of this may have been due to changesin moisture content. The 3:12 trusses were measuredwithin a month of fabrication, but the 6:12 Fink andscissors were stored in a dry environment for 3 to4 months prior to measurement.
Plate misplacement did not appear to be a majorproblem. All the scissors trusses were within theTPI tolerance. Two 3:12 Fink trusses had heel platesmisplaced by more than 0.375 in., and two 6:12 trusseshad plate misplacements of more than 0.25 in.
27

Figure C-1—Plate misplacement and joint gap measurements. Transparent template wasplaced over the joint. Plate misplacement was read on a scale marked in 0.1-in. increments.(ML90 5384)
28

Table C-2—Joint gaps for 3:12 trusses measured prior to testing
Trussb
Gap measurements (in.)”South South North Northtop- bottom- bottom top
South chord chord chord chord Northheel node node node node heel
Side A B A B A B Peak B A B A B A
T31
T32
T33
T34
T35
T36
T37
T38
T39
T3A
T3B
T3C
AverageCOVc (%)
EastWestEastWestEastWestEastWestEastWestEastWestEastWestEastWestEastWestEastWestEastWestEastWest
0.08 0.08 0.10 0.05 0.09 0.08 0.04 0.08 0.03 0.03 0.07 0.07 0.020.03 0.05 0.10 0.04 0.04 0.06 0.13 0.02 0.06 0.02 0.06 0.07 0.010.07 0.05 0.11 0.07 0.07 0.14 0.07 0.07 0.06 0.08 0.06 0.14 0.050.07 0.07 0.12 0.07 0.07 0.11 0.02 0.03 0.06 0.06 0.04 0.00 0.050.03 0.09 0.07 0.02 0.09 0.07 0.09 0.05 0.09 0.07 0.11 0.09 0.090.02 0.06 0.06 0.02 0.02 0.03 0.08 0.03 0.06 0.04 0.07 0.07 0.070.06 0.09 0.12 0.08 0.05 0.09 0.03 0.09 0.03 0.02 0.08 0.10 0.060.05 0.06 0.07 0.02 0.03 0.09 0.01 0.06 0.04 0.02 0.06 0.06 0.060.02 0.04 0.12 0.09 0.04 0.04 0.04 0.10 0.06 0.07 0.09 0.05 0.020.03 0.03 0.06 0.03 0.04 0.04 0.04 0.04 0.03 0.03 0.11 0.03 0.020.01 0.06 0.15 0.08 0.12 0.09 0.04 0.06 0.07 0.06 0.14 0.03 0.020.01 0.06 0.08 0.03 0.04 0.06 0.06 0.04 0.07 0.05 0.11 0.03 0.020.17 0.14 0.11 0.04 0.08 0.03 0.13 0.10 0.06 0.04 0.08 0.11 0.070.03 0.04 0.06 0.02 0.03 0.06 0.05 0.02 0.07 0.03 0.08 0.07 0.050.05 0.09 0.11 0.05 0.07 0.06 0.04 0.07 0.06 0.07 0.15 0.12 0.020.11 0.07 0.11 0.05 0.10 0.09 0.06 0.06 0.04 0.04 0.12 0.11 0.020.12 0.08 0.12 0.06 0.09 0.14 0.02 0.09 0.07 0.07 0.12 0.06 0.160.04 0.05 0.09 0.03 0.06 0.09 0.00 0.05 0.07 0.07 0.11 0.11 0.110.05 0.16 0.13 0.03 0.09 0.08 0.03 0.07 0.06 0.05 0.10 0.09 0.020.04 0.13 0.14 0.02 0.05 0.06 0.02 0.05 0.06 0.04 0.08 0.09 0.100.07 0.07 0.13 0.06 0.09 0.07 0.04 0.09 0.05 0.07 0.14 0.08 0.080.05 0.05 0.13 0.05 0.09 0.07 0.02 0.08 0.09 0.08 0.14 0.08 0.060.05 0.06 0.14 0.08 0.09 0.05 0.07 0.12 0.08 0.05 0.12 0.11 0.040.06 0.05 0.09 0.04 0.05 0.07 0.11 0.05 0.07 0.03 0.06 0.09 0.050.05 0.07 0.10 0.05 0.07 0.07 0.05 0.06 0.06 0.05 0.09 0.08 0.0567 45 26 47 40 38 68 42 27 40 32 41 70
a Gap measurements:Heel joints: measurements taken at four corners of top-chord/bottom-chord interface.Top-chord nodes: measurements at four corners of web/top-chord interface.Bottom-chord nodes: measurements at compression web/bottom-chord interface and web-web interface.Peak: measurements at two sides of top-chord/top-chord interface.Plate misplacement measurements:Tension web-chord connect: measurements indicate distance from center of joint tocentroid of plate.Heel connections: measurements indicate the vertical distance from plate centroidto joint interface.
b Average gap width = 0.09 in.c Coefficient of variation.
29

Table C-3—Joint gaps for 6:12 trusses measured prior to testing
Trussb
Gap measurements (in.)a
South South North Northtop- bottom- bottom top
South chord chord chord chord Northheel node node node node heel
Side A B A B A B Peak B A B A B A
T61
T62
T63
T64
T65
T66
T67
T68
T69
T6A
T6B
T6C
AverageCOVc (%)
EastWestEastWestEastWestEastWestEastWestEastWestEastWestEastWestEastWestEastWestEastWestEastWest
0.070 0.070 0.090 0.039 0.029 0.090 0.074 0.132 0.070 0.057 0.105 0.110 0.1110.054 0.066 0.074 0.074 0.020 0.090 0.051 0.057 0.054 0.020 0.054 0.090 0.0920.074 0.057 0.090 0.090 0.090 0.119 0.035 0.104 0.046 0.015 0.042 0.074 0.1290.054 0.074 0.051 0.051 0.057 0.099 0.053 0.061 0.046 0.042 0.075 0.105 0.1290.085 0.045 0.126 0.091 0.060 0.062 0.126 0.075 0.050 0.020 0.034 0.075 0.1070.062 0.045 0.058 0.021 0.031 0.045 0.108 0.060 0.039 0.029 0.075 0.021 0.0360.090 0.090 0.088 0.037 0.035 0.074 0.132 0.054 0.031 0.036 0.087 0.039 0.0390.019 0.064 0.037 0.000 0.010 0.057 0.132 0.037 0.010 0.000 0.043 0.039 0.0390.133 0.133 0.050 0.036 0.090 0.031 0.066 0.121 0.027 0.015 0.058 0.048 0.0300.110 0.105 0.046 0.036 0.030 0.031 0.066 0.045 0.043 0.029 0.048 0.031 0.0300.085 0.066 0.066 0.056 0.057 0.090 0.000 0.119 0.031 0.020 0.066 0.035 0.0970.052 0.035 0.056 0.056 0.015 0.074 0.000 0.074 0.165 0.013 0.051 0.165 0.1650.105 0.132 0.074 0.035 0.057 0.070 0.035 0.105 0.031 0.031 0.066 0.124 0.0600.109 0.057 0.074 0.035 0.039 0.070 0.000 0.074 0.054 0.000 0.029 0.029 0.0000.057 0.057 0.058 0.027 0.045 0.045 0.058 0.018 0.050 0.033 0.075 0.075 0.0750.054 0.054 0.058 0.027 0.031 0.058 0.058 0.090 0.050 0.010 0.042 0.065 0.0860.132 0.045 0.075 0.060 0.036 0.060 0.119 0.119 0.039 0.033 0.091 0.060 0.0750.090 0.060 0.033 0.033 0.033 0.075 0.090 0.075 0.020 0.010 0.033 0.060 0.0750.126 0.108 0.060 0.030 0.050 0.144 0.075 0.147 0.050 0.023 0.060 0.075 0.0540.050 0.108 0.060 0.010 0.033 0.132 0.060 0.126 0.075 0.011 0.060 0.075 0.1650.165 0.020 0.051 0.035 0.080 0.080 0.051 0.093 0.058 0.031 0.079 0.034 0.0460.057 0.000 0.051 0.035 0.010 0.080 0.029 0.093 0.031 0.000 0.031 0.070 0.1080.165 0.165 0.070 0.047 0.074 0.074 0.090 0.074 0.020 0.010 0.057 0.057 0.0330.031 0.031 0.033 0.000 0.016 0.051 0.039 0.046 0.027 0.000 0.039 0.074 0.0740.08 0.07 0.06 0.04 0.04 0.08 0.06 0.08 0.05 0.02 0.06 0.07 0.0846 54 32 57 54 37 60 39 62 71 34 49 55
a Gap measurements:Heel joints: measurements taken at four corners of top-chord/bottom-chord interface.Top-chord nodes: measurements at four corners of web/top-chord interface.Bottom-chord nodes: measurements at compression web/bottom-chord interface and web-web interface.Peak: measurements at two sides of topchord/top-chord interface.Plate misplacement measurements:Tension web-chord connect: measurements indicate distance from center of joint tocentroid of plate.Heel connections: measurements indicate the vertical distance from plate centroidto joint interface.
b Average gap width = 0.075 in.c Coefficient of variation.
30

Table C-4—Joint gaps for scissors trusses measured prior to testing
Gap measurements (in.)a Gap measurements (in.)a
North heelb South heel North heelb South heelTruss Side A B Peak B A Truss Side A B Peak B A
TS1 East 0.165 0.165 0.057 0.045 0.057West 0.165 0.165 0.049 0.051 0.057
TS2 East 0.105 0.132 0.039 0.074 0.047West 0.105 0.132 0.015 0.039 0.074
TS3 East 0.105 0.105 0.02 0.074 0.057West 0.105 0.165 0.02 0.057 0.057
TS4 East 0.165 0.165 0.039 0.165 0.122West 0.165 0.155 0.039 0.039 0.039
TS5 East 0.074 0.09 0.064 0.064 0.09West 0.074 0.085 0.064 0.039 0.09
TS6 East 0.124 0.074 0.039 0.074 0.074West 0.124 0.09 0.039 0.074 0.09
TS7 EastWest
TS8 EastWest
TS9 EastWest
TSA Eas tWest
TSB Eas tWest
TSC EastWest
Average 0.113 0.115 0.056 0.062 0.074COVc (%) 27 37 69 45 24
0.119 0.165 0.057 0.057 0.0740.119 0.165 0.033 0.057 0.0570.132 0.119 0.132 0.07 0.070.132 0.119 0.105 0.07 0.070.105 0.044 0.09 0.09 0.090.105 0.025 0.039 0.074 0.090.119 0.119 0.119 0.057 0.0740.119 0.119 0.039 0.039 0.0740.090 0.155 0.132 0.039 0.0740.090 0.105 0 0.039 0.0740.057 0.066 0.119 0.074 0.0900.057 0.039 0 0.015 0.090
a Gap measurements: Heel joints: measurements taken at four corners of topchord/bottom-chord interface.Top-chord peak: measurements taken at top of top-chord interface.
b A reading of 0.165 signifies a gap ± 0.165 in.c Coefficient of variation.
Table C-5—Plate misplacement measurementsa
Truss
Plate misplacement (in.)b
South North Bottom-bottom- bottom- chord
chord node Peak chord node South heel peak North heelSouth Northheel X Y X Y X Y heel X Y X Y X Y
3:12 FinkMaximum 0.3 0.4 0.2 0.25 0.2 0.4 0.25 0.3Average 0.11 0.9 0.05 0.03 0.08 0.05 0.07 0.09
6:12 FinkMaximum 0.50 0.20 0.15 0.15 0.50 0.20 0.20 0.60Average 0.21 -0.02 -0.00 -0.03 0.00 -0.02 -0.02 0.19
ScissorsMaximum 0.20 0.10 0.30 0.20 0.50 0.20Average -0.03 -0.04 -0.03 -0.07 -0.02 -0.04
a Values of X and Y correspond to the coordinates of the centroid of the plate to the centroid of therecommended placement area.
b Tension web-chord connections: measurements indicate distance from center of joint to centroid of plate.Heel connections: measurements indicate the distance from plate centroid to joint interface.
31

Appendix D-Load-SharingEvaluation
Truss stiffness and strength values given in the Part Ireport by Wolfe and McCarthy (1989) are listed in Ta-bles D-1 and D-2. Trusses used in that study weredesigned to have a stiffness variability larger than ex-pected from conventional construction. Critical con-nections were made using a steel gauge heavier thannormally used to decrease the probability of connec-tion failure as a result of steel yielding. Although con-structed without gable ends, the roofs in that study didhave relatively stiff trusses placed on the ends that werenot loaded directly for the assembly load to failure.
Table D-3 gives the Load Sharing Increase Factor(LSIF) values for the Wolfe and McCarthy (1989)roof assemblies, using the same methods that wereused to derive LSIF values reported in Table 3. Thestrong connections and high stiffness variability resultedin increased average strength and increased strengthvariability. Although the trusses in the Part I reporthad lower design values than the corresponding trusses
Table D-l-Stiffness and strength for 3:12 Fink trussesa
TrussID
Failure load(lb)
Slope(lb/in) Single Assemblyb
Assemblymaximum
(lb)
3EL13L33L53L73M13M33M53M73H23H43H63H73M23H13L23M63H53L43L63M43H3AverageCOV c
( % )
3,2303,1302,9403,3304,7604,3505,0004,7605,5605,0005,2605,5603,5607,1903,6404,1706,4502,9903,4803,5705,4104,450
28
4,5205,0004,2405,0006,5405,7806,5407,3207,3208,0807,3207,320
6,26021
2,1604,2104,230
5,850 5,8505,630 5,6304,140 4,1404,210 4,2104,380 4,380
2,4404,840 4140
19 28
a Truss stiffness estimated as the elastic slope ofthe load-deflection plot. For each assembly, onlythe middle seven trusses were loaded in the assemblyload-to-failure test. Total assembly load at thetime of failure is the sum of all nine truss loads.The assembly load divided by the number of trussesloaded compared to individual truss capacity is theassembly effect.
4,140 5,320 4,660 29 133:12 Fink 4,140 5,320 4,660 29Fink 2
a Wolfe and McCarthy 1989.b Weakest truss maximum load is lowest maximum loadmeasured for any truss of the given configuration.
c 1—seven loaded trusses are assumed to carry totalapplied load.
b Failed in the assembly load to failure. 2–the free-end trusses are assumed to each carry halfcCoefficient of variation. the tributary area load of the seven loaded trusses.
in the Part II report, the average assembly strengthand minimum truss strength values were 15 percentgreater for the 3:12 assembly and 38 percent greater forthe 6:12 assembly. As a result, LSIF values calculatedfor the Part I report were about the same as thosereported in the Part II report.
Table D-2—Stiffness and strength for 6:12 Fink trussesa
Failure load
Truss Slope(lb)
ID ( lb / in) Single Assemblyb
Assemblymaximum
(lb)
6L26L36L56L76M16M26M46M76H16H26H66H76M3b
6H3b
6L1b
6M56H46L46L66M66H5AverageCOVc (%)
10,00010,00010,0009,090
14,29014,29016,67014,29016,67016,67020,00016,67011,35014,080
6,7109,900
13,5107,8708,200
12,48016,16012,800
29
6,0106,0106,4706,010
10,6309,2409,2409,240
11,0907,3908,7809,240
8,700 3,950
8,280 8,18023 18
10,0607,5608,8409,7006,3206,9807,260
7,7207,3308,7909,4306,3206,9807,2604,7706,950
24
a Truss stiffness estimated as the elastic slope ofthe load-deflection plot. Assembly load-to-failuretest-total assembly load at the time of failure isthe sum of all nine truss loads. The assembly loaddivided by the number of trusses loaded comparedto individual truss capacity is the assembly effect.
b Trusses tested to failure as a group after the roofwas tested to failure.
c Coefficient of variation.
Table D-3—The inherent Load Sharing Increase Factorvalues for two roof assembliesa
Tributaryarea load Load-sharingat failurec increase
Weakest truss (lb) (percent)maximum loadb
Truss type (lb) 1 2 1 2
32
U. S. GOVERNMENT PRINTING OFFICE:1991/543-045/20007