STRUCTURAL PERFORMANCE OF BAMBOO: CAPACITY …
109
STRUCTURAL PERFORMANCE OF BAMBOO: CAPACITY UNDER SUSTAINED LOADS AND MONOTONIC BENDING by Jennifer M. Gottron Bachelor of Science, Kent State University, 2011 TITLE PAGE Submitted to the Graduate Faculty of The Swanson School of Engineering in partial fulfillment of the requirements for the degree of Master of Science University of Pittsburgh 2014
Transcript of STRUCTURAL PERFORMANCE OF BAMBOO: CAPACITY …

STRUCTURAL PERFORMANCE OF BAMBOO:
CAPACITY UNDER SUSTAINED LOADS AND MONOTONIC BENDING
by
Jennifer M. Gottron
Bachelor of Science, Kent State University, 2011
TITLE PAGE
Submitted to the Graduate Faculty of
The Swanson School of Engineering in partial fulfillment
of the requirements for the degree of
Master of Science
University of Pittsburgh
2014
ii
COMMITTEE MEMBERSHIP PAGE
UNIVERSITY OF PITTSBURGH
SWANSON SCHOOL OF ENGINEERING
This thesis was presented
by
Jennifer M. Gottron
It was defended on
December 17, 2013
and approved by
Melissa Bilec, Ph.D., Assistant Professor
Department of Civil and Environmental Engineering
John Brigham, Ph.D., Assistant Professor
Department of Civil and Environmental Engineering
Thesis Advisor: Kent A. Harries, Ph.D., Associate Professor
Department of Civil and Environmental Engineering
University of Pittsburgh

iii
Copyright © by Jennifer M. Gottron
2014

iv
STRUCTURAL PERFORMANCE OF BAMBOO:
CAPACITY UNDER SUSTAINED LOADS AND MONOTONIC BENDING
Jennifer M. Gottron, M.S.
University of Pittsburgh, 2014
ABSTRACT
The exploration of the structural material properties of bamboo is motivated by its
potential to serve as an alternative sustainable building material. Although bamboo has been used
as a building material for thousands of years, the majority of applications do not conform to any
standard design criteria and are therefore considered to be non-, or at best marginally-engineered
construction. Nonetheless, as a result of the composite-like structure of bamboo, its mechanical
properties are generally superior to those of other natural materials such as timber. The current
research addresses the capacity of bamboo under sustained loads and monotonic bending. The
sustained loads intend to develop an understanding of the material creep behavior. The effects of
creep on radially-cut clear bamboo specimens will be evaluated based on a series of parameters,
mainly the ratio of the ultimate load applied to specimen and the orientation of the specimen with
respect to the fiber gradation. Specimens were subject to sustained loads for a period of 90 days.
Following 10 days of recovery, the residual capacity of the creep specimens was determined.
Significant creep-induced plastic deformations and strains were observed in the present work.
The orientation of the specimen was found to have a significant effect on both the creep behavior
and residual strength of creep-conditioned specimens. The results showed that bamboo loaded

v
with the outer culm-wall in tension (OT) generally exhibited a greater modulus of rupture but
reduced apparent modulus of elasticity and residual strength when compared to specimens with
outer culm-wall in compression (OC). Additionally the effects of creep conditioning appear to
have a strengthening effect on the residual capacity of OC specimens and a detrimental effects
on OT specimens. The results of the creep experiments met or exceeded the ASTM 6815
acceptance criteria for wood suggesting that for the structural design of bamboo, a load duration
factor similar to that used for wood may be employed.
While the creep tests explored only one species of bamboo, the culm bending tests
investigated the longitudinal shear capacity of two species. Longitudinal splitting often
dominates failure in bamboo components; longitudinal splitting in bamboo is thought to be the
result of a mixed-mode shear failure which is influenced by both Mode I tension and Mode II
shear failures. The research aimed to understand the mixed-mode shear capacity of full-culm
bamboo under four point bending by testing standard span culms with longitudinal notches at
midspan and unnotched short span culms. Each of the culm bending tests is designed to provoke
a mixed-mode shear failure. The data demonstrated a reduction in the pure Mode II capacity of
culms in the presence of Mode I component of distortion. Each of the experiments reported
maintains the ultimate goal of standardization; the data collected and results provided intend to
aid in the development of a standardized design criteria for bamboo structures.
vi
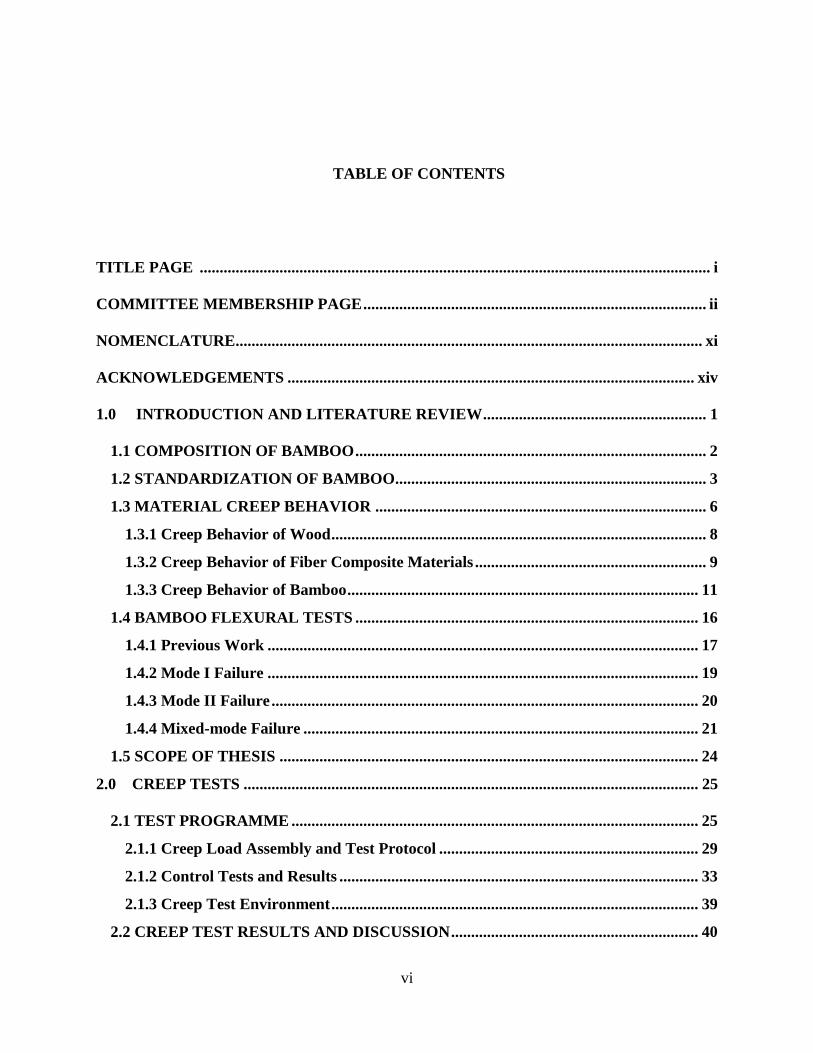
TABLE OF CONTENTS
TITLE PAGE ................................................................................................................................ i
COMMITTEE MEMBERSHIP PAGE ...................................................................................... ii
NOMENCLATURE ..................................................................................................................... xi
ACKNOWLEDGEMENTS ...................................................................................................... xiv
1.0 INTRODUCTION AND LITERATURE REVIEW ........................................................ 1
1.1 COMPOSITION OF BAMBOO ........................................................................................ 2
1.2 STANDARDIZATION OF BAMBOO.............................................................................. 3
1.3 MATERIAL CREEP BEHAVIOR ................................................................................... 6
1.3.1 Creep Behavior of Wood .............................................................................................. 8
1.3.2 Creep Behavior of Fiber Composite Materials .......................................................... 9
1.3.3 Creep Behavior of Bamboo ........................................................................................ 11
1.4 BAMBOO FLEXURAL TESTS ...................................................................................... 16
1.4.1 Previous Work ............................................................................................................ 17
1.4.2 Mode I Failure ............................................................................................................ 19
1.4.3 Mode II Failure ........................................................................................................... 20
1.4.4 Mixed-mode Failure ................................................................................................... 21
1.5 SCOPE OF THESIS ......................................................................................................... 24
2.0 CREEP TESTS .................................................................................................................. 25
2.1 TEST PROGRAMME ...................................................................................................... 25
2.1.1 Creep Load Assembly and Test Protocol ................................................................. 29
2.1.2 Control Tests and Results .......................................................................................... 33
2.1.3 Creep Test Environment ............................................................................................ 39
2.2 CREEP TEST RESULTS AND DISCUSSION .............................................................. 40

vii
2.2.1 Deflection and Strain .................................................................................................. 41
2.2.2 Apparent Young’s Modulus ...................................................................................... 43
2.2.3 Creep Strain and Relative Creep ............................................................................. 44
2.2.4 Creep Recovery ........................................................................................................... 46
2.2.5 Residual Strength ....................................................................................................... 48
2.3 DERIVED RESULTS AND DISCUSSION OF CREEP TESTS ................................. 51
2.3.1 Neutral Axis Location ............................................................................................... 51
2.3.2 ASTM D6815 Standard Criteria ............................................................................... 53
2.4 CONCLUSIONS OF CREEP TESTS ............................................................................. 59
2.4.1 Future Work ............................................................................................................... 63
3.0 CULM BENDING TESTS ................................................................................................... 65
3.1 TEST PROGRAMME ...................................................................................................... 66
3.1.1 Notched Standard-Span Culm Bending Tests ......................................................... 67
3.1.2 Modified Standard-Span Bending Re-tests .............................................................. 68
3.1.3 Short-span Culm Bending Tests ................................................................................ 69
3.1.4 Test Configuration and Protocol ............................................................................... 70
3.2 CULM BENDING TESTS RESULTS ............................................................................ 73
3.2.1 Standard Span Tests Having Notches in Constant Moment Region ..................... 73
3.2.2 Re-tests of Standard Span Tests Having Notches in Shear Span ........................... 74
3.2.3 General Notched Specimen Behavior ....................................................................... 75
3.2.3 Short Span Bending Tests .......................................................................................... 76
3.3 DISCUSSION OF CULM BENDING TESTS ............................................................... 78
3.3.1 Culm Failure Modes in Bending ............................................................................... 79
3.3 CONCLUSION OF CULM BENDING TESTS ............................................................. 82
4.0 CONCLUSIONS ................................................................................................................ 84
4.1 CREEP TEST CONCLUSIONS ...................................................................................... 84
4.1.1 Bamboo Creep: Future Work ................................................................................... 87
4.2 CULM BENDING TEST CONCLUSIONS AND FUTURE WORK .......................... 90
CITED REFERENCES .............................................................................................................. 92
viii
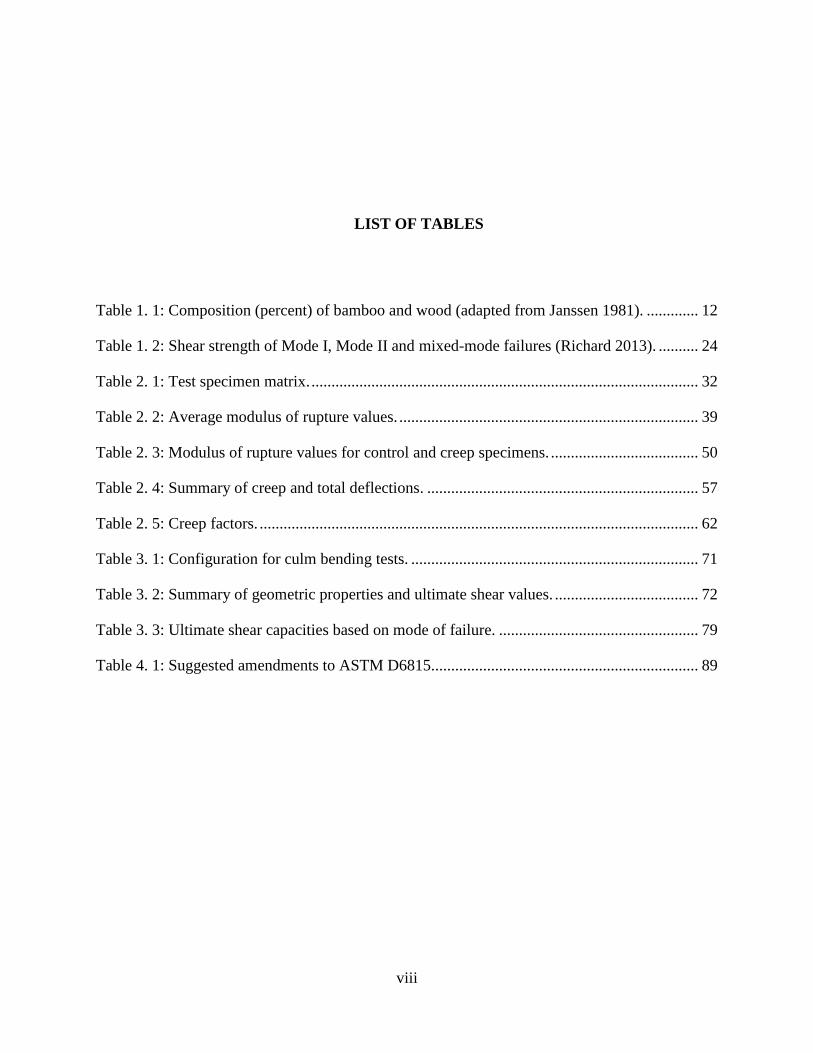
LIST OF TABLES
Table 1. 1: Composition (percent) of bamboo and wood (adapted from Janssen 1981). ............. 12
Table 1. 2: Shear strength of Mode I, Mode II and mixed-mode failures (Richard 2013). .......... 24
Table 2. 1: Test specimen matrix. ................................................................................................. 32
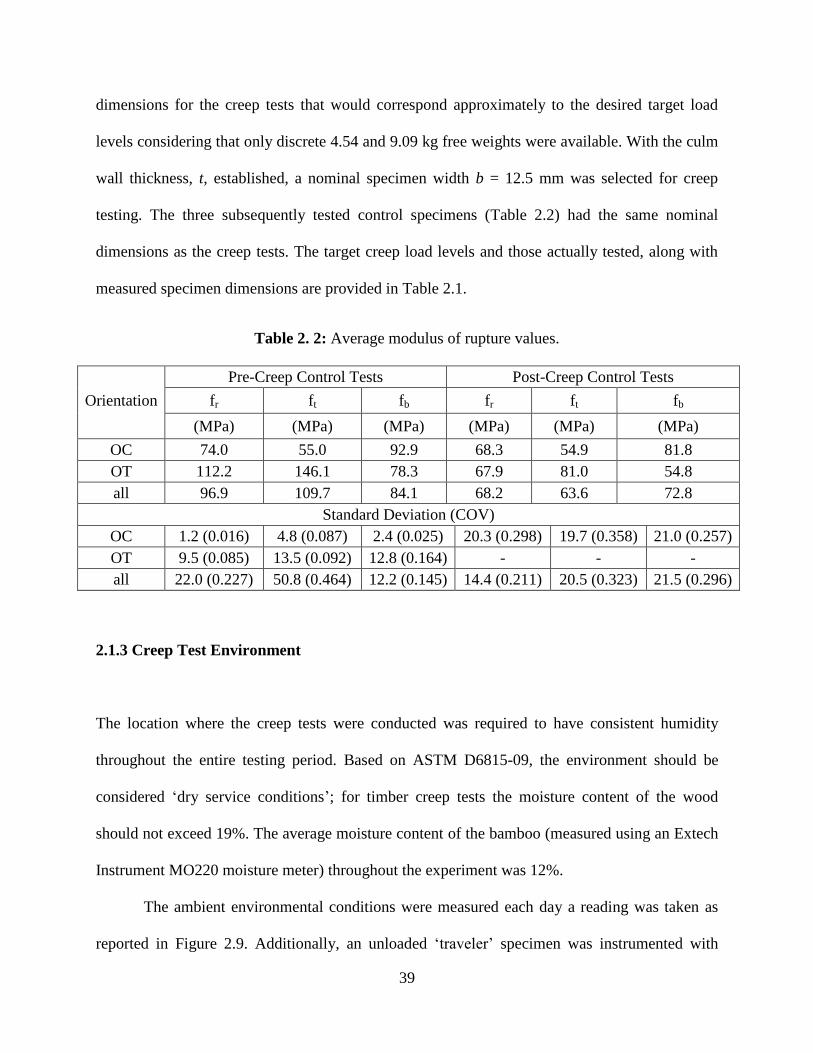
Table 2. 2: Average modulus of rupture values. ........................................................................... 39
Table 2. 3: Modulus of rupture values for control and creep specimens. ..................................... 50
Table 2. 4: Summary of creep and total deflections. .................................................................... 57
Table 2. 5: Creep factors. .............................................................................................................. 62
Table 3. 1: Configuration for culm bending tests. ........................................................................ 71
Table 3. 2: Summary of geometric properties and ultimate shear values. .................................... 72
Table 3. 3: Ultimate shear capacities based on mode of failure. .................................................. 79
Table 4. 1: Suggested amendments to ASTM D6815................................................................... 89

ix
LIST OF FIGURES
Figure 1. 1: General composition of bamboo. ................................................................................ 4
Figure 1. 2: Load duration factors for wood (adapted from ANSI, AF&PA NDS 2005). ............. 9
Figure 1. 3: Burgers model (Liu et al. 2011). ............................................................................... 12
Figure 1. 4: Displacement time-history, Truss 5 showing creep and recovery (Janssen 1981). ... 13
Figure 1.5: Elastic and creep deflection versus density of Moso bamboo (adapted from
Kanzawa et al. 2011). ............................................................................................. 15
Figure 1. 6: Longitudinal shear failure. ........................................................................................ 17
Figure 1. 7: Fracture mode definitions and corresponding test methods. ..................................... 22
Figure 2. 1: Creep specimen dimensions. ..................................................................................... 26
Figure 2. 2: Test specimen machining. ......................................................................................... 28
Figure 2. 3: Test specimen orientation. ......................................................................................... 29
Figure 2. 4: Test configuration...................................................................................................... 31
Figure 2. 5: Load versus displacement. ........................................................................................ 35
Figure 2. 6: Load versus strain. ..................................................................................................... 36
Figure 2. 7: Location of neutral axis. ............................................................................................ 36
Figure 2. 8: Typical flexural failures. ........................................................................................... 37
Figure 2. 9: Variation in environmental factors. ........................................................................... 40
Figure 2. 10: Creep deflections. .................................................................................................... 42
Figure 2. 11: Normalized creep deflections. ................................................................................. 42

x
Figure 2. 12: Creep strains. ........................................................................................................... 45
Figure 2. 13: Deformation phases in creep tests (Smith et al. 2003). ........................................... 46
Figure 2. 14: Residual strength of creep specimens. .................................................................... 49
Figure 2. 15: MOR of post-creep specimens versus level of sustained load. ............................... 51
Figure 2. 16: Representative locations of neutral axis for specified load and orientation. ........... 52
Figure 2. 17: Definitions of deflections, creep rate and fractional creep rate (ASTM D6815). ... 56
Figure 2. 18: Representative deflection plots of creep specimens. ............................................... 56
Figure 2. 19: Creep trends within specified orientations. ............................................................. 60
Figure 3. 1: Full-culm bending test arrangement (Richard 2013). .............................................. 67
Figure 3. 2: Longitudinal notch and strain gages on standard-span culm. .................................. 68
Figure 3. 3: Short span culm configuration. ................................................................................. 71
Figure 3. 4: Shear stress versus strain in standard span culms. .................................................... 75
Figure 3. 5: Examples of failure at location of notch. .................................................................. 76
Figure 3. 6: Shear stress versus strain in short culm tests. ............................................................ 77
Figure 3. 7: Observed tension failure modes of Tre Gai culms. ................................................... 80
Figure 3. 8: Observed compression failure modes........................................................................ 81
Figure 3. 9: Observed shear failures of Moso culms. ................................................................... 81
xi
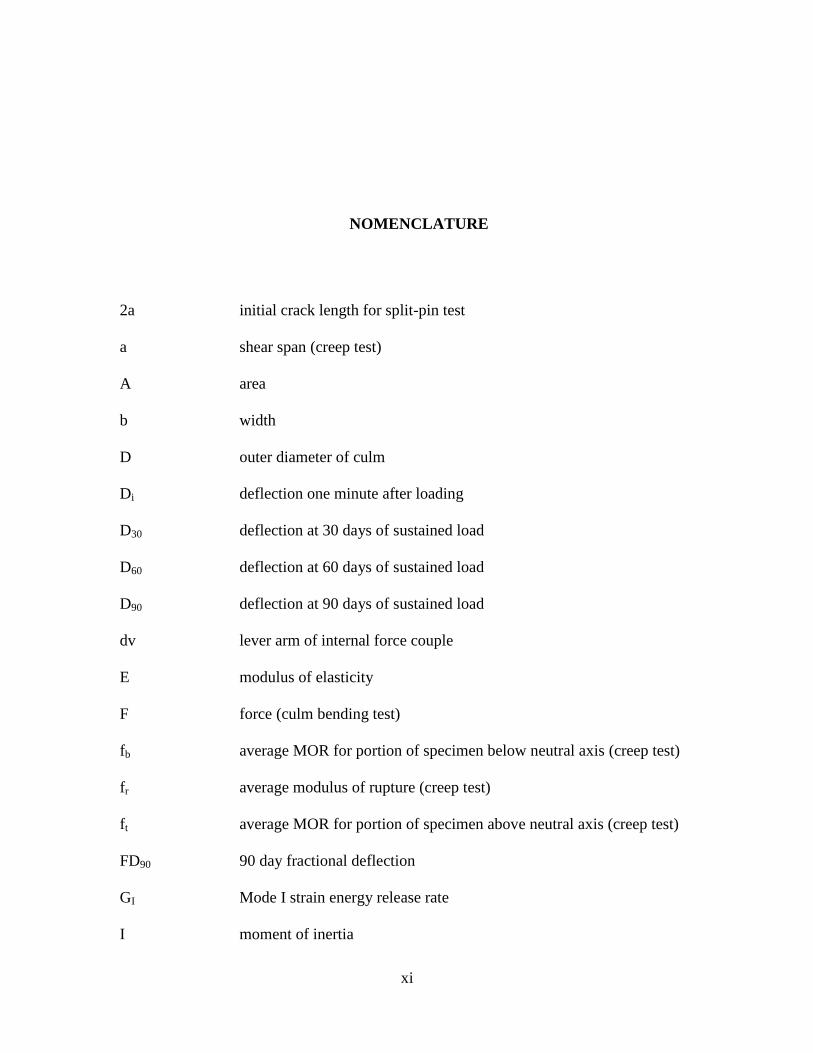
NOMENCLATURE
2a initial crack length for split-pin test
a shear span (creep test)
A area
b width
D outer diameter of culm
Di deflection one minute after loading
D30 deflection at 30 days of sustained load
D60 deflection at 60 days of sustained load
D90 deflection at 90 days of sustained load
dv lever arm of internal force couple
E modulus of elasticity
F force (culm bending test)
fb average MOR for portion of specimen below neutral axis (creep test)
fr average modulus of rupture (creep test)
ft average MOR for portion of specimen above neutral axis (creep test)
FD90 90 day fractional deflection
GI Mode I strain energy release rate
I moment of inertia
xii
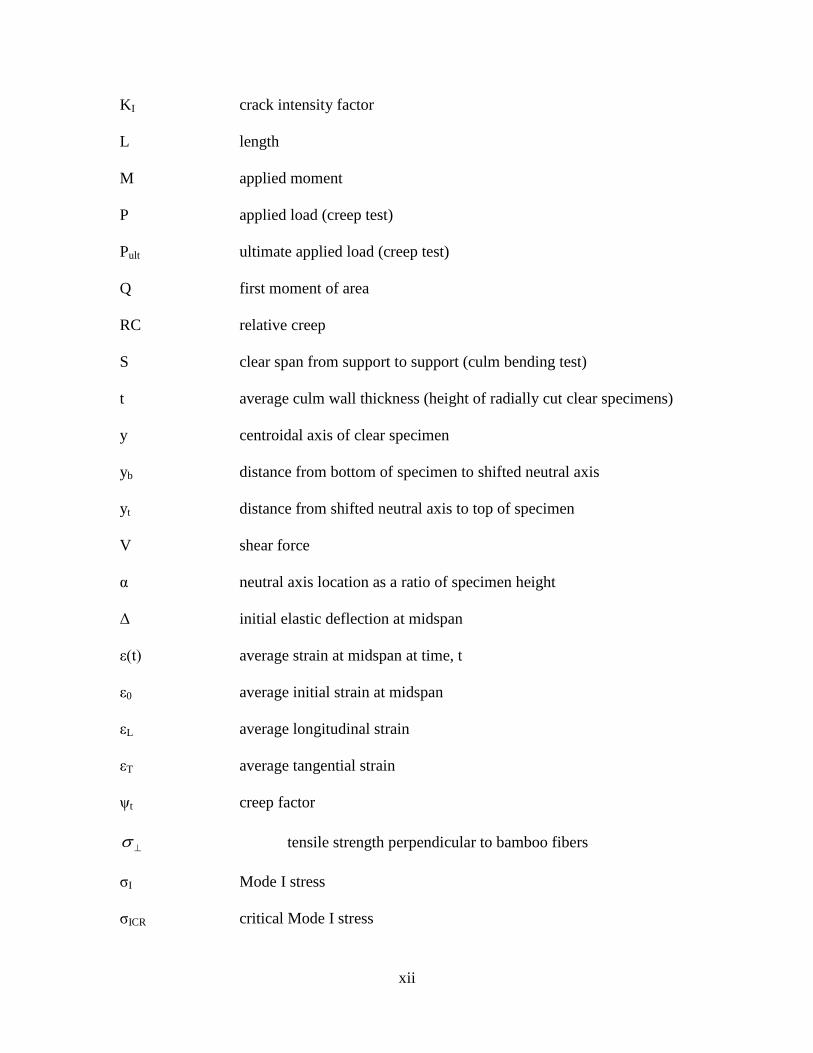
KI crack intensity factor
L length
M applied moment
P applied load (creep test)
Pult ultimate applied load (creep test)
Q first moment of area
RC relative creep
S clear span from support to support (culm bending test)
t average culm wall thickness (height of radially cut clear specimens)
y centroidal axis of clear specimen
yb distance from bottom of specimen to shifted neutral axis
yt distance from shifted neutral axis to top of specimen
V shear force
α neutral axis location as a ratio of specimen height
Δ initial elastic deflection at midspan
ε(t) average strain at midspan at time, t
ε0 average initial strain at midspan
εL average longitudinal strain
εT average tangential strain
ψt creep factor
tensile strength perpendicular to bamboo fibers
σI Mode I stress
σICR critical Mode I stress
xiii
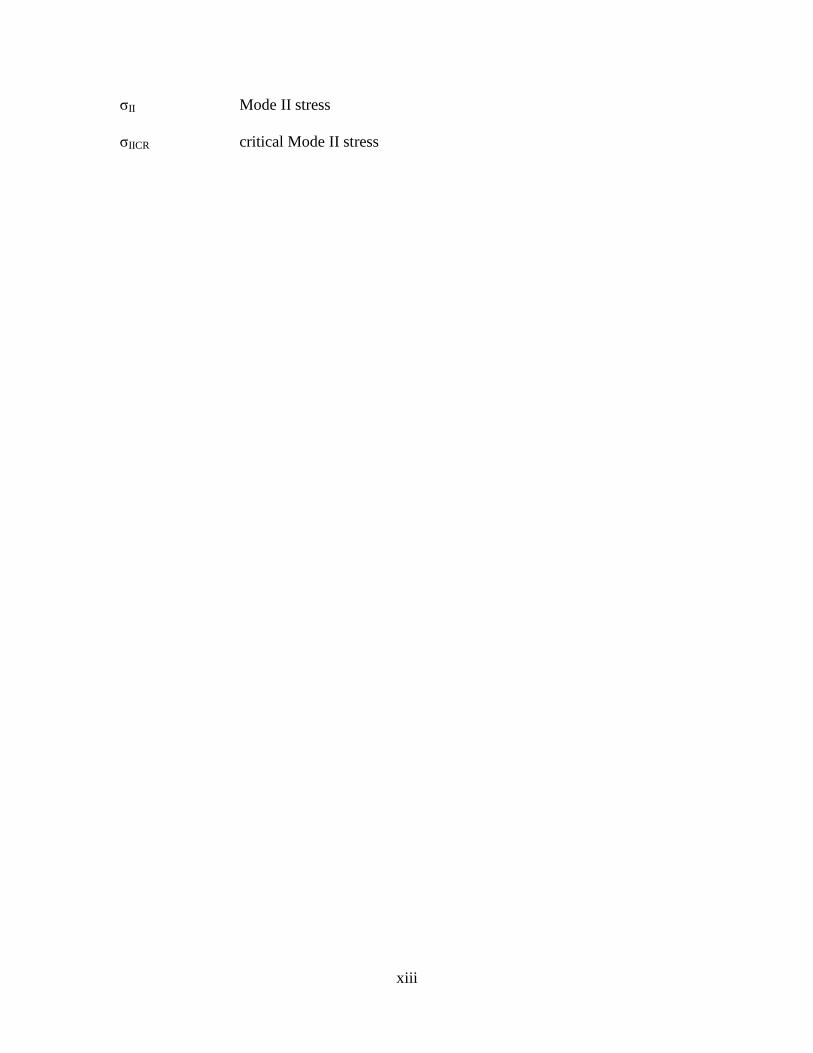
σII Mode II stress
σIICR critical Mode II stress

xiv
ACKNOWLEDGEMENTS
I would like to thank Dr. Kent Harries for his unwavering guidance and support in the
undertaking of the current research. The opportunity to work with and learn from an experienced
mentor was sincerely inspiring. Additionally, the research could not have been completed
without the help of many others that I would like to acknowledge:
Charles “Scooter” Hager, CEE lab technician, for bringing all ideas to life with his expertise
in the structural engineering laboratory.
Committee members, Dr. Melissa Bilec and Dr. John Brigham, for their time, dedication and
input in the development of the research.
Dr. Mike Richard for his tremendous guidance and assistance in the development of an
interest in bamboo structures and research in general.
Dr. Bhavna Sharma and Dr. Qingfeng Xu for sharing their knowledge of bamboo and for the
research that they have contributed to the field.
The 2013 IRES students, Logan Platt, and Dr. Harries’ research group for their much
appreciated assistance in the lab.
Watkins-Haggart Structural Engineering Lab for providing the tools to complete the research.
Family and friends for their absolute support and encouragement throughout the entire
process.

1
1.0 INTRODUCTION AND LITERATURE REVIEW
The exploration of the structural material properties of bamboo is motivated by its potential to
serve as an alternative sustainable building material. Although bamboo has been used as a
building material for thousands of years, the majority of applications do not abide by any
standard design criteria. In this context, bamboo construction is considered to be non-, or at best
marginally-engineered construction. The lack of standardization is partially due to the economic
and technical environment of the regions where bamboo is naturally abundant. The desire to
develop standardization for bamboo as a building material is inspired by its generally excellent
material characteristics. As a result of the composite-like structure of the bamboo, its mechanical
properties are generally superior to those of other natural materials such as timber. Bamboo’s
availability and relatively rapid growth rate also make it a rapidly renewable resource. In
addition to its renewability, the manufacturing process requires less energy and produces less
waste than conventional building materials such as steel and concrete. Sharma (2013) introduces
the obstacle of the association of bamboo with lower social classes. In developing countries
bamboo is considered a “poor-man’s material” while conventional building materials such as
concrete establish a higher social status. Interestingly, the stigma against bamboo construction
may be partially mitigated by “engineering acceptance,” that is, standardization.

2
1.1 COMPOSITION OF BAMBOO
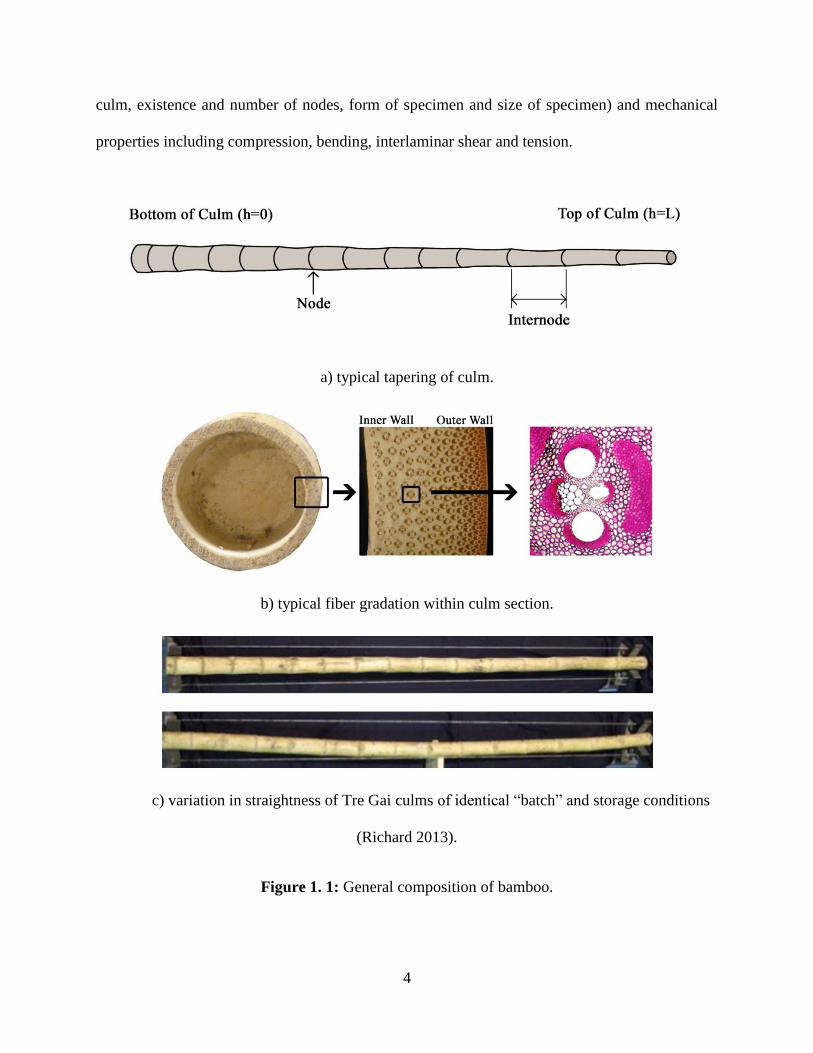
The geometry of bamboo presents an additional interest in the studies of its mechanical
properties. The culm is often tapered, and many geometrical characteristics change over the
height of the culm. Typically, both the thickness of the wall and the outer diameter decrease as
one moves from the bottom to the top of an individual culm. Additionally, the length of the
internode often increases with height (Fig 1.1a). This geometry results from the necessity that the
top of the culm must remain more flexible than the bottom in its natural environment. The
difference in flexibility allows for the bamboo to resist natural forces, such as wind, while
maintaining the ability to support itself over very tall heights. The position along the culm also
affects the material properties for these reasons.
In addition to the geometry of bamboo, the smaller-scale composition (i.e. fiber volume
ratio and density) of bamboo also affects the performance of the material. The fibers within the
bamboo are a vital factor when considering the capabilities of the material as a structural
member. The fiber density in the cross section of a culm increases towards its outer edges (Fig
1.1b). The gradation of the fibers occurs naturally due to the growth pattern of bamboo. As in
engineered composites, the fibers are much stronger than the matrix, and rarely govern failure.
The highly isotropic nature of the fibers makes bamboo susceptible to orientation of loading
(Janssen 1981). More specifically, the material is much weaker in its transverse direction,
restricting its structural capabilities and applications to a certain degree.
Another geometric factor affecting structural applications of bamboo is the straightness
of the culm (Fig 1.1c). The severity of the out-of-straightness of bamboo culms may affect their

3
mechanical properties in addition to their structural performance. Although it has not been
thoroughly studied, it is also known that the nodes affect the performance of bamboo. The
majority of the culm is made up of internode sections in which the fibers are primarily
unidirectional: parallel to the culm. However, because the primarily unidirectional fibers change
direction at the node, the node may enhance, impair or simply maintain the specimen’s ability to
carry a load, depending on the type of load applied. For example, Arce-Villalobos (1993) found
the tensile strength at the node to be 80% of the tensile strength at the internode. However, tests
suggest that the existence of a node has little effect on the specimen’s compressive strength
(Janssen 1981; Limaye 1952; Sekhar and Rawat 1956). Janssen (1981) and Mitch (2009) each
performed experiments indicating shear strength to have increased values in nodal regions.
Similar to the culm’s changing geometry and microstructure, the straightness and location of
nodes must also be considered in the analysis of material properties. Each of the compositional
elements considered may have effects on the overall performance of the culm depending on
species. Richard (2013) provides a thorough discussion of the nature and composition of
bamboo.
1.2 STANDARDIZATION OF BAMBOO
The International Organization for Standardization (ISO) developed a series of documents to
provide standards for bamboo material tests (ISO 2004a) and a model code for design (ISO
2004b). The guidelines within the material test standard address the process of determining only
certain physical (percentage of fibers, weight by volume, moisture content, position along the
4
culm, existence and number of nodes, form of specimen and size of specimen) and mechanical
properties including compression, bending, interlaminar shear and tension.
a) typical tapering of culm.
b) typical fiber gradation within culm section.
c) variation in straightness of Tre Gai culms of identical “batch” and storage conditions
(Richard 2013).
Figure 1. 1: General composition of bamboo.

5
Although standardization of bamboo is essential to the adoption and development of the
material as an engineered building material, many challenges remain. One major burden in the
standardization process is the difference in mechanical properties from species to species. The
fact that physical characteristics vary between species leads to difficulty in establishing empirical
values or relationships. Also contributing to the variation in mechanical properties is the effect of
geometric variation and culm orientation relative to applied loads. Orientation of both full-culm
and partial-culm specimens are affected by the composition of the fibers. In full-culm tests, the
direction of the fibers in relation to the load will generate very different results. For example,
compressive and tensile strengths of bamboo are more than an order of magnitude greater when
applied parallel to the fibers as opposed to in a transverse manner (Mitch 2010). On a smaller
scale, specimens that have been cut from a portion of the culm wall mask the effects of the fiber
gradation (Richard 2013). Although advantageous in certain circumstances, the inconsistency of
material properties through the wall thickness develops another variable to be considered in
material characterization, design and eventual standardization (Fig 1.1b).
Many studies have acknowledged individual variables contributing to the strength of
bamboo. More specifically, many of the geometric variables discussed in section 1.1 have been
thoroughly analyzed by researchers. Experiments have suggested that the top of a culm (younger
material) has better mechanical properties than the bottom of a culm (Ahmad and Kamke 2005).
The elastic modulus, flexural strength, impact strength and fracture toughness decrease with
culm age at harvest (Low et al. 2006). Flexural deformability is affected by the density of fibers
in tension. Fiber density near the outer wall of the bamboo culm is greater than the fiber density
at the inner wall of the culm. Whether the outer fiber density of the culm is in compression or
tension does not impact the stiffness of the specimen (Obataya et al. 2007). Many additional

6
experiments have addressed similar issues. The amount of research required in order to
generalize the effect of a certain geometric or compositional element on the strength of the
bamboo is significant. Therefore, just as any now-conventional building material once did, the
standardization of bamboo requires the commitment and collaboration of many researchers.
Aside from the composition-related obstacles, the lack of resources often limits the
opportunity to standardize bamboo. One major (and often over-looked) factor associated with
the standardization of bamboo is the necessity of practicality. Many of the countries most
inclined to utilize bamboo in structures do not have wide-spread access to the equipment or
expertise necessary to perform standard material characterization experiments. This additional
consideration has inspired the idea of field applicable tests in a portion of the bamboo studies
being conducted. Limited availability of resources leads eventually to a lack of communication
and the use of ad hoc test procedures which fail to benefit not only those already using bamboo
for building but also the advancement of bamboo as an alternative building material. Upon the
collaboration of experimental results, the idea of standardization becomes realistic.
1.3 MATERIAL CREEP BEHAVIOR
The phenomenon of creep, particularly in anisotropic and fiber-reinforced materials, is critical to
structural design. Creep is defined as the inelastic deformation of a material due to changes in the
material caused by the prolonged application of stress (Allen and Iano 2009). Creep effects, at a
minimum, have the potential to affect the serviceability of structure. A more severe issue related
to creep is its ability to alter material characteristics and subsequent mechanical properties of a
structural element or system. Eventually, excessive creep may result in the failure of a structure.

7
This is often referred to as ‘creep rupture,’ in which a structure fails under the effects of
sustained stress which fall below the elastic limit of the material.
Creep may continue until fracture occurs. Alternatively, the rate of creep deformation
may decrease and approach zero. The characteristics of creep depend on the material and the
conditions under which it is loaded. The strain that results from creep is considered plastic strain.
Additionally, if the stress in the member exceeds the elastic limit, permanent deformation occurs
and the strain in this case is also considered plastic. When load is applied, the total strain is made
up of elastic strain and plastic strain. When the specimen is unloaded, the plastic strain remains
while the elastic strain is recovered and returns to zero. For this reason, the strain associated with
creep alone is important when considering the lifespan and performance of a structural member
(Riley et al. 2002).
Although the creep of bamboo has been considered briefly in previous research
(Kanzawa 2011; Jannsen 1981), it often exists only as a supplemental experiment to some
primary study. Creep has rarely been the focus of a study, and therefore the available information
on the creep of bamboo lacks detail and often useful data. Extensive knowledge in all areas of
structural design is vital in the presentation of bamboo as an alternative building material. The
goal of the present experimental study is to develop an understanding of the capacity of bamboo
under a sustained load; the results aim to provide a platform for future experimental work
considering the creep of structural bamboo elements. By studying the phenomenon of creep on
relatable materials, wood and composites, a fundamental understanding may be developed and
hypotheses developed. The following sections develop these analogies to wood and composites.

8
1.3.1 Creep Behavior of Wood
The natural growth of bamboo results in material properties and behavior similar to those of
wood. The strengths of wood and bamboo are affected by similar variables including: a)
direction of loading in relation to the grain (fiber orientation); b) growth characteristics (i.e.
knots, growth cycles, specific gravity, etc.); c) environmental conditions (i.e. moisture content,
relative humidity, wet-dry cycles, temperature, etc.); and d) duration of load. Because of these
similarities, creep tests performed on bamboo reflect the tendencies and performance of timber
under sustained loads (Gaylord et al. 1997).
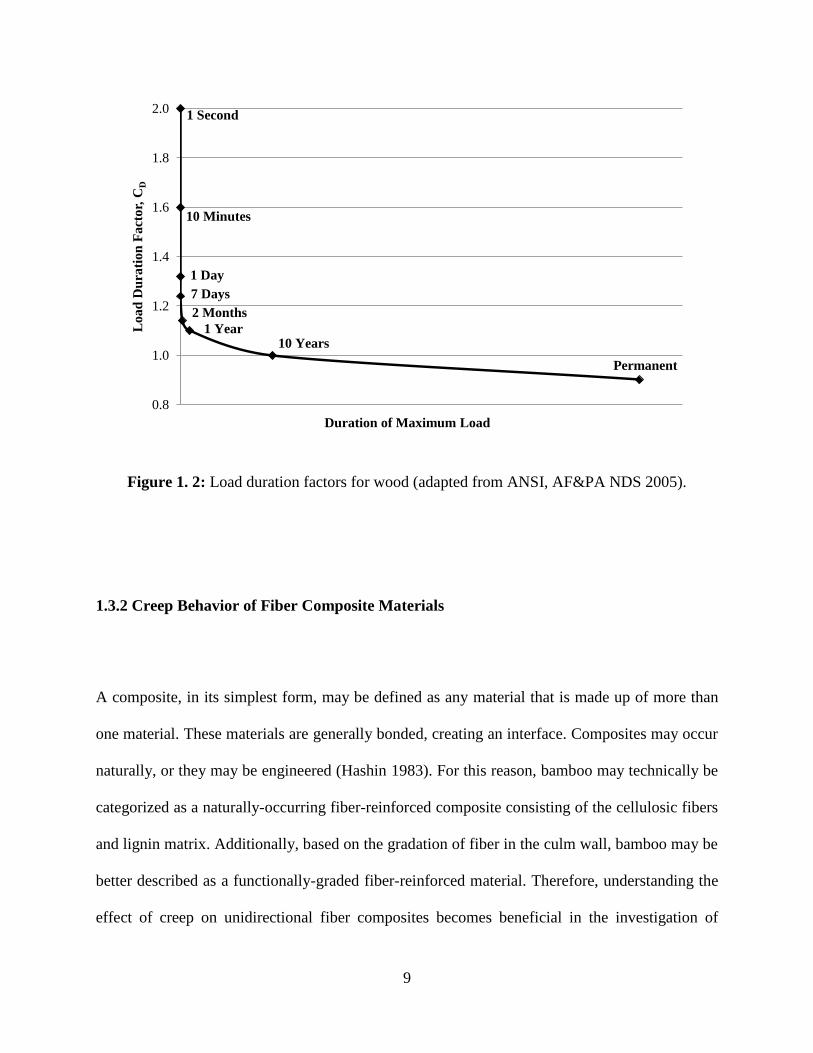
Creep is more susceptible in certain material than in others. For example, creep is
considered common in wood, requiring a number of design factors and standards (Allen and Iono
2009). In design, the effect of sustained load is considered by expressing wood strength in terms
of the wood’s ten year strength. A permanent load, for example, may be designed for 90% of the
ten year strength. Alternatively, the design for a rare impact load (by definition, not sustained)
may consider 200% of the ten year strength. By plotting these two extreme conditions in
collaboration with intermediate load cases, a more coherent visual representation of this concept
becomes apparent (Fig. 1.2). In general, the usable strength of structural wood decreases as the
duration of the load decreases.
9
Figure 1. 2: Load duration factors for wood (adapted from ANSI, AF&PA NDS 2005).
1.3.2 Creep Behavior of Fiber Composite Materials
A composite, in its simplest form, may be defined as any material that is made up of more than
one material. These materials are generally bonded, creating an interface. Composites may occur
naturally, or they may be engineered (Hashin 1983). For this reason, bamboo may technically be
categorized as a naturally-occurring fiber-reinforced composite consisting of the cellulosic fibers
and lignin matrix. Additionally, based on the gradation of fiber in the culm wall, bamboo may be
better described as a functionally-graded fiber-reinforced material. Therefore, understanding the
effect of creep on unidirectional fiber composites becomes beneficial in the investigation of
0.8
1.0
1.2
1.4
1.6
1.8
2.0
Lo
ad
Du
rati
on
Fa
cto
r, C
D
Duration of Maximum Load
1 Second
10 Minutes
1 Day
7 Days
2 Months
1 Year10 Years
Permanent

10
bamboo under a sustained load. Study of creep effects in composites often focus on the
difference in material properties of the fiber and the matrix. Similarly, creep effects consider the
structure of the fibers within the matrix (Mileiko 1971). Both the emphasis on the relationship
between the matrix and fibers and the fiber architecture translate well to the structure of bamboo.
Regardless of the specific materials that make up the matrix and reinforcement, concerns
involving the effect of sustained loads remain unchanged. Creep of a composite material relies
on the materials’ individual properties as well as the properties of the composite as a whole.
Each of the materials involved in the composite may creep individually, influencing the overall
creep of the specimen. In most cases (at least those considering loads below the elastic limit of
the material), it is assumed that the creep of the fiber is equal to the creep of the matrix.
Therefore, the creep of each individual material equals the creep of the composite as a whole.
This assumption is justifiable in composites that have continuous unidirectional fibers that run
the entire length of the composite member. This simplifying assumption is adopted in the present
work in which bamboo specimens are cut from an internode; these are expected to have
continuous fibers through their length (this is not the case for a culm containing multiple nodes).
In composites composed of short, rigid fibers, the structure must then be considered at both
micro and macro scales. It must be recognized in the case of rigid fibers that the interaction of
the separate materials impacts the susceptibility of the composite to creep. The interaction of the
materials may have positive or negative effects on the creep strength in the scenario of rigid
fibers (Lilholt 1985). The different bases for creep behavior based on the fiber architecture does
raise the question: will bamboo creep behavior differ when determined for small clear specimens
than when determined for full-culm specimens? The scope of the present work (presented in

11
Chapter 2), however, will only consider small clear1 internode specimens subject to creep. The
available research in this area is similarly limited.
Although the general reaction to sustained loads of engineered composites may be
beneficial in predicting the behavior of bamboo, the natural growth and resulting structure of
bamboo is more directly related to wood. So, while assumptions and predictions were based
partially on the research performed within the field of composite structures, the testing standards
developed for the experiment were adopted from wood design specifications.
1.3.3 Creep Behavior of Bamboo
The performance of bamboo as a structural material relies heavily on moisture content and creep.
Although creep behavior of bamboo may be susceptible to loading parallel to the fibers, loads
perpendicular to the fibers often govern general failure. Loads perpendicular to the fibers
introduce a high risk of splitting. Splitting is commonly reported as the dominant mode of failure
in bamboo members (Mitch 2010; Sharma 2010; Richard 2010).
In terms of the amount of lignin compared to the amount of cellulose, the composition of
bamboo is similar to wood (Table 1.1). In Table 1.1, the crystallinity of a material refers to the
weight fraction of crystalline cellulose, which affects the mechanical properties of cellulose
fibers. More specifically, as crystallinity increases in bamboo or wood, the Young’s modulus
also increases (Andersson et al. 2003). Additionally, the creep of bamboo relies on its viscosity,
which relies on the bamboo composition. Because of these relationships, the creep behavior of
bamboo acts similarly to that of wood, and which is typically described by the Burgers-model
1 Clear refers to a specimen free from gross strength affecting features such as knots, grain deviation, resin pockets
and irregularities in the growth ring structure as defined for clear wood by Smith et al. (2003).

12
shown in Figure 1.3 (Janssen 1981). Janssen determined the permanent plastic deformation
caused by creep in bamboo to be only 3-5% of the immediate deformation. Because of the
insignificant effects of the sustained load, Janssen deemed creep in full-culm bamboo negligible.
Although experimental evidence suggests that creep in bamboo is less than creep in wood, the
variability of bamboo processing and storage may result in creep significantly different from the
theoretical values obtained using a Burgers-model. In the present study, the drying process and
initial storage conditions of the bamboo are unknown. Nonetheless, a Burgers model will be used
to represent creep behavior. While absolute predictions may vary, it is believed that trends will
be accurately represented.
Table 1. 1: Composition (percent) of bamboo and wood (adapted from Janssen 1981).
Bamboo Deciduous Wood Conifer Wood
Cellulose 55 50 55
Other Polysacharides 20 25 15
Lignin 25 25 30
Mean Crystallinity 58 62
(a) Burgers-model (b) Creep and recovery curve
Figure 1.3: Burgers model (Liu et al. 2011).
13
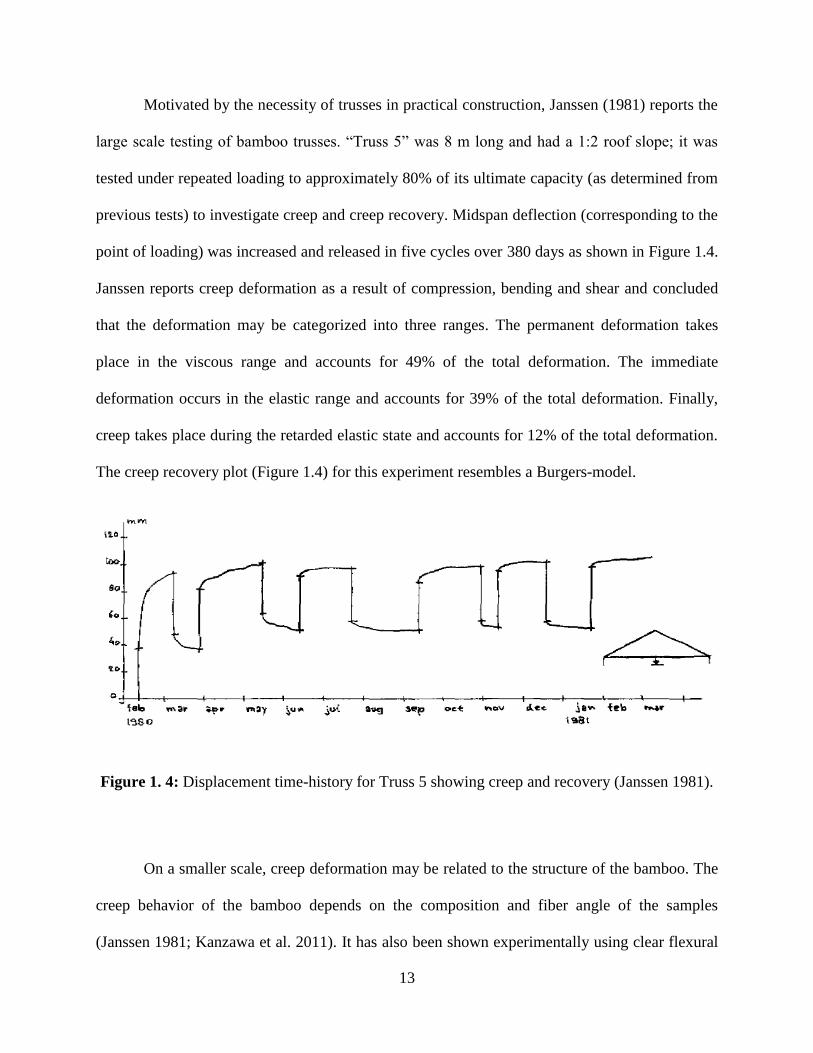
Motivated by the necessity of trusses in practical construction, Janssen (1981) reports the
large scale testing of bamboo trusses. “Truss 5” was 8 m long and had a 1:2 roof slope; it was
tested under repeated loading to approximately 80% of its ultimate capacity (as determined from
previous tests) to investigate creep and creep recovery. Midspan deflection (corresponding to the
point of loading) was increased and released in five cycles over 380 days as shown in Figure 1.4.
Janssen reports creep deformation as a result of compression, bending and shear and concluded
that the deformation may be categorized into three ranges. The permanent deformation takes
place in the viscous range and accounts for 49% of the total deformation. The immediate
deformation occurs in the elastic range and accounts for 39% of the total deformation. Finally,
creep takes place during the retarded elastic state and accounts for 12% of the total deformation.
The creep recovery plot (Figure 1.4) for this experiment resembles a Burgers-model.
Figure 1. 4: Displacement time-history for Truss 5 showing creep and recovery (Janssen 1981).
On a smaller scale, creep deformation may be related to the structure of the bamboo. The
creep behavior of the bamboo depends on the composition and fiber angle of the samples
(Janssen 1981; Kanzawa et al. 2011). It has also been shown experimentally using clear flexural

14
specimens that the density of bamboo affects the initial deflection more than the long term creep
of specimens (Kanzawa et al. 2011). Denser bamboo is stiffer, and therefore exhibits lower
elastic deflection than less dense bamboo. Plastic deformation, on the other hand, was not
apparently affected by fiber density. This hypothesis will be systematically tested in the present
work by conducting flexural creep tests of specimens oriented such that either their denser, fiber-
rich, outer culm wall or less dense inner culm wall are alternately placed in flexural tension.
In addition to the density, the shape of the vascular bundle has also been considered. The
bundles at the outer radius of the bamboo tend to be more oval shaped, stretched in the radial
direction (see Figure 1.1b). In contrast, the bundles located closer to the inside of the culm’s
cross section are more circular. The resulting fiber density and stiffness of the bundles due to the
increased ratio of radial diameter to tangential diameter near the outer culm wall is found to have
a less significant effect on creep deflection than on initial deflection (Kanzawa et al. 2011).
Kanzawa et al. (2011) showed experimentally, that initial deflection is more influenced
by density than long term behavior. The small clear flexural specimens used for the experiment
were cut from the full-culm in a tangential direction; the fiber gradation within each specimen is
therefore not significant though the difference in density between specimens is significant. Initial
deflection, shown in Figure 1.5, displays no difference between inner and outer portions of the
culm wall. Compliance with respect to immediate behavior is a function of density only. On the
other hand, long term creep strain (Fig. 1.5) affects less dense specimens (from the inner portion
of the culm wall) differently than it affects denser specimens (from the outer portion of the culm
wall). In all cases, creep tends to decrease as density increases. Because of this reoccurring trend,
it is expected that the specimens with the fiber density in tension will perform better than the
specimens with the fiber density in compression.

15
Figure 1. 5: Elastic and creep deflection versus density of Moso bamboo (adapted from
Kanzawa et al. 2011).
Although the primary design of the current experiment (Chapter 2) will consider the
relationship of creep and density proposed by Kanzawa et al. (2011), the results of the
experiment performed by Obataya et al. (2007) are also taken into account since they are directly
related in terms of specimen orientation. Obataya et al. suggested, based on four point bending
tests of radial-cut specimens (similar to those used in the present study) that the best specimen
orientation to increase flexural strength and deformability places the outer fibers in tension and
inner fibers in compression. It is relatively well known that the specimen orientation will affect
both the elastic and plastic behavior of bamboo under an initial load. However, the discovery of
whether or not orientation affects the amount of creep experienced in bamboo specimens is of

16
interest in the present work. The results reported by Kanzawa et al. are somewhat contradictory
on this issue. Although the specimen density is clearly shown to affect both initial deflection and
creep deflection, the effect on the latter is significantly less. However, the specimen orientation
clearly results in a discontinuity in the observed data.
The current study, presented in Chapter 2, intends to further the knowledge of the creep
capacity of bamboo established by Kanzawa et al. while considering a specimen orientation
similar to that used by Obataya et al. Half of the radially cut specimens subjected to a sustained
load will be oriented so that the fiber density of the outer culm wall is in tension. The remaining
specimens will be loaded so that the dense outer culm wall is in compression.
1.4 BAMBOO FLEXURAL TESTS
Four point bending tests of full-culm bamboo are one test standardized in the ISO bamboo
materials test methods document (ISO 2004b). This standard test was based on the work and
recommendations of Janssen (1981). In this test, failure is referred to as being flexural and the
“modulus of rupture” or “flexural modulus” is calculated. In general, however, this is technically
incorrect. Most full-culm bamboo, whether tested in flexure in the laboratory or performing in
situ tends to exhibit a splitting mode of failure associated with longitudinal shear failure (Fig
1.6). This mode of failure has been the focus of much work conducted at the University of
Pittsburgh (Mitch 2010; Sharma 2010; Richard 2013).
Longitudinal splitting occurs in bamboo for several reasons. The primary contributions to
splitting include the weakness of the lignin matrix and inherent flaws (i.e. cracks from drying
shrinkage, harvesting damage, etc.). Additionally, splitting is often initiated at connections, most

17
significantly at simple through-bolted connections (Fig. 1.6b) and at culm ends. It is believed
that splitting or longitudinal shear failure is the most critical failure mode associated with many
bamboo structural applications and methods of culm connection.
a) occurring in research b) occurring in practice (Sharma 2010)
Figure 1. 6: Longitudinal shear failure.
1.4.1 Previous Work
Richard (2013) initiated the investigation of longitudinal shear failure in bamboo culms under
four point bending at the University of Pittsburgh. Among his conclusions were areas for
potential future work including the need to consider short span culm bending tests and standard-
span culm bending tests with longitudinal notches; both of which are addressed in this work in
Chapter 3.
The ISO standard for full-culm flexure prescribes a specimen length at least thirty times
the culm diameter based on the critical values for lateral strain. This length was determined
theoretically by Vaessen and Janssen (1997) based on the specimen length resulting in
simultaneous failure due to bending and shear stresses. In theory, at a shear span-to-depth ratio

18
of approximately 8.67, corresponding to a four point bending specimen length of 26D (where D
is the culm diameter), failure due to maximum bending stress occurs in the compression zone
while failure due to maximum shear stress occurs at the neutral axis. Thus to develop a flexural
capacity, specimens having a span-to-depth ratio exceeding 10 (culm length of 30D) are
recommended. This approach, however, neglects the apparently longitudinal shear-critical nature
of full-culm bamboo in practice. Thus shorter shear spans may reveal more relevant material
behaviors.
Two types of beam tests are conducted in the present work (Chapter 3) as a continued
exploration of the longitudinal splitting behavior of bamboo beams; both short span specimens
and specimens having longitudinal notch are considered. The procedure closely followed that
developed by Richard, who tested standard 30D specimens with and without vertical notches, so
that results may be directly compared. A brief summary of the results from Richard’s work is
presented below in order to familiarize readers with the background for the current experiments.
Specific data from Richard’s tests will be presented in Chapter 3 as required.
The initial set of tests conducted by Richard studied four scenarios: a) pure Mode I
failure using the split pin tests developed by Mitch (2009); b) pure Mode II failure using the
‘bowtie’ test promulgated by ISO (2004a); c) full-culm mixed-mode failure investigated using
modified four point flexure tests; and d) small scale clear specimen mixed-mode failure. These
are described briefly in the following sections.
19
1.4.2 Mode I Failure
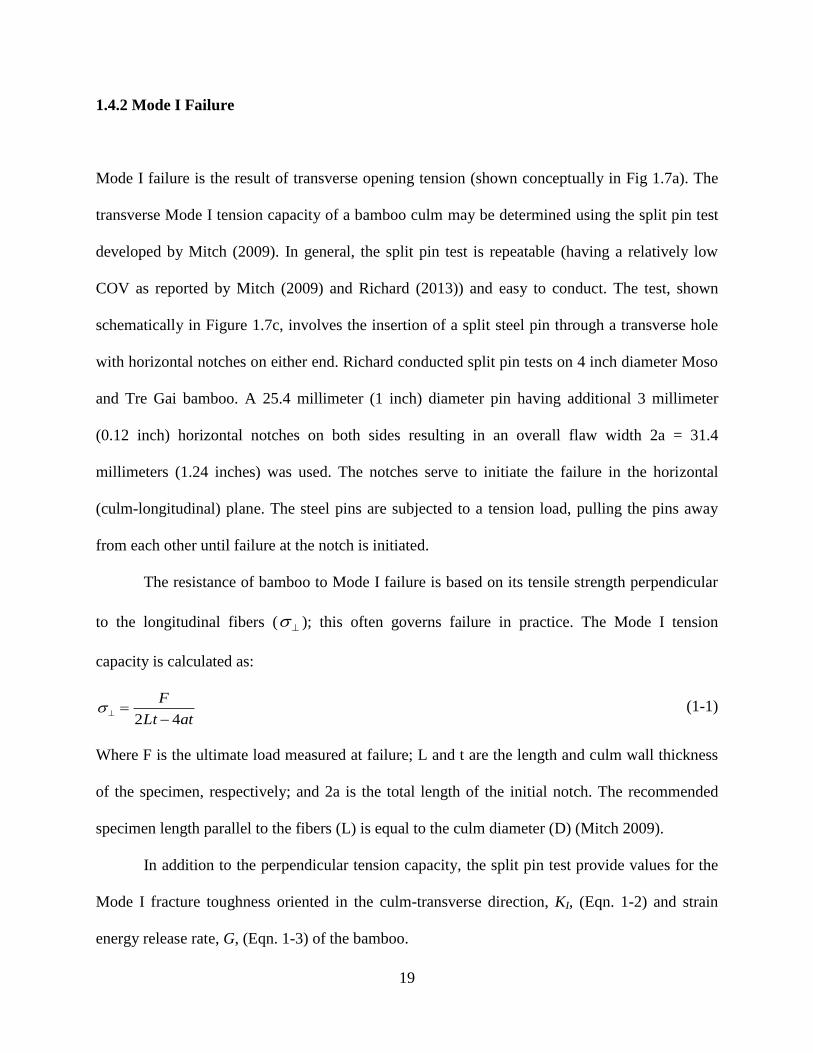
Mode I failure is the result of transverse opening tension (shown conceptually in Fig 1.7a). The
transverse Mode I tension capacity of a bamboo culm may be determined using the split pin test
developed by Mitch (2009). In general, the split pin test is repeatable (having a relatively low
COV as reported by Mitch (2009) and Richard (2013)) and easy to conduct. The test, shown
schematically in Figure 1.7c, involves the insertion of a split steel pin through a transverse hole
with horizontal notches on either end. Richard conducted split pin tests on 4 inch diameter Moso
and Tre Gai bamboo. A 25.4 millimeter (1 inch) diameter pin having additional 3 millimeter
(0.12 inch) horizontal notches on both sides resulting in an overall flaw width 2a = 31.4
millimeters (1.24 inches) was used. The notches serve to initiate the failure in the horizontal
(culm-longitudinal) plane. The steel pins are subjected to a tension load, pulling the pins away
from each other until failure at the notch is initiated.
The resistance of bamboo to Mode I failure is based on its tensile strength perpendicular
to the longitudinal fibers ( ); this often governs failure in practice. The Mode I tension
capacity is calculated as:
atLt
F
42 (1-1)
Where F is the ultimate load measured at failure; L and t are the length and culm wall thickness
of the specimen, respectively; and 2a is the total length of the initial notch. The recommended
specimen length parallel to the fibers (L) is equal to the culm diameter (D) (Mitch 2009).
In addition to the perpendicular tension capacity, the split pin test provide values for the
Mode I fracture toughness oriented in the culm-transverse direction, KI, (Eqn. 1-2) and strain
energy release rate, G, (Eqn. 1-3) of the bamboo.
20
21
tan2
L
a
a
La
Lt
FKI
(1-2)
E
KG I
I
2
(1-3)
In which E is the elastic modulus in the transverse direction. Both values are measures of the
toughness, or resistance to splitting, of the bamboo.
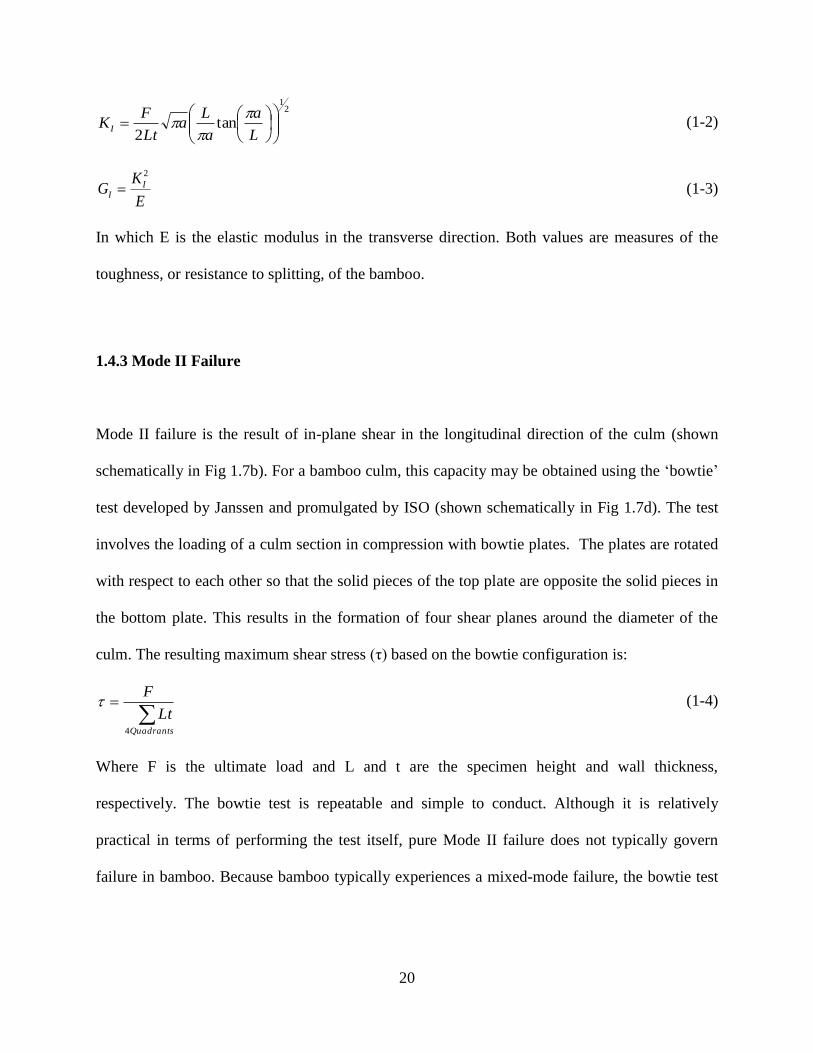
1.4.3 Mode II Failure
Mode II failure is the result of in-plane shear in the longitudinal direction of the culm (shown
schematically in Fig 1.7b). For a bamboo culm, this capacity may be obtained using the ‘bowtie’
test developed by Janssen and promulgated by ISO (shown schematically in Fig 1.7d). The test
involves the loading of a culm section in compression with bowtie plates. The plates are rotated
with respect to each other so that the solid pieces of the top plate are opposite the solid pieces in
the bottom plate. This results in the formation of four shear planes around the diameter of the
culm. The resulting maximum shear stress (τ) based on the bowtie configuration is:
Quadrants
Lt
F
4
(1-4)
Where F is the ultimate load and L and t are the specimen height and wall thickness,
respectively. The bowtie test is repeatable and simple to conduct. Although it is relatively
practical in terms of performing the test itself, pure Mode II failure does not typically govern
failure in bamboo. Because bamboo typically experiences a mixed-mode failure, the bowtie test

21
may better serve to provide values that will eventually be related to the mixed-mode capacity of
a culm rather than simply the Mode II capacity.
1.4.4 Mixed-mode Failure
Potentially one of the largest issues in the study of longitudinal shear failure in bamboo is the
relationship between the Mode I and Mode II failures. In a generic sense, failure under mixed-
mode conditions may be expressed in the form:
1
m
ICR
I
n
IICR
II
(1-5)
Where II and I are the Mode II and I stresses and IICR and ICR are the critical Mode II and
I stresses. The variables n and m are material-specific; both most simply taken as unity.
22
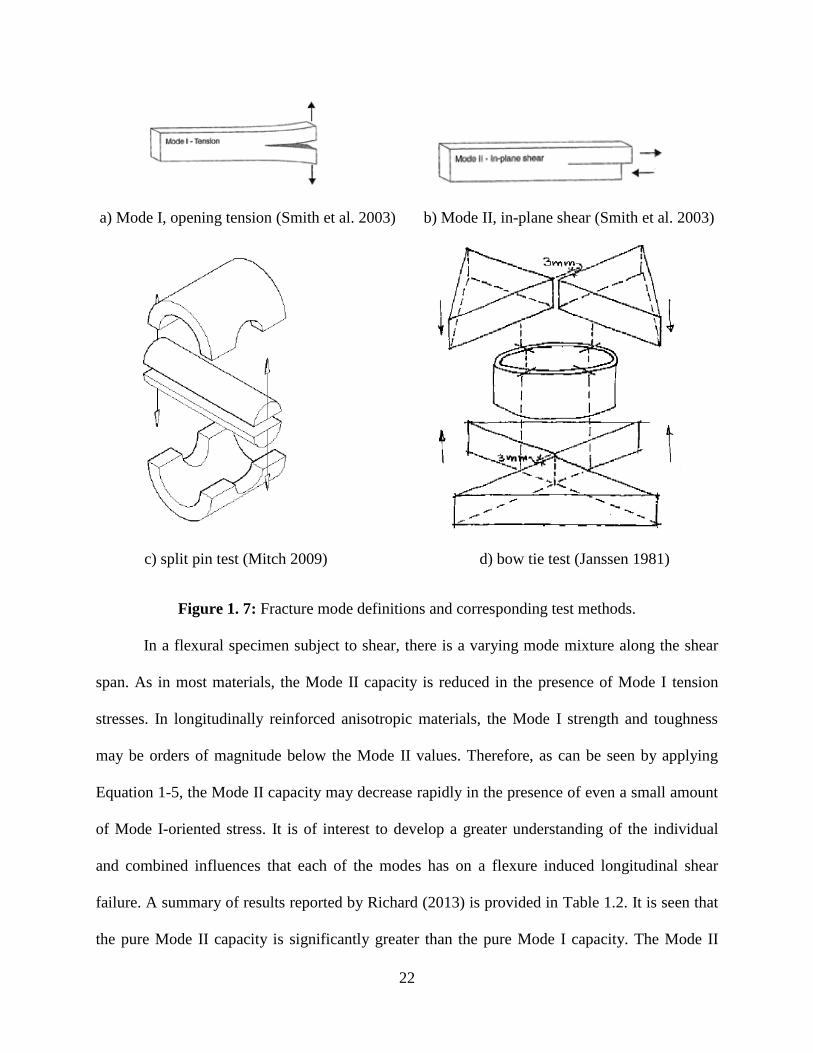
a) Mode I, opening tension (Smith et al. 2003) b) Mode II, in-plane shear (Smith et al. 2003)
c) split pin test (Mitch 2009) d) bow tie test (Janssen 1981)
Figure 1. 7: Fracture mode definitions and corresponding test methods.
In a flexural specimen subject to shear, there is a varying mode mixture along the shear
span. As in most materials, the Mode II capacity is reduced in the presence of Mode I tension
stresses. In longitudinally reinforced anisotropic materials, the Mode I strength and toughness
may be orders of magnitude below the Mode II values. Therefore, as can be seen by applying
Equation 1-5, the Mode II capacity may decrease rapidly in the presence of even a small amount
of Mode I-oriented stress. It is of interest to develop a greater understanding of the individual
and combined influences that each of the modes has on a flexure induced longitudinal shear
failure. A summary of results reported by Richard (2013) is provided in Table 1.2. It is seen that
the pure Mode II capacity is significantly greater than the pure Mode I capacity. The Mode II

23
capacities measured under conditions of mixed-mode loading seen in the bending specimens are
apparently less than the pure Mode I capacity. This latter discrepancy of mixed-mode values may
be due to the characteristics of the notch used in both the large and small scale bending tests.
Because the transverse (vertical) notch extended from the tension face of each specimen to the
neutral axis, the specimen capacities are significantly reduced. Indeed, it is felt that the notch
geometry used does not permit a valid comparison of results. It is the contention of the present
work that a longitudinal (horizontal) notch, serving only as a crack initiator, instead of a
transverse notch is more appropriate for the study of mixed-mode splitting behavior. In addition,
as is suggested at the conclusion of Richard’s work, shorter span culms may be tested in order to
witness and compare non-induced shear failure.
The present study, presented in Chapter 3, aims to continue the investigation of the
relationship between Mode I tension and Mode II shear failures in a bamboo culm under four
point bending. By performing modified variations of the previously conducted tests, a better
understanding of the often-governing longitudinal shear capacity of bamboo is sought. The
modifications will include a series of tests which decrease the shear spans of the culm uniformly
in order to reduce the effect of flexural. The second modification is the placement of a horizontal
(longitudinal) notch on the standard span culms. The notch will be located at midspan at the
neutral axis.

24
Table 1. 2: Shear strength of Mode I, Mode II and mixed-mode failures (Richard 2013).
Species
Bowtie Split Pin Clear Standard Span
Tension Notch
Mode II Mode I mixed-mode mixed-mode
τ, MPa (COV) σ⊥, MPa (COV) τ, MPa (COV) τ, MPa (COV)
Moso 14.20 (0.10) 2.40 (0.24) 1.82 (0.31) 1.82 (0.31)
Tre Gai 8.65 (0.075) 1.52 (0.16) 0.79 (0.26) 0.79 (0.26)
Normalized Values
Moso 27.8 4.7 3.6 1.0
Tre Gai 26.2 4.6 2.4 1.0
1.5 SCOPE OF THESIS
This thesis addresses two separate issues relevant to the understanding of bamboo behavior and
the eventual standardization of bamboo testing. Chapter 2 presents and a study of bamboo
flexural creep behavior and the effects of sustained load on ultimate capacity. Small, clear
specimens are used. These specimens are tested in flexure and alternately oriented such that the
outer culm fibers are in tension or compression. Chapter 3 presents a continuation of the study
initiated by Richard (2013) investigating the shear-flexure interaction and longitudinally splitting
behavior of standard full-culm flexure tests. Each chapter will present the test programme,
results and a discussion and conclusions for the individual test programmes. Chapter 4 will
briefly summarize the conclusions and place the present study in the context of the larger goal of
standardizing bamboo test methods.
25
2.0 CREEP TESTS
The experimental programme described in this chapter aimed to evaluate the creep behavior of
Bambusa Stenostachya (Tre Gai) bamboo specimens under four-point bending. The experiment
is motivated by the restriction of sustained load on various materials, particularly fiber reinforced
materials, due to creep. Both wood and engineered composites are susceptible to damage caused
by a sustained load. Long term strength of wood, for instance, is assumed to be about 55% of the
short term strength (Janssen 1981). Long-term strength for glass fiber reinforced polymers
(GFRP) may be as low as 20% (ACI 440.1 2006).
2.1 TEST PROGRAMME
Twenty five radially-cut small clear specimens were tested in this experimental programme
(Table 2.1). All specimens were cut from the same culm of Tre Gai. Four specimens (N, S, E and
W) were recovered from each of six adjacent internodes and numbered accordingly, as shown in
Table 2.1 (additional specimens were cut from internode 1, as indicated in Table 2.1). Five
specimens were initially tested to failure in order to determine an ultimate modulus of rupture.
One unloaded control specimen was used to determine moisture content throughout the duration
of the experiment. This specimen was stored with the creep specimens and included strain gages
26
in order to monitor any environmental effects; none were noted. Three additional specimens
were stored, unloaded, in the test environment and tested in bending following the creep tests.
The purpose of these three specimens was also to assess any effects of the storage environment
over the duration of the creep tests (again, none) and to supplement the ultimate load values
determined by the initial five control tests.
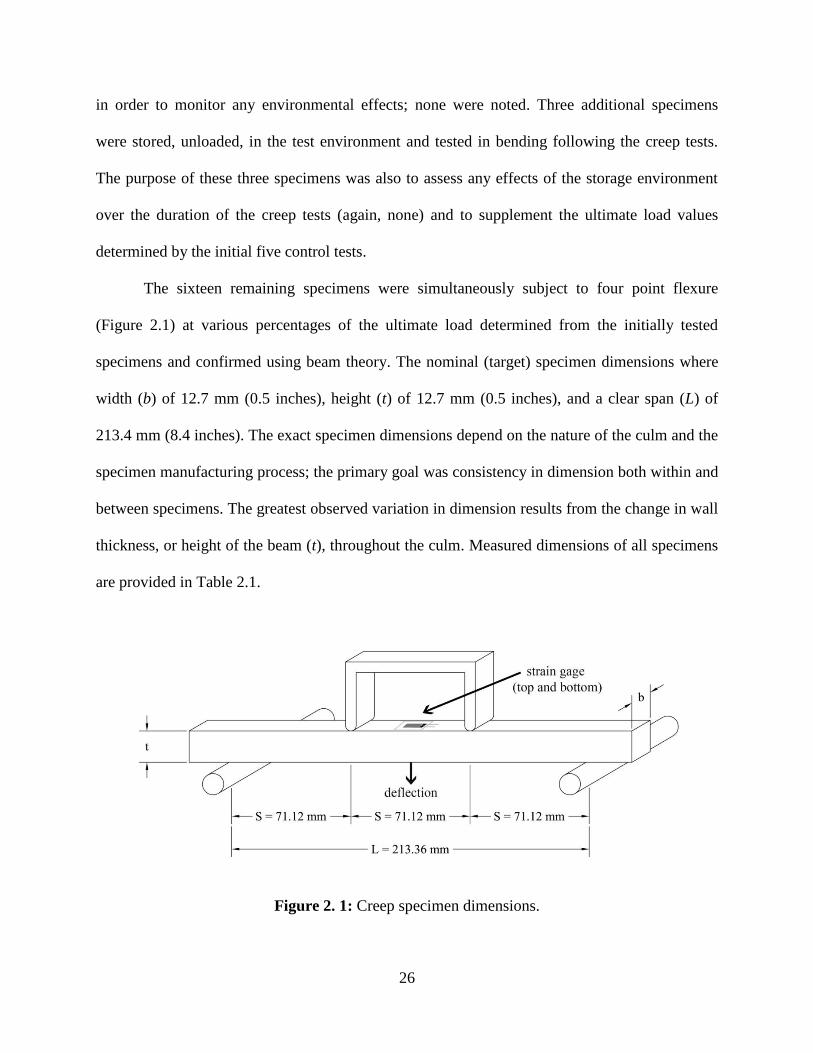
The sixteen remaining specimens were simultaneously subject to four point flexure
(Figure 2.1) at various percentages of the ultimate load determined from the initially tested
specimens and confirmed using beam theory. The nominal (target) specimen dimensions where
width (b) of 12.7 mm (0.5 inches), height (t) of 12.7 mm (0.5 inches), and a clear span (L) of
213.4 mm (8.4 inches). The exact specimen dimensions depend on the nature of the culm and the
specimen manufacturing process; the primary goal was consistency in dimension both within and
between specimens. The greatest observed variation in dimension results from the change in wall
thickness, or height of the beam (t), throughout the culm. Measured dimensions of all specimens
are provided in Table 2.1.
Figure 2. 1: Creep specimen dimensions.
27
The five control tests aided in the determination of an ultimate load capacity of the
specimens, Pult and provided a common value to be considered in each creep load determination.
At the beginning of the creep test, specimens were loaded with target loads of 0.04Pult, 0.07Pult,
0.09Pult, 0.13Pult, 0.18Pult, 0.27Pult and 0.40Pult as indicated in Table 2.1. After 30 days of loading,
four of the lightly loaded specimens (5S, 6N, 5E and 6W; see Table 2.1), initially having target
loads of 0.04Pult, 0.07Pult, 0.09Pult, and 0.13Pult, were increased to values intended to represent
0.80Pult. These specimens were subsequently identified 5S*, 6N*, 5E* and 6W* (Table 2.1). The
applied sustained creep loads and the actual proportion of Pult for each specimen based on
measured specimen dimensions are given in Table 2.1 and described in Section 2.1.2. For all
subsequent calculations and discussion, the actual creep loads based on measured material
properties are used.
It is ideal to machine the specimens from adjacent internodes within the same culm
(Figure 2.2). The consistent origin of specimens allows for less variability in material properties.
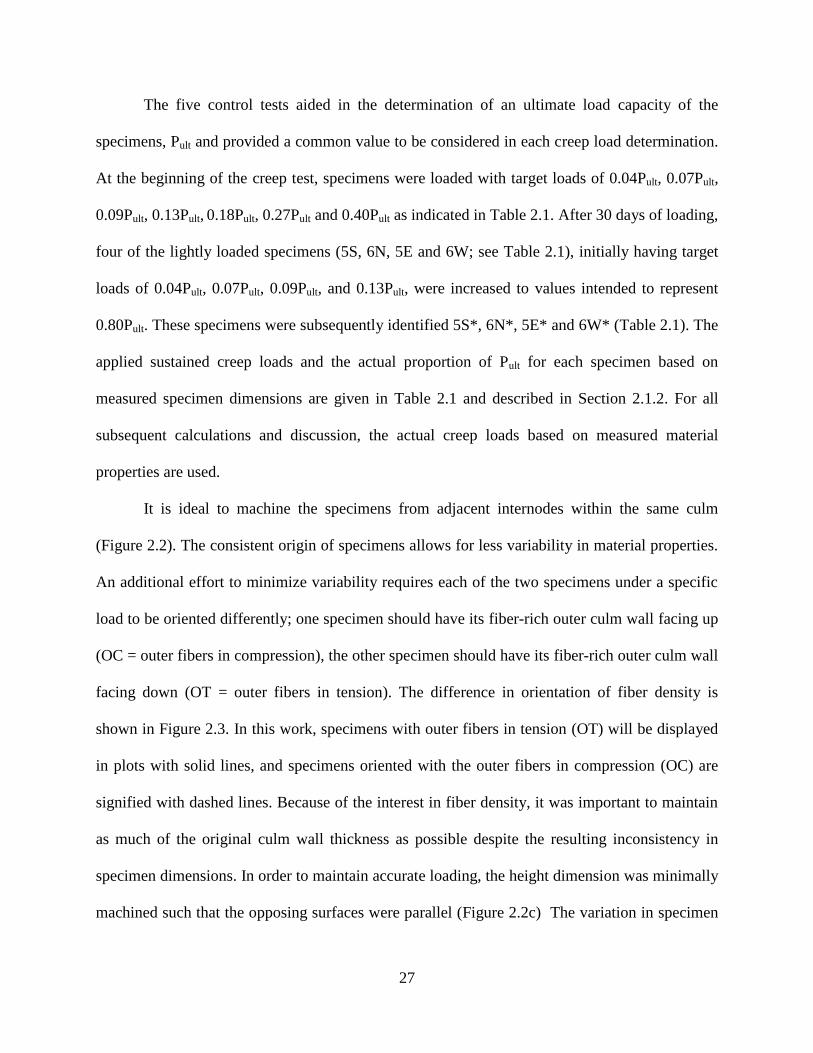
An additional effort to minimize variability requires each of the two specimens under a specific
load to be oriented differently; one specimen should have its fiber-rich outer culm wall facing up
(OC = outer fibers in compression), the other specimen should have its fiber-rich outer culm wall
facing down (OT = outer fibers in tension). The difference in orientation of fiber density is
shown in Figure 2.3. In this work, specimens with outer fibers in tension (OT) will be displayed
in plots with solid lines, and specimens oriented with the outer fibers in compression (OC) are
signified with dashed lines. Because of the interest in fiber density, it was important to maintain
as much of the original culm wall thickness as possible despite the resulting inconsistency in
specimen dimensions. In order to maintain accurate loading, the height dimension was minimally
machined such that the opposing surfaces were parallel (Figure 2.2c) The variation in specimen

28
dimensions was normalized in the post-test analysis through the reporting of modulus of rupture
(MOR), rather than specimen capacity. Because of the consistency provided by the machining of
the specimens, the clear span of each bamboo specimen did not vary. Similarly, the machined
width of the creep beams is relatively constant at b = 12.37 mm with a coefficient of variation
(COV) of 0.036. The naturally occurring wall thickness (depth of the beam) varied more
significantly with t = 14.34 mm (COV = 0.12). In addition to dimensions, alignment of the
specimen was made consistent with that specified by ASTM E2714 Standard Test Method for
Creep-Fatigue Testing.
a) specimens cut radially from
internode
b) internode 1
following
specimen
machining
c) machined dimension of specimen
Figure 2. 2: Test specimen machining.
29
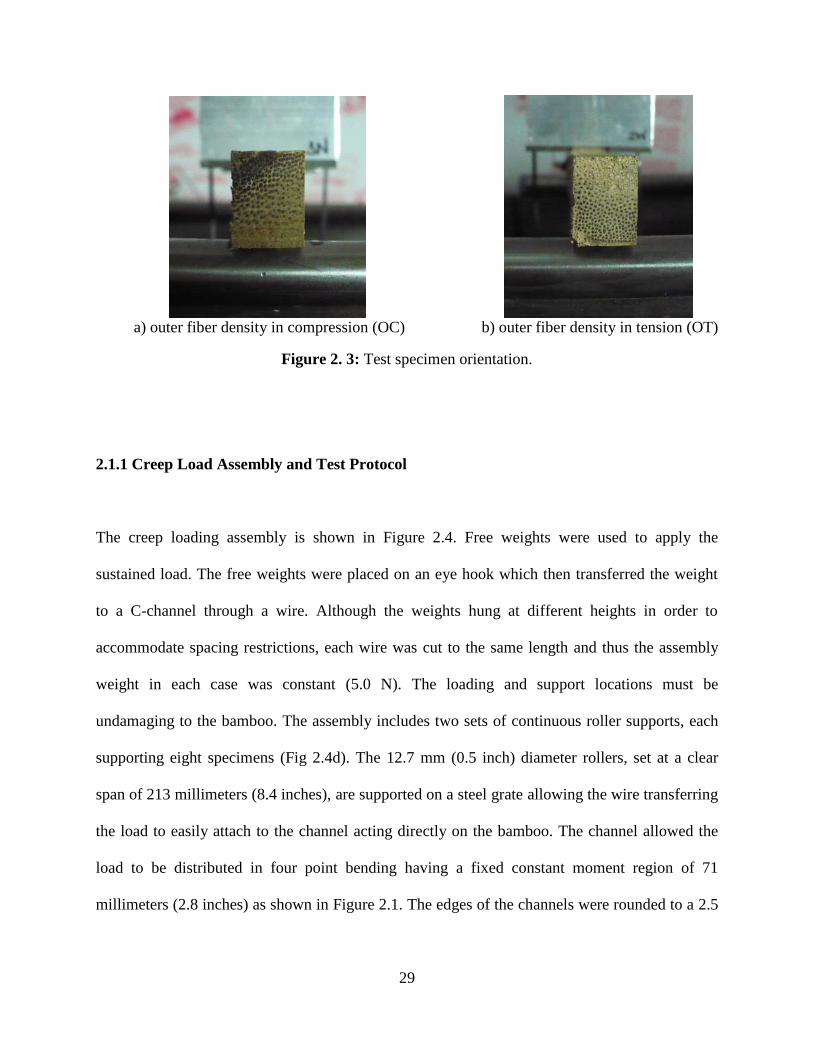
a) outer fiber density in compression (OC) b) outer fiber density in tension (OT)
Figure 2. 3: Test specimen orientation.
2.1.1 Creep Load Assembly and Test Protocol
The creep loading assembly is shown in Figure 2.4. Free weights were used to apply the
sustained load. The free weights were placed on an eye hook which then transferred the weight
to a C-channel through a wire. Although the weights hung at different heights in order to
accommodate spacing restrictions, each wire was cut to the same length and thus the assembly
weight in each case was constant (5.0 N). The loading and support locations must be
undamaging to the bamboo. The assembly includes two sets of continuous roller supports, each
supporting eight specimens (Fig 2.4d). The 12.7 mm (0.5 inch) diameter rollers, set at a clear
span of 213 millimeters (8.4 inches), are supported on a steel grate allowing the wire transferring
the load to easily attach to the channel acting directly on the bamboo. The channel allowed the
load to be distributed in four point bending having a fixed constant moment region of 71
millimeters (2.8 inches) as shown in Figure 2.1. The edges of the channels were rounded to a 2.5

30
mm (0.10 in.) radius. In order to minimize impact during application of the free weights, a small
scissor jack was used to lift the weights onto the eyehooks.
Based on the protocol reported in ASTM D6815 Standard Specification for Evaluation of
Duration of Load and Creep Effects of Wood and Wood-Based Products, the sustained load was
applied for 90 days or until failure. The vertical deflection at midspan (Fig 2.1) was measured
using a digital depth gauge (Fig 2.4f) using the bottom of the fixed grate as a reference. Strain
gauges applied to the top and bottom surfaces of the specimens in the constant moment region
(Fig 2.1) captured extreme fiber compression and tension strain, respectively, and were used to
calculate curvature and the location of the neutral axis. All data was collected a) immediately
prior to loading; b) immediately following loading (elastic displacement and strain); c) every 15
minutes for the first hour; d) every 30 minutes for the next eleven hours; e) twice a day for the
subsequent six days; and f) daily after that. Load was removed at 90 days at which point
additional readings were taken. Specimens were permitted to ‘relax’ for ten days prior to final
testing to failure. During this relaxation time, data was recorded a) immediately after the load
was removed; b) every 15 minutes for the first hour of recovery; c) every hour for the following
6 hours and d) daily thereafter.
As noted previously, following 30 days of loading (and relatively little creep), four
lightly loaded specimens (5S, 6N, 5E and 6W) had additional free weights applied to increase
their creep loads. The protocol was restarted at this time for these specimens. Thus these four
specimens were under relatively small loads for 30 days (5S, 6N, 5E and 6W) followed by higher
loads for an additional 90 days (5S*, 6N*, 5E* and 6W*). The dramatic change in load at 30
days is clearly evident in all data for these specimens.

31
a) section view of test configuration
b) plan view of test configuration
c) axonometric detail of test configuration
d) continuous supports
e) complete test set-up
f) caliper
Figure 2. 4: Test configuration.
depth gauge
32
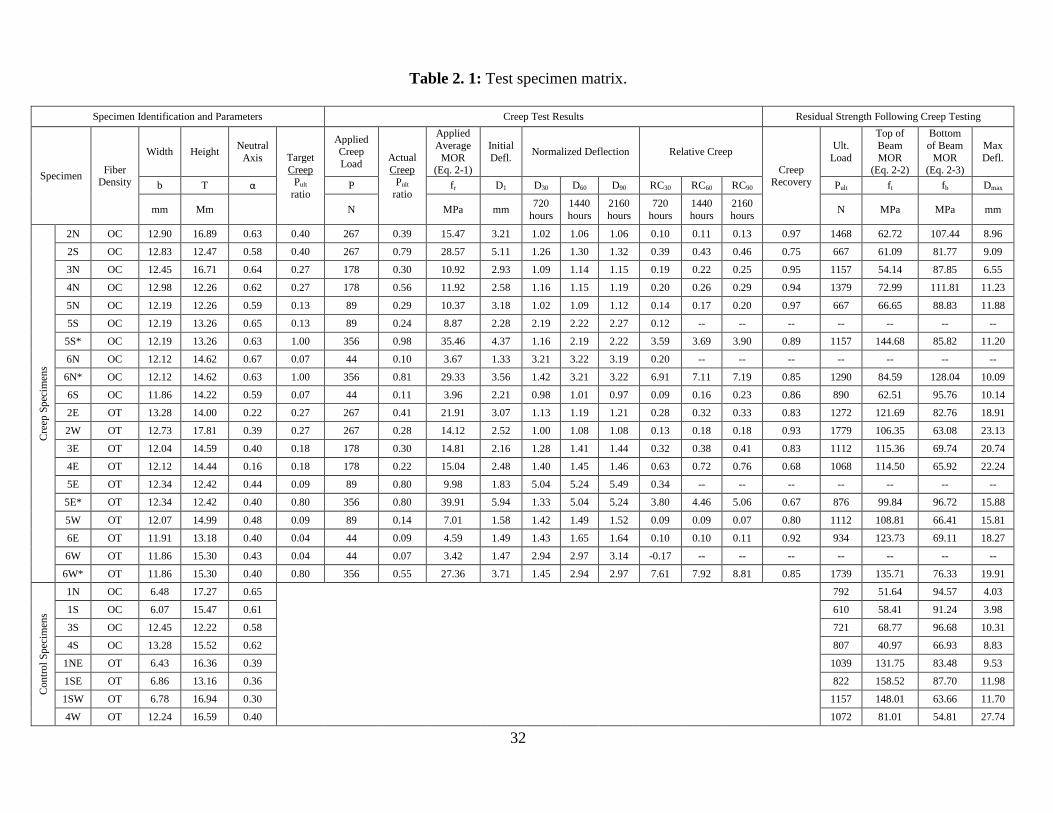
Table 2. 1: Test specimen matrix.
Specimen Identification and Parameters Creep Test Results Residual Strength Following Creep Testing
Specimen Fiber
Density
Width Height Neutral
Axis Target
Creep Pult
ratio
Applied Creep
Load Actual
Creep Pult
ratio
Applied
Average
MOR (Eq. 2-1)
Initial
Defl. Normalized Deflection Relative Creep
Creep Recovery
Ult.
Load
Top of
Beam
MOR (Eq. 2-2)
Bottom
of Beam
MOR (Eq. 2-3)
Max
Defl.
b T α P fr D1 D30 D60 D90 RC30 RC60 RC90 Pult ft fb Dmax
mm Mm
N MPa mm 720
hours
1440
hours
2160
hours
720
hours
1440
hours
2160
hours N MPa MPa mm
Cre
ep S
pec
imen
s
2N OC 12.90 16.89 0.63 0.40 267 0.39 15.47 3.21 1.02 1.06 1.06 0.10 0.11 0.13 0.97 1468 62.72 107.44 8.96
2S OC 12.83 12.47 0.58 0.40 267 0.79 28.57 5.11 1.26 1.30 1.32 0.39 0.43 0.46 0.75 667 61.09 81.77 9.09
3N OC 12.45 16.71 0.64 0.27 178 0.30 10.92 2.93 1.09 1.14 1.15 0.19 0.22 0.25 0.95 1157 54.14 87.85 6.55
4N OC 12.98 12.26 0.62 0.27 178 0.56 11.92 2.58 1.16 1.15 1.19 0.20 0.26 0.29 0.94 1379 72.99 111.81 11.23
5N OC 12.19 12.26 0.59 0.13 89 0.29 10.37 3.18 1.02 1.09 1.12 0.14 0.17 0.20 0.97 667 66.65 88.83 11.88
5S OC 12.19 13.26 0.65 0.13 89 0.24 8.87 2.28 2.19 2.22 2.27 0.12 -- -- -- -- -- -- --
5S* OC 12.19 13.26 0.63 1.00 356 0.98 35.46 4.37 1.16 2.19 2.22 3.59 3.69 3.90 0.89 1157 144.68 85.82 11.20
6N OC 12.12 14.62 0.67 0.07 44 0.10 3.67 1.33 3.21 3.22 3.19 0.20 -- -- -- -- -- -- --
6N* OC 12.12 14.62 0.63 1.00 356 0.81 29.33 3.56 1.42 3.21 3.22 6.91 7.11 7.19 0.85 1290 84.59 128.04 10.09
6S OC 11.86 14.22 0.59 0.07 44 0.11 3.96 2.21 0.98 1.01 0.97 0.09 0.16 0.23 0.86 890 62.51 95.76 10.14
2E OT 13.28 14.00 0.22 0.27 267 0.41 21.91 3.07 1.13 1.19 1.21 0.28 0.32 0.33 0.83 1272 121.69 82.76 18.91
2W OT 12.73 17.81 0.39 0.27 267 0.28 14.12 2.52 1.00 1.08 1.08 0.13 0.18 0.18 0.93 1779 106.35 63.08 23.13
3E OT 12.04 14.59 0.40 0.18 178 0.30 14.81 2.16 1.28 1.41 1.44 0.32 0.38 0.41 0.83 1112 115.36 69.74 20.74
4E OT 12.12 14.44 0.16 0.18 178 0.22 15.04 2.48 1.40 1.45 1.46 0.63 0.72 0.76 0.68 1068 114.50 65.92 22.24
5E OT 12.34 12.42 0.44 0.09 89 0.80 9.98 1.83 5.04 5.24 5.49 0.34 -- -- -- -- -- -- --
5E* OT 12.34 12.42 0.40 0.80 356 0.80 39.91 5.94 1.33 5.04 5.24 3.80 4.46 5.06 0.67 876 99.84 96.72 15.88
5W OT 12.07 14.99 0.48 0.09 89 0.14 7.01 1.58 1.42 1.49 1.52 0.09 0.09 0.07 0.80 1112 108.81 66.41 15.81
6E OT 11.91 13.18 0.40 0.04 44 0.09 4.59 1.49 1.43 1.65 1.64 0.10 0.10 0.11 0.92 934 123.73 69.11 18.27
6W OT 11.86 15.30 0.43 0.04 44 0.07 3.42 1.47 2.94 2.97 3.14 -0.17 -- -- -- -- -- -- --
6W* OT 11.86 15.30 0.40 0.80 356 0.55 27.36 3.71 1.45 2.94 2.97 7.61 7.92 8.81 0.85 1739 135.71 76.33 19.91
Con
tro
l S
pec
imen
s
1N OC 6.48 17.27 0.65
792 51.64 94.57 4.03
1S OC 6.07 15.47 0.61
610 58.41 91.24 3.98
3S OC 12.45 12.22 0.58
721 68.77 96.68 10.31
4S OC 13.28 15.52 0.62
807 40.97 66.93 8.83
1NE OT 6.43 16.36 0.39
1039 131.75 83.48 9.53
1SE OT 6.86 13.16 0.36
822 158.52 87.70 11.98
1SW OT 6.78 16.94 0.30
1157 148.01 63.66 11.70
4W OT 12.24 16.59 0.40
1072 81.01 54.81 27.74
33
2.1.2 Control Tests and Results
An aim of this experimental programme is to consider the orientation of the fiber density. At
each creep load value, two samples are oriented so that their outer culm-wall fibers are in
compression (OC) and two are oriented so that their outer culm-wall fibers are in tension (OT).
The control bending tests (see bottom of Table 2.1), conducted prior to the initiation of
the creep tests, allowed for proper sizing and loading of the specimens. Five radially-cut
specimens were tested (Figure 2.2); three in the OT orientation and two in the OC orientation.
The specimen dimensions varied somewhat from the uniform creep specimens (Table 2.1)
however capacities were normalized by the dimensions by considering and comparing the
modulus of rupture (MOR), rather than specimen load carrying capacity.
Following the creep tests, an additional three specimens (3S, 4S and 4W in Table 2.1)
were tested verifying the results from the initial five tests. The cross sections of the three
specimens in the second set of control tests were closer to those of the creep test specimens and
larger than the cross section of the original five tests.
All control tests were tested monotonically to failure in a test arrangement identical to
that used for the creep conditioning (Figure 2.1). Instrumentation was also the same in all cases.
Testing was conducted in displacement control and data taken at increments of approximately 44
N applied load.
In general, specimens that were loaded with the outer culm-wall fibers in tension (OT)
carried more load and exhibited greater midspan deflection than the specimens that were loaded
with the outer fibers in compression (OC). This is shown in Figure 2.5, in which solid lines
represent the OT specimens and dashed lines represent the OC specimens (this notation is
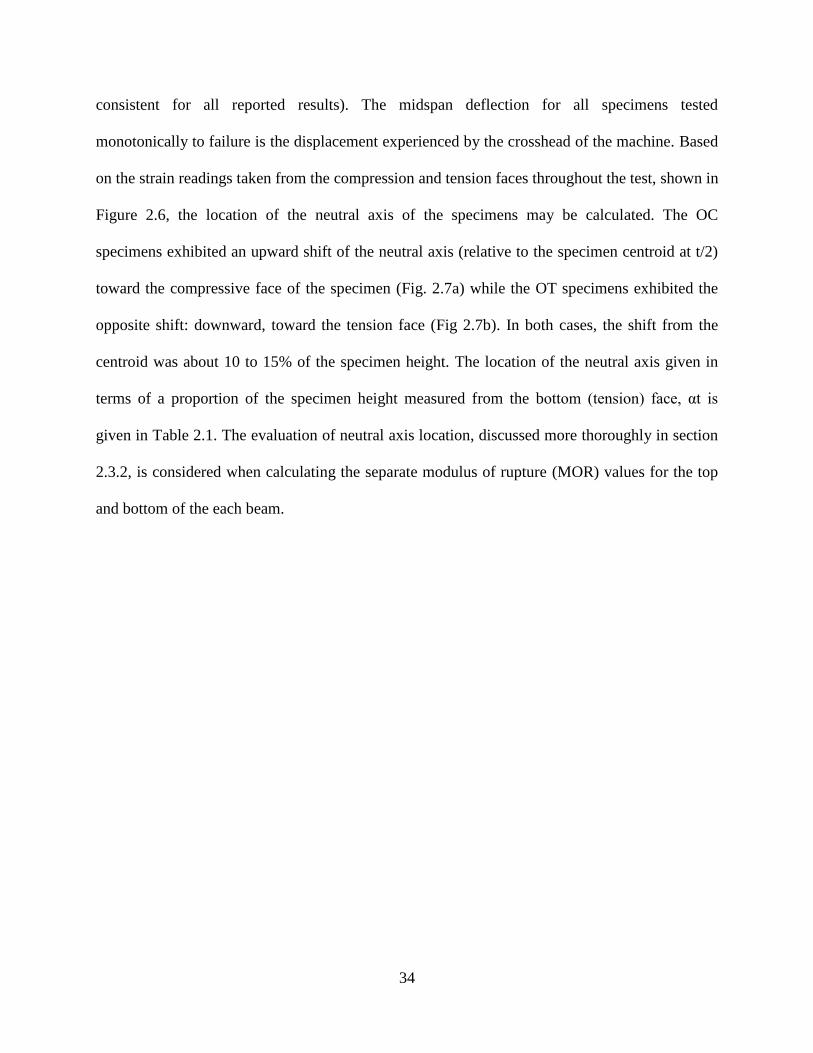
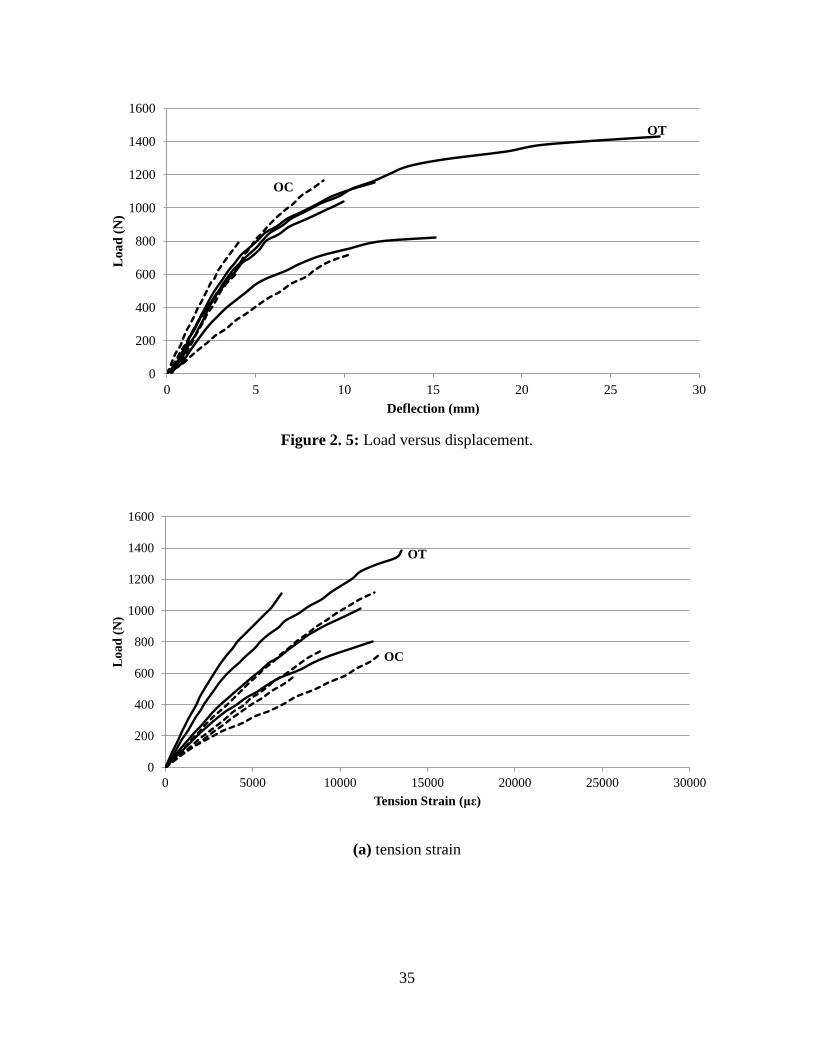
34
consistent for all reported results). The midspan deflection for all specimens tested
monotonically to failure is the displacement experienced by the crosshead of the machine. Based
on the strain readings taken from the compression and tension faces throughout the test, shown in
Figure 2.6, the location of the neutral axis of the specimens may be calculated. The OC
specimens exhibited an upward shift of the neutral axis (relative to the specimen centroid at t/2)
toward the compressive face of the specimen (Fig. 2.7a) while the OT specimens exhibited the
opposite shift: downward, toward the tension face (Fig 2.7b). In both cases, the shift from the
centroid was about 10 to 15% of the specimen height. The location of the neutral axis given in
terms of a proportion of the specimen height measured from the bottom (tension) face, αt is
given in Table 2.1. The evaluation of neutral axis location, discussed more thoroughly in section
2.3.2, is considered when calculating the separate modulus of rupture (MOR) values for the top
and bottom of the each beam.
35
Figure 2. 5: Load versus displacement.
(a) tension strain
0
200
400
600
800
1000
1200
1400
1600
0 5 10 15 20 25 30
Lo
ad
(N
)
Deflection (mm)
OT
OC
0
200
400
600
800
1000
1200
1400
1600
0 5000 10000 15000 20000 25000 30000
Load
(N
)
Tension Strain (με)
OC
OT

36
(b) compression strain
Figure 2. 6: Load versus strain.
(a) OC specimens (b) OT specimens
Figure 2. 7: Location of neutral axis.
0
200
400
600
800
1000
1200
1400
1600
0 5000 10000 15000 20000 25000 30000
Load
(N
)
Compression Strain (με)
OC
OT
37
It can be seen in Figure 2.6 that the OT specimens experienced higher compression and
tension strains (resulting from larger capacities and deflections as shown in Figure 2.5), although
specimen orientation had a greater impact on the compression strain data.
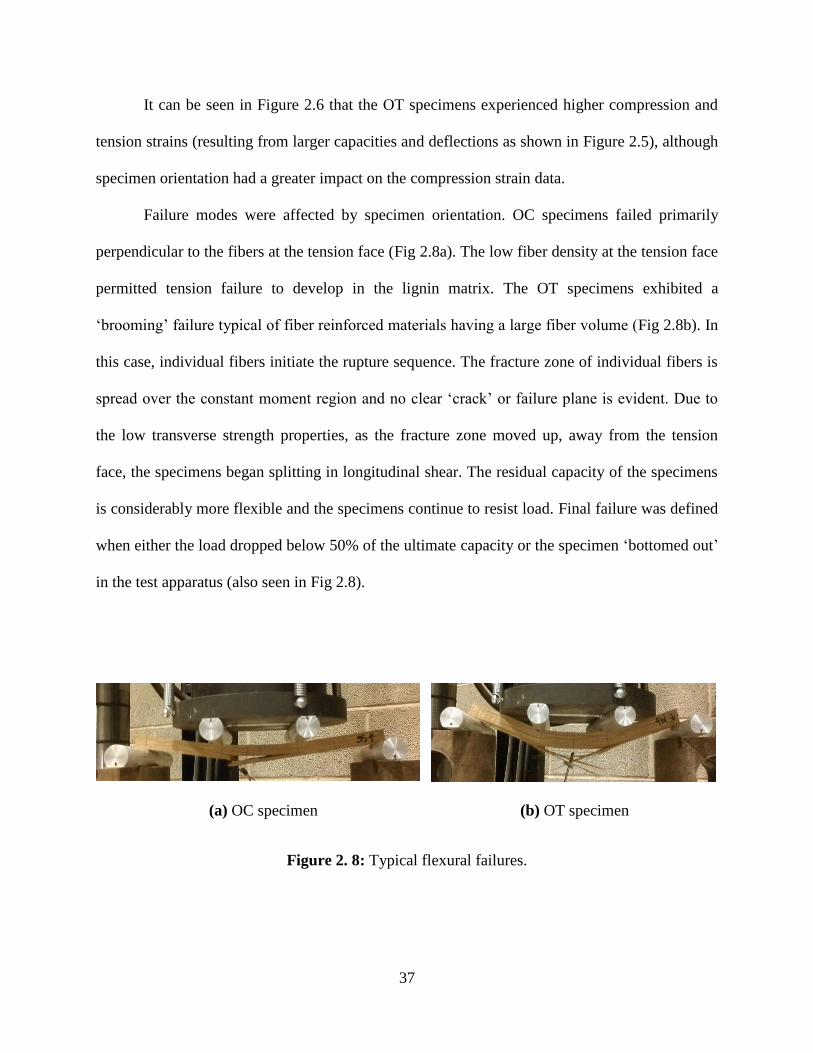
Failure modes were affected by specimen orientation. OC specimens failed primarily
perpendicular to the fibers at the tension face (Fig 2.8a). The low fiber density at the tension face
permitted tension failure to develop in the lignin matrix. The OT specimens exhibited a
‘brooming’ failure typical of fiber reinforced materials having a large fiber volume (Fig 2.8b). In
this case, individual fibers initiate the rupture sequence. The fracture zone of individual fibers is
spread over the constant moment region and no clear ‘crack’ or failure plane is evident. Due to
the low transverse strength properties, as the fracture zone moved up, away from the tension
face, the specimens began splitting in longitudinal shear. The residual capacity of the specimens
is considerably more flexible and the specimens continue to resist load. Final failure was defined
when either the load dropped below 50% of the ultimate capacity or the specimen ‘bottomed out’
in the test apparatus (also seen in Fig 2.8).
(a) OC specimen (b) OT specimen
Figure 2. 8: Typical flexural failures.

38
The modulus of rupture (MOR), fr, is calculated based on the ultimate capacity for each
specimen as follows:
3
12
22 bt
tPa
I
Myfr (2-1)
Where M = Pa/2 is the applied moment in which P is the ultimate applied load (Fig. 2.5) and a
is the shear span, equal to 71 mm in all cases (Fig. 2.1).
2
ty is the location of the specimen centroidal axis.
12
3btI is the moment of inertia of the specimen section
The calculation given by Equation 2-1 is commonly reported in the literature and represents an
apparent average value of MOR. However, to understand the effects of specimen orientation, it is
necessary to consider the MOR calculated for both the top and bottom extreme fibers. This is
done by recognizing the shift from the centroid of the neutral axis (Fig. 2.7) and replacing y = t/2
in Eq. 2-1 with yt = (1-α)t and yb = αt, thus:
3
12)1(
2 btt
Pa
I
Myf t
t (2-2)
3
12
2 btt
Pa
I
Myf b
b (2-3)
Where the location of the neutral axis given in terms of a proportion of the specimen height
measured from the bottom (tension) face, αt is given in Table 2.1. Using the MOR allows
normalization for variation in specimen geometry.
Table 2.2 summarizes the MOR calculations for the five control specimens tested prior to
creep testing and the three tested following creep testing. The initial five tests had nominal
dimensions of approximately t = 16 mm and b = 6.5 mm. These were used to select specimen
39
dimensions for the creep tests that would correspond approximately to the desired target load
levels considering that only discrete 4.54 and 9.09 kg free weights were available. With the culm
wall thickness, t, established, a nominal specimen width b = 12.5 mm was selected for creep
testing. The three subsequently tested control specimens (Table 2.2) had the same nominal
dimensions as the creep tests. The target creep load levels and those actually tested, along with
measured specimen dimensions are provided in Table 2.1.
Table 2. 2: Average modulus of rupture values.
Pre-Creep Control Tests Post-Creep Control Tests
Orientation fr ft fb fr ft fb
(MPa) (MPa) (MPa) (MPa) (MPa) (MPa)
OC 74.0 55.0 92.9 68.3 54.9 81.8
OT 112.2 146.1 78.3 67.9 81.0 54.8
all 96.9 109.7 84.1 68.2 63.6 72.8
Standard Deviation (COV)
OC 1.2 (0.016) 4.8 (0.087) 2.4 (0.025) 20.3 (0.298) 19.7 (0.358) 21.0 (0.257)
OT 9.5 (0.085) 13.5 (0.092) 12.8 (0.164) - - -
all 22.0 (0.227) 50.8 (0.464) 12.2 (0.145) 14.4 (0.211) 20.5 (0.323) 21.5 (0.296)
2.1.3 Creep Test Environment
The location where the creep tests were conducted was required to have consistent humidity
throughout the entire testing period. Based on ASTM D6815-09, the environment should be
considered ‘dry service conditions’; for timber creep tests the moisture content of the wood
should not exceed 19%. The average moisture content of the bamboo (measured using an Extech
Instrument MO220 moisture meter) throughout the experiment was 12%.
The ambient environmental conditions were measured each day a reading was taken as
reported in Figure 2.9. Additionally, an unloaded ‘traveler’ specimen was instrumented with
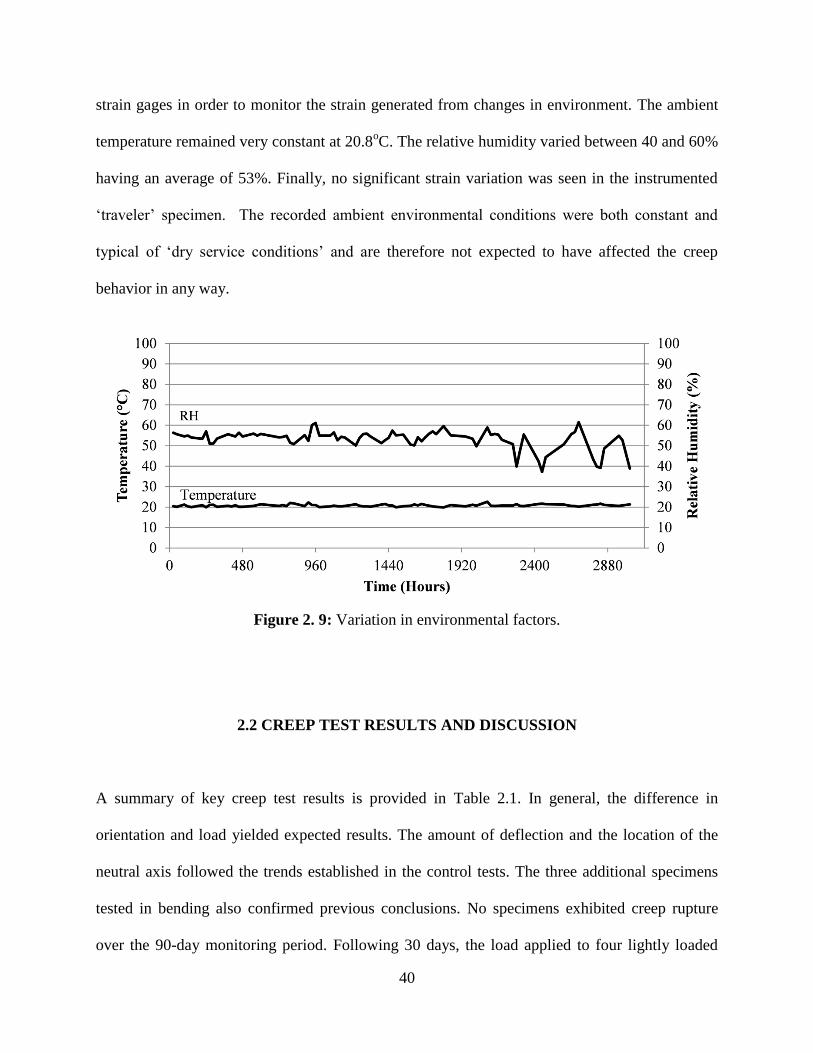
40
strain gages in order to monitor the strain generated from changes in environment. The ambient
temperature remained very constant at 20.8oC. The relative humidity varied between 40 and 60%
having an average of 53%. Finally, no significant strain variation was seen in the instrumented
‘traveler’ specimen. The recorded ambient environmental conditions were both constant and
typical of ‘dry service conditions’ and are therefore not expected to have affected the creep
behavior in any way.
Figure 2. 9: Variation in environmental factors.
2.2 CREEP TEST RESULTS AND DISCUSSION
A summary of key creep test results is provided in Table 2.1. In general, the difference in
orientation and load yielded expected results. The amount of deflection and the location of the
neutral axis followed the trends established in the control tests. The three additional specimens
tested in bending also confirmed previous conclusions. No specimens exhibited creep rupture
over the 90-day monitoring period. Following 30 days, the load applied to four lightly loaded

41
specimens (5E, 5S, 6W, 6N) was increased in an attempt to drive a creep failure due to the
sustained load. These specimens were designated 5E*, 5S*, 6W*, 6N* and were subjected to the
increased loads for 90 days, resulting in their being under load for a total of 120 days. Still, no
creep rupture failures resulted, although the data captured a wider range of response. The
increase in applied load is very clear on all plots at an elapsed time of 30 days (720 hours) and
should be considered when viewing the results.
2.2.1 Deflection and Strain
Creep deflection versus time under load is shown in Figure 2.10. In Figure 2.11 and in Table 2.1,
creep deflections are normalized by the initial deflection measured upon application of the load.
Some caution must be taken in interpreting the unnormalized results shown in Table 2.1. While
the absolute initial deflection values for the OC specimens (average = 3.1 mm) exceeds that of
OT specimens (2.6 mm), this must be viewed in light of the fact that due to the differences in
capacity based on orientation, the applied creep load ratios are also considerably higher for the
OC specimens (average = 0.46Pult) than for the OT specimens (0.37Pult). Indeed, consistent with
the control tests, the apparent initial stiffness of both orientations is similar.
Based on the normalized deflections (Fig. 2.11), creep deflection can be seen to be
clearly affected by specimen orientation. In general OT specimens exhibit greater normalized
creep than OC specimens. Values of normalized deflection at 30, 60 and 90 days are given in
Table 2.1. This trend may be due to the flexibility of the specimens based on their orientation.
Section 2.2.2 discusses the difference in apparent modulus of elasticity of OT and OC
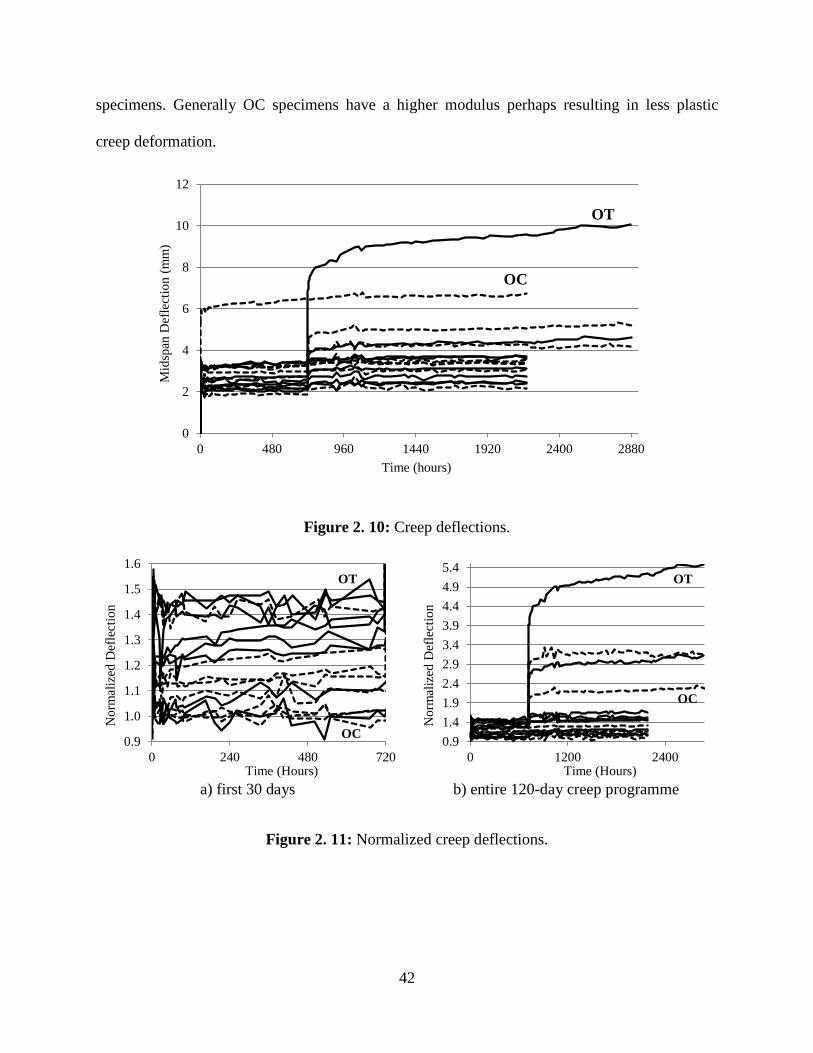
42
specimens. Generally OC specimens have a higher modulus perhaps resulting in less plastic
creep deformation.
Figure 2. 10: Creep deflections.
a) first 30 days b) entire 120-day creep programme
Figure 2. 11: Normalized creep deflections.
0
2
4
6
8
10
12
0 480 960 1440 1920 2400 2880
Mid
span
Def
lect
ion (
mm
)
Time (hours)
OC
OT
0.9
1.0
1.1
1.2
1.3
1.4
1.5
1.6
0 240 480 720
No
rmal
ized
Def
lect
ion
Time (Hours)
OT
OC0.9
1.4
1.9
2.4
2.9
3.4
3.9
4.4
4.9
5.4
0 1200 2400
No
rmal
ized
Def
lect
ion
Time (Hours)
OT
OC
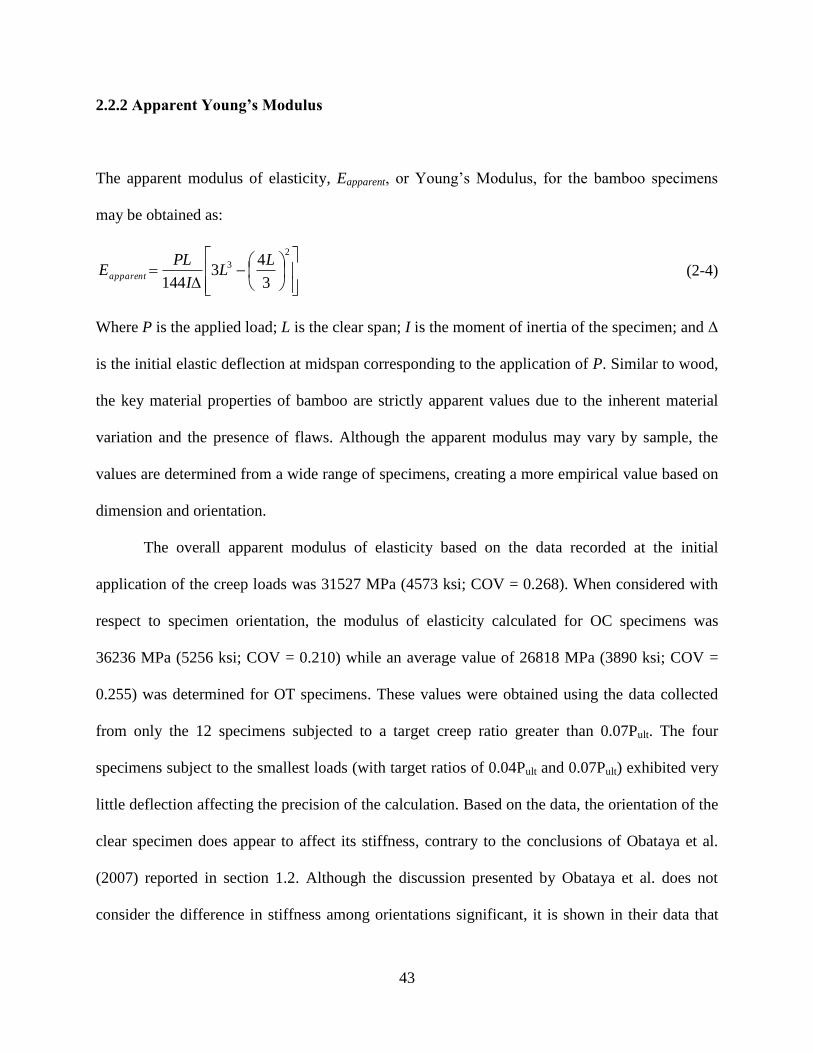
43
2.2.2 Apparent Young’s Modulus
The apparent modulus of elasticity, Eapparent, or Young’s Modulus, for the bamboo specimens
may be obtained as:
2
3
3
43
144
LL
I
PLEapparent (2-4)
Where P is the applied load; L is the clear span; I is the moment of inertia of the specimen; and Δ
is the initial elastic deflection at midspan corresponding to the application of P. Similar to wood,
the key material properties of bamboo are strictly apparent values due to the inherent material
variation and the presence of flaws. Although the apparent modulus may vary by sample, the
values are determined from a wide range of specimens, creating a more empirical value based on
dimension and orientation.
The overall apparent modulus of elasticity based on the data recorded at the initial
application of the creep loads was 31527 MPa (4573 ksi; COV = 0.268). When considered with
respect to specimen orientation, the modulus of elasticity calculated for OC specimens was
36236 MPa (5256 ksi; COV = 0.210) while an average value of 26818 MPa (3890 ksi; COV =
0.255) was determined for OT specimens. These values were obtained using the data collected
from only the 12 specimens subjected to a target creep ratio greater than 0.07Pult. The four
specimens subject to the smallest loads (with target ratios of 0.04Pult and 0.07Pult) exhibited very
little deflection affecting the precision of the calculation. Based on the data, the orientation of the
clear specimen does appear to affect its stiffness, contrary to the conclusions of Obataya et al.
(2007) reported in section 1.2. Although the discussion presented by Obataya et al. does not
consider the difference in stiffness among orientations significant, it is shown in their data that
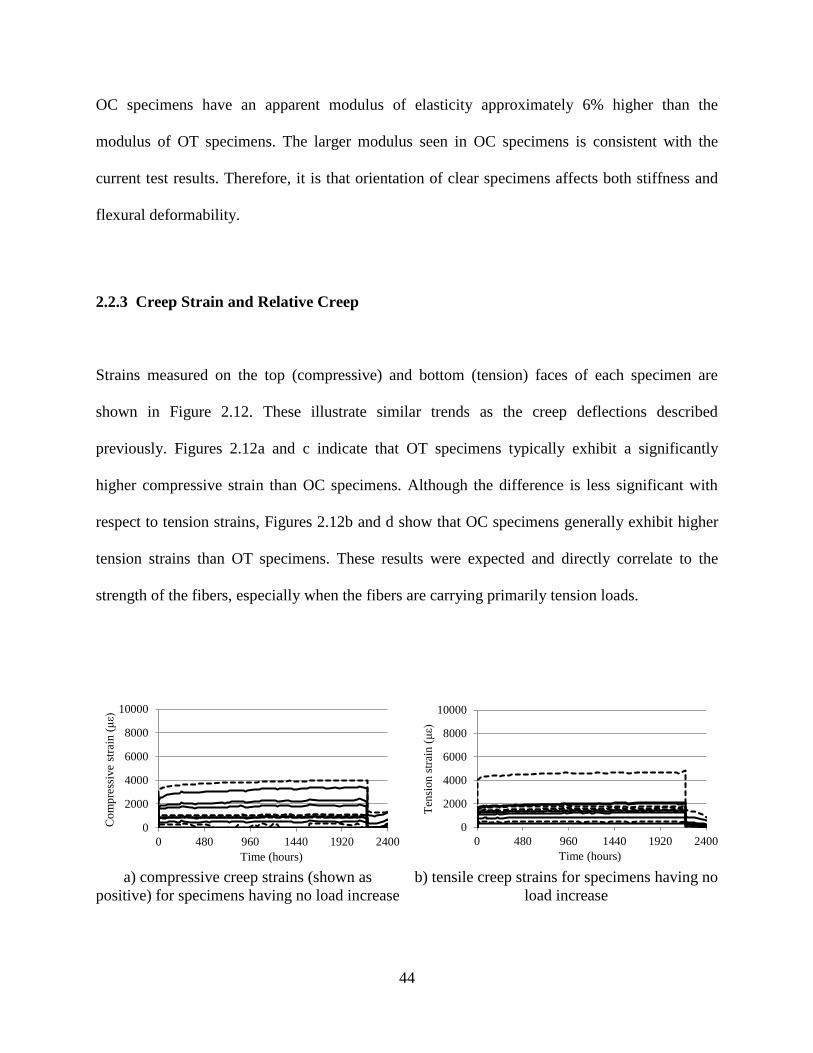
44
OC specimens have an apparent modulus of elasticity approximately 6% higher than the
modulus of OT specimens. The larger modulus seen in OC specimens is consistent with the
current test results. Therefore, it is that orientation of clear specimens affects both stiffness and
flexural deformability.
2.2.3 Creep Strain and Relative Creep
Strains measured on the top (compressive) and bottom (tension) faces of each specimen are
shown in Figure 2.12. These illustrate similar trends as the creep deflections described
previously. Figures 2.12a and c indicate that OT specimens typically exhibit a significantly
higher compressive strain than OC specimens. Although the difference is less significant with
respect to tension strains, Figures 2.12b and d show that OC specimens generally exhibit higher
tension strains than OT specimens. These results were expected and directly correlate to the
strength of the fibers, especially when the fibers are carrying primarily tension loads.
a) compressive creep strains (shown as
positive) for specimens having no load increase
b) tensile creep strains for specimens having no
load increase
0
2000
4000
6000
8000
10000
0 480 960 1440 1920 2400
Co
mp
ress
ive
stra
in (
με)
Time (hours)
0
2000
4000
6000
8000
10000
0 480 960 1440 1920 2400
Ten
sio
n s
trai
n (
με)
Time (hours)
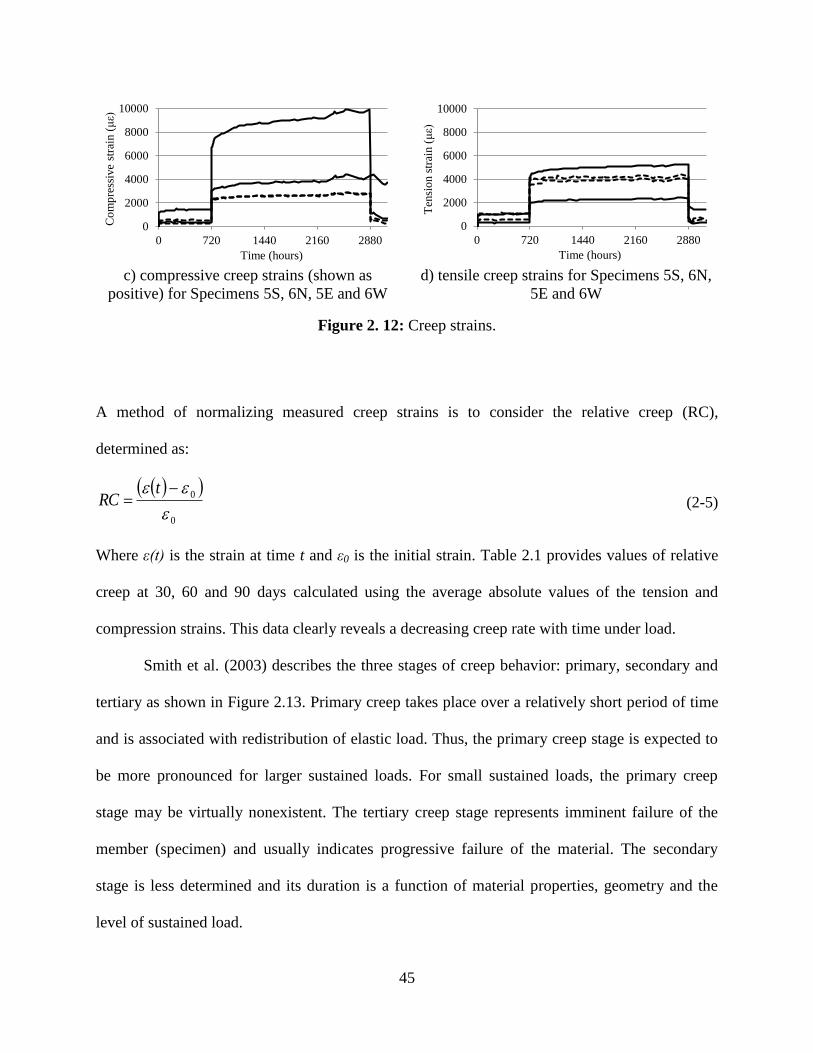
45
c) compressive creep strains (shown as
positive) for Specimens 5S, 6N, 5E and 6W
d) tensile creep strains for Specimens 5S, 6N,
5E and 6W
Figure 2. 12: Creep strains.
A method of normalizing measured creep strains is to consider the relative creep (RC),
determined as:
0
0
tRC (2-5)
Where ε(t) is the strain at time t and ε0 is the initial strain. Table 2.1 provides values of relative
creep at 30, 60 and 90 days calculated using the average absolute values of the tension and
compression strains. This data clearly reveals a decreasing creep rate with time under load.
Smith et al. (2003) describes the three stages of creep behavior: primary, secondary and
tertiary as shown in Figure 2.13. Primary creep takes place over a relatively short period of time
and is associated with redistribution of elastic load. Thus, the primary creep stage is expected to
be more pronounced for larger sustained loads. For small sustained loads, the primary creep
stage may be virtually nonexistent. The tertiary creep stage represents imminent failure of the
member (specimen) and usually indicates progressive failure of the material. The secondary
stage is less determined and its duration is a function of material properties, geometry and the
level of sustained load.
0
2000
4000
6000
8000
10000
0 720 1440 2160 2880
Co
mp
ress
ive
stra
in (
με)
Time (hours)
0
2000
4000
6000
8000
10000
0 720 1440 2160 2880
Ten
sio
n s
trai
n (
με)
Time (hours)
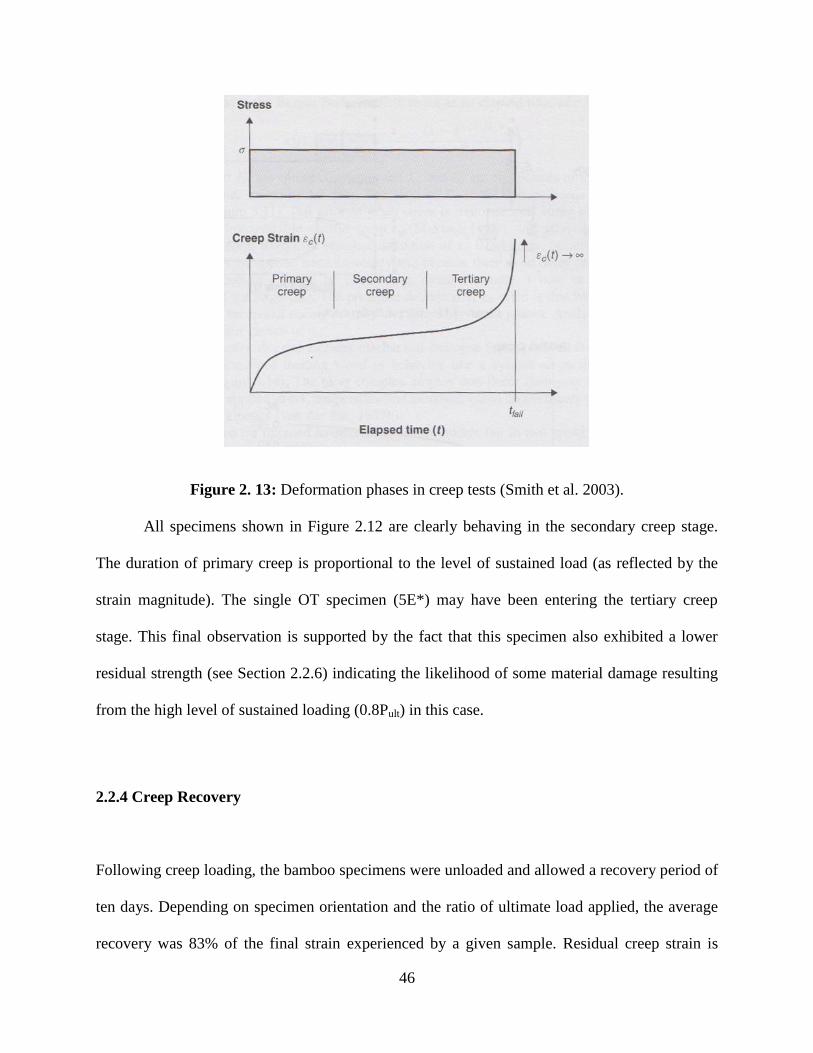
46
Figure 2. 13: Deformation phases in creep tests (Smith et al. 2003).
All specimens shown in Figure 2.12 are clearly behaving in the secondary creep stage.
The duration of primary creep is proportional to the level of sustained load (as reflected by the
strain magnitude). The single OT specimen (5E*) may have been entering the tertiary creep
stage. This final observation is supported by the fact that this specimen also exhibited a lower
residual strength (see Section 2.2.6) indicating the likelihood of some material damage resulting
from the high level of sustained loading (0.8Pult) in this case.
2.2.4 Creep Recovery
Following creep loading, the bamboo specimens were unloaded and allowed a recovery period of
ten days. Depending on specimen orientation and the ratio of ultimate load applied, the average
recovery was 83% of the final strain experienced by a given sample. Residual creep strain is

47
shown in Figure 2.12. The difference between the peak strain under sustained load and the
residual strain is the recovered strain. A perfectly elastic system, having 100% recovery would
exhibit zero residual strain. The figure shows the recovery of the elastic strain produced by the
initial load, but a portion of the plastic strain resulting from the sustained load remained after the
loads were removed. These plots mimic the creep recovery plot determined by Burger’s Model
in Figure 1.3b. Creep recovery ratios are defined as:
max,
1creep
residual
(2-6)
Creep recovery ratios are given in Table 2.1. The average value of creep recovery for OC
specimens was 0.90 while that for OT specimens was 0.81 indicating greater unrecoverable
plastic deformation in the OT specimens. Noteworthy values exist in the ratio of strain recovered
for specimens 4E and 5E*. These specimens recovered only 68% and 67% of their final strain,
respectively, possibly indicating a significant level of plastic deformation in these cases.
An explanation for the different degrees of creep recovery in the OC and OT specimens may be
based on the ultimate observed behavior. In the flexural tests to failure, failure always occurs at
the tension face of the beam. Because the inner wall of bamboo culm is composed primarily of
the lignin matrix, it may be expected to recover more fully than the outer wall which has a higher
fiber density. These tension-based failures and compositional differences contribute to the higher
recovery of specimens with outer fibers in compression (OC). Furthermore, tension damage to a
fiber-reinforced matrix (OT) is associated with components of fiber pull-out and fiber rupture
behavior. These components of damage are not recoverable.
48
2.2.5 Residual Strength
Following 90 days of sustained load and 10 days relaxation under no load, each of the specimens
was tested under monotonic bending in order to determine residual (post-creep) strength. The
specimens were tested in bending using the same test set-up as the control tests (Fig 2.1) which is
also the same loading geometry as the creep tests. Ultimate load, top and bottom MOR (Eqs 2-2
and 2-3) and the maximum deflection are reported in Table 2.1 for all creep and control
specimens. Applied load versus deflection and compression and tension strains are shown in
Figure 2.14. In these figures, the control specimens are shown plotted from the origin and the
post-creep residual strength tests are shifted 30 mm or 40000 με to the right for clarity. It is
important to note that the deflection and strain values shown in Figure 2.14 and the deflection
values in Table 2.1 for the creep specimens do not include the residual deflections and strains.
That is, these values are zeroed at the beginning of each flexure test.
The interpretation of residual strength results is intended to determine the effect of creep
conditioning on monotonic bending of clear bamboo specimens. Table 2.3 summarizes all
calculated modulus of rupture (MOR) values for the eight control tests and sixteen specimens
subject to creep testing. MOR is selected as a basis for comparison since this normalizes for
dimensional variation (Eqs 2-1 through 2-3). Based on the MOR values shown in Table 2.3, it
may be seen that creep had an apparent strengthening effect on the OC specimens. On the other
hand, the OT specimens showed a decrease in average (fr) and top MOR (ft) values and a small
increase in bottom MOR (fb). This behavior reflects an upward shift of the neutral axis in the
creep-tested OT specimens. This apparent behavior reinforces the differences between the
cellulose fiber-dense outer regions of the culm wall and the lignin-dominant inner regions. As
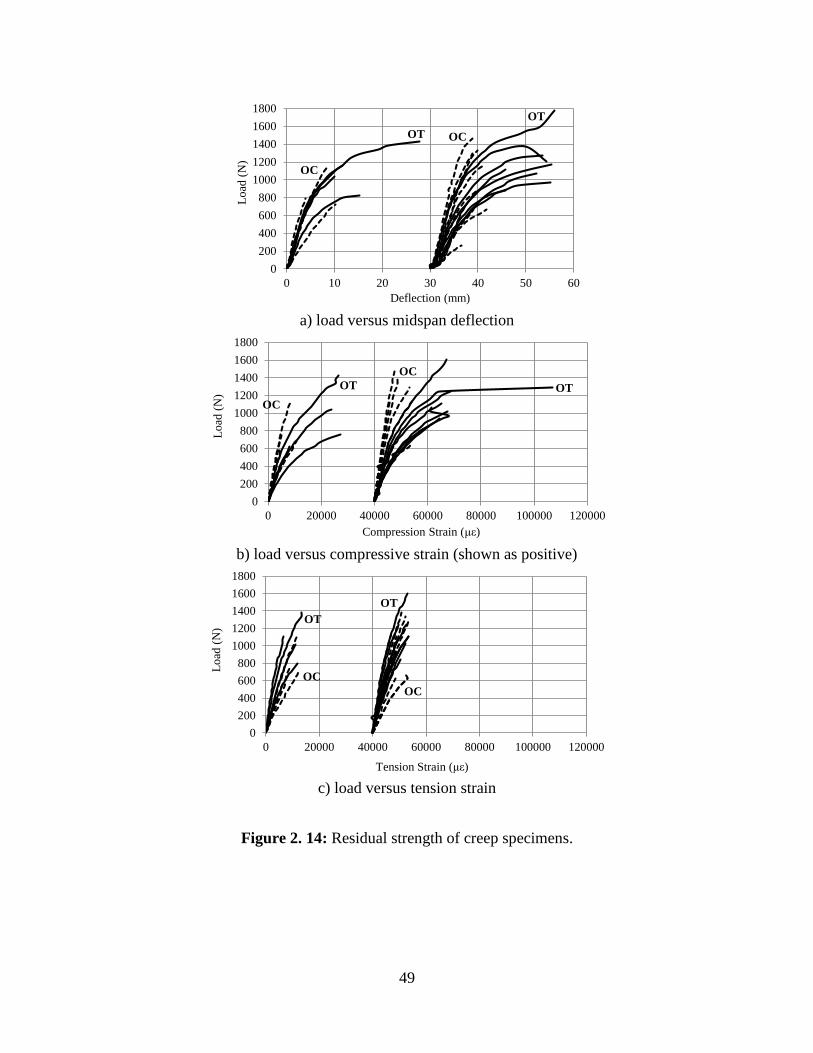
49
a) load versus midspan deflection
b) load versus compressive strain (shown as positive)
c) load versus tension strain
Figure 2. 14: Residual strength of creep specimens.
0
200
400
600
800
1000
1200
1400
1600
1800
0 10 20 30 40 50 60
Lo
ad (
N)
Deflection (mm)
OT
OC
OC
OT
0
200
400
600
800
1000
1200
1400
1600
1800
0 20000 40000 60000 80000 100000 120000
Lo
ad (
N)
Compression Strain (με)
OC
OC
OT OT
0
200
400
600
800
1000
1200
1400
1600
1800
0 20000 40000 60000 80000 100000 120000
Lo
ad (
N)
Tension Strain (με)
OC
OT
OC
OT

50
described in the previous section in relation to creep recovery, the lignin is quite soft and
therefore undergoes little plastic deformation during the creep testing. The fiber-reinforced
regions in tension (OT), exhibit a degree of plastic damage possibly associated with fiber rupture
and pull-out. Such damage would generally also be reflected in the OT MOR behavior.
The hypothesis that OC and OT behavior represents two distinctly separate data sets was
confirmed (p = 0.0004) by a applying a t-test to values of ft and fb by fr for each specimen
orientation. Because the groups are statistically significant, the theory that the orientation of the
specimen essentially develops two different materials is verified.
The level of sustained load applied to the creep specimens had little effect on the residual
strengths of the specimen. However, as shown in Figure 2.15, the post-creep MOR of the lignin
side of the specimen (ft for OC and fb for OT) increased with increased applied creep load. The
MOR of the fiber side of the specimen remained essentially constant. Once again, this result
indicates that the sustained load has a stiffening effect on the lignin.
Table 2. 3: Modulus of rupture values for control and creep specimens.
Control Specimens Specimens Subject to Creep Loads
Orientation fr ft fb fr ft fb
(MPa) (MPa) (MPa) (MPa) (MPa) (MPa)
OC 71.2 54.9 87.4 89.1 78.4 99.8
OT 101.1 129.8 72.4 94.8 108.4 81.1
all 86.1 92.4 79.9 91.9 93.4 90.4
Standard Deviation (COV)
OC 12.2 (0.172) 11.7 (0.213) 13.8 (0.158) 20.1 (0.226) 35.3 (0.450) 15.2 (0.152)
OT 23.5 (0.232) 34.4 (0.265) 15.7 (0.217) 7.3 (0.077) 28.6 (0.264) 30.6 (0.378)
all 23.6 (0.274) 46.5 (0.504) 15.9 (0.199) 14.9 (0.162) 34.7 (0.371) 25.3 (0.279)
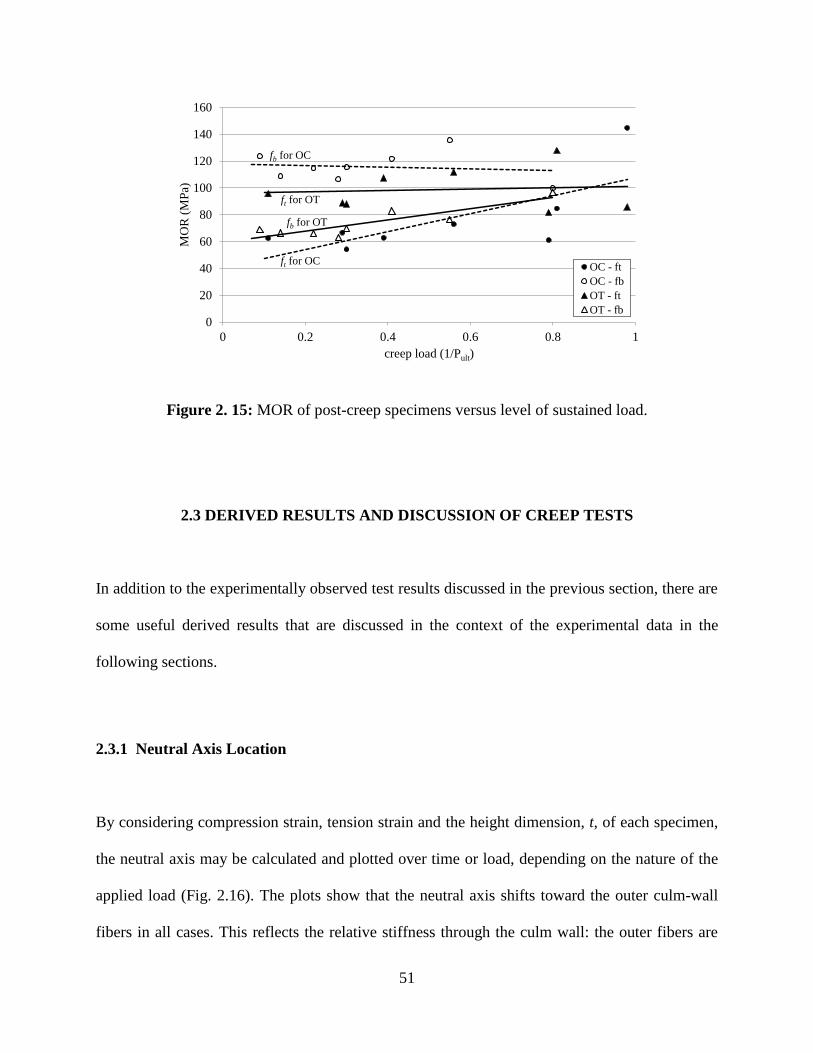
51
Figure 2. 15: MOR of post-creep specimens versus level of sustained load.
2.3 DERIVED RESULTS AND DISCUSSION OF CREEP TESTS
In addition to the experimentally observed test results discussed in the previous section, there are
some useful derived results that are discussed in the context of the experimental data in the
following sections.
2.3.1 Neutral Axis Location
By considering compression strain, tension strain and the height dimension, t, of each specimen,
the neutral axis may be calculated and plotted over time or load, depending on the nature of the
applied load (Fig. 2.16). The plots show that the neutral axis shifts toward the outer culm-wall
fibers in all cases. This reflects the relative stiffness through the culm wall: the outer fibers are
0
20
40
60
80
100
120
140
160
0 0.2 0.4 0.6 0.8 1
MO
R (
MP
a)
creep load (1/Pult)
OC - ft
OC - fb
OT - ft
OT - fb
ft for OC
fb for OC
ft for OT
fb for OT
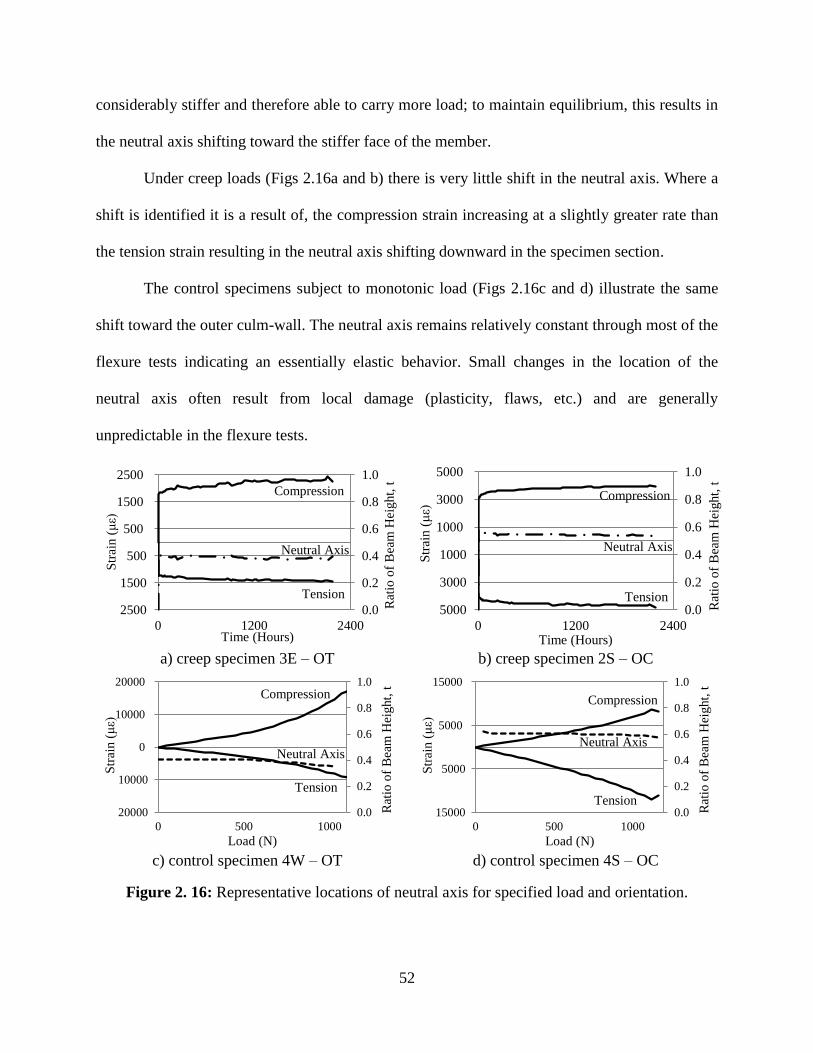
52
considerably stiffer and therefore able to carry more load; to maintain equilibrium, this results in
the neutral axis shifting toward the stiffer face of the member.
Under creep loads (Figs 2.16a and b) there is very little shift in the neutral axis. Where a
shift is identified it is a result of, the compression strain increasing at a slightly greater rate than
the tension strain resulting in the neutral axis shifting downward in the specimen section.
The control specimens subject to monotonic load (Figs 2.16c and d) illustrate the same
shift toward the outer culm-wall. The neutral axis remains relatively constant through most of the
flexure tests indicating an essentially elastic behavior. Small changes in the location of the
neutral axis often result from local damage (plasticity, flaws, etc.) and are generally
unpredictable in the flexure tests.
a) creep specimen 3E – OT b) creep specimen 2S – OC
c) control specimen 4W – OT d) control specimen 4S – OC
Figure 2. 16: Representative locations of neutral axis for specified load and orientation.
0.0
0.2
0.4
0.6
0.8
1.0
2500
1500
500
500
1500
2500
0 1200 2400
Rat
io o
f B
eam
Hei
ght,
t
Str
ain (
με)
Time (Hours)
Tension
Compression
Neutral Axis
0.0
0.2
0.4
0.6
0.8
1.0
5000
3000
1000
1000
3000
5000
0 1200 2400
Rat
io o
f B
eam
Hei
ght,
t
Str
ain (
με)
Time (Hours)
Tension
Compression
Neutral Axis
0.0
0.2
0.4
0.6
0.8
1.0
20000
10000
0
10000
20000
0 500 1000
Rat
io o
f B
eam
Hei
ght,
t
Str
ain (
με)
Load (N)
Compression
Tension
Neutral Axis
0.0
0.2
0.4
0.6
0.8
1.0
15000
5000
5000
15000
0 500 1000
Rat
io o
f B
eam
Hei
ght,
t
Str
ain (
με)
Load (N)
Compression
Tension
Neutral Axis
53
2.3.2 ASTM D6815 Standard Criteria
ASTM D6815-09 Standard Specification for Evaluation of Duration of Load and Creep Effects
of Wood and Wood-Based Products provides a standard basis for the evaluation of the duration
of load and creep on wood and wood-based products subjected to bending stress. These
standards were considered in the test configuration used in this study and are applied partially in
an effort to evaluate the bamboo tests and to assess whether such standards may be universally
adopted for bamboo. Criteria for a successful test include adequate strength over a 90-day period,
decreasing creep rate, and limited fractional deflection. Adequate strength over a 90-day period
may be confirmed if the 90-day fractional deflection (FD90), defined as the ratio of the deflection
at 90 days of sustained loading (D90) to the deflection at one minute after loading (D1), is less
than or equal to 2.0; that is:
0.21
9090
D
DFD (2-7)
The fractional deflection may be generally defined at any time, t, as Dt/D1 as shown in
Figure 2.17b. The decreasing creep rate may be verified by the inequality:
60903060130 DDDDDD (2-8)
In which the values are deflections at 1 minute and 30, 60 and 90 days as shown in Figure 2.17a.
The three terms of Eq. 2-8 represent the creep rates at 30, 60 and 90 days, respectively as shown
in Figure 2.17b.
Using Equations 2-7 and 2-8, the performance of each specimen based on the standard
criteria of ASTM D6815-09 is evaluated as shown in Table 2.4 which summarizes the 100 day
creep history of each specimen. All specimens meet the requirements described for adequate
strength after 90 days and limited fractional deflection. The decreasing creep rate is verified in
54
the majority of specimens; the almost 40% of specimens which do not meet the standard for
decreasing creep rate have a creep rate less than 4% of the overall deflection. Because of the
nearly constant creep rate after 90 days, the fact that it is not technically decreasing may be
attributed to measurement precision although the specimens entering the tertiary stage of creep
distortion (Fig. 2.13) cannot be entirely discounted. It is stated in ASTM D6815 that the error in
measurement due to both the human operator and the measuring device may be ignored in this
case because the scale of the differences in measurements was negligible. It may be assumed,
therefore, that at this point the creep rate is relatively constant. In addition to the D6815 standard
criteria, the relative creep should also decrease over each 30 day span. This decrease in relative
creep is seen in the results (Table 2.4).
The phases of creep development (Fig. 2.13) may be verified by the criteria described.
Primary creep is characterized by the fact that the rate of deformation accumulation decreases as
time progresses. The majority of specimens meet the decreasing creep rate criteria. Secondary
creep corresponds to the phase in which the creep rate is essentially constant in time. This phase
is seen in all creep plots (Fig. 2.12) and is evident in the fractional creep and creep rate data
(Table 2.4). During the tertiary creep phase, the creep rate increases as time progresses. This is
evident in the heavily loaded specimens 5S*, 5E* and 6W*. As described previously (in relation
to Fig. 2.11b and 2.12), it was expected that Specimen 5E* certainly entered the tertiary creep
stage. Creep rupture occurs after a specimen has experienced the tertiary creep phase to the point
of failure (Smith et al. 2003). There is interest in extending the experiment duration under large
loads in order to evaluate tertiary creep and eventual creep rupture in a bamboo specimen.
The creep factor is defined as the ratio of the total deflection to the instantaneous
deflection. This is the fractional deflection (Eq. 2-7) and is usually desired for ‘long term’
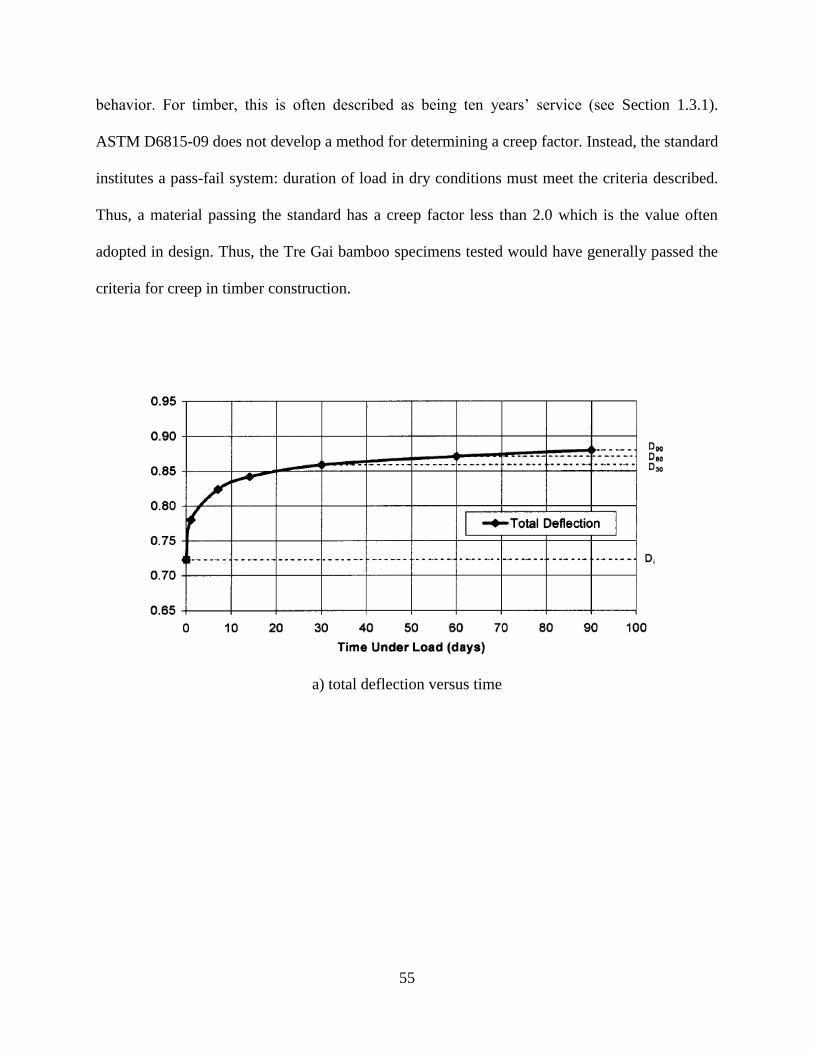
55
behavior. For timber, this is often described as being ten years’ service (see Section 1.3.1).
ASTM D6815-09 does not develop a method for determining a creep factor. Instead, the standard
institutes a pass-fail system: duration of load in dry conditions must meet the criteria described.
Thus, a material passing the standard has a creep factor less than 2.0 which is the value often
adopted in design. Thus, the Tre Gai bamboo specimens tested would have generally passed the
criteria for creep in timber construction.
a) total deflection versus time
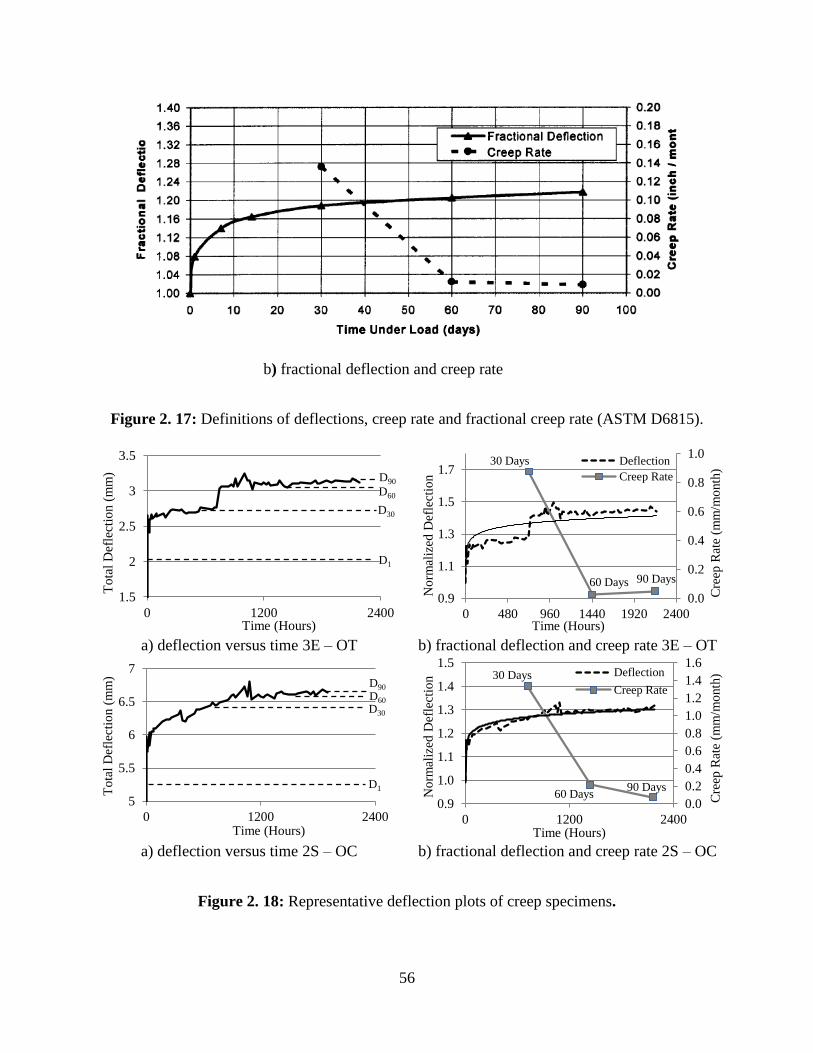
56
b) fractional deflection and creep rate
Figure 2. 17: Definitions of deflections, creep rate and fractional creep rate (ASTM D6815).
a) deflection versus time 3E – OT b) fractional deflection and creep rate 3E – OT
a) deflection versus time 2S – OC b) fractional deflection and creep rate 2S – OC
Figure 2. 18: Representative deflection plots of creep specimens.
1.5
2
2.5
3
3.5
0 1200 2400
To
tal
Def
lect
ion (
mm
)
Time (Hours)
D60
D1
D90
D30
90 Days60 Days
30 Days
0.0
0.2
0.4
0.6
0.8
1.0
0.9
1.1
1.3
1.5
1.7
0 480 960 1440 1920 2400
Cre
ep R
ate
(mm
/mo
nth
)
No
rmal
ized
Def
lect
ion
Time (Hours)
Deflection
Creep Rate
5
5.5
6
6.5
7
0 1200 2400
To
tal
Def
lect
ion (
mm
)
Time (Hours)
D60
D1
D90
D30
90 Days60 Days
30 Days
0.0
0.2
0.4
0.6
0.8
1.0
1.2
1.4
1.6
0.9
1.0
1.1
1.2
1.3
1.4
1.5
0 1200 2400
Cre
ep R
ate
(mm
/mo
nth
)
No
rmal
ized
Def
lect
ion
Time (Hours)
Deflection
Creep Rate

57
Table 2. 4: Summary of creep and total deflections.
Spec.
Ratio
of
Pult
Orient. Criteria
Time Under Load (Hours)
0.0167 24 168 336 720 1440 2160
(1 min) (1d) (1 wk) (2 wks) (1 mon.) (2 mon.) (3 mon.)
2N 0.44 OC
Total Deflection (mm) 3.21 3.20 3.20 3.10 3.29 3.39 3.39
Creep Rate (mm/month) 0.08 0.10 0.00
Fractional Deflection 1.00 1.00 1.00 0.96 1.02 1.06 1.06
2S 0.80 OC
Total Deflection (mm) 5.11 5.88 6.20 6.31 6.44 6.63 6.73
Creep Rate (mm/month) 1.33 0.19 0.10
Fractional Deflection 1.00 1.15 1.21 1.24 1.26 1.30 1.32
3N 0.31 OC
Total Deflection (mm) 2.93 3.08 3.22 3.13 3.20 3.35 3.36
Creep Rate (mm/month) 0.27 0.15 0.01
Fractional Deflection 1.00 1.05 1.10 1.07 1.09 1.14 1.15
4N 0.57 OC
Total Deflection (mm) 2.28 2.91 2.93 2.95 2.99 2.96 3.08
Creep Rate (mm/month) 0.41 -0.03 0.11
Fractional Deflection 1.00 1.13 1.13 1.14 1.16 1.15 1.19
5N 0.29 OC
Total Deflection (mm) 3.18 3.15 3.20 3.18 3.24 3.47 3.57
Creep Rate (mm/month) 0.06 0.23 0.10
Fractional Deflection 1.00 0.99 1.01 1.00 1.02 1.09 1.12
5S 0.25 OC
Total Deflection (mm) 2.28 2.64 2.64 2.61 2.64
Creep Rate (mm/month) 0.36
Fractional Deflection 1.00 1.16 1.16 1.14 1.16
5S* 1.00 OC
Total Deflection (mm) 4.45 4.73 4.91 4.90 5.00 5.06 5.18
Creep Rate (mm/month) 2.36 0.06 0.11
Fractional Deflection 1.95 2.07 2.15 2.15 2.19 2.22 2.27
6N 0.1 OC
Total Deflection (mm) 1.33 1.94 1.82 1.91 1.89
Creep Rate (mm/month) 0.56
Fractional Deflection 1.00 1.46 1.37 1.44 1.42
6N* 0.83 OC
Total Deflection (mm) 3.79 3.95 4.42 4.36 4.26 4.28 4.17
Creep Rate (mm/month) 2.37 0.01 -0.10
Fractional Deflection 2.85 2.97 3.32 3.28 3.21 3.22 3.14
6S 0.11 OC
Total Deflection (mm) 2.21 2.35 2.24 2.29 2.17 2.23 2.14
Creep Rate (mm/month) -0.04 0.06 -0.09
Fractional Deflection 1.00 1.06 1.02 1.04 0.98 1.01 0.97
2E 0.49 OT
Total Deflection (mm) 3.07 3.24 3.31 3.48 3.48 3.67 3.72
Creep Rate (mm/month) 0.41 0.19 0.05
Fractional Deflection 1.00 1.05 1.08 1.13 1.13 1.19 1.21
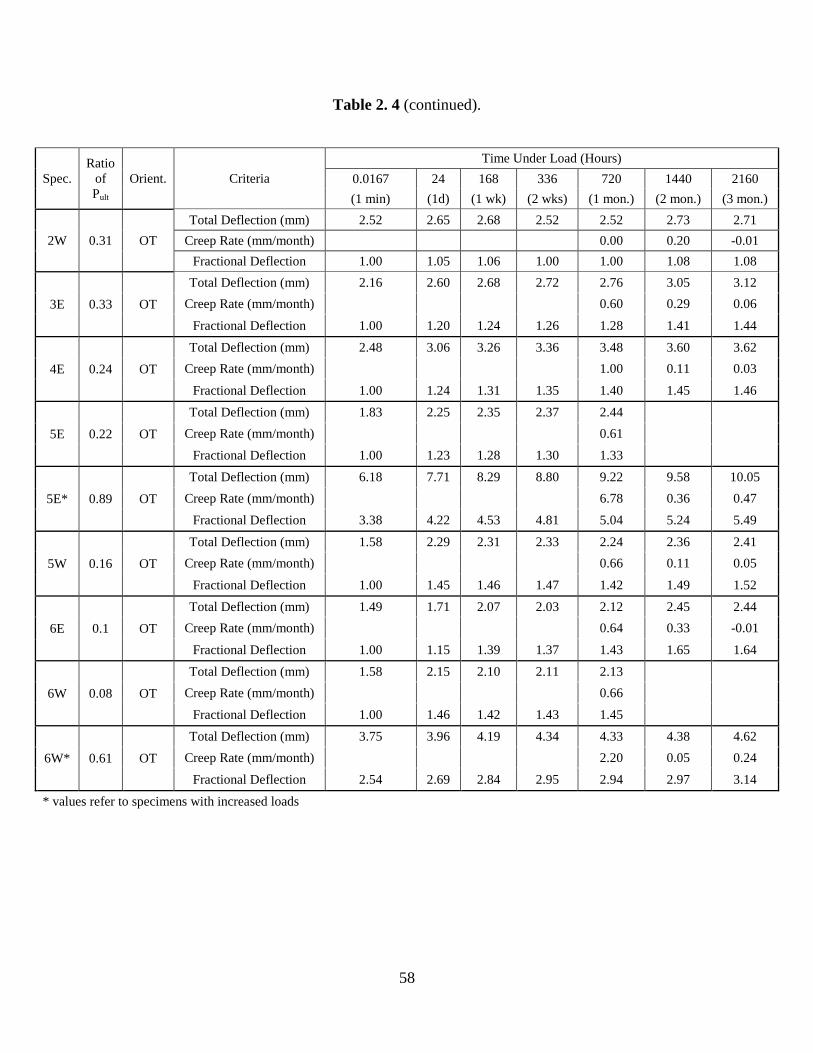
58
Table 2. 4 (continued).
Spec.
Ratio
of
Pult
Orient. Criteria
Time Under Load (Hours)
0.0167 24 168 336 720 1440 2160
(1 min) (1d) (1 wk) (2 wks) (1 mon.) (2 mon.) (3 mon.)
2W 0.31 OT
Total Deflection (mm) 2.52 2.65 2.68 2.52 2.52 2.73 2.71
Creep Rate (mm/month) 0.00 0.20 -0.01
Fractional Deflection 1.00 1.05 1.06 1.00 1.00 1.08 1.08
3E 0.33 OT
Total Deflection (mm) 2.16 2.60 2.68 2.72 2.76 3.05 3.12
Creep Rate (mm/month) 0.60 0.29 0.06
Fractional Deflection 1.00 1.20 1.24 1.26 1.28 1.41 1.44
4E 0.24 OT
Total Deflection (mm) 2.48 3.06 3.26 3.36 3.48 3.60 3.62
Creep Rate (mm/month) 1.00 0.11 0.03
Fractional Deflection 1.00 1.24 1.31 1.35 1.40 1.45 1.46
5E 0.22 OT
Total Deflection (mm) 1.83 2.25 2.35 2.37 2.44
Creep Rate (mm/month) 0.61
Fractional Deflection 1.00 1.23 1.28 1.30 1.33
5E* 0.89 OT
Total Deflection (mm) 6.18 7.71 8.29 8.80 9.22 9.58 10.05
Creep Rate (mm/month) 6.78 0.36 0.47
Fractional Deflection 3.38 4.22 4.53 4.81 5.04 5.24 5.49
5W 0.16 OT
Total Deflection (mm) 1.58 2.29 2.31 2.33 2.24 2.36 2.41
Creep Rate (mm/month) 0.66 0.11 0.05
Fractional Deflection 1.00 1.45 1.46 1.47 1.42 1.49 1.52
6E 0.1 OT
Total Deflection (mm) 1.49 1.71 2.07 2.03 2.12 2.45 2.44
Creep Rate (mm/month) 0.64 0.33 -0.01
Fractional Deflection 1.00 1.15 1.39 1.37 1.43 1.65 1.64
6W 0.08 OT
Total Deflection (mm) 1.58 2.15 2.10 2.11 2.13
Creep Rate (mm/month) 0.66
Fractional Deflection 1.00 1.46 1.42 1.43 1.45
6W* 0.61 OT
Total Deflection (mm) 3.75 3.96 4.19 4.34 4.33 4.38 4.62
Creep Rate (mm/month) 2.20 0.05 0.24
Fractional Deflection 2.54 2.69 2.84 2.95 2.94 2.97 3.14
* values refer to specimens with increased loads
59
2.4 CONCLUSIONS OF CREEP TESTS
The dearth of information on the creep characteristics of bamboo inspired the development of an
experiment focusing primarily on the effect of sustained load on bamboo. A secondary focus was
the effect of the orientation of the radial fiber density within the specimens. Contrary to the
conclusions of Janssen (1981), who indicated that creep effects in bamboo are negligible
(Section 1.3.3), significant creep-induced plastic deformations and strains were observed in the
present work.
The orientation of the specimen – whether the fiber-rich outer culm wall is placed in
compression or tension (OC or OT, respectively) was found to have significant effect on both the
creep behavior and residual strength of creep-conditioned specimens. The results showed that the
bamboo loaded with the outer culm-wall in tension (OT) generally exhibited the following when
compared to specimens with outer culm-wall in compression (OC).
a) a larger modulus of rupture due to the reinforcing effects of the fibers in tension;
b) a lower apparent modulus of elasticity due to the softer lignin exhibiting high
compressive strains; and,
c) a lower residual strength following creep conditioning.
These observations are all explained by the difference in behavior between the fiber-rich outer
culm wall and the lignin-rich inner culm wall. Specifically, damage to a fiber-reinforced matrix
(OT) in tension exhibits components of fiber pull-out and fiber rupture. These components of
damage are not recoverable. The lignin matrix, on the other hand, is soft and behaves in an
essentially elastic manner; exhibiting mostly recoverable strains.

60
As summarized in Figure 2.19, the creep trends based on specimen orientation throughout the
loading period are comparable. Although the rates of creep values are similar, the average
quantitative relative creep effects are higher in specimens with outer fibers in tension (OT).
Similarly, the creep displacement and creep strains are higher in specimens with outer fibers in
tension (OT).
Figure 2. 19: Creep trends within specified orientations.
65
80
95
110
Aver
age
MO
R (
MP
a) OT
OC
300
600
900
1200
Cre
ep S
trai
n (
με)
OT
OC
1.1
1.4
1.7
2.0
Rel
ativ
e C
reep
(με/
με)
OC
OT
0.0
0.5
1.0
1.5
0 720 1440 2160 2880
Cre
ep D
isp
lace
men
t
(mm
)
Time (hours)
OC
OT

61
Additionally when considering residual strength, Figure 2.19 illustrates the strengthening
effects of creep on OC specimens and the detrimental effects of creep on OT specimens. The
values at zero hours represent the capacity in terms of the average modulus of rupture of control
specimens of the specified orientation while the values at 2400 hours represent the residual
capacity following 90 days of creep conditioning and subsequent 10 days of recovery. While the
average modulus of rupture (fr) values for control specimens is quite different depending on
orientation (fr = 71.2 MPa for OC and fr = 101.1 MPa for OT specimens), the average fr values
representing residual capacity are quite similar (fr = 89.1 MPa for OC and fr = 94.8 MPa for OT
specimens). It is believed that the significant decrease in capacity of OT specimens is related to
the damage of the fibers due to creep. Since the orientation of the OC specimens results in a
stiffening of the lignin, the creep effects increase the capacity of the bamboo (see section 2.2.6).
The results of the creep experiments showed that the relative creep along with the 90-day
strength, creep rate and fractional deflection of bamboo meet or exceed the ASTM 6815
acceptance criteria for wood. The structural similarities between wood and bamboo provide a
convenient relationship suggesting that many of the test standards suitable for wood may be
applied to bamboo with minor revisions. The Tre Gai bamboo tested met the ASTM 6815
acceptance criteria demonstrating a resistance to extensive creep at high ratios of the ultimate
load. This result suggests that for the structural design of bamboo, a load duration factor similar
to that of wood may be employed. The load duration factor (Fig. 1.2) may be interpreted as being
inversely proportional to the creep factor. Thus the implied creep factor for timber associated
with a ten-year sustained load is:
(2-9)
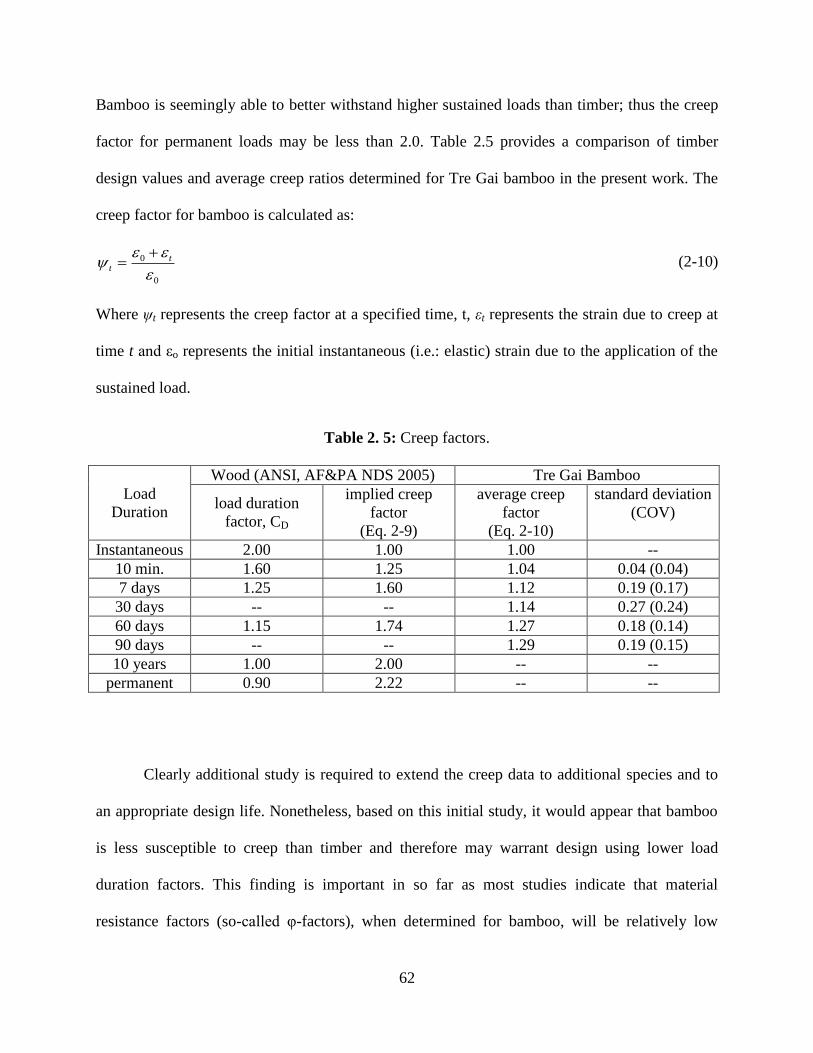
62
Bamboo is seemingly able to better withstand higher sustained loads than timber; thus the creep
factor for permanent loads may be less than 2.0. Table 2.5 provides a comparison of timber
design values and average creep ratios determined for Tre Gai bamboo in the present work. The
creep factor for bamboo is calculated as:
0
0
t
t
(2-10)
Where ψt represents the creep factor at a specified time, t, εt represents the strain due to creep at
time t and εo represents the initial instantaneous (i.e.: elastic) strain due to the application of the
sustained load.
Table 2. 5: Creep factors.
Load
Duration
Wood (ANSI, AF&PA NDS 2005) Tre Gai Bamboo
load duration
factor, CD
implied creep
factor
(Eq. 2-9)
average creep
factor
(Eq. 2-10)
standard deviation
(COV)
Instantaneous 2.00 1.00 1.00 --
10 min. 1.60 1.25 1.04 0.04 (0.04)
7 days 1.25 1.60 1.12 0.19 (0.17)
30 days -- -- 1.14 0.27 (0.24)
60 days 1.15 1.74 1.27 0.18 (0.14)
90 days -- -- 1.29 0.19 (0.15)
10 years 1.00 2.00 -- --
permanent 0.90 2.22 -- --
Clearly additional study is required to extend the creep data to additional species and to
an appropriate design life. Nonetheless, based on this initial study, it would appear that bamboo
is less susceptible to creep than timber and therefore may warrant design using lower load
duration factors. This finding is important in so far as most studies indicate that material
resistance factors (so-called φ-factors), when determined for bamboo, will be relatively low

63
(Mitch 2009 reports a value of φ = 0.44 in one preliminary study). A lower creep factor for
permanent loads may help to mitigate the impact of a low material resistance factor. A final
issue that requires resolution is the choice of design life for bamboo; this may be a function of
the application, environment and whether the structure is intended to be permanent or temporary.
2.4.1 Future Work
This study of the creep behavior of small clear bamboo specimens has demonstrated an approach
for developing creep data for bamboo. Future tests must include a variety of bamboo species
since the fiber distribution through the culm wall (for instance) is known to vary from species to
species (Grosser and Liese 1971). Additionally, extended-duration tests are required. This is
particularly the case for larger sustained loads since some of the present specimens exhibited
evidence of entering the tertiary stage of creep behavior indicating that creep failure may have
been imminent. The implementation of such a long term project may also facilitate the
development of more precise creep coefficients and a better defined series of load duration
factors.
Additional experiments which increase the ratio of the ultimate load applied in order to
generate creep rupture within the 90-day duration of a standard test may greatly benefit the
growing knowledge of creep characteristics in bamboo; particularly the nature of the eventual
failure. Finally, progression to larger scale and full-culm specimens is necessary. To observe
how a full-culm specimen reacts to a sustained load may help create a relationship between the
small-scale and full-scale tests, developing more practical design factors and standardization.
Large scale test will provide insight into the interaction of culm-wall fiber densities. In a full-

64
culm test, the fiber-rich outer culm wall is at both the extreme compression and tension faces of
the element. The full-culm creep test must be understood well enough that a relationship to the
easier-to-conduct clear specimen tests may be established.

65
3.0 CULM BENDING TESTS
A total of twelve full-culm bending tests were conducted; each type of test utilized two species
with three culms each. Each of the species, Phyllostachys pubescens (Moso) and Bambusa
stenostachya (Tre Gai), were taken from the same batch of bamboo used in Richard’s (2013)
experiments. For this reason, the results of the experiments may be directly compared.
As described in Section 1.4, motivated by understanding the longitudinal splitting limit
state of full-culm bamboo, much work has been conducted on the bending of bamboo culms.
Particularly at the University of Pittsburgh, Sharma (2010) and Mitch (2009) evaluated the
Mode I transverse tension (splitting) capacity of bamboo. Richard (2013) conducted additional
research that studied the interaction between Mode I tension and Mode II shear failures in the
mixed-mode conditions that occurs in flexure specimens. The current experiments aim to further
evaluate the mixed-mode behavior based on the conclusions that were drawn by Richard. A
summary of important conclusions drawn from Richard’s work include:
a) Full-culm bending tests (vertical notch mixed-mode failure) exhibit lower strength values
than the bowtie (pure Mode II failure), split-pin (pure Mode I failure) and smaller clear
bamboo flexural specimens (unnotched mixed-mode failure).
b) Mode II capacity is generally greater than Mode I capacity for brittle, unidirectional
fiber-reinforced materials. The mixed-mode failure in the notched culms is dominated by
the presence of Mode I stress and the lower Mode I capacity.
66
c) The tension face notch often affected boundary and loading conditions during the
experiment. For these reasons, the location and nature of the notch should be
reconsidered.
d) Adjusting the span of the culm and eliminating the notch, allowing for a natural
longitudinal shear failure may more accurately capture the interaction between Mode I
and Mode II shear failures under four point bending.
This study builds primarily on items c and d and has, as an additional goal, the objective of
improving upon the present ISO culm bending tests.
3.1 TEST PROGRAMME
It was determined by Vaessen and Janssen (1997) and later adopted by the ISO (2004b) that a
standard span for four point bending of a bamboo culm should have a length that is equal to or
greater than thirty times the culm diameter (S ≥ 30D). Theoretically, a bamboo culm with a
length greater than 26D should fail in flexure while one shorter should result in a shear-
dominated failure. Because bamboo is particularly susceptible to longitudinal splitting, the series
of full-culm bending tests conducted in the present work are intended to capture a mixed-mode
shear failure. Three different variations of the standard bamboo culm bending test (ISO 2004b)
were conducted in order to obtain the apparent mixed-mode shear capacity of bamboo under
flexure loads. A schematic representation of the culm-flexural test is shown in Figure 3.1.

67
Figure 3. 1: Full-culm bending test arrangement (Richard 2013).
3.1.1 Notched Standard-Span Culm Bending Tests
The first variation on the standard culm bending test implemented in the present study consisted
of a full length (S ≥ 30D) culm with symmetric longitudinal notches at midspan (Fig. 3.2). Three
Moso specimens were tested in four point flexure over a span of approximately 38D while three
Tre Gai culms were tested over spans of 30D. The span and load configurations are shown in
Table 3.1. While the culms respected the span requirements for flexure-induced failure, the
horizontal notches at midspan were provided to initiate longitudinal splitting and a subsequent
failure governed instead by the longitudinal shear capacity of the culm. The notches, located on
both sides of the culm at the mid-depth of the culm (Fig. 3.2), were located at the middle of an
internode in an effort to capture cracking in both longitudinal directions unaffected by the
presence of a node. Aside from these nodal-based restrictions, the notches were located as close
to midspan as possible.

68
Figure 3. 2: Longitudinal notch and strain gages on standard-span culm.
The notch was achieved by first drilling a 9.5 mm (0.375 in.) hole straight through the
culm in order to ensure that the notch was located at the same location on both sides of the culm.
A Dremel rotary tool with a stone grinding wheel was then used to produce a notch 25.4mm (1
in.) in length in each longitudinal direction. The total length of the notch was therefore 60.3 mm
(2.4 in.). The notch was approximately 3 mm (0.12 in.) wide and passed fully through the
thickness of each culm wall. Strain gages were placed at either end of the notch (seen in Fig 3.2)
in an effort to capture the strain values at the initiation of cracking.
For testing, draw wire transducers (DWTs) were attached at each support point, at each
loading point and at the midspan. The wire, having a nut and bolt configuration connected to its
end, was fastened to the culm.
3.1.2 Modified Standard-Span Bending Re-tests
Following initial testing, it was found that, despite the presence of the notches, the long flexible
standard-span culms, in three cases, did not exhibit a shear failure prior to exceeding the
displacement capacity of the test frame (about 330 mm). In these three cases, the culm was

69
retested with the notch located in the shear span region of a shorter overall span. As shown in
Table 3.1, the notch was located within a 5D shear span while the constant moment region and
other shear span were maintained at 8.7D. With this arrangement, it was felt that the shear failure
could be ‘forced’ to occur at the notch in the reduced shear span. Because of space restrictions,
the deflections were able to be measured only at the loading and support points for these re-tests.
3.1.3 Short-span Culm Bending Tests
The third variation of the standard-span bending test involved testing over a shorter span,
encouraging the culms to experience a ‘natural’ shear failure. A series of six experiments were
conducted with a reduced span. The clear span for the three Tre Gai culms was approximately
15D (Fig 3.3a) while the three Moso culms had spans of about 19D (Fig 3.3b). The short span
culms were unnotched, and all tests were run in four point bending with equal third spans
(Fig. 3.1).
Strain gages were applied at the four cardinal locations around the culm at midspan as
shown in Figure 3.3c. Two of the strain gages were placed perpendicular to the fibers at the culm
neutral axis in order to measure tangential strains in the culm. An additional two strain gages
were placed parallel to the fibers on the tension and compression faces in order to measure the
corresponding flexural strains. Unlike the standard-span culms, only three displacement
measurements were able to be recorded for the short span tests. Displacement data was acquired
using DWTs located at both supports and at midspan.
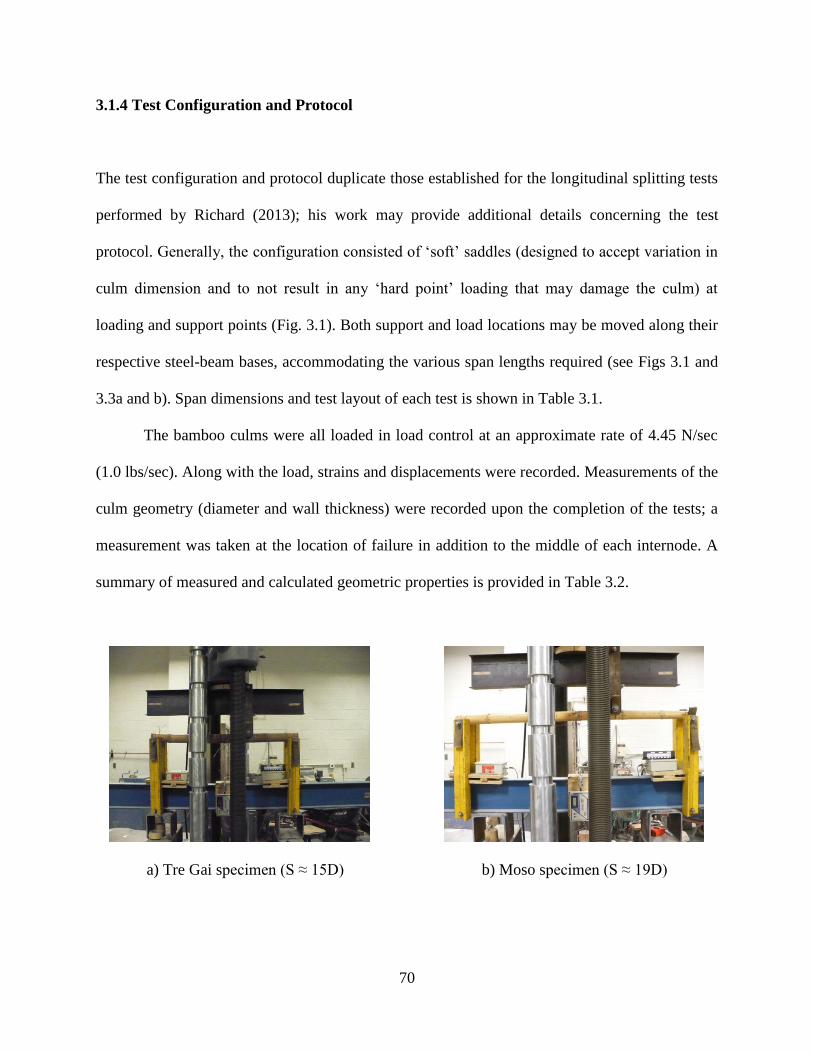
70
3.1.4 Test Configuration and Protocol
The test configuration and protocol duplicate those established for the longitudinal splitting tests
performed by Richard (2013); his work may provide additional details concerning the test
protocol. Generally, the configuration consisted of ‘soft’ saddles (designed to accept variation in
culm dimension and to not result in any ‘hard point’ loading that may damage the culm) at
loading and support points (Fig. 3.1). Both support and load locations may be moved along their
respective steel-beam bases, accommodating the various span lengths required (see Figs 3.1 and
3.3a and b). Span dimensions and test layout of each test is shown in Table 3.1.
The bamboo culms were all loaded in load control at an approximate rate of 4.45 N/sec
(1.0 lbs/sec). Along with the load, strains and displacements were recorded. Measurements of the
culm geometry (diameter and wall thickness) were recorded upon the completion of the tests; a
measurement was taken at the location of failure in addition to the middle of each internode. A
summary of measured and calculated geometric properties is provided in Table 3.2.
a) Tre Gai specimen (S ≈ 15D) b) Moso specimen (S ≈ 19D)
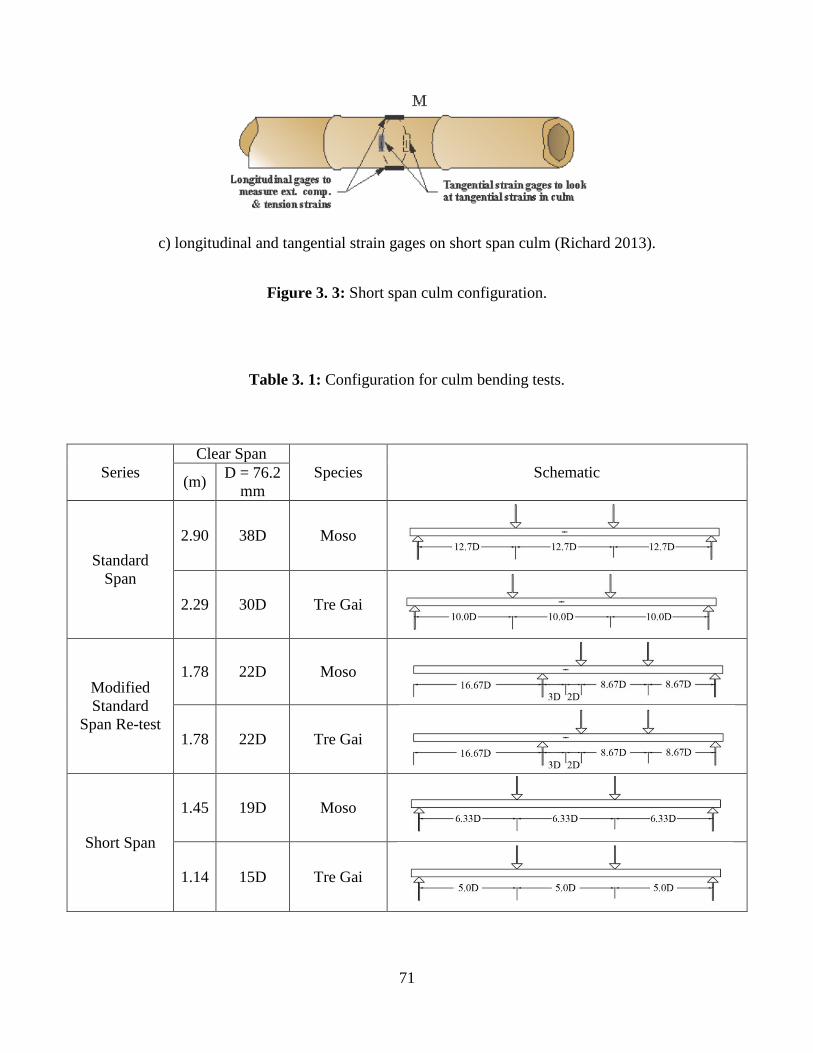
71
c) longitudinal and tangential strain gages on short span culm (Richard 2013).
Figure 3. 3: Short span culm configuration.
Table 3. 1: Configuration for culm bending tests.
Series
Clear Span
Species Schematic (m)
D = 76.2
mm
Standard
Span
2.90 38D Moso
2.29 30D Tre Gai
Modified
Standard
Span Re-test
1.78 22D Moso
1.78 22D Tre Gai
Short Span
1.45 19D Moso
1.14 15D Tre Gai

72
Table 3. 2: Summary of geometric properties and ultimate shear values.
Test Specimen Test Span, S Critical
Shear
Span
Average Geometric Values at Midspan Values at Failure
Outer
Diameter
Wall
Thickness Area
Moment
of Inertia Shear Force
Shear
Stress
Avg.
Long.
Strain
Avg.
Tang.
Strain Description
of Failure3
D t A I V τ εL εT
(mm)
(mm) (mm) (mm2) (mm
4) (N) (MPa) (με) (με)
Sh
ort
Sp
an
1 TG-1B 1143 16.7D 5.6D 68.33 14.7 2477 957456 5761 4.44 8285 415 RTF
2 TG-9T 1143 16.1D 5.4D 71.16 23.53 3521 1242202 6511 6.43 6400 1500 RTF
3 TG-9B 1143 16.7D 5.6D 68.34 22.52 3242 1056062 5571 2.99 8765 1465 RTF
4 M-3T 1448 18.6D 6.2D 77.86 11.12 2331 1334323 5251 4.42 8798 1555 BCF
5 M-5T 1448 19.9D 6.6D 72.76 7.06 1457 795214 2308 3.14 4140 4233 V@N
6 M-5B 1448 23.9D 8.0D 60.66 6.09 1045 393703 2595 4.93 8710 1218 V@N
Sta
nd
ard
Sp
an
7 TG-5 2286 34.3D 11.4D 66.66 18.75 2822 933517 81243 3.91 - 1118 V@N
8 TG-101 2286 32.3D 10.8D
70.71 17.7 2948 1151116 > 107350 > 3.99 - > 771 n.a.
8R TG-10R2 1778 25.1D 5.6D 5962 8.11 - 1518 V@N
9 TG-13 2286 29.7D 9.9D 76.97 16.35 3114 1534264 73274 2.72 - - V/N
10 M-61 2896 37.4D 12.5D
77.52 6.59 1469 931967 > 63027 > 4.77 - > 1500 n.a.
10R M-6R2 1778 22.9D 5.1D 5956 11.50 - 2621 V@N
11 M-71 2896 44.2D 14.7D
65.53 7.17 1314 567771 > 69556 > 5.08 - > 1430 n.a.
11R M-7R2 1778 27.1D 6.1D 5290 12.23 - 5197 V@N
12 M-10 2896 44.4D 14.8D 65.24 7.26 1322 564298 131063 9.77 - 11762 V@N 1 initial test at standard length; maximum shear and strain values observed during test are reported (>) although no failures were observed
2 retest at shorter shear span
3 failure modes:
n.a. = no failure observed
BCF = buckling at compression face
RTF = node-induced rupture at tension face
V@N = shear at neutral axis at midspan (i.e.: notch location for standard span specimens)
V/N = shear away from neutral axis at midspan (i.e.: notch location for standard span specimens)
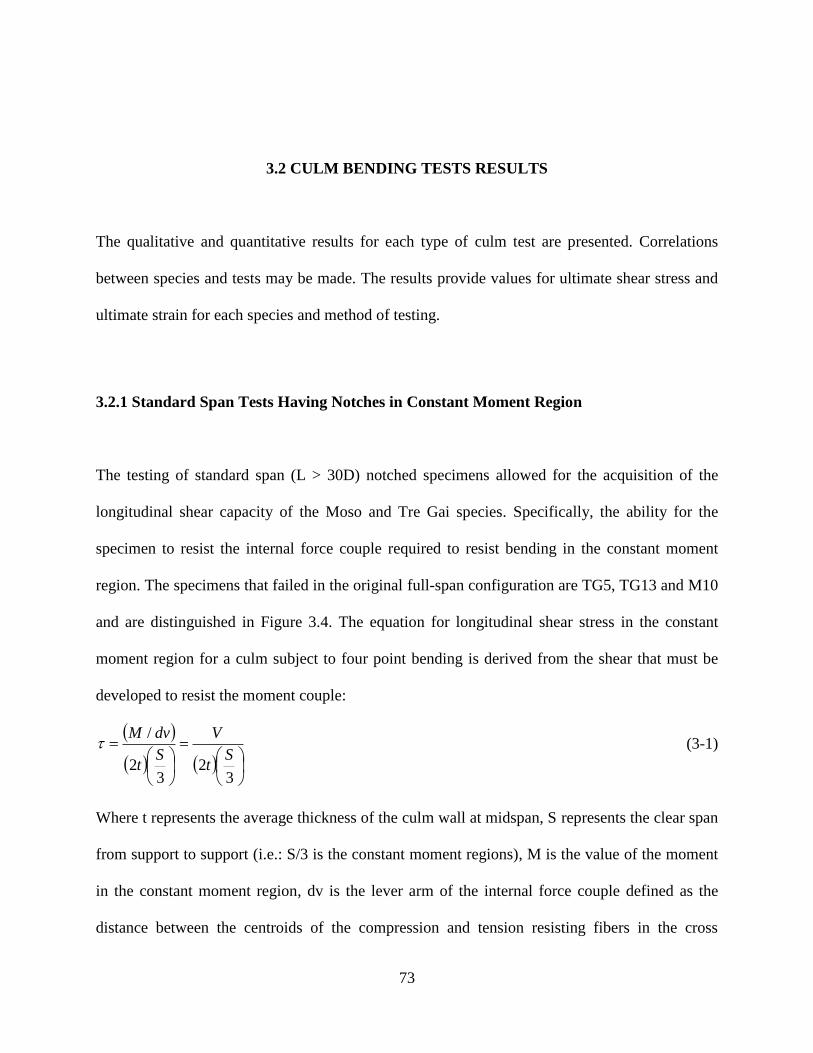
73
3.2 CULM BENDING TESTS RESULTS
The qualitative and quantitative results for each type of culm test are presented. Correlations
between species and tests may be made. The results provide values for ultimate shear stress and
ultimate strain for each species and method of testing.
3.2.1 Standard Span Tests Having Notches in Constant Moment Region
The testing of standard span (L > 30D) notched specimens allowed for the acquisition of the
longitudinal shear capacity of the Moso and Tre Gai species. Specifically, the ability for the
specimen to resist the internal force couple required to resist bending in the constant moment
region. The specimens that failed in the original full-span configuration are TG5, TG13 and M10
and are distinguished in Figure 3.4. The equation for longitudinal shear stress in the constant
moment region for a culm subject to four point bending is derived from the shear that must be
developed to resist the moment couple:
32
32
/
St
V
St
dvM (3-1)
Where t represents the average thickness of the culm wall at midspan, S represents the clear span
from support to support (i.e.: S/3 is the constant moment regions), M is the value of the moment
in the constant moment region, dv is the lever arm of the internal force couple defined as the
distance between the centroids of the compression and tension resisting fibers in the cross
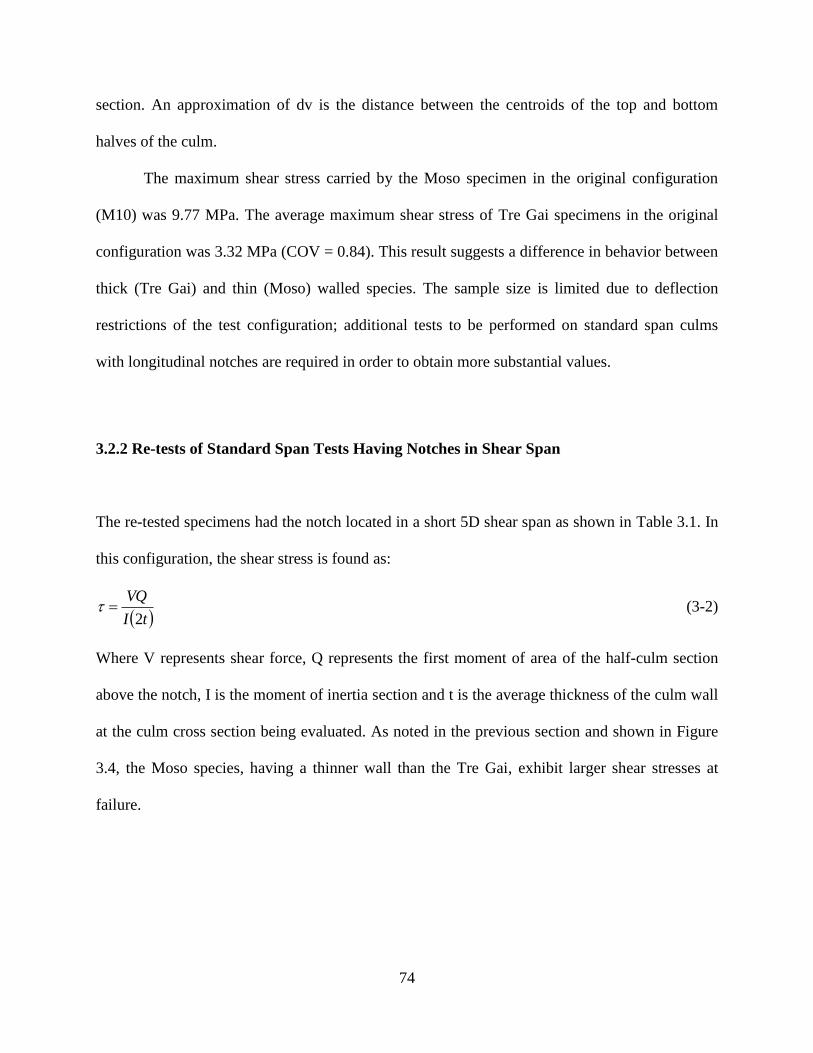
74
section. An approximation of dv is the distance between the centroids of the top and bottom
halves of the culm.
The maximum shear stress carried by the Moso specimen in the original configuration
(M10) was 9.77 MPa. The average maximum shear stress of Tre Gai specimens in the original
configuration was 3.32 MPa (COV = 0.84). This result suggests a difference in behavior between
thick (Tre Gai) and thin (Moso) walled species. The sample size is limited due to deflection
restrictions of the test configuration; additional tests to be performed on standard span culms
with longitudinal notches are required in order to obtain more substantial values.
3.2.2 Re-tests of Standard Span Tests Having Notches in Shear Span
The re-tested specimens had the notch located in a short 5D shear span as shown in Table 3.1. In
this configuration, the shear stress is found as:
tI
VQ
2 (3-2)
Where V represents shear force, Q represents the first moment of area of the half-culm section
above the notch, I is the moment of inertia section and t is the average thickness of the culm wall
at the culm cross section being evaluated. As noted in the previous section and shown in Figure
3.4, the Moso species, having a thinner wall than the Tre Gai, exhibit larger shear stresses at
failure.
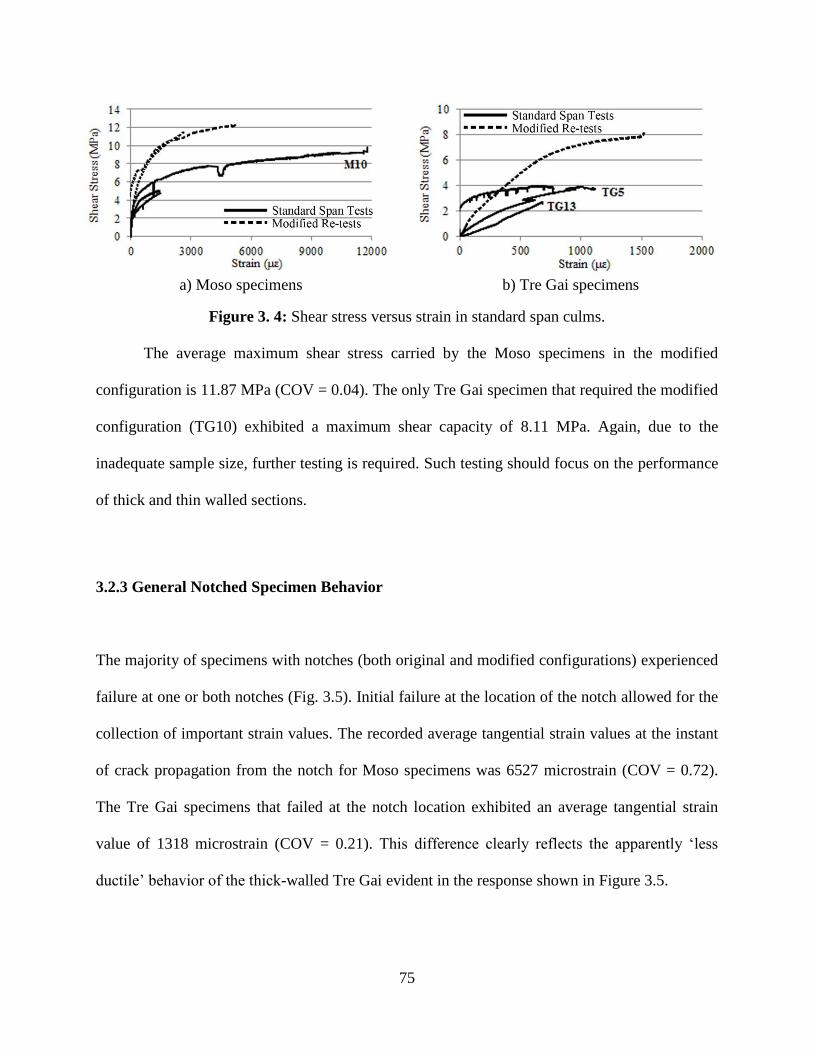
75
a) Moso specimens b) Tre Gai specimens
Figure 3. 4: Shear stress versus strain in standard span culms.
The average maximum shear stress carried by the Moso specimens in the modified
configuration is 11.87 MPa (COV = 0.04). The only Tre Gai specimen that required the modified
configuration (TG10) exhibited a maximum shear capacity of 8.11 MPa. Again, due to the
inadequate sample size, further testing is required. Such testing should focus on the performance
of thick and thin walled sections.
3.2.3 General Notched Specimen Behavior
The majority of specimens with notches (both original and modified configurations) experienced
failure at one or both notches (Fig. 3.5). Initial failure at the location of the notch allowed for the
collection of important strain values. The recorded average tangential strain values at the instant
of crack propagation from the notch for Moso specimens was 6527 microstrain (COV = 0.72).
The Tre Gai specimens that failed at the notch location exhibited an average tangential strain
value of 1318 microstrain (COV = 0.21). This difference clearly reflects the apparently ‘less
ductile’ behavior of the thick-walled Tre Gai evident in the response shown in Figure 3.5.
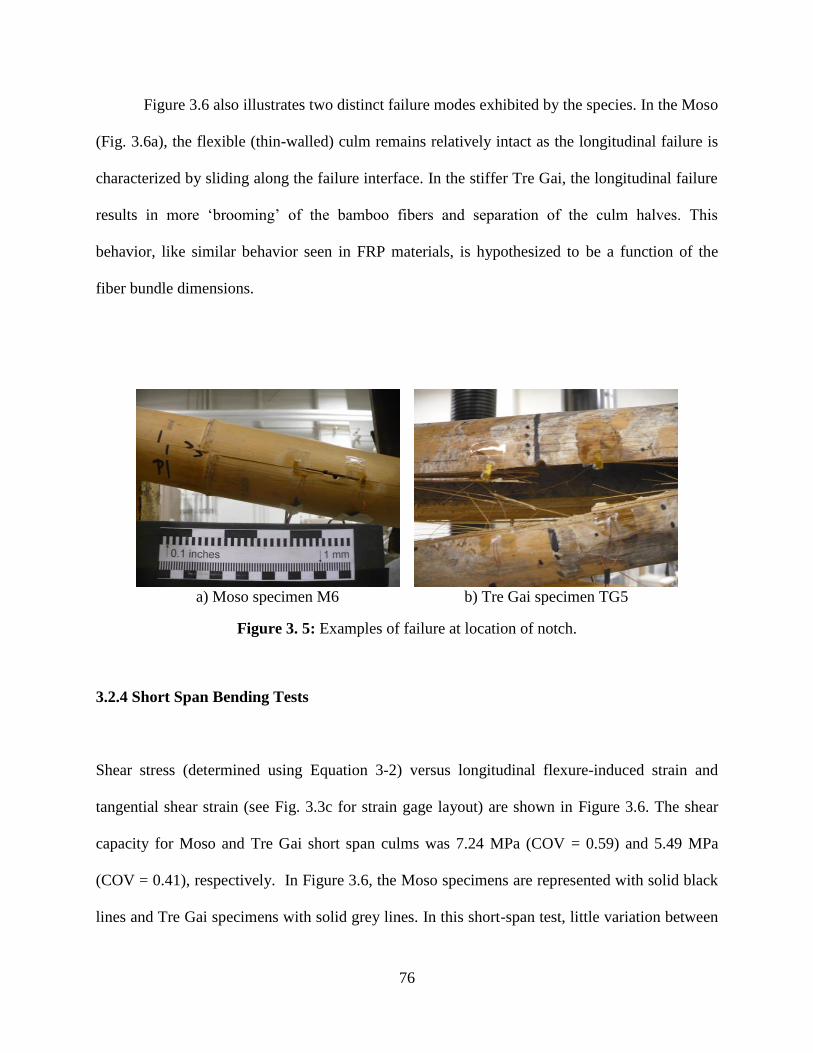
76
Figure 3.6 also illustrates two distinct failure modes exhibited by the species. In the Moso
(Fig. 3.6a), the flexible (thin-walled) culm remains relatively intact as the longitudinal failure is
characterized by sliding along the failure interface. In the stiffer Tre Gai, the longitudinal failure
results in more ‘brooming’ of the bamboo fibers and separation of the culm halves. This
behavior, like similar behavior seen in FRP materials, is hypothesized to be a function of the
fiber bundle dimensions.
a) Moso specimen M6 b) Tre Gai specimen TG5
Figure 3. 5: Examples of failure at location of notch.
3.2.4 Short Span Bending Tests
Shear stress (determined using Equation 3-2) versus longitudinal flexure-induced strain and
tangential shear strain (see Fig. 3.3c for strain gage layout) are shown in Figure 3.6. The shear
capacity for Moso and Tre Gai short span culms was 7.24 MPa (COV = 0.59) and 5.49 MPa
(COV = 0.41), respectively. In Figure 3.6, the Moso specimens are represented with solid black
lines and Tre Gai specimens with solid grey lines. In this short-span test, little variation between
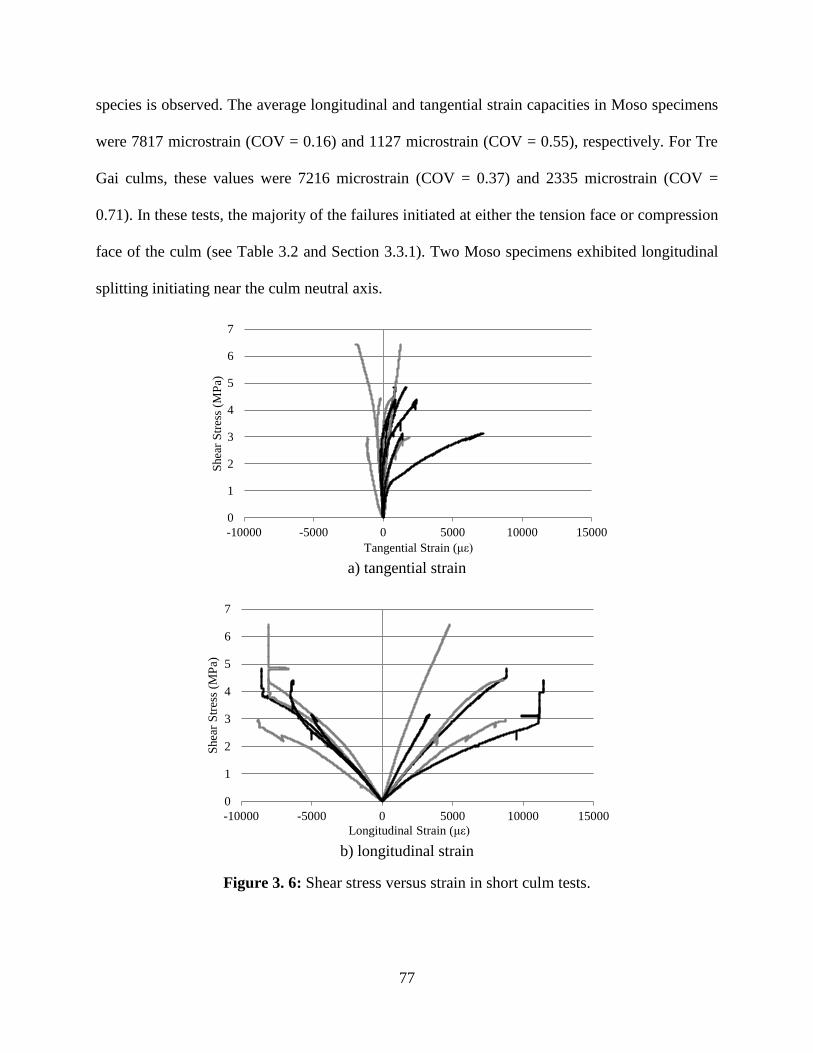
77
species is observed. The average longitudinal and tangential strain capacities in Moso specimens
were 7817 microstrain (COV = 0.16) and 1127 microstrain (COV = 0.55), respectively. For Tre
Gai culms, these values were 7216 microstrain (COV = 0.37) and 2335 microstrain (COV =
0.71). In these tests, the majority of the failures initiated at either the tension face or compression
face of the culm (see Table 3.2 and Section 3.3.1). Two Moso specimens exhibited longitudinal
splitting initiating near the culm neutral axis.
a) tangential strain
b) longitudinal strain
Figure 3. 6: Shear stress versus strain in short culm tests.
0
1
2
3
4
5
6
7
-10000 -5000 0 5000 10000 15000
Shea
r S
tres
s (M
Pa)
Tangential Strain (με)
0
1
2
3
4
5
6
7
-10000 -5000 0 5000 10000 15000
Shea
r S
tres
s (M
Pa)
Longitudinal Strain (με)
78
3.3 DISCUSSION OF CULM BENDING TESTS
One objective of the series of culm bending tests was the investigation of the relationship
between Mode I tension and Mode II shear failures. A summary of the observed shear stress
values at failure is given in Table 3.3, allowing for direct comparisons to be made between
modes of failure. The deterioration of the Mode II capacity in bending due to the existence of the
Mode I component is illustrated in the values normalized to the bowtie tests which capture only
Mode II behavior. The reduced shear span introduces a greater Mode I component to the loading.
This is reflected in the Moso results in which the normalized standard bending span capacity is
69% of the Mode II capacity and the shorter span capacity falls to 51%. The Tre Gai tests appear
to reflect the opposite trend although, as described below, these culms are believed to have their
flexural capacities affected by damage in the nodal regions. The Mode I component clearly
affects the bamboo culms under flexure; the pure Mode I (split pin) values are considerably
lower (by a factor of about 5) than the Mode II as described in Richard (2013).
Based on these very preliminary findings and considering the simplicity and repeatability
of the bowtie test, this test may be best suited for establishing design values for bamboo culms.
Longitudinal splitting capacity may be based on a factoring of the Mode II shear obtained from a
bowtie tests. To account for the degree of mode mixity, such a factor is affected by the shear
span of the culm in bending. Significant additional work is required to establish such a factor
which will also, perhaps, be affected by culm geometry (thin or thick-walled) and species.
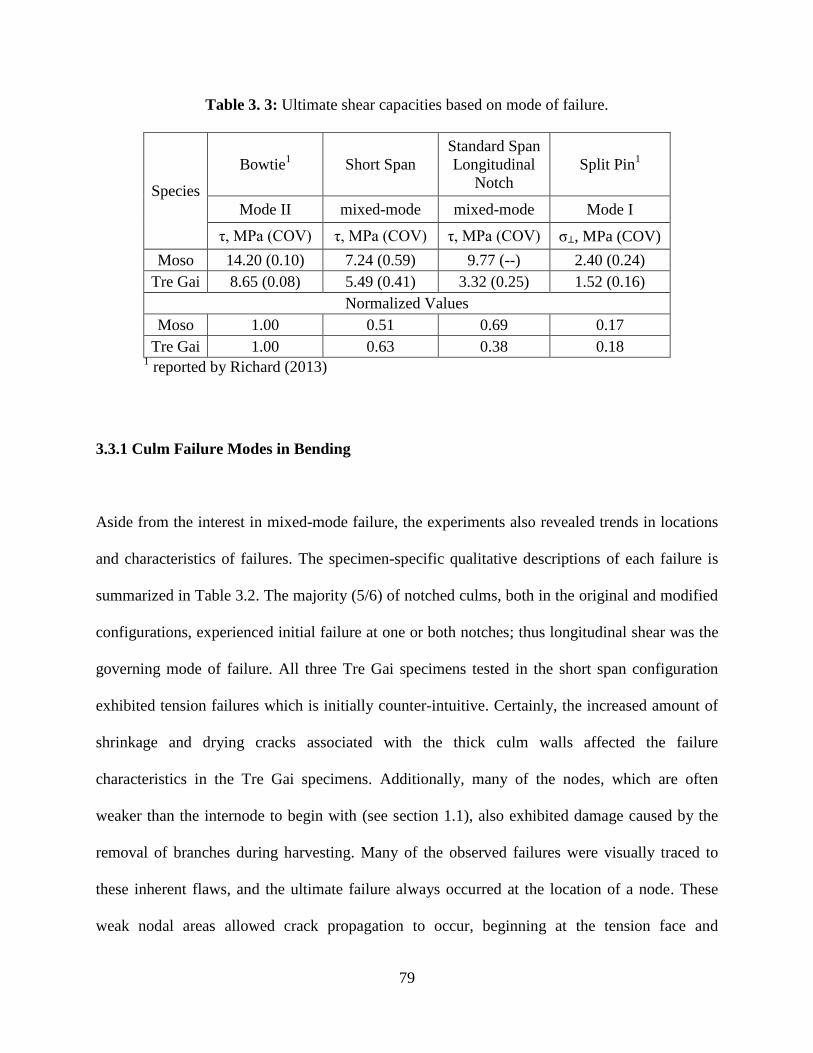
79
Table 3. 3: Ultimate shear capacities based on mode of failure.
Species
Bowtie1 Short Span
Standard Span
Longitudinal
Notch
Split Pin1
Mode II mixed-mode mixed-mode Mode I
τ, MPa (COV) τ, MPa (COV) τ, MPa (COV) σ⊥, MPa (COV)
Moso 14.20 (0.10) 7.24 (0.59) 9.77 (--) 2.40 (0.24)
Tre Gai 8.65 (0.08) 5.49 (0.41) 3.32 (0.25) 1.52 (0.16)
Normalized Values
Moso 1.00 0.51 0.69 0.17
Tre Gai 1.00 0.63 0.38 0.18 1 reported by Richard (2013)
3.3.1 Culm Failure Modes in Bending
Aside from the interest in mixed-mode failure, the experiments also revealed trends in locations
and characteristics of failures. The specimen-specific qualitative descriptions of each failure is
summarized in Table 3.2. The majority (5/6) of notched culms, both in the original and modified
configurations, experienced initial failure at one or both notches; thus longitudinal shear was the
governing mode of failure. All three Tre Gai specimens tested in the short span configuration
exhibited tension failures which is initially counter-intuitive. Certainly, the increased amount of
shrinkage and drying cracks associated with the thick culm walls affected the failure
characteristics in the Tre Gai specimens. Additionally, many of the nodes, which are often
weaker than the internode to begin with (see section 1.1), also exhibited damage caused by the
removal of branches during harvesting. Many of the observed failures were visually traced to
these inherent flaws, and the ultimate failure always occurred at the location of a node. These
weak nodal areas allowed crack propagation to occur, beginning at the tension face and

80
continuing towards the neutral axis until failure (Fig 3.7). Finally, the stiff nature of the thick-
walled species being subject to relatively large deflections over short spans is expected to affect
this behavior.
a) culm TG-9B b) culm TG-9T c) culm TG-5
Figure 3. 7: Observed tension failure modes of Tre Gai culms.
The thin-walled Moso specimen that experienced compression failure buckled at midspan
(Fig. 3.8a) while the thick-walled Tre Gai compression failure experienced crushing (analogous
to a ‘crippling’ failure) at the loading saddle (Fig. 3.8b). These behaviors are clearly a function
of the culm wall thickness, relative to the diameter (i.e.: section slenderness). This is a geometric
parameter not previously addressed in the literature.

81
a) Moso culm M3-T b) Tre Gai culm TG-13 (initial
test)
Figure 3. 8: Observed compression failure modes.
Mixed-mode shear failures occurred more often in the thin-walled Moso specimens. As
seen in Figure 3.9, such failures are characterized by a noticeable ‘slip’ between the tension and
compression regions of the culm subject to bending. The failure occurred at the neutral axis,
initiating near midspan and often extended the entire length of the culm (Fig. 3.9a).
a) culm M5-T b) culm M5-B c) culm M6 (retest)
Figure 3. 9: Observed shear failures of Moso culms.
In some tests, failure initiated at only one side of the culm. This resulted in the culm
rotating in the test frame affecting the ultimate observed failure. Typically, in this case, the
eventual longitudinal failures were not opposite each other on the culm. This behavior should be
expected and may be attributed to material variation. Nonetheless, it does highlight the need to
capture the initial failure rather than a residual capacity when reporting culm capacities.
82
3.4 CONCLUSION OF CULM BENDING TESTS
Although further research is required in order to develop standardized criteria in relation to the
mixed-mode shear failure in bamboo culms, the current experiments allowed for the
development of trends in terms of capacity and characteristics of failures.
Notched standard span (S ≥ 30D) and unnotched short span (S ≥ 15D) full-culm bamboo
specimens have provided the opportunity for a quantitative analysis regarding the characteristics
of mixed-mode shear failure in bamboo culms under four point bending. The data shows a
reduction in the pure Mode II capacity of culms due to the presence of Mode I component.
An overall average longitudinal strain value at crack propagation is given as 7516
microstrain based on all useful data obtained from the unnotched short span tests. The value for
overall average tangential strain is 3219 microstrain. The tangential strain value is obtained from
both unnotched short span and notched standard span culms. The tangential strain capacity
increases slightly (3952 microstrain) when considering only the specimens that failed at their
neutral axis location where the tangential strain gages were placed. This value may be more
indicative of true tangential strain capacity since it captures ultimate values only, removing lower
bound values from the average. Similarly, the ultimate shear stress values obtained from the
standard span tests (overall average of 5.47 MPa, COV = 0.69) were quite similar to the same
values obtained in the short span tests (overall average of 6.47 MPa, COV = 0.53). This suggests
that there may be the opportunity to develop design standards based on shear capacities of culms.
83
It has previously been suggested that tangential strain capacity is relatively universal
among all bamboo species (Arce-Villalobos 1993) and equal to approximately 1200 microstrain.
The reasoning for this is that the lignin matrix is relatively unchanged from species to species.
The average tangential strain capacity for the current tests, however, is 3219 microstrain.
Specifically, the original and modified standard span tests with longitudinal notches yielded an
average tangential strain of 4255 microstrain (COV = 1.19); the values for the standard span tests
were considerably higher, especially for the Moso culms. The short span shear tests without
longitudinal notches, on the other hand, exhibited tangential strain capacities averaging 1731
microstrain (COV = 0.70).
Arce-Villalobos’ tests were conducted using small clear specimens placed in tension
(parallel to the fibers) having a well-defined (and small) shear plane; so-called S-shaped shear
specimens. Comparing in situ shear capacity and that derived from small clear specimens is
clearly inappropriate. Although, design values obtained from small clear specimens appear to be
very conservative, values obtained from full culm bending tests are clearly affected by the degree
of mode mixity present. Further study is necessary which must focus on the degree of mixed
mode behavior.
Although the inevitable issues of inherent flaws and geometric variability still exist, the
experiments have provided a basis of knowledge on a quantitative relationship between Mode II
capacity and mixed-mode capacity in bamboo culms under four point bending. Because
longitudinal splitting is often considered the dominant mode of failure in bamboo, the ability to
develop design values is critical to the structural standardization of the material.
84
4.0 CONCLUSIONS
The opportunity for bamboo to be utilized as an alternative building material has inspired
research towards the standardization of its mechanical properties. The current tests attempted to
achieve experimental knowledge on the effect of four point bending on bamboo specimens. The
research focuses on: a) creep due to a sustained load; b) longitudinal shear failure under four
point bending.
4.1 CREEP TEST CONCLUSIONS
The dearth of information on the creep characteristics of bamboo inspired the development of an
experiment focusing primarily on the effect of sustained load on bamboo. A secondary focus was
the effect of the orientation of the radial fiber density within the specimens. Small clear flexural
specimens were cut radially from the same Tre Gai culm. These were tested in orientations such
that either the outer culm wall was in tension (OT) or compression (OC). Control specimens
were tested to establish baseline data. Sixteen specimens were subject to sustained loads at
different levels for 90 days. Following this creep conditioning, the specimens were left unloaded

85
for ten days and finally tested to failure so that a comparison may be made with the control
specimens.
Contrary to the conclusions of Janssen (1981), who indicated that creep effects in
bamboo are negligible, significant creep-induced plastic deformations and strains were observed
in the present work. The orientation of the specimen – whether the fiber-rich outer culm wall is
placed in compression or tension (OC or OT, respectively) was found to have a significant effect
on both the creep behavior and residual strength of creep-conditioned specimens. The results
showed that the bamboo loaded with the outer culm-wall in tension (OT) generally exhibited the
following when compared to specimens with outer culm-wall in compression (OC).
a) a larger modulus of rupture due to the reinforcing effects of the fibers in tension;
b) a lower apparent modulus of elasticity due to the softer lignin exhibiting high
compressive strains; and,
c) a lower residual strength following creep conditioning.
These observations are all explained by the difference in behavior between the fiber-rich
outer culm wall and the lignin-rich inner culm wall. Specifically, damage to a fiber-reinforced
matrix (OT) in tension exhibits components of fiber pull-out and fiber rupture. These
components of damage are not recoverable. The lignin matrix, on the other hand, is soft and
behaves in an essentially elastic manner; exhibiting mostly recoverable strains.
As summarized in Figure 2.19, the creep trends based on specimen orientation throughout
the loading period are comparable. Although the rates of creep values are similar, the average
quantitative relative creep effects are higher in specimens with outer fibers in compression (OC).
Conversely, the creep displacement and creep strains are higher in specimens with outer fibers in
tension (OT).

86
Additionally the effects of creep conditioning appears to have a strengthening effect on
the residual capacity of OC specimens and a detrimental effects on OT specimens. It is believed
that the significant decrease in capacity of OT specimens is related to the damage of the fibers
due to creep. Since the orientation of the OC specimens results in a stiffening of the lignin, the
creep effects increase the capacity of the bamboo (see section 2.2.6).
The results of the creep experiments showed that the relative creep along with the 90-day
strength, creep rate and fractional deflection of bamboo meet or exceed the ASTM 6815
acceptance criteria for wood. This result suggests that for the structural design of bamboo, a load
duration factor similar to that of wood may be employed. The load duration factor may be
interpreted as being inversely proportional to the creep factor. The 90-day creep factor obtained
for Tre Gai bamboo in this study was 1.29 (COV = 0.15). A comparable value for wood falls
between 1.75 and 2.00. Clearly additional study is required to extend the creep data to additional
species and to an appropriate design life. Nonetheless, based on this initial study, it would appear
that bamboo is less susceptible to creep than timber and therefore may warrant design using
lower load duration factors. This finding is important in so far as most studies indicate that
material resistance factors (so-called φ-factors), when determined for bamboo, will be relatively
low. A lower creep factor for permanent loads may help to mitigate the impact of a low material
resistance factor. A final issue that requires resolution is the choice of design life for bamboo;
this may be a function of the application, environment and whether the structure is intended to be
permanent or temporary.
The structural similarities between wood and bamboo provide a convenient relationship
suggesting that many of the test standards suitable for wood may be applied to bamboo with
minor revisions. Based on the performance of the clear bamboo specimens tested under creep
87
loads, modification to ASTM D6815 Standard Specification for Evaluation of Duration of Load
and Creep Effects of Wood and Wood-Based Products, relevant to bamboo are proposed (Table
4.1).
4.1.1 Bamboo Creep: Future Work
This study of the creep behavior of small clear bamboo specimens has demonstrated an approach
for developing creep data for bamboo. Future tests must include a variety of bamboo species
since the fiber distribution through the culm wall (for instance) is known to vary from species to
species (Grosser and Liese 1971). Additionally, extended-duration tests are required. This is
particularly the case for larger sustained loads since some of the present specimens exhibited
evidence of entering the tertiary stage of creep behavior indicating that creep failure may have
been imminent. The implementation of such a long term project may also facilitate the
development of more precise creep coefficients and a better defined series of load duration
factors.
Additional experiments which increase the ratio of the ultimate load applied in order to
generate creep rupture within the 90-day duration of a standard test may greatly benefit the
growing knowledge of creep characteristics in bamboo; particularly the nature of the eventual
failure. Finally, progression to larger scale and full-culm specimens is necessary. To observe
how a full-culm specimen reacts to a sustained load may help create a relationship between the
small-scale and full-scale tests, developing more practical design factors and standardization.
Large scale test will provide insight into the interaction of culm-wall fiber densities. In a full-
culm test, the fiber-rich outer culm wall is at both the extreme compression and tension faces of

88
the element. The full-culm creep test must be understood well enough that a relationship to the
easier-to-conduct clear specimen tests may be established.

89
Table 4. 1: Suggested amendments to ASTM D6815.
Current ASTM Standard Proposed Revisions to Application in Bamboo
Creep Tests Title Content Summary
5.1.1
Test Population
Requirements
Test population should be representative of
the product; short term bending control tests
(with identical dimensions to long term
specimens) must be conducted; additional
tests must be sampled from the initial test
population
Current standards must be met; additionally, the
specimens must be cut in the radial direction and
consist of 50% OT specimens and 50% OC
specimens; the variation in wall thickness must be
maintained, and the resulting variation in
dimensions must be properly compensated.
Calculating modulus of rupture, rather than
considering specimen capacity is an appropriate
method of normalizing specimen geometry.
5.1.2 Specimen
Support
Conditions
Each test specimen shall be simply supported
and loaded by two equal concentrated forces;
the span of the specimens shall be split into
equal third spans; application of load is in the
orientation the product’s intended use
Support and loading conditions from current
ASTM standard shall remain; however, loads
shall be applied in both orientations as stated in
5.1.1 revisions
5.1.3 Moisture
Content
Moisture content shall be measured on the
short-term specimens immediately after
testing and long-term specimens at the
completion of the intended load duration (in
accordance with ASTM D4442); average
moisture content of long term specimens must
be within 2% of the average moisture content
of short-term specimens
Moisture content shall be measured on the short-
term specimens immediately after testing; the
long-term test programme should provide a
traveller specimen to be stored in the same
environment as the creep specimens; moisture
content readings shall be taken from this
specimen at the start of the experiment, every 30
days and at the conclusion of the experiment. It is
recommended that the traveller specimen will also
be equipped with strain gages to record the effects
of daily changes in moisture content
5.3 Creep Tests
Initial loading rate of creep specimens should
not exceed average time to failure of short-
span specimens; duration of load should occur
for a minimum of 90 days or until creep-
rupture; deflection and strain readings should
be taken frequently; long term load values are
based on a predetermined applied bending
stress obtained from short-term tests.
All creep test criteria established by ASTM
D6815 should be met; additionally, long-term
load values should be determined specific to
orientation
5.4 Acceptance
Criteria
Test specimens must display a satisfactory
performance in the areas of adequate strength
(number of failures at 90 days in less than the
critical order statistic), decreasing creep rate
(change in creep deflection shall progressively
decrease from 0-30 days, 30-60 days and 60-
90 days) and fractional deflection (the ratio of
the deflection after 90 days to the initial
deflection should not exceed 2.0)
The concepts of adequate strength, decreasing
creep rate and fractional deflection will be applied
to long-term bamboo tests; further testing is
required in order to develop empirical values for
acceptance criteria specific to clear bamboo
specimens

90
4.2 CULM BENDING TEST CONCLUSIONS AND FUTURE WORK
Twelve full-culm bending tests were conducted; each type of test utilized two species
(Phyllostachys pubescens (Moso) and Bambusa stenostachya (Tre Gai)) with three culms each.
Notched standard span (S ≥ 30D) and unnotched short span (S ≥ 15D) full-culm bamboo
specimens provided the opportunity for a quantitative analysis regarding the characteristics of
mixed-mode shear failure in bamboo culms under four point bending. The data shows a
reduction in the pure Mode II capacity of culms due to the presence of Mode I component.
The deterioration of the Mode II capacity in bending due to the existence of the Mode I
component is illustrated in the values normalized to the bowtie tests which capture only Mode II
behavior (Table 3.3). The reduced shear span introduces a greater Mode I component to the
loading. This is reflected in the Moso results in which the normalized standard bending span
capacity is 69% of the Mode II capacity and the shorter span capacity falls to 51%. The Tre Gai
tests appear to reflect the opposite trend although these culms are believed to have their flexural
capacities affected by damage in the nodal regions. The Mode I component clearly affects the
bamboo culms under flexure; the pure Mode I (split pin) values are considerably lower (by a
factor of about 5) than the Mode II. As described in Richard (2013).
Based on these very preliminary findings and considering the simplicity and repeatability
of the bowtie test, design values, this test may be best suited for establishing design values for
bamboo culms. Longitudinal splitting capacity may be based on a factoring of the Mode II shear
obtained from a bowtie tests. To account for the degree of mode mixity, such a factor is affected
by the shear span of the culm in bending. Significantly, observed behavior and data are also

91
clearly affected the culm wall thickness relative to the diameter (i.e.: section slenderness). This is
a geometric parameter not previously addressed in the literature.
Although the inevitable issues of inherent flaws and geometric variability still exist, the
experiments have provided a basis of knowledge on a quantitative relationship between Mode II
capacity and mixed-mode capacity in bamboo culms under four point bending. Because
longitudinal splitting is often considered the dominant mode of failure in bamboo, the ability to
develop design values is critical to the eventual structural standardization of the material.
Due to the inherent nature of full-culm bamboo, the ability to standardize bamboo as an
alternative building material requires extensive investigation and collaboration among
researchers. The many advantages associated with the standardization of bamboo create an
indisputable incentive. Bamboo is a naturally existing, functionally graded composite-like
material with significant mechanical properties which is rapidly renewable and requires little
energy or waste to process. With the development of engineering acceptance, bamboo has the
potential to provide a proficient and sustainable alternative building material.
92
CITED REFERENCES
ACI. (2006). ACI 440.1: Guide for the Design and Construction of Structural Concrete
Reinforced with FRP Bars, Detroit, MI: American Concrete Institute.
Ahmad, M. and Kamke, F.A. (2005). “Analysis of Calcutta bamboo for structural composite
materials: physical and mechanical properties.” Wood Science and Technology, 39(6),
448-459.
Arce-Villalobos, O.A. (1993). “Fundamentals of the design of bamboo structures.” Master’s
Thesis, Eindhoven University of Technology, Netherlands.
Allen, E. and Iano, J. (2009). Fundamentals of building construction: materials and methods,
John Wiley and Sons, Inc., Hoboken, NJ.
Andersson, S., Serimaa, R., Paakkari, T., Saranpaa, P., and Pesonen, E. (2003). “Crystallinity of
wood and the size of cellulose crystallites in Norway spruce (Picea abies).” Journal of
Wood Science, 49(6), 531-537.
ASTM International, (2009). ASTM D6815-09: Standard Specification for Evaluation of
Duration of Load and Creep Effect of Wood and Wood-Based Products, West
Conshohocken, PA: ASTM International.
ASTM International, (2009). ASTM E2714-09: Standard Test Method for Creep-Fatigue
Testing, West Conshohocken, PA: ASTM International.
93
ANSI, AF&PA NDS (2005). National Design Specification (NDS) for Wood Construction with
Commentary and Supplement: Design Values for Wood Construction, Washington, DC:
American Forest and Paper Association (AF&PA), American Wood Council (AWC).
Gaylord, E., Gaylord, C., and Stallmeyer, J. (1997). Structural engineering handbook, McGraw-
Hill, New York, NY.
Grosser, D. and Liese, W. (1971). “On the anatomy of Asian bamboos, with special reference to
their vascular bundles.” Wood Science and Technology, 5(4), 290-312.
Harries, K.A., Sharma, B., and Richard, M.J. (2012). “Structural use of full culm bamboo: the
path to standardization.” International Journal of Architecture, Engineering and
Construction, 1(2), 66-75.
Hashin, Z. (1983). “Analysis of composite materials – a survey.” Journal of Applied Mechanics,
50(3), 481-505.
ISO (International Organization for Standardization), (2004a). International Standard ISO
22156:2004 (E), Bamboo – Structural Design. Geneva, Switzerland: ISO.
ISO (International Organization for Standardization), (2004b). International Standard ISO
22157-1:2004 (E), Bamboo – Determination of Physical and Mechanical Properties –
Part I: Requirements. Geneva, Switzerland: ISO.
ISO (International Organization for Standardization), (2004c). International Standard ISO
22157-2:2004 (E), Bamboo – Determination of Physical and Mechanical Properties –
Part II: Laboratory Manual. Geneva, Switzerland: ISO.

94
Janssen, J. (1981). “Bamboo in building dtructures”. Doctoral Thesis, Eindhoven University of
Technology, Netherlands.
Kanzawa, E., Aoyagi, S., and Nakano, T. (2011). “Vascular bundle shape in cross-section and
relaxation properties of Moso bamboo (Phyllostachys pubescens).” Materials Science
and Engineering: C, 31(5), 1050-1054.
Lilholt, H. (1985). “Creep of fibrous composite materials.” Composites science and Technology,
22(4), 277-294.
Limaye, V.D. (1952). “Strength of bamboo (Dendrocalamus strictus).” Indian Forester, 78(11),
558-575.
Liu, X., Elmahdy, A.E., Wildman, R.D., Ashcroft, I.A., Ruiz, P.D. (2011). “Experimental
investigation and material modelling of fresh and UV aged Japanese lacquer (Urushi).”
Progress in Organic Coatings, 70(4), 160-169.
Low, I.M., Che, Z.Y., and Latella, B.A. (2006), “Mapping the structure, composition and
mechanical properties of bamboo.” Journal of Materials Research, 21(8), 1969-1976.
Mileiko, S.T. (1971). “Creep and long-term strength of a fibrous composite.” Strength of
Materials, 3(7), 775-763.
Mitch, D. (2009). “Splitting Capacity Characterization of Bamboo Culms.” University of
Pittsburgh Honors College Thesis, University of Pittsburgh, Pittsburgh, PA.
Mitch, D. (2010). “Structural behavior of grouted-bar bamboo column bases.” Master’s Thesis,
University of Pittsburgh, Pittsburgh, PA.

95
Obataya, E., Kitin, P., and Yamauchi, H. (2007). “Bending characteristics of bamboo
(Phyllostachys pubescens) with respect to its fiber-foam composite structure.” Wood
Science and Technology, 41(5), 385-400.
Richard, M.J. (2013). “Assessing the performance of bamboo structural components.” Doctoral
Dissertation, University of Pittsburgh, Pittsburgh, PA.
Riley, W., Sturges, L., and Morris, D. (2002). “Stress-strain-temperature relationships.” Statics
and mechanics of materials: an integrated approach, John Wiley and Sons, Inc., New
York, NY, 114-123.
Sekhar, A.C. and Rawat, B.S. (1956). “Strength tests on bamboos.” Indian Forest Leaflet, 147
(Timber Mechanics), Government of India, New Delhi, India.
Sharma, B. (2010). “Seismic performance of bamboo structures.” Doctoral Dissertation,
University of Pittsburgh, Pittsburgh, PA.
Smith, I., Landis, E., and Gong, M. (2003). Fracture and Fatigue in Wood. John Wiley and Sons
Ltd., West Sussex, UK.
Vaessen, M.J. and Janssen, J.J.A. (1997). “Analysis of the critical length of culms of bamboo in
four-point bending tests.” Heron, 42(2), 113-124.