
External Memory. Types of External Memory Magnetic Disk Optical Magnetic Tape.

httpsbiointerfaceresearchcom 1335
Article
Volume 12 Issue 1 2022 1335 - 1351
httpsdoiorg1033263BRIAC12113351351
Structural Magnetic Optical Properties and
Photocatalytic Activity of Nanocrystalline Cobalt Ferrite
Prepared by Three Different Methods
Samah Samy Selima 1 Wafaa Abdallah Bayoumy 1 Mohamed Khairy 12 Mahmoud Ahmed Mousa 1
1 Chemistry Department Faculty of Science Benha University Benha Egypt 2 Chemistry Department College of Science Imam Mohammad Ibn Saud Islamic University Riyadh KSA
Correspondence samah_selimayahoocom
Scopus Author ID 57205210744
Received 10032021 Revised 12042021 Accepted 15042021 Published 27042021
Abstract Cobalt ferrite (CoFe2O4) is an interesting material due to its rich physical properties In order
to study the influence of synthetic methods on the crystalline and morphological structure optical and
magnetic properties of the CoFe2O4 we synthesized here the CoFe2O4 by three different methods
including the chemical co-precipitation method sol-gel method and ceramic method The resulting
powders were characterized by different analyses XRD SEM TEM BET FTIR UV-Vis PL XPS
and surface acidity The characterization results showed a significant variation in the structural particle
size surface area and optical properties of pure cobalt ferrite with changing the synthetic method Both
XRD and FTIR analyses confirm the formation of the cubic spinel phase where the crystallite size
changes from 21 to 36 nm XPS analyses demonstrated the effect of the synthetic method on the cation
distribution at the tetrahedral and octahedral sites in the spinel ferrite lattice The magnetic properties
of the prepared samples were studied at room temperature using the vibrating sample magnetometer
(VSM) and found to be strongly dependent on the synthetic method and showed either ferromagnetic
or super-paramagnetic character The cobalt ferrite samples showed high photocatalytic activity against
Basic Red 18 (BR 18) dye under visible light irradiation The effects of particle size surface areas and
morphology on the photocatalytic activity were discussed and the positive holes are suggested to be the
major active species of the dye dissociation
Keywords CoFe2O4 magnetic properties optical properties photocatalytic activity water treatment
copy 2021 by the authors This article is an open-access article distributed under the terms and conditions of the Creative
Commons Attribution (CC BY) license (httpscreativecommonsorglicensesby40)
1 Introduction
Recently magnetic nanoparticles have drawn an excessive research arrangement due
to their characteristic properties and their scientific technological uses Ferrite spinels consider
as the most important class of these materials The spinel structure exhibits a general formula
(A)[B2]O4 crystallizes in a face-centered cubic structure with two lattice types for cation
distributions of A and B sites in the tetrahedral and octahedral organization respectively The
physical properties of ferrite spinel are linked to the cation distribution over the tetrahedral sites
A (8a) and octahedral sites B (16d) of the structure The spinel structure is more complex in
practice because molecules do not always correspond fully to a normal or inverse structure
Hence an inversion parameter d defined by 0 lt d lt 1 is introduced [1] Cobalt ferrite is one
of the most appropriate spinel ferrites with distinctive properties such as strong spin-orbit
coupling high coercivity high Curie temperature high magnetocrystalline anisotropy
httpsdoiorg1033263BRIAC12113351351
httpsbiointerfaceresearchcom 1336
distinguished mechanical and chemical stability [2-7] Generally cobalt ferrite exhibits a
partially inverse spinel structure in which both sites (A and B) hold a fraction of Co2+ and Fe3+
cations It shows the formula of (Co2+1- Fe3+
)A[Co2+ Fe3+
2-]BO4 where is a fraction of
tetrahedral sites occupied by Fe3+ ions which is known as the degree of inversion The degree
of inversion is sensitive to numerous parameters such as the microstructure and synthesis
process This work is designed to prepare CoFe2O4 with three different methods (co-
precipitation ceramic and sol-gel) and investigate how the change in each cation distribution
particle size and surface area affect the optical and magnetic properties which ultimately
determine the magnetic and photocatalytic applications
2 Materials and Methods
21 Materials
All chemicals were reagent grade and utilized without further purification Cobalt (ll)
nitrate (Hexahydrate) [Co(NO3)26H2O] was acquired from SD Finchem Limited Mumbai 400
030 Ferric nitrate [Fe(NO3)39H2O] was obtained from LOBA CHEMIE PVTLTD Cobalt (ll)
acetate [(CH3COO)2Co4H2O] was purchased from Fluka Garantie Switzerland Cobalt
sulfate CoSO47H2O was prepared from the reaction of H2SO4 with CoCl2 Bidistilled water
was utilized in all the experiments
22 Synthesis of CoFe2O4 Samples
CoFe2O4 nanoparticles were prepared by three different methods
221 Ceramic method
A mixture of CoSO47H2O Fe(NO3)39H2O NaOH and NaCl in the molar ratio of 1
2 8 10 were pulverized together in an agate mortar for about 60 min followed by calcination
at 700degC for two hours The obtained product was crushed and well washed with bidistilled
water and dried at 95degC for one hour and heated to700degC with a heating rate of 5degC min The
sample was symbolized as CoFes
222 Co-precipitation method
Cobalt and iron nitrate in a molar ratio of 12 were dissolved in bidistilled water Urea
was then added to the heated solution at 90degC with stirring The precipitate obtained was
filtered well washed with bidistilled water and dried at 95degC for 12 hours Finally the powder
acquired was calcined up to 700degC with a heating rate of 5degC min The sample was denoted
as CoFep
223 Sol-gel method
A mixture of 291 g of [Co(NO3)26H2O] 808 g of [Fe(NO3)39H2O] and 10 g of citric
acids were dissolved in bidistilled water with stirring at 85degC to get gel phase The gel gained
was then dried in an oven at 100degC for 12 hours Finally the powder obtained was calcined up
to 700degC with a heating rate of 5degC min The sample was symbolized as CoFeg
httpsdoiorg1033263BRIAC12113351351
httpsbiointerfaceresearchcom 1337
23 Characterization methods
XRD analysis was performed on a Philips X Pert Pro Super diffractometer with Cu Kα
radiation (λ=154 Aring) Electron microscope analysis was done by SEM and TEM electron
microscopy model JEOL JEM-100CXII and JEOL-2010 respectively The FT-IR spectra of
the specimens were obtained by employing a Brucker-FT-IR in the range of 4000-400 cm-1 A
U-1000 laser Raman Spectrometer with 5145 nm line of an ArC laser was used to determine
Raman spectra Optical absorption was measured by employing Cary 5G equipment at
wavelengths ranging from 200 to 1000 nm The photoluminescence (PL) studies were made
using a 225 nm excitation wavelength source Traditional surface area and textural surface
properties were studied using the BET - N2 gas adsorption technique The electron binding
energies for the elements were determined using a PHI-5702 multifunctional spectrometer with
AlKα radiation (XPS) The magnetic properties of the prepared samples were studied using the
vibrating sample magnetometer model (VSM-9600M-1 USA) in a maximum applied field of
10 kOe
A programable ammonia desorption technique (TPD-NH3) was used to determine the
type and the amount of acidity in the studied samples This is performed in a reactor filled with
04 g of the sample which was previously activated at 250 for 3 hours with N2 flow The
sample was then permitted to expose to NH3 at room temperature for one hour The overflow
of NH3 was swill out of the reactor with N2 flow The temperature was then elevated linearly
at a rate of 10 min to liberate NH3 gas from the sample at a temperature interval of 100
up to 500 The liberated NH3 is allowed to flow through a known large amount of H2SO4
solution Finally the amount of acid was determined by back titration with NaOH solution
using MO indicator
24 Photocatalytic study
Basic Red 18 (BR 18) dye was selected as an ideal system for a catalytic reaction
because of its intense color in an aqueous medium and low biodegradability due to the existence
of benzene rings The photocatalytic degradation of Basic Red 18 (BR 18) dye over ferrite
nanoparticles was performed in a photoreactor with a total capacity of 05 L The illumination
source was a UV-C lamp (200-980 nm 9 W Philips) put in the internal quartz tube of the
photoreactor The impact of ferrite dosage on Basic Red 18 (BR 18) dye oxidation was
examined using a dose of 0-005 gl The photocatalytic study was investigated at a pH range
of 2-9 and initial dye concentration in the range of 50-200 ppm The solution pH was regulated
using NaOH or HCl Specimens were removed from the arrangement at specific periods and
centrifuged and the concentration in the supernatant dye solution was then analyzed using UV-
vis Spectrophotometer (a Cary 5G equipment)
3 Results and Discussion
31 Characterizations
XRD patterns of the prepared CoFe2O4 ferrites are shown in Figure 1 All the ferrite
samples showed diffraction peaks at 2θ values 316deg 370deg 441deg 554deg 591deg and 651deg
attributed to the reflection planes of (220) (311) (400) (422) (511) and (440) respectively
of the spinel crystal structure (JCPDS 22-1086) No other peaks are observed for all specimens
indicating the purity of the ferrites There is a slight shift of (311) peak towards lower angle
httpsdoiorg1033263BRIAC12113351351
httpsbiointerfaceresearchcom 1338
side in the order CoFesgt CoFep gt CoFeg The average lattice constant (a) for the (311) plane
was determined using equation (1) [8] and the results obtained are listed in Table 1
a = radicℎ2 + 1198962 + 1198972 2 sinθ (1)
where h k l are miller indices It is noted that the lattice constant follows the order CoFes gt
CoFep gt CoFeg This may be attributed to a certain number of Co2+ ions (078 Aring) transfer from
octahedral sites accompanied by the opposite migration of an equivalent number of Fe3+ ions
(0645 Aring) from tetrahedral to octahedral sites to relax the compressive strain The average
crystallite sizes (DXRD) of the investigated samples were calculated (based on 3 different peaks)
from the widening of reflection peaks using the Scherrer formula [7]
DXRD = 09 λ β cosθ (2)
where λ is the X-ray wavelength and β is the half peak width of the diffraction peak in radiant
The results are listed in Table 1 and found to lie in the range of 21 ndash 33 nm The average X-ray
density (ρx) of the cobalt ferrite nanoparticles was determined using the following equation
ρx = 8MNa3 (3)
Where M is the molecular weight of cobalt ferrite N is Avogadros number The results
are also listed in Table 1
Figure 1 XRD of CoFe2O4 samples (a) CoFes (b) CoFeg and (c) CoFep
Table 1 Lattice constant density particle size values and FT-IR data of the studied CoFe2O4 samples
Sample Lattice
constant(Aring)
X-ray
density
(gcm3)
XRD-
particle
size
(nm)
TEM-
Particle
size
(nm)
Tetrahedral
vibration
(cm-1)
Octahedral
Vibration
(cmminus)
OH-
group
δH-O-H
bonding
CoFeg 8387 5282 21 23 563 402 3428 1640
CoFep 8392 5267 31 28 579 413 3432 1625
CoFes 8412 5235 36 39 581 428 3439 1635
httpsdoiorg1033263BRIAC12113351351
httpsbiointerfaceresearchcom 1339
The formation of the CoFe2O4 spinel structure was also supported by infrared spectra
shown in Figure 2 The spectra of all samples demonstrate two specific bands for spinel
structure ν1 in the range 581ndash563 cmminus1 relates to Mtetr -O vibration at the tetrahedral site and
ν2 in the range 428ndash402 cmminus1 attributed to Mocta -O vibration at the octahedral sites [9-11] The
mean feature bands observed are recorded in Table 1 The variation in the band positions is due
to the difference in the metalndashO distances for the octahedral and tetrahedral complexes
referring to a change in cation distribution in the spinel structure by changing the preparation
method These results strongly support the results of XRD data The broad bands focused at
1640-1625 cmminus1 are appointed to the δ H-O-H bonding mode of the adsorbed water [12]
Figure 2 FT-IR of CoFe2O4 samples (a) CoFep (b) CoFes (c) CoFeg
The SEM and TEM micrographs of the as-synthesized CoFe2O4 particles are given in
Figure 3 (A and B) As seen depending on the preparation method the nanoparticles have been
developed in different orders and clusters
Figure 3 (A) SEM and (B) TEM of (a) CoFes (b) CoFep and (c) CoFeg
(B) (A)
httpsdoiorg1033263BRIAC12113351351
httpsbiointerfaceresearchcom 1340
SEM and TEM images of CoFes show morphology nanoparticles predominated by
nanorods structure The other cobalt ferrite specimens CoFep and CoFeg demonstrates
aggregated spherical particles besides particles with polygon morphologies The variation in
the morphology of the NPS shown in Figure 2b denotes that the crystal growth of CoFe2O4
depends largely on the preparation method The nanoparticle sizes were obtained using
histograms of 100 particles observed in the TEM image are listed in Table 1 The slight contrast
found in the results of XRD and TEM is due to the different handles of the two tools TEM
analysis offers a number-average size distribution XRD manifests a volume-averaged median
size In XRD the correctness of Scherrers formula is influenced by numerous variables for
example diffraction line width and surface tension Thus Scherrers equation might cause
particular errors in determining the fixed value of the crystallite size [7]
XPS results of the CoFe2O4 samples are given in Figure 4 where binding energy (BE)
ranges from 0 to 1200 eV The spectra show that the samples contain only the main elements
Fe Co and O besides the contaminated C element coming from the environment The binding
energy (BE) values obtained attached well with the literature data for CoFe2O4 Table 2 [13]
proving that pure ferrite had been produced
Figure 4 XPS of (a) CoFes (b) CoFep (c) CoFeg
a)
b)
c)
Binding energy
(eV)
httpsdoiorg1033263BRIAC12113351351
httpsbiointerfaceresearchcom 1341
Figure 5 High-resolution XPS of CoFeg sample
Table 2 XPS results of the investigated CoFe2O4 samples
Sample Spectrum BE(eV) Assignment Atomic Particle
Size (nm)
CoFes
Co 2p32
7803 Octahedral Co2+ 48
36
7821 tetrahedral Co2+ 52
785 satellite peak of Co2+ -
Fe 2p32
711 octahedral Fe3+ 76
7135 tetrahedral Fe3+ 24
717 Satellite peak Fe3+ -
O 1s
52985 CoFe2O 73
5315 CoFe2O4 16
534 Artifact 11
CoFep
Co 2p32
780 Octahedral Co2+ 55
31
7819 tetrahedral Co2+ 45
7855 satellite peak of Co2+ -
Fe 2p32
7105 octahedral Fe3+ 725
7132 tetrahedral Fe3+ 275
7167 Satellite peak Fe3+ -
O 1s
5297 CoFe2O4 80
5315 CoFe2O4 12
5345 Artifact 8
CoFeg
Co 2p32
7799 Octahedral Co2+ 63
21
7816 tetrahedral Co2+ 37
7844 Octahedral Co2+ -
Fe 2p32
7109 octahedral Fe3+ 685
7131 tetrahedral Fe3+ 315
7171 Satellite peak Fe3+ -
O 1s
5299 CoFe2O4 78
5315 CoFe2O4 13
5345 Artifact 9
To investigate the cation valence states and their distribution in the CoFe2O4 spinel the
high-resolution XPS spectra of Fe 2p Co 2p and O1s peaks of the CoFe2O4 specimen were
studied and given for CoFeg in Figure 5 The integrated intensities of the fitted peaks of Co2+
and Fe3+ ions were used to determine their distributions in both octahedral and tetrahedral
positions The table also shows an increase in the concentration of Fe3+ cations on octahedral
sites with the increase in the particle size of the sample which agrees well with XRD data In
conclusion it can be said that the selection of the preparation route is effective in controlling
the cation distribution within the spinel lattice The presence of high intense satellite structure
on the high binding energy side of the Co 2p32 and Fe 2p32 might be attributed to the band
structure related to octahedral Co 2p in the oxide lattice
32 Magnetic study
To investigate the effect of the synthetic method on the magnetic properties the VSM
test was done at room temperature in an applied field of 10 kOe The results are represented in
httpsdoiorg1033263BRIAC12113351351
httpsbiointerfaceresearchcom 1342
Figure 6 which shows hysteresis loops referring to the ferromagnetic nature of all samples
The M(H) curves also show a linear part at higher magnetic fields signifying a meaningful
paramagnetic contribution to the magnetization The saturation magnetizations (Ms) are
evaluated by extrapolating the plots of M vs 1H employing data at high magnetic fields [14]
The magnetic parameters are extracted from M-H plots Figure 6 and listed in Table 3 The
coercivity (Hc) remanent magnetization (Mr) are extracted from M-H plots (Figure 6) and listed
with the saturation magnetizations (Ms) and the squareness values of the hysteresis loops for
all specimens in Table 3 The small values of the coercivity (Hc) of CoFe2O4 nanoparticles
denote that the studied samples lie near the super-paramagnetic limit
Figure 6 Magnetic hysteresis of investigated samples (a) CoFeg (b) CoFep (c) CoFes
For the ideal inverse spinel crystal structure of CoFe2O4 with all the Co2+ ions located
at the octahedral site the magnetization per formula unit can be theoretically evaluated using
Neels two sublattice model by considering the difference of total magnetic moments in
octahedral and tetrahedral sites [15-18] M=Moctahedral ndash Mtetrahedral The magnetic moment of
Fe3+ and Co2+ cations are 50 and 38 microB respectively the theoretical magnetic moment of
CoFe2O4 is 38 microB per formula unit Based on the cation distribution obtained from XPS the
magnetization per formula unit was also calculated and listed in Table 3 which shows that the
magnetic moments change with the preparation methods The magnetic moment values of the
investigated samples can also be determined experimentally by the following equation in Bohr
magneton
microB = MolwttimesMs5585 (4)
However the evaluated data from XPS and VSM are not equal which can be associated
with the finite size of nanoparticles conducting to the noncollinearity of magnetic moments on
the surface of the nanoparticles The disordered moments are developed due to the broken
exchange bonds at the outer layer On the other hand the competition antiferromagnetic
interactions precede a noncollinear arrangement of magnetic moments within interstitial
sublattices induced by the non-equilibrium cation distribution among tetrahedral and
octahedral sites [151718] Shifting of larger Co2+ (078 Aring) to substitute the smaller Fe3+ (0645
Aring) cations in octahedral sites produce strains on the surface due to the smaller space between
the octahedral site cations comparable to the tetrahedral site cations in nanoparticles The
strains obtained can break the surface exchange bonds which cause the canted spin structure
This type of tetrahedral-octahedral interaction points to lower magnetization values in the
ferrite nanoparticles than the bulk CoFe2O4 [17] The low Ms-value of the investigate ferrite
httpsdoiorg1033263BRIAC12113351351
httpsbiointerfaceresearchcom 1343
samples compared with that of the bulk one (809 emug) [3] can also be explained based on
the core-shell model which clarifies that the finite-size effects of the nanoparticles manage to
canting or non-collinearity of spins on their surface in that way reducing magnetization [16]
To sum up it can be said that the change in saturation magnetization with the variation
in the preparation methods is possibly due to the rearrangement of the cation distribution ie
the exchange of Co2+ and Fe3+ ions from octahedral and tetrahedral sites and vice versa The
low values of Ms for the investigated samples could be credited to surface distortion which
destabilizes the collinear spin arrangement and producing various canted spin structures at the
surface This effect is especially noticeable for ultrafine particles owing to their large surface-
to-volume ratio The reduction in coercivity with increasing particle size could be accredited
to the combination of surface anisotropy and thermal energies [19]
The values of the squareness ratio (MrMs) of investigated samples shown in Table 3
are below 05 refers to that these samples are multidomain and the particles interact by
magnetostatic interaction [20]
The magnetic anisotropy (K) has also been calculated using the following relation [21]
Hc = 098 KMs (5)
and the results obtained showed high values of 16711 13571 and 6181 emuOeg-1 for CoFep
CoFeg and CoFes respectively The increase in K value is going parallel with increasing the
presence of Co2+ ions in the octahedral sites as shown in XPS results (Table 2)
The effect of the preparation method on the magnetic parameters of our CoFe2O4
nanoparticles is compared with other methods present in the literature and listed in Table 4
Table 4 Effect of the preparation methods on magnetic parameters of CoFe2O4 nanoparticles
Preparation
method Particle Size (nm) Ms (emug) Mr (emug) Hc(Oe) Reference
Green
Co-precipitation
ceramic
combustion
Co-precipitation
Sol-gel
Co-precipitation
Co-precipitation
Sol-gel
hydrothermal
Microemulsion
21
31
36
33
32
55
42
21
18
120
28
380
431
466
316
356
424
27
104
30
60
158
101
125
369
96
13
89
87
10
10
23
0612
370
360
130
870
614
434
500
30
100
150
1357
Present work
Present work
Present work
[22]
[23]
[24]
[25]
[26]
[27]
[28]
[29]
33 Surface properties
The surface properties of the spinels investigated were studied using the BET technique
The isothermal N2 adsorption-desorption plots of these samples Figure 7 can be classified as
type IV for CoFep and type V for CoFeg and CoFes according to IUPAC which is characteristic
of the mesoporous material in which the adsorption proceeds via multilayer adsorption
followed by capillary condensation The hysteresis loops show the type H3 (aggregates of
platelike particles forming slit-shaped pores) for all samples The studied samples textural
properties including BET-surface area average pore diameter pore-volume and pore size
distribution calculated from BJH method are derived from N2 nitrogen adsorptiondesorption
isotherms and listed in Table 5 The data obtained refer to that the surface properties depend
largely on the method of preparation and CoFeg exhibits the highest surface area
httpsdoiorg1033263BRIAC12113351351
httpsbiointerfaceresearchcom 1344
Figure 7 Nitrogen adsorption-desorption isotherms of investigated samples (a) CoFeg (b) CoFep (c) CoFes
Table 5 Textural surface data obtained from BET measurements for CoFe2O4 samples
Samples Particle size dXRD
(nm) Vst (mlg) Vp (mlg) Vm (mlg)
SBET
(m2gm) r (Aring)
CoFes 36 62 009 6 25 98
CoFep 31 138 021 10 45 89
CoFeg 21 261 040 32 99 73
34 Optical properties
The prepared CoFe2O4 nanoparticles show still high magnetization that photocatalyst
appropriate for magnetically separable by a magnetic field and separation of photocatalyst from
solution Thus the photocatalytic activity of the investigated samples has been studied The
optical absorption property related to the electronic structure characteristic is documented as
the main factor in deciding the photocatalytic activity [30] The diffuse reflectance spectra of
our ferrites were recorded and converted to the Kubelka-Munk function K-M Figure 8 using
the following equation
K-M= (1minusR)2 2R (6)
Where R is absolute reflectance the results obtained are listed in Figure 8A The spectra
show that all synthesized CoFe2O4 samples exhibited photo-absorption in the visible light
httpsdoiorg1033263BRIAC12113351351
httpsbiointerfaceresearchcom 1345
region which implies the probability of high photocatalytic efficiency of these materials under
visible light The absorption behavior in the visible region is originated from the electronic
charge transformation of Co2+ and Fe3+ to their conduction level in the conduction band [7 31
32] The CoFe2O4 stoichiometry is organized in an incompletely inverse structure [27] with
the Co2+ ion at both tetrahedral and octahedral sites as shown in our results (XRD XPS and
magnetic data)
Figure 8 (A) UVndashvis spectra presented as the Kubelka-Munk function for CoFe2O4 nanoparticles (B)
Taucs plots for CoFe2O4 nanoparticles
Broad CondashO and FendashO charge transfers together with dndashd electron moves of Co2+ and
Fe3+ in numerous coordination guarantee the full absorption of the visible spectrum The
bandgap energies of the investigated ferrites were estimated according to Taucs [33] by
plotting (KM hν)1n versus hν where h is a Plancks constant n is the light frequency and n
is a constant relating to a mode of transition ( n = frac12 for allowed direct transition and n= 2 for
indirect transition) Taucs plots shown in Figure 8-b for every one of the specimens
demonstrated that the band-to-band direct transitions are more inclined to happen than the
indirect transitions The optical energy gaps Eg obtained from the intercept of the plot with
the X-axis are recorded in Table 6 from which it can be seen that Eg value decreases with
increasing the particle size and showed the smallest value for CoFeg sample
0
00005
0001
00015
0002
CoFes
CoFep
C0Feg
K-M
Wavelehgth (nm)
(A)
0
001
002
003
004
005
006
007
008
15 175 2 225 25 275 3
CoFes
CoFep
CoFeg
Energy (eV)
(K-M
E
)2
(B)
httpsdoiorg1033263BRIAC12113351351
httpsbiointerfaceresearchcom 1346
Table 6 Optical and surface acidity data of CoFe2O4 samples Table 6 Optical and surface acidity data
of CoFe2O4 samples
Samples Particle
size (nm)
λmax
(nm)
Eg
(eV)
Surface
Acidity sites
Weak
(mmolg)
Surface Acidity
sites medium
(mmolg)
Surface
Acidity sites
Strong
(mmolg)
Surface
Acidity
Total
sites
(mmolg)
Bulk --- 790 20 - - - -
CoFes 36 590 139 75 55 30 160
CoFep 31 610 138 60 41 21 132
CoFeg 21 620 137 110 61 40 211
341 Raman spectroscopy
Raman spectra were used to acquire a vision of the vibrational energy states within the
spinel ferrite and review the structural characteristics and compositional regularity throughout
the samples [34] The spinel ferrite exhibit five active Raman vibration modes [3536] The
Raman spectra of our samples showed only three bands due to peak overlapping at 284-297
cm-1 460-470 cm-1 and 640-650 cm-1 as shown in Figure 9 which was assigned as Eg 3T2g
and A1g (1) respectively [37] The A1g (1) band is related to symmetric stretching vibration
mode at the tetrahedral (A) site While A1g (1) band might be related to the vibration of Co-O
bonds at the tetrahedral (A) site The results obtained in Figure 9 show that the frequency of
Raman modes of the investigated spinels is slightly changed with the preparation method This
could be attributed to the variation in the cation distribution in the spinel lattice as mentioned
above
Figure 9 Raman spectra of investigated samples (a) CoFeg (b) CoFep (c) CoFes
342 Photoluminescence study
Photoluminescence (PL) spectroscopy is an outstanding procedure to get valuable
information concerning energy and the dynamics of charge carriers yielded during the exposure
of light The photoluminescence of the ferrite nanoparticles was studied using a 225 nm
excitation wavelength source and the results obtained are presented in Figure 10 The spectra
of all samples show broad visible emission peaks at 434 - 442 nm which are attributed to the
charge transport between Co2+ at tetrahedral sites and Fe3+ at octahedral sites that are
surrounded by O2- ions [38] The variation in the position and the intensity of luminescence
can be explained on the basis that the PL-spectra are sensitive to the character of nanoparticles
surface due to the existence of gap surface disorders developing from surface non-
stoichiometry and unsaturated bonds The defects produced in the nanomaterial lattice during
preparation are the base of luminescent properties [39] The emission intensity of CoFeg is
httpsdoiorg1033263BRIAC12113351351
httpsbiointerfaceresearchcom 1347
lower than that of the rest samples This indicates that this sample acted as traps for the photo-
induced charge carriers These outcomes confirm the previously mentioned results on the
influence of the preparation methods on the surface and optical properties
Figure 10 Photolumiscence spectra of investigated samples (a) CoFep (b) CoFes (c) CoFeg
343 Surface acidity
Temperature-programmed desorption of ammonia (TPD-NH3) is an appropriate
procedure for measuring the quantity and the spreading of the acid sites on the surface of our
samples The acid site distribution results for the studied samples are summarized in Table 6
The ammonia desorbed at 100 oC contains some physisorbed ammonia as well as overstating
the proportion of weak acid sites Whereas the ammonia desorbed at 220 ndash 370 oC and that at
450-600 oC are attributed to medium and strong acid sites respectively [40] The results
obtained show that the acidity varies with preparation methods For all samples the strength of
acidic sites follows the order Weak acid sites gt medium sites gt strong acid sites CoFeg exhibits
the highest total acidity than that of other samples
35 Photocatalytic activity of CoFe2O4 samples
According to the above-mentioned optical properties we studied the photocatalytic
activity of the investigated CoFe2O4 nanoparticles under visible light irradiation using the
degradation of Basic Red 18 (BR 18) aqueous solution as a basic dye model Before the
irradiation process the suspended solution of the dye and catalyst was stored in the dark for 45
min to assurance adsorptiondesorption equilibrium The photocatalytic degradation results are
illustrated in Figure 11 From which it can be seen that the degradation of the dye is very slow
in the absence of the catalyst and the CoFeg sample showed the highest photocatalytic
efficiency due to the high optical absorptions in vis The light region with lower bandgap
energy and a larger surface area Therefore this sample was selected to test the impact of
catalyst dosage dye concentration and pH of the solution on the dye degradation rate The
results obtained given in Fig 11 show that the rate of dye degradation has the highest rate at 3
mgL catalyst dosage and decreases with increasing dye concentration in the range of 10 -100
ppm and has the highest pH= 7 of the solution
httpsdoiorg1033263BRIAC12113351351
httpsbiointerfaceresearchcom 1348
Given literature reports the kinetic of photocatalytic reaction can be calculated
according to
- ln (CCo) = kobs t (7)
where Co and C are the concentrations of dye at zero time and time t respectively and kobs are
the pseudo-first-order rate constant The rate constant kobs evaluated from the slope of the
straight line of plotting minusln(CC0) vs reaction time Figure 11-b showed a value of 01 min-1
Figure 11 (A) Photocatalytic degradation rate for 10 ppm Basic Red 18 over investigated CoFe2O4 samples at
pH = 7 dye solution without catalyst and in the presence of 3 mgL catalysts of (b) CoFes (c) CoFep and (d)
CoFeg (B) Pseudo first order photocatalysis for 10 ppm Basic Red 18 dye over 3mgl CoFeg at pH = 7
351 Mechanism of photocatalysis
The major oxidative species in the photocatalytic progression are positive holes (h+VB)
and the OH- hydroxyl radical formed during the irradiation process In the present work the
trapping experiments were used to determine which one of these species is active for organic
degradation
Figure 12 Effect of additives on the photocatalytic degradation rate of 10 ppm Basic Red 18 over 3
mgL FeCog at pH = 7 (a) Without additive (b) Isopropyl alcohol (c) EDTA
EDTA-2Na and isopropyl alcohol were used as an H+ and isopropyl alcohol as an OH
scavenger respectively [32] The results showed that the additive of isopropyl alcohol slightly
changed the dye degradation indicating that OH radicals were minor factors in the
photocatalytic degradation process whereas the addition of h+ capture (EDTA-2Na) caused a
great decrease in the degradation efficiency as shown in Figure 12 This foundation distinctly
denoted that positive holes are the major active species of dye dissociation
httpsdoiorg1033263BRIAC12113351351
httpsbiointerfaceresearchcom 1349
4 Conclusions
Nanosized cobalt ferrite (CoFe2O4) particles are synthesized through three different
methods (sol-gel solid-state blending and co-precipitation) The proposed preparations are
inexpensive and thus appropriate for the large-scale production of such type nanoparticles
XRD approves the formation of a spinel phase in all preparation methods The FT-IR spectra
displayed two characteristic metal-oxygen vibrational bands for the spinel structure The results
reveal that the synthetic route affected each particle size morphological structure surface
textures surface acidic properties cation distribution optical and magnetic properties Both
Fe3+and Co2+ are distributed in octahedral and tetrahedral sites in a ratio depending on the
preparation method The variation in this ratio controlled the studied properties The results
showed that the prepared ferrite exhibits either ferromagnetic or super-paramagnetic behavior
with magnetic parameters of particular importance for allowing the magnetic recovery and
reuse of the catalyst and the possibility to be used in recording media Ammonia TPD analyses
showed that weak acid sites prevail medium-strength sites whereas the number of strong acid
sites is the least The obtained ferrite is utilized as photocatalytic for degradation Basic Red 18
(BR 18) dye under visible light irradiation with the highest degradation rate for the sample
prepared by the gel method The prepared ferrite photocatalysts can potentially be used for
cleaning polluted water with the help of magnetic separation
Funding
This research received no external funding
Acknowledgments
The authors declare no acknowledgments
Conflicts of Interest
The authors declare no conflict of interest
References
1 Gratiet A L Amora M D Duocastella M Marongiu R Bendand A Giordani S Bianchini P
Diaspro A Zebrafish structural development in Mueller-matrix scanning microscopy J Scien Repor 2019
9 19974-19984
2 Prabhakaran T Mangalaraja RV Denardin JC Jimenez JA The effect of calcination temperature on
the structural and magnetic properties of co-precipitated CoFe2O4 nanoparticles J Alloys Compd 2017 716
171ndash183
3 Safi R Ghasemi A Shoja-Razavi R Factors controlling magnetic properties of CoFe2O4 nanoparticles
synthesized by chemical co-precipitation Modeling and optimization using response surface methodology
Ceram Int 2016 42 15818ndash15825
4 Vileacutem B David S Štepaacuten H Švecovaacute M Pavel U Ondrej J Synthesis and Properties of Nanosized
Stoichiometric Cobalt Ferrite Spinel Materials 2018 11 1241
5 Jalalian M Mirkazemi SM Alamolhoda S Phase constituents and magnetic properties of the CoFe2O4
nanoparticles prepared by polyvinylpyrrolidone (PVP)-assisted hydrothermal route Appl Phys 2016 A 122
835
6 Liu M Lu M Wang L Xu SC Zhao JL Li HB Mossbauer study on the magnetic properties and
cation distribution of CoFe2O4 nanoparticles synthesized by hydrothermal method J Mater Sci 2016 51
5487ndash5492
httpsdoiorg1033263BRIAC12113351351
httpsbiointerfaceresearchcom 1350
7 Mishra S Sahoo SS Debnath AK Muthe KP Dasb N P Cobalt ferrite nanoparticles prepared by
microwave hydrothermal synthesis and adsorption efficiency for organic dyes Isotherms thermodynamics
and kinetic studies J Advan Powde Techno 2020 31 11 4552-4562
8 Ikram S Arshad M I Mahmood K Alia A Amin N Structural magnetic and dielectric study of La3+
substituted Cu08Cd02Fe2O4 ferrite nanoparticles synthesized by the co-precipitation method J
AlloyCompo 2018 15 1019-1025
9 Yadava R S Kuřitka I Vilcakova J Havlica J Kalina L Urbaacutenek P Machovsky M Skoda D
Masař M Holek M Sonochemical synthesis of Gd3+ doped CoFe2O4 spinel ferrite nanoparticles and its
physical properties J Ultraso Sonochem 2018 40 773-783
10 Samoila P Cojocaru C Sacarescu L Dorneanu PP Domocos A-A Aurelian Rotaruca Remarkable
catalytic properties of rare-earth doped nickel ferrites synthesized by sol-gel auto-combustion with maleic
acid as fuel for CWPO of dyes J Appl Catal 2017 B 202 21ndash32
11 Babu KR Rao KR Babu B R Cu2+-modified physical properties of Cobalt-Nickel ferrite J Magn
Magn Mater 2017 434 118ndash125
12 Torkian S Ghasemi A Razavi R S Cation distribution and magnetic analysis of wideband microwave
absorptive CoxNi1minusxFe2O4 ferrites Ceram Int 2017 43 6987ndash6995
13 Alves T M L Amorim B F Torres MAM Bezerra CG Medeiros SN Gastelois P L Outon L
E F Macedo WAA Wasp-waisted behavior in magnetic hysteresis curves of CoFe2O4 nanopowder at a
low temperature experimental evidence and theoretical approach RSC Adv 2017 7 22187
14 Annie VP Immaculate NMG Mahalakshmi K Ansel ML Jerome DS Study on Cobalt Ferrite
Nanoparticles Synthesized by Co-Precipitation Technique for Photo-Fenton Application Mech Mater Sci
Eng 2017 9 110-115
15 Baldini A Petrecca M Sangregorio C Tamburini UA Magnetic properties of bulk nanocrystalline
cobalt ferrite obtained by high-pressure field assisted sintering J Phys D Appl Phys 2021 54 194006
16 Bhagwat VR Khedkar MV Kulkarni G Kharat PB Jadhav KM Dextrose assisted sol-gel auto
combustion synthesis and magnetic characterizations of cobalt ferrite nanoparticles J AIP Confere Proceed
2020 2265 030085 httpsdoiorg10106350017310
17 Gupta M Das A Mohapatra S Das D Datta A Surfactant based synthesis and magnetic studies of
cobalt ferrite J Appli Phys A 2020 126 660
18 Swatsitang E Phokha S Hunpratub S Usher B Bootchanont A Maensiri S Chindaprasirt P
Characterization and magnetic properties of cobalt ferrite nanoparticles J Alloy Compo 2016 664 15 792-
797
19 Allaedini G Tasirin S M Aminayi P Magnetic properties of cobalt ferrite synthesized by hydrothermal
method J Inter Nano Letter 2015 5 183ndash186
20 Najeehah C Z Chaudhary K T Ali J Synthesis and Characterization of Cobalt Ferrite Nanoparticles via
Sol-Gel Auto Combustion Method J Soli Stat Phenom 2020 307 58-63
21 Ateia1 EE Abdelatif G Soliman FS Optimizing the physical properties of calcium nano ferrites to be
suitable in many applications J Mater Sci Mater Elect 2017 28 5846ndash5851
22 Mazrouei A Saidi A Microstructure and magnetic properties of cobalt ferrite nano powder prepared by
solution combustion synthesis J Mater Chem Phys 2018 209 152-158
23 Purnama B Wijayanta AT Suharyana Effect of calcination temperature on structural and magnetic
properties in cobalt ferrite nano particles J King Saud Univ Sci 2019 31 956-960
24 Rao KS Choudaryb GSVRK Rao KH Sujatha Ch Structural and Magnetic properties of Ultrafine
CoFe2O4 J Nanoparticles J Proc Mater Sci 2015 10 19-27
25 Kurian M Thankachan S Nair DS Aswathy EK Babu A Thomas A Krishna K T B Structural
magnetic and acidic properties of cobalt ferrite nanoparticles synthesised by wet chemical methods J Adv
Ceram 2015 4 199-205
26 Kovacheva D Ruskov T Krystev P Asenov S Tanev N Moumlnch I Koseva R Wolff U Gemming
T Markova-Velichkova Nihtianova D Arndt Synthesis and characterization of magnetic nano-sized
Fe3O4 and CoFe2O4 J Bulg Chem Commun 2012 44 90-97
27 George T Sunny A T Varghese T Magnetic properties of cobalt ferrite nanoparticles synthesized by sol-
gel method Mater Sci and Eng 2015 73 012050 httpsdoiorg1010881757-899X731012050
httpsdoiorg1033263BRIAC12113351351
httpsbiointerfaceresearchcom 1351
28 Reddy M P Mohamed AMA Zhou XB Duc S Huang Q A facile hydrothermal synthesis
characterization and magnetic properties of mesoporous CoFe2O4 nanospheres J Magn Magnet Mater
2015 38840-44
29 Panchal NR Jotania RB Cobalt ferrite nano particles by microemulsion route J Nanotech Nanosci
2010 1 17-18
30 Naik M M Vinuth M Karthik K Suresha B Nagaraju G Sujatha H R Photocatalytic degradation
of dyes by cobalt ferrite nanoparticles synthesized by sol-gel method J AIP Conferen Proceed 2020 2274
040004 httpsdoiorg10106350022559
31 Andhare DD Patade SR Kounsalye JS Jadhav KM Effect of Zn doping on structural magnetic and
optical properties of cobalt ferrite nanoparticles synthesized via Co-precipitation method J Physica B
Conden Matte 2020 583 15 412051
32 Muthukumaran T Philip J Synthesis of water dispersible phosphate capped CoFe2O4 nanoparticles and
its applications in efficient organic dye removal J Collo Surf A Physicochem Engine Aspec 2021 5
125755
33 Sharma I Madara S R Sharma P Study of Tauc gap optical density and penetration depth of vacuum
evaporated Pb15Se85minusxGex (x = 0 3 6 at ) thin films supported by chemical bond approach and physical
parameters J MateToday 2020 28 2 402-407
34 Schrader B Infrared and Raman Spectroscopy Methods and Applications VCH Weinheim Germany 1995
100 807
35 Wanga F Mab Y Zhang H Gu J Yin J Jia X Zhang H Wang Y Fu X Yu R Wang Z Han
S Wang G Rheological properties and sedimentation stability of magnetorheological fluid based on multi-
walled carbon nanotubescobalt ferrite nanocomposites J Molec Liqu 2021 324 15 115103
36 Gil A F Benavides O Vargas S M May L De LaC Carachure C P Synthesis and Characterization
of Cobalt Ferrite CoxFe3-xO4 Nanoparticles by Raman Spectroscopy and X-Ray Diffraction Int J Meta Met
Phys 2020 5 047
37 Omiddezyani S Gharehkhani S Asli V Y Khazaee I Ashjaee M Nayebi R Shemirani F
Houshfar E Experimental investigation on thermo-physical properties and heat transfer characteristics of
green synthesized highly stable CoFe2O4rGO nanofluid J Collo Surf A Physicochemi Engin Aspec 2021
610 5 125923
38 Monisha P Dharshini PP Gomathi SS Pushpanathan K Ferro to super-paramagnetic transition
Outcome of Ni doping in polyethylene glycol capped CoFe2O4 nanoparticles J Alloy Comp 2021 856 5
157447
39 Revathi J JohnAbel M Archana V Sumithra T Thiruneelakandan R Prince JJ Synthesis and
characterization of CoFe2O4 and Ni-doped CoFe2O4 nanoparticles by chemical Co-precipitation technique for
photo-degradation of organic dyestuffs under direct sunlight 2020 587 15 412136
40 Mmelesi O K Masunga N Kuvarega A Nkambule TTI Mamba B B Kefenia KK Photocatalytic
antimicrobial activity and toxicity in water treatment J Mate Scien Semicond Proce 2021 123 1 105523

httpsdoiorg1033263BRIAC12113351351
httpsbiointerfaceresearchcom 1336
distinguished mechanical and chemical stability [2-7] Generally cobalt ferrite exhibits a
partially inverse spinel structure in which both sites (A and B) hold a fraction of Co2+ and Fe3+
cations It shows the formula of (Co2+1- Fe3+
)A[Co2+ Fe3+
2-]BO4 where is a fraction of
tetrahedral sites occupied by Fe3+ ions which is known as the degree of inversion The degree
of inversion is sensitive to numerous parameters such as the microstructure and synthesis
process This work is designed to prepare CoFe2O4 with three different methods (co-
precipitation ceramic and sol-gel) and investigate how the change in each cation distribution
particle size and surface area affect the optical and magnetic properties which ultimately
determine the magnetic and photocatalytic applications
2 Materials and Methods
21 Materials
All chemicals were reagent grade and utilized without further purification Cobalt (ll)
nitrate (Hexahydrate) [Co(NO3)26H2O] was acquired from SD Finchem Limited Mumbai 400
030 Ferric nitrate [Fe(NO3)39H2O] was obtained from LOBA CHEMIE PVTLTD Cobalt (ll)
acetate [(CH3COO)2Co4H2O] was purchased from Fluka Garantie Switzerland Cobalt
sulfate CoSO47H2O was prepared from the reaction of H2SO4 with CoCl2 Bidistilled water
was utilized in all the experiments
22 Synthesis of CoFe2O4 Samples
CoFe2O4 nanoparticles were prepared by three different methods
221 Ceramic method
A mixture of CoSO47H2O Fe(NO3)39H2O NaOH and NaCl in the molar ratio of 1
2 8 10 were pulverized together in an agate mortar for about 60 min followed by calcination
at 700degC for two hours The obtained product was crushed and well washed with bidistilled
water and dried at 95degC for one hour and heated to700degC with a heating rate of 5degC min The
sample was symbolized as CoFes
222 Co-precipitation method
Cobalt and iron nitrate in a molar ratio of 12 were dissolved in bidistilled water Urea
was then added to the heated solution at 90degC with stirring The precipitate obtained was
filtered well washed with bidistilled water and dried at 95degC for 12 hours Finally the powder
acquired was calcined up to 700degC with a heating rate of 5degC min The sample was denoted
as CoFep
223 Sol-gel method
A mixture of 291 g of [Co(NO3)26H2O] 808 g of [Fe(NO3)39H2O] and 10 g of citric
acids were dissolved in bidistilled water with stirring at 85degC to get gel phase The gel gained
was then dried in an oven at 100degC for 12 hours Finally the powder obtained was calcined up
to 700degC with a heating rate of 5degC min The sample was symbolized as CoFeg
httpsdoiorg1033263BRIAC12113351351
httpsbiointerfaceresearchcom 1337
23 Characterization methods
XRD analysis was performed on a Philips X Pert Pro Super diffractometer with Cu Kα
radiation (λ=154 Aring) Electron microscope analysis was done by SEM and TEM electron
microscopy model JEOL JEM-100CXII and JEOL-2010 respectively The FT-IR spectra of
the specimens were obtained by employing a Brucker-FT-IR in the range of 4000-400 cm-1 A
U-1000 laser Raman Spectrometer with 5145 nm line of an ArC laser was used to determine
Raman spectra Optical absorption was measured by employing Cary 5G equipment at
wavelengths ranging from 200 to 1000 nm The photoluminescence (PL) studies were made
using a 225 nm excitation wavelength source Traditional surface area and textural surface
properties were studied using the BET - N2 gas adsorption technique The electron binding
energies for the elements were determined using a PHI-5702 multifunctional spectrometer with
AlKα radiation (XPS) The magnetic properties of the prepared samples were studied using the
vibrating sample magnetometer model (VSM-9600M-1 USA) in a maximum applied field of
10 kOe
A programable ammonia desorption technique (TPD-NH3) was used to determine the
type and the amount of acidity in the studied samples This is performed in a reactor filled with
04 g of the sample which was previously activated at 250 for 3 hours with N2 flow The
sample was then permitted to expose to NH3 at room temperature for one hour The overflow
of NH3 was swill out of the reactor with N2 flow The temperature was then elevated linearly
at a rate of 10 min to liberate NH3 gas from the sample at a temperature interval of 100
up to 500 The liberated NH3 is allowed to flow through a known large amount of H2SO4
solution Finally the amount of acid was determined by back titration with NaOH solution
using MO indicator
24 Photocatalytic study
Basic Red 18 (BR 18) dye was selected as an ideal system for a catalytic reaction
because of its intense color in an aqueous medium and low biodegradability due to the existence
of benzene rings The photocatalytic degradation of Basic Red 18 (BR 18) dye over ferrite
nanoparticles was performed in a photoreactor with a total capacity of 05 L The illumination
source was a UV-C lamp (200-980 nm 9 W Philips) put in the internal quartz tube of the
photoreactor The impact of ferrite dosage on Basic Red 18 (BR 18) dye oxidation was
examined using a dose of 0-005 gl The photocatalytic study was investigated at a pH range
of 2-9 and initial dye concentration in the range of 50-200 ppm The solution pH was regulated
using NaOH or HCl Specimens were removed from the arrangement at specific periods and
centrifuged and the concentration in the supernatant dye solution was then analyzed using UV-
vis Spectrophotometer (a Cary 5G equipment)
3 Results and Discussion
31 Characterizations
XRD patterns of the prepared CoFe2O4 ferrites are shown in Figure 1 All the ferrite
samples showed diffraction peaks at 2θ values 316deg 370deg 441deg 554deg 591deg and 651deg
attributed to the reflection planes of (220) (311) (400) (422) (511) and (440) respectively
of the spinel crystal structure (JCPDS 22-1086) No other peaks are observed for all specimens
indicating the purity of the ferrites There is a slight shift of (311) peak towards lower angle
httpsdoiorg1033263BRIAC12113351351
httpsbiointerfaceresearchcom 1338
side in the order CoFesgt CoFep gt CoFeg The average lattice constant (a) for the (311) plane
was determined using equation (1) [8] and the results obtained are listed in Table 1
a = radicℎ2 + 1198962 + 1198972 2 sinθ (1)
where h k l are miller indices It is noted that the lattice constant follows the order CoFes gt
CoFep gt CoFeg This may be attributed to a certain number of Co2+ ions (078 Aring) transfer from
octahedral sites accompanied by the opposite migration of an equivalent number of Fe3+ ions
(0645 Aring) from tetrahedral to octahedral sites to relax the compressive strain The average
crystallite sizes (DXRD) of the investigated samples were calculated (based on 3 different peaks)
from the widening of reflection peaks using the Scherrer formula [7]
DXRD = 09 λ β cosθ (2)
where λ is the X-ray wavelength and β is the half peak width of the diffraction peak in radiant
The results are listed in Table 1 and found to lie in the range of 21 ndash 33 nm The average X-ray
density (ρx) of the cobalt ferrite nanoparticles was determined using the following equation
ρx = 8MNa3 (3)
Where M is the molecular weight of cobalt ferrite N is Avogadros number The results
are also listed in Table 1
Figure 1 XRD of CoFe2O4 samples (a) CoFes (b) CoFeg and (c) CoFep
Table 1 Lattice constant density particle size values and FT-IR data of the studied CoFe2O4 samples
Sample Lattice
constant(Aring)
X-ray
density
(gcm3)
XRD-
particle
size
(nm)
TEM-
Particle
size
(nm)
Tetrahedral
vibration
(cm-1)
Octahedral
Vibration
(cmminus)
OH-
group
δH-O-H
bonding
CoFeg 8387 5282 21 23 563 402 3428 1640
CoFep 8392 5267 31 28 579 413 3432 1625
CoFes 8412 5235 36 39 581 428 3439 1635
httpsdoiorg1033263BRIAC12113351351
httpsbiointerfaceresearchcom 1339
The formation of the CoFe2O4 spinel structure was also supported by infrared spectra
shown in Figure 2 The spectra of all samples demonstrate two specific bands for spinel
structure ν1 in the range 581ndash563 cmminus1 relates to Mtetr -O vibration at the tetrahedral site and
ν2 in the range 428ndash402 cmminus1 attributed to Mocta -O vibration at the octahedral sites [9-11] The
mean feature bands observed are recorded in Table 1 The variation in the band positions is due
to the difference in the metalndashO distances for the octahedral and tetrahedral complexes
referring to a change in cation distribution in the spinel structure by changing the preparation
method These results strongly support the results of XRD data The broad bands focused at
1640-1625 cmminus1 are appointed to the δ H-O-H bonding mode of the adsorbed water [12]
Figure 2 FT-IR of CoFe2O4 samples (a) CoFep (b) CoFes (c) CoFeg
The SEM and TEM micrographs of the as-synthesized CoFe2O4 particles are given in
Figure 3 (A and B) As seen depending on the preparation method the nanoparticles have been
developed in different orders and clusters
Figure 3 (A) SEM and (B) TEM of (a) CoFes (b) CoFep and (c) CoFeg
(B) (A)
httpsdoiorg1033263BRIAC12113351351
httpsbiointerfaceresearchcom 1340
SEM and TEM images of CoFes show morphology nanoparticles predominated by
nanorods structure The other cobalt ferrite specimens CoFep and CoFeg demonstrates
aggregated spherical particles besides particles with polygon morphologies The variation in
the morphology of the NPS shown in Figure 2b denotes that the crystal growth of CoFe2O4
depends largely on the preparation method The nanoparticle sizes were obtained using
histograms of 100 particles observed in the TEM image are listed in Table 1 The slight contrast
found in the results of XRD and TEM is due to the different handles of the two tools TEM
analysis offers a number-average size distribution XRD manifests a volume-averaged median
size In XRD the correctness of Scherrers formula is influenced by numerous variables for
example diffraction line width and surface tension Thus Scherrers equation might cause
particular errors in determining the fixed value of the crystallite size [7]
XPS results of the CoFe2O4 samples are given in Figure 4 where binding energy (BE)
ranges from 0 to 1200 eV The spectra show that the samples contain only the main elements
Fe Co and O besides the contaminated C element coming from the environment The binding
energy (BE) values obtained attached well with the literature data for CoFe2O4 Table 2 [13]
proving that pure ferrite had been produced
Figure 4 XPS of (a) CoFes (b) CoFep (c) CoFeg
a)
b)
c)
Binding energy
(eV)
httpsdoiorg1033263BRIAC12113351351
httpsbiointerfaceresearchcom 1341
Figure 5 High-resolution XPS of CoFeg sample
Table 2 XPS results of the investigated CoFe2O4 samples
Sample Spectrum BE(eV) Assignment Atomic Particle
Size (nm)
CoFes
Co 2p32
7803 Octahedral Co2+ 48
36
7821 tetrahedral Co2+ 52
785 satellite peak of Co2+ -
Fe 2p32
711 octahedral Fe3+ 76
7135 tetrahedral Fe3+ 24
717 Satellite peak Fe3+ -
O 1s
52985 CoFe2O 73
5315 CoFe2O4 16
534 Artifact 11
CoFep
Co 2p32
780 Octahedral Co2+ 55
31
7819 tetrahedral Co2+ 45
7855 satellite peak of Co2+ -
Fe 2p32
7105 octahedral Fe3+ 725
7132 tetrahedral Fe3+ 275
7167 Satellite peak Fe3+ -
O 1s
5297 CoFe2O4 80
5315 CoFe2O4 12
5345 Artifact 8
CoFeg
Co 2p32
7799 Octahedral Co2+ 63
21
7816 tetrahedral Co2+ 37
7844 Octahedral Co2+ -
Fe 2p32
7109 octahedral Fe3+ 685
7131 tetrahedral Fe3+ 315
7171 Satellite peak Fe3+ -
O 1s
5299 CoFe2O4 78
5315 CoFe2O4 13
5345 Artifact 9
To investigate the cation valence states and their distribution in the CoFe2O4 spinel the
high-resolution XPS spectra of Fe 2p Co 2p and O1s peaks of the CoFe2O4 specimen were
studied and given for CoFeg in Figure 5 The integrated intensities of the fitted peaks of Co2+
and Fe3+ ions were used to determine their distributions in both octahedral and tetrahedral
positions The table also shows an increase in the concentration of Fe3+ cations on octahedral
sites with the increase in the particle size of the sample which agrees well with XRD data In
conclusion it can be said that the selection of the preparation route is effective in controlling
the cation distribution within the spinel lattice The presence of high intense satellite structure
on the high binding energy side of the Co 2p32 and Fe 2p32 might be attributed to the band
structure related to octahedral Co 2p in the oxide lattice
32 Magnetic study
To investigate the effect of the synthetic method on the magnetic properties the VSM
test was done at room temperature in an applied field of 10 kOe The results are represented in
httpsdoiorg1033263BRIAC12113351351
httpsbiointerfaceresearchcom 1342
Figure 6 which shows hysteresis loops referring to the ferromagnetic nature of all samples
The M(H) curves also show a linear part at higher magnetic fields signifying a meaningful
paramagnetic contribution to the magnetization The saturation magnetizations (Ms) are
evaluated by extrapolating the plots of M vs 1H employing data at high magnetic fields [14]
The magnetic parameters are extracted from M-H plots Figure 6 and listed in Table 3 The
coercivity (Hc) remanent magnetization (Mr) are extracted from M-H plots (Figure 6) and listed
with the saturation magnetizations (Ms) and the squareness values of the hysteresis loops for
all specimens in Table 3 The small values of the coercivity (Hc) of CoFe2O4 nanoparticles
denote that the studied samples lie near the super-paramagnetic limit
Figure 6 Magnetic hysteresis of investigated samples (a) CoFeg (b) CoFep (c) CoFes
For the ideal inverse spinel crystal structure of CoFe2O4 with all the Co2+ ions located
at the octahedral site the magnetization per formula unit can be theoretically evaluated using
Neels two sublattice model by considering the difference of total magnetic moments in
octahedral and tetrahedral sites [15-18] M=Moctahedral ndash Mtetrahedral The magnetic moment of
Fe3+ and Co2+ cations are 50 and 38 microB respectively the theoretical magnetic moment of
CoFe2O4 is 38 microB per formula unit Based on the cation distribution obtained from XPS the
magnetization per formula unit was also calculated and listed in Table 3 which shows that the
magnetic moments change with the preparation methods The magnetic moment values of the
investigated samples can also be determined experimentally by the following equation in Bohr
magneton
microB = MolwttimesMs5585 (4)
However the evaluated data from XPS and VSM are not equal which can be associated
with the finite size of nanoparticles conducting to the noncollinearity of magnetic moments on
the surface of the nanoparticles The disordered moments are developed due to the broken
exchange bonds at the outer layer On the other hand the competition antiferromagnetic
interactions precede a noncollinear arrangement of magnetic moments within interstitial
sublattices induced by the non-equilibrium cation distribution among tetrahedral and
octahedral sites [151718] Shifting of larger Co2+ (078 Aring) to substitute the smaller Fe3+ (0645
Aring) cations in octahedral sites produce strains on the surface due to the smaller space between
the octahedral site cations comparable to the tetrahedral site cations in nanoparticles The
strains obtained can break the surface exchange bonds which cause the canted spin structure
This type of tetrahedral-octahedral interaction points to lower magnetization values in the
ferrite nanoparticles than the bulk CoFe2O4 [17] The low Ms-value of the investigate ferrite
httpsdoiorg1033263BRIAC12113351351
httpsbiointerfaceresearchcom 1343
samples compared with that of the bulk one (809 emug) [3] can also be explained based on
the core-shell model which clarifies that the finite-size effects of the nanoparticles manage to
canting or non-collinearity of spins on their surface in that way reducing magnetization [16]
To sum up it can be said that the change in saturation magnetization with the variation
in the preparation methods is possibly due to the rearrangement of the cation distribution ie
the exchange of Co2+ and Fe3+ ions from octahedral and tetrahedral sites and vice versa The
low values of Ms for the investigated samples could be credited to surface distortion which
destabilizes the collinear spin arrangement and producing various canted spin structures at the
surface This effect is especially noticeable for ultrafine particles owing to their large surface-
to-volume ratio The reduction in coercivity with increasing particle size could be accredited
to the combination of surface anisotropy and thermal energies [19]
The values of the squareness ratio (MrMs) of investigated samples shown in Table 3
are below 05 refers to that these samples are multidomain and the particles interact by
magnetostatic interaction [20]
The magnetic anisotropy (K) has also been calculated using the following relation [21]
Hc = 098 KMs (5)
and the results obtained showed high values of 16711 13571 and 6181 emuOeg-1 for CoFep
CoFeg and CoFes respectively The increase in K value is going parallel with increasing the
presence of Co2+ ions in the octahedral sites as shown in XPS results (Table 2)
The effect of the preparation method on the magnetic parameters of our CoFe2O4
nanoparticles is compared with other methods present in the literature and listed in Table 4
Table 4 Effect of the preparation methods on magnetic parameters of CoFe2O4 nanoparticles
Preparation
method Particle Size (nm) Ms (emug) Mr (emug) Hc(Oe) Reference
Green
Co-precipitation
ceramic
combustion
Co-precipitation
Sol-gel
Co-precipitation
Co-precipitation
Sol-gel
hydrothermal
Microemulsion
21
31
36
33
32
55
42
21
18
120
28
380
431
466
316
356
424
27
104
30
60
158
101
125
369
96
13
89
87
10
10
23
0612
370
360
130
870
614
434
500
30
100
150
1357
Present work
Present work
Present work
[22]
[23]
[24]
[25]
[26]
[27]
[28]
[29]
33 Surface properties
The surface properties of the spinels investigated were studied using the BET technique
The isothermal N2 adsorption-desorption plots of these samples Figure 7 can be classified as
type IV for CoFep and type V for CoFeg and CoFes according to IUPAC which is characteristic
of the mesoporous material in which the adsorption proceeds via multilayer adsorption
followed by capillary condensation The hysteresis loops show the type H3 (aggregates of
platelike particles forming slit-shaped pores) for all samples The studied samples textural
properties including BET-surface area average pore diameter pore-volume and pore size
distribution calculated from BJH method are derived from N2 nitrogen adsorptiondesorption
isotherms and listed in Table 5 The data obtained refer to that the surface properties depend
largely on the method of preparation and CoFeg exhibits the highest surface area
httpsdoiorg1033263BRIAC12113351351
httpsbiointerfaceresearchcom 1344
Figure 7 Nitrogen adsorption-desorption isotherms of investigated samples (a) CoFeg (b) CoFep (c) CoFes
Table 5 Textural surface data obtained from BET measurements for CoFe2O4 samples
Samples Particle size dXRD
(nm) Vst (mlg) Vp (mlg) Vm (mlg)
SBET
(m2gm) r (Aring)
CoFes 36 62 009 6 25 98
CoFep 31 138 021 10 45 89
CoFeg 21 261 040 32 99 73
34 Optical properties
The prepared CoFe2O4 nanoparticles show still high magnetization that photocatalyst
appropriate for magnetically separable by a magnetic field and separation of photocatalyst from
solution Thus the photocatalytic activity of the investigated samples has been studied The
optical absorption property related to the electronic structure characteristic is documented as
the main factor in deciding the photocatalytic activity [30] The diffuse reflectance spectra of
our ferrites were recorded and converted to the Kubelka-Munk function K-M Figure 8 using
the following equation
K-M= (1minusR)2 2R (6)
Where R is absolute reflectance the results obtained are listed in Figure 8A The spectra
show that all synthesized CoFe2O4 samples exhibited photo-absorption in the visible light
httpsdoiorg1033263BRIAC12113351351
httpsbiointerfaceresearchcom 1345
region which implies the probability of high photocatalytic efficiency of these materials under
visible light The absorption behavior in the visible region is originated from the electronic
charge transformation of Co2+ and Fe3+ to their conduction level in the conduction band [7 31
32] The CoFe2O4 stoichiometry is organized in an incompletely inverse structure [27] with
the Co2+ ion at both tetrahedral and octahedral sites as shown in our results (XRD XPS and
magnetic data)
Figure 8 (A) UVndashvis spectra presented as the Kubelka-Munk function for CoFe2O4 nanoparticles (B)
Taucs plots for CoFe2O4 nanoparticles
Broad CondashO and FendashO charge transfers together with dndashd electron moves of Co2+ and
Fe3+ in numerous coordination guarantee the full absorption of the visible spectrum The
bandgap energies of the investigated ferrites were estimated according to Taucs [33] by
plotting (KM hν)1n versus hν where h is a Plancks constant n is the light frequency and n
is a constant relating to a mode of transition ( n = frac12 for allowed direct transition and n= 2 for
indirect transition) Taucs plots shown in Figure 8-b for every one of the specimens
demonstrated that the band-to-band direct transitions are more inclined to happen than the
indirect transitions The optical energy gaps Eg obtained from the intercept of the plot with
the X-axis are recorded in Table 6 from which it can be seen that Eg value decreases with
increasing the particle size and showed the smallest value for CoFeg sample
0
00005
0001
00015
0002
CoFes
CoFep
C0Feg
K-M
Wavelehgth (nm)
(A)
0
001
002
003
004
005
006
007
008
15 175 2 225 25 275 3
CoFes
CoFep
CoFeg
Energy (eV)
(K-M
E
)2
(B)
httpsdoiorg1033263BRIAC12113351351
httpsbiointerfaceresearchcom 1346
Table 6 Optical and surface acidity data of CoFe2O4 samples Table 6 Optical and surface acidity data
of CoFe2O4 samples
Samples Particle
size (nm)
λmax
(nm)
Eg
(eV)
Surface
Acidity sites
Weak
(mmolg)
Surface Acidity
sites medium
(mmolg)
Surface
Acidity sites
Strong
(mmolg)
Surface
Acidity
Total
sites
(mmolg)
Bulk --- 790 20 - - - -
CoFes 36 590 139 75 55 30 160
CoFep 31 610 138 60 41 21 132
CoFeg 21 620 137 110 61 40 211
341 Raman spectroscopy
Raman spectra were used to acquire a vision of the vibrational energy states within the
spinel ferrite and review the structural characteristics and compositional regularity throughout
the samples [34] The spinel ferrite exhibit five active Raman vibration modes [3536] The
Raman spectra of our samples showed only three bands due to peak overlapping at 284-297
cm-1 460-470 cm-1 and 640-650 cm-1 as shown in Figure 9 which was assigned as Eg 3T2g
and A1g (1) respectively [37] The A1g (1) band is related to symmetric stretching vibration
mode at the tetrahedral (A) site While A1g (1) band might be related to the vibration of Co-O
bonds at the tetrahedral (A) site The results obtained in Figure 9 show that the frequency of
Raman modes of the investigated spinels is slightly changed with the preparation method This
could be attributed to the variation in the cation distribution in the spinel lattice as mentioned
above
Figure 9 Raman spectra of investigated samples (a) CoFeg (b) CoFep (c) CoFes
342 Photoluminescence study
Photoluminescence (PL) spectroscopy is an outstanding procedure to get valuable
information concerning energy and the dynamics of charge carriers yielded during the exposure
of light The photoluminescence of the ferrite nanoparticles was studied using a 225 nm
excitation wavelength source and the results obtained are presented in Figure 10 The spectra
of all samples show broad visible emission peaks at 434 - 442 nm which are attributed to the
charge transport between Co2+ at tetrahedral sites and Fe3+ at octahedral sites that are
surrounded by O2- ions [38] The variation in the position and the intensity of luminescence
can be explained on the basis that the PL-spectra are sensitive to the character of nanoparticles
surface due to the existence of gap surface disorders developing from surface non-
stoichiometry and unsaturated bonds The defects produced in the nanomaterial lattice during
preparation are the base of luminescent properties [39] The emission intensity of CoFeg is
httpsdoiorg1033263BRIAC12113351351
httpsbiointerfaceresearchcom 1347
lower than that of the rest samples This indicates that this sample acted as traps for the photo-
induced charge carriers These outcomes confirm the previously mentioned results on the
influence of the preparation methods on the surface and optical properties
Figure 10 Photolumiscence spectra of investigated samples (a) CoFep (b) CoFes (c) CoFeg
343 Surface acidity
Temperature-programmed desorption of ammonia (TPD-NH3) is an appropriate
procedure for measuring the quantity and the spreading of the acid sites on the surface of our
samples The acid site distribution results for the studied samples are summarized in Table 6
The ammonia desorbed at 100 oC contains some physisorbed ammonia as well as overstating
the proportion of weak acid sites Whereas the ammonia desorbed at 220 ndash 370 oC and that at
450-600 oC are attributed to medium and strong acid sites respectively [40] The results
obtained show that the acidity varies with preparation methods For all samples the strength of
acidic sites follows the order Weak acid sites gt medium sites gt strong acid sites CoFeg exhibits
the highest total acidity than that of other samples
35 Photocatalytic activity of CoFe2O4 samples
According to the above-mentioned optical properties we studied the photocatalytic
activity of the investigated CoFe2O4 nanoparticles under visible light irradiation using the
degradation of Basic Red 18 (BR 18) aqueous solution as a basic dye model Before the
irradiation process the suspended solution of the dye and catalyst was stored in the dark for 45
min to assurance adsorptiondesorption equilibrium The photocatalytic degradation results are
illustrated in Figure 11 From which it can be seen that the degradation of the dye is very slow
in the absence of the catalyst and the CoFeg sample showed the highest photocatalytic
efficiency due to the high optical absorptions in vis The light region with lower bandgap
energy and a larger surface area Therefore this sample was selected to test the impact of
catalyst dosage dye concentration and pH of the solution on the dye degradation rate The
results obtained given in Fig 11 show that the rate of dye degradation has the highest rate at 3
mgL catalyst dosage and decreases with increasing dye concentration in the range of 10 -100
ppm and has the highest pH= 7 of the solution
httpsdoiorg1033263BRIAC12113351351
httpsbiointerfaceresearchcom 1348
Given literature reports the kinetic of photocatalytic reaction can be calculated
according to
- ln (CCo) = kobs t (7)
where Co and C are the concentrations of dye at zero time and time t respectively and kobs are
the pseudo-first-order rate constant The rate constant kobs evaluated from the slope of the
straight line of plotting minusln(CC0) vs reaction time Figure 11-b showed a value of 01 min-1
Figure 11 (A) Photocatalytic degradation rate for 10 ppm Basic Red 18 over investigated CoFe2O4 samples at
pH = 7 dye solution without catalyst and in the presence of 3 mgL catalysts of (b) CoFes (c) CoFep and (d)
CoFeg (B) Pseudo first order photocatalysis for 10 ppm Basic Red 18 dye over 3mgl CoFeg at pH = 7
351 Mechanism of photocatalysis
The major oxidative species in the photocatalytic progression are positive holes (h+VB)
and the OH- hydroxyl radical formed during the irradiation process In the present work the
trapping experiments were used to determine which one of these species is active for organic
degradation
Figure 12 Effect of additives on the photocatalytic degradation rate of 10 ppm Basic Red 18 over 3
mgL FeCog at pH = 7 (a) Without additive (b) Isopropyl alcohol (c) EDTA
EDTA-2Na and isopropyl alcohol were used as an H+ and isopropyl alcohol as an OH
scavenger respectively [32] The results showed that the additive of isopropyl alcohol slightly
changed the dye degradation indicating that OH radicals were minor factors in the
photocatalytic degradation process whereas the addition of h+ capture (EDTA-2Na) caused a
great decrease in the degradation efficiency as shown in Figure 12 This foundation distinctly
denoted that positive holes are the major active species of dye dissociation
httpsdoiorg1033263BRIAC12113351351
httpsbiointerfaceresearchcom 1349
4 Conclusions
Nanosized cobalt ferrite (CoFe2O4) particles are synthesized through three different
methods (sol-gel solid-state blending and co-precipitation) The proposed preparations are
inexpensive and thus appropriate for the large-scale production of such type nanoparticles
XRD approves the formation of a spinel phase in all preparation methods The FT-IR spectra
displayed two characteristic metal-oxygen vibrational bands for the spinel structure The results
reveal that the synthetic route affected each particle size morphological structure surface
textures surface acidic properties cation distribution optical and magnetic properties Both
Fe3+and Co2+ are distributed in octahedral and tetrahedral sites in a ratio depending on the
preparation method The variation in this ratio controlled the studied properties The results
showed that the prepared ferrite exhibits either ferromagnetic or super-paramagnetic behavior
with magnetic parameters of particular importance for allowing the magnetic recovery and
reuse of the catalyst and the possibility to be used in recording media Ammonia TPD analyses
showed that weak acid sites prevail medium-strength sites whereas the number of strong acid
sites is the least The obtained ferrite is utilized as photocatalytic for degradation Basic Red 18
(BR 18) dye under visible light irradiation with the highest degradation rate for the sample
prepared by the gel method The prepared ferrite photocatalysts can potentially be used for
cleaning polluted water with the help of magnetic separation
Funding
This research received no external funding
Acknowledgments
The authors declare no acknowledgments
Conflicts of Interest
The authors declare no conflict of interest
References
1 Gratiet A L Amora M D Duocastella M Marongiu R Bendand A Giordani S Bianchini P
Diaspro A Zebrafish structural development in Mueller-matrix scanning microscopy J Scien Repor 2019
9 19974-19984
2 Prabhakaran T Mangalaraja RV Denardin JC Jimenez JA The effect of calcination temperature on
the structural and magnetic properties of co-precipitated CoFe2O4 nanoparticles J Alloys Compd 2017 716
171ndash183
3 Safi R Ghasemi A Shoja-Razavi R Factors controlling magnetic properties of CoFe2O4 nanoparticles
synthesized by chemical co-precipitation Modeling and optimization using response surface methodology
Ceram Int 2016 42 15818ndash15825
4 Vileacutem B David S Štepaacuten H Švecovaacute M Pavel U Ondrej J Synthesis and Properties of Nanosized
Stoichiometric Cobalt Ferrite Spinel Materials 2018 11 1241
5 Jalalian M Mirkazemi SM Alamolhoda S Phase constituents and magnetic properties of the CoFe2O4
nanoparticles prepared by polyvinylpyrrolidone (PVP)-assisted hydrothermal route Appl Phys 2016 A 122
835
6 Liu M Lu M Wang L Xu SC Zhao JL Li HB Mossbauer study on the magnetic properties and
cation distribution of CoFe2O4 nanoparticles synthesized by hydrothermal method J Mater Sci 2016 51
5487ndash5492
httpsdoiorg1033263BRIAC12113351351
httpsbiointerfaceresearchcom 1350
7 Mishra S Sahoo SS Debnath AK Muthe KP Dasb N P Cobalt ferrite nanoparticles prepared by
microwave hydrothermal synthesis and adsorption efficiency for organic dyes Isotherms thermodynamics
and kinetic studies J Advan Powde Techno 2020 31 11 4552-4562
8 Ikram S Arshad M I Mahmood K Alia A Amin N Structural magnetic and dielectric study of La3+
substituted Cu08Cd02Fe2O4 ferrite nanoparticles synthesized by the co-precipitation method J
AlloyCompo 2018 15 1019-1025
9 Yadava R S Kuřitka I Vilcakova J Havlica J Kalina L Urbaacutenek P Machovsky M Skoda D
Masař M Holek M Sonochemical synthesis of Gd3+ doped CoFe2O4 spinel ferrite nanoparticles and its
physical properties J Ultraso Sonochem 2018 40 773-783
10 Samoila P Cojocaru C Sacarescu L Dorneanu PP Domocos A-A Aurelian Rotaruca Remarkable
catalytic properties of rare-earth doped nickel ferrites synthesized by sol-gel auto-combustion with maleic
acid as fuel for CWPO of dyes J Appl Catal 2017 B 202 21ndash32
11 Babu KR Rao KR Babu B R Cu2+-modified physical properties of Cobalt-Nickel ferrite J Magn
Magn Mater 2017 434 118ndash125
12 Torkian S Ghasemi A Razavi R S Cation distribution and magnetic analysis of wideband microwave
absorptive CoxNi1minusxFe2O4 ferrites Ceram Int 2017 43 6987ndash6995
13 Alves T M L Amorim B F Torres MAM Bezerra CG Medeiros SN Gastelois P L Outon L
E F Macedo WAA Wasp-waisted behavior in magnetic hysteresis curves of CoFe2O4 nanopowder at a
low temperature experimental evidence and theoretical approach RSC Adv 2017 7 22187
14 Annie VP Immaculate NMG Mahalakshmi K Ansel ML Jerome DS Study on Cobalt Ferrite
Nanoparticles Synthesized by Co-Precipitation Technique for Photo-Fenton Application Mech Mater Sci
Eng 2017 9 110-115
15 Baldini A Petrecca M Sangregorio C Tamburini UA Magnetic properties of bulk nanocrystalline
cobalt ferrite obtained by high-pressure field assisted sintering J Phys D Appl Phys 2021 54 194006
16 Bhagwat VR Khedkar MV Kulkarni G Kharat PB Jadhav KM Dextrose assisted sol-gel auto
combustion synthesis and magnetic characterizations of cobalt ferrite nanoparticles J AIP Confere Proceed
2020 2265 030085 httpsdoiorg10106350017310
17 Gupta M Das A Mohapatra S Das D Datta A Surfactant based synthesis and magnetic studies of
cobalt ferrite J Appli Phys A 2020 126 660
18 Swatsitang E Phokha S Hunpratub S Usher B Bootchanont A Maensiri S Chindaprasirt P
Characterization and magnetic properties of cobalt ferrite nanoparticles J Alloy Compo 2016 664 15 792-
797
19 Allaedini G Tasirin S M Aminayi P Magnetic properties of cobalt ferrite synthesized by hydrothermal
method J Inter Nano Letter 2015 5 183ndash186
20 Najeehah C Z Chaudhary K T Ali J Synthesis and Characterization of Cobalt Ferrite Nanoparticles via
Sol-Gel Auto Combustion Method J Soli Stat Phenom 2020 307 58-63
21 Ateia1 EE Abdelatif G Soliman FS Optimizing the physical properties of calcium nano ferrites to be
suitable in many applications J Mater Sci Mater Elect 2017 28 5846ndash5851
22 Mazrouei A Saidi A Microstructure and magnetic properties of cobalt ferrite nano powder prepared by
solution combustion synthesis J Mater Chem Phys 2018 209 152-158
23 Purnama B Wijayanta AT Suharyana Effect of calcination temperature on structural and magnetic
properties in cobalt ferrite nano particles J King Saud Univ Sci 2019 31 956-960
24 Rao KS Choudaryb GSVRK Rao KH Sujatha Ch Structural and Magnetic properties of Ultrafine
CoFe2O4 J Nanoparticles J Proc Mater Sci 2015 10 19-27
25 Kurian M Thankachan S Nair DS Aswathy EK Babu A Thomas A Krishna K T B Structural
magnetic and acidic properties of cobalt ferrite nanoparticles synthesised by wet chemical methods J Adv
Ceram 2015 4 199-205
26 Kovacheva D Ruskov T Krystev P Asenov S Tanev N Moumlnch I Koseva R Wolff U Gemming
T Markova-Velichkova Nihtianova D Arndt Synthesis and characterization of magnetic nano-sized
Fe3O4 and CoFe2O4 J Bulg Chem Commun 2012 44 90-97
27 George T Sunny A T Varghese T Magnetic properties of cobalt ferrite nanoparticles synthesized by sol-
gel method Mater Sci and Eng 2015 73 012050 httpsdoiorg1010881757-899X731012050
httpsdoiorg1033263BRIAC12113351351
httpsbiointerfaceresearchcom 1351
28 Reddy M P Mohamed AMA Zhou XB Duc S Huang Q A facile hydrothermal synthesis
characterization and magnetic properties of mesoporous CoFe2O4 nanospheres J Magn Magnet Mater
2015 38840-44
29 Panchal NR Jotania RB Cobalt ferrite nano particles by microemulsion route J Nanotech Nanosci
2010 1 17-18
30 Naik M M Vinuth M Karthik K Suresha B Nagaraju G Sujatha H R Photocatalytic degradation
of dyes by cobalt ferrite nanoparticles synthesized by sol-gel method J AIP Conferen Proceed 2020 2274
040004 httpsdoiorg10106350022559
31 Andhare DD Patade SR Kounsalye JS Jadhav KM Effect of Zn doping on structural magnetic and
optical properties of cobalt ferrite nanoparticles synthesized via Co-precipitation method J Physica B
Conden Matte 2020 583 15 412051
32 Muthukumaran T Philip J Synthesis of water dispersible phosphate capped CoFe2O4 nanoparticles and
its applications in efficient organic dye removal J Collo Surf A Physicochem Engine Aspec 2021 5
125755
33 Sharma I Madara S R Sharma P Study of Tauc gap optical density and penetration depth of vacuum
evaporated Pb15Se85minusxGex (x = 0 3 6 at ) thin films supported by chemical bond approach and physical
parameters J MateToday 2020 28 2 402-407
34 Schrader B Infrared and Raman Spectroscopy Methods and Applications VCH Weinheim Germany 1995
100 807
35 Wanga F Mab Y Zhang H Gu J Yin J Jia X Zhang H Wang Y Fu X Yu R Wang Z Han
S Wang G Rheological properties and sedimentation stability of magnetorheological fluid based on multi-
walled carbon nanotubescobalt ferrite nanocomposites J Molec Liqu 2021 324 15 115103
36 Gil A F Benavides O Vargas S M May L De LaC Carachure C P Synthesis and Characterization
of Cobalt Ferrite CoxFe3-xO4 Nanoparticles by Raman Spectroscopy and X-Ray Diffraction Int J Meta Met
Phys 2020 5 047
37 Omiddezyani S Gharehkhani S Asli V Y Khazaee I Ashjaee M Nayebi R Shemirani F
Houshfar E Experimental investigation on thermo-physical properties and heat transfer characteristics of
green synthesized highly stable CoFe2O4rGO nanofluid J Collo Surf A Physicochemi Engin Aspec 2021
610 5 125923
38 Monisha P Dharshini PP Gomathi SS Pushpanathan K Ferro to super-paramagnetic transition
Outcome of Ni doping in polyethylene glycol capped CoFe2O4 nanoparticles J Alloy Comp 2021 856 5
157447
39 Revathi J JohnAbel M Archana V Sumithra T Thiruneelakandan R Prince JJ Synthesis and
characterization of CoFe2O4 and Ni-doped CoFe2O4 nanoparticles by chemical Co-precipitation technique for
photo-degradation of organic dyestuffs under direct sunlight 2020 587 15 412136
40 Mmelesi O K Masunga N Kuvarega A Nkambule TTI Mamba B B Kefenia KK Photocatalytic
antimicrobial activity and toxicity in water treatment J Mate Scien Semicond Proce 2021 123 1 105523
httpsdoiorg1033263BRIAC12113351351
httpsbiointerfaceresearchcom 1337
23 Characterization methods
XRD analysis was performed on a Philips X Pert Pro Super diffractometer with Cu Kα
radiation (λ=154 Aring) Electron microscope analysis was done by SEM and TEM electron
microscopy model JEOL JEM-100CXII and JEOL-2010 respectively The FT-IR spectra of
the specimens were obtained by employing a Brucker-FT-IR in the range of 4000-400 cm-1 A
U-1000 laser Raman Spectrometer with 5145 nm line of an ArC laser was used to determine
Raman spectra Optical absorption was measured by employing Cary 5G equipment at
wavelengths ranging from 200 to 1000 nm The photoluminescence (PL) studies were made
using a 225 nm excitation wavelength source Traditional surface area and textural surface
properties were studied using the BET - N2 gas adsorption technique The electron binding
energies for the elements were determined using a PHI-5702 multifunctional spectrometer with
AlKα radiation (XPS) The magnetic properties of the prepared samples were studied using the
vibrating sample magnetometer model (VSM-9600M-1 USA) in a maximum applied field of
10 kOe
A programable ammonia desorption technique (TPD-NH3) was used to determine the
type and the amount of acidity in the studied samples This is performed in a reactor filled with
04 g of the sample which was previously activated at 250 for 3 hours with N2 flow The
sample was then permitted to expose to NH3 at room temperature for one hour The overflow
of NH3 was swill out of the reactor with N2 flow The temperature was then elevated linearly
at a rate of 10 min to liberate NH3 gas from the sample at a temperature interval of 100
up to 500 The liberated NH3 is allowed to flow through a known large amount of H2SO4
solution Finally the amount of acid was determined by back titration with NaOH solution
using MO indicator
24 Photocatalytic study
Basic Red 18 (BR 18) dye was selected as an ideal system for a catalytic reaction
because of its intense color in an aqueous medium and low biodegradability due to the existence
of benzene rings The photocatalytic degradation of Basic Red 18 (BR 18) dye over ferrite
nanoparticles was performed in a photoreactor with a total capacity of 05 L The illumination
source was a UV-C lamp (200-980 nm 9 W Philips) put in the internal quartz tube of the
photoreactor The impact of ferrite dosage on Basic Red 18 (BR 18) dye oxidation was
examined using a dose of 0-005 gl The photocatalytic study was investigated at a pH range
of 2-9 and initial dye concentration in the range of 50-200 ppm The solution pH was regulated
using NaOH or HCl Specimens were removed from the arrangement at specific periods and
centrifuged and the concentration in the supernatant dye solution was then analyzed using UV-
vis Spectrophotometer (a Cary 5G equipment)
3 Results and Discussion
31 Characterizations
XRD patterns of the prepared CoFe2O4 ferrites are shown in Figure 1 All the ferrite
samples showed diffraction peaks at 2θ values 316deg 370deg 441deg 554deg 591deg and 651deg
attributed to the reflection planes of (220) (311) (400) (422) (511) and (440) respectively
of the spinel crystal structure (JCPDS 22-1086) No other peaks are observed for all specimens
indicating the purity of the ferrites There is a slight shift of (311) peak towards lower angle
httpsdoiorg1033263BRIAC12113351351
httpsbiointerfaceresearchcom 1338
side in the order CoFesgt CoFep gt CoFeg The average lattice constant (a) for the (311) plane
was determined using equation (1) [8] and the results obtained are listed in Table 1
a = radicℎ2 + 1198962 + 1198972 2 sinθ (1)
where h k l are miller indices It is noted that the lattice constant follows the order CoFes gt
CoFep gt CoFeg This may be attributed to a certain number of Co2+ ions (078 Aring) transfer from
octahedral sites accompanied by the opposite migration of an equivalent number of Fe3+ ions
(0645 Aring) from tetrahedral to octahedral sites to relax the compressive strain The average
crystallite sizes (DXRD) of the investigated samples were calculated (based on 3 different peaks)
from the widening of reflection peaks using the Scherrer formula [7]
DXRD = 09 λ β cosθ (2)
where λ is the X-ray wavelength and β is the half peak width of the diffraction peak in radiant
The results are listed in Table 1 and found to lie in the range of 21 ndash 33 nm The average X-ray
density (ρx) of the cobalt ferrite nanoparticles was determined using the following equation
ρx = 8MNa3 (3)
Where M is the molecular weight of cobalt ferrite N is Avogadros number The results
are also listed in Table 1
Figure 1 XRD of CoFe2O4 samples (a) CoFes (b) CoFeg and (c) CoFep
Table 1 Lattice constant density particle size values and FT-IR data of the studied CoFe2O4 samples
Sample Lattice
constant(Aring)
X-ray
density
(gcm3)
XRD-
particle
size
(nm)
TEM-
Particle
size
(nm)
Tetrahedral
vibration
(cm-1)
Octahedral
Vibration
(cmminus)
OH-
group
δH-O-H
bonding
CoFeg 8387 5282 21 23 563 402 3428 1640
CoFep 8392 5267 31 28 579 413 3432 1625
CoFes 8412 5235 36 39 581 428 3439 1635
httpsdoiorg1033263BRIAC12113351351
httpsbiointerfaceresearchcom 1339
The formation of the CoFe2O4 spinel structure was also supported by infrared spectra
shown in Figure 2 The spectra of all samples demonstrate two specific bands for spinel
structure ν1 in the range 581ndash563 cmminus1 relates to Mtetr -O vibration at the tetrahedral site and
ν2 in the range 428ndash402 cmminus1 attributed to Mocta -O vibration at the octahedral sites [9-11] The
mean feature bands observed are recorded in Table 1 The variation in the band positions is due
to the difference in the metalndashO distances for the octahedral and tetrahedral complexes
referring to a change in cation distribution in the spinel structure by changing the preparation
method These results strongly support the results of XRD data The broad bands focused at
1640-1625 cmminus1 are appointed to the δ H-O-H bonding mode of the adsorbed water [12]
Figure 2 FT-IR of CoFe2O4 samples (a) CoFep (b) CoFes (c) CoFeg
The SEM and TEM micrographs of the as-synthesized CoFe2O4 particles are given in
Figure 3 (A and B) As seen depending on the preparation method the nanoparticles have been
developed in different orders and clusters
Figure 3 (A) SEM and (B) TEM of (a) CoFes (b) CoFep and (c) CoFeg
(B) (A)
httpsdoiorg1033263BRIAC12113351351
httpsbiointerfaceresearchcom 1340
SEM and TEM images of CoFes show morphology nanoparticles predominated by
nanorods structure The other cobalt ferrite specimens CoFep and CoFeg demonstrates
aggregated spherical particles besides particles with polygon morphologies The variation in
the morphology of the NPS shown in Figure 2b denotes that the crystal growth of CoFe2O4
depends largely on the preparation method The nanoparticle sizes were obtained using
histograms of 100 particles observed in the TEM image are listed in Table 1 The slight contrast
found in the results of XRD and TEM is due to the different handles of the two tools TEM
analysis offers a number-average size distribution XRD manifests a volume-averaged median
size In XRD the correctness of Scherrers formula is influenced by numerous variables for
example diffraction line width and surface tension Thus Scherrers equation might cause
particular errors in determining the fixed value of the crystallite size [7]
XPS results of the CoFe2O4 samples are given in Figure 4 where binding energy (BE)
ranges from 0 to 1200 eV The spectra show that the samples contain only the main elements
Fe Co and O besides the contaminated C element coming from the environment The binding
energy (BE) values obtained attached well with the literature data for CoFe2O4 Table 2 [13]
proving that pure ferrite had been produced
Figure 4 XPS of (a) CoFes (b) CoFep (c) CoFeg
a)
b)
c)
Binding energy
(eV)
httpsdoiorg1033263BRIAC12113351351
httpsbiointerfaceresearchcom 1341
Figure 5 High-resolution XPS of CoFeg sample
Table 2 XPS results of the investigated CoFe2O4 samples
Sample Spectrum BE(eV) Assignment Atomic Particle
Size (nm)
CoFes
Co 2p32
7803 Octahedral Co2+ 48
36
7821 tetrahedral Co2+ 52
785 satellite peak of Co2+ -
Fe 2p32
711 octahedral Fe3+ 76
7135 tetrahedral Fe3+ 24
717 Satellite peak Fe3+ -
O 1s
52985 CoFe2O 73
5315 CoFe2O4 16
534 Artifact 11
CoFep
Co 2p32
780 Octahedral Co2+ 55
31
7819 tetrahedral Co2+ 45
7855 satellite peak of Co2+ -
Fe 2p32
7105 octahedral Fe3+ 725
7132 tetrahedral Fe3+ 275
7167 Satellite peak Fe3+ -
O 1s
5297 CoFe2O4 80
5315 CoFe2O4 12
5345 Artifact 8
CoFeg
Co 2p32
7799 Octahedral Co2+ 63
21
7816 tetrahedral Co2+ 37
7844 Octahedral Co2+ -
Fe 2p32
7109 octahedral Fe3+ 685
7131 tetrahedral Fe3+ 315
7171 Satellite peak Fe3+ -
O 1s
5299 CoFe2O4 78
5315 CoFe2O4 13
5345 Artifact 9
To investigate the cation valence states and their distribution in the CoFe2O4 spinel the
high-resolution XPS spectra of Fe 2p Co 2p and O1s peaks of the CoFe2O4 specimen were
studied and given for CoFeg in Figure 5 The integrated intensities of the fitted peaks of Co2+
and Fe3+ ions were used to determine their distributions in both octahedral and tetrahedral
positions The table also shows an increase in the concentration of Fe3+ cations on octahedral
sites with the increase in the particle size of the sample which agrees well with XRD data In
conclusion it can be said that the selection of the preparation route is effective in controlling
the cation distribution within the spinel lattice The presence of high intense satellite structure
on the high binding energy side of the Co 2p32 and Fe 2p32 might be attributed to the band
structure related to octahedral Co 2p in the oxide lattice
32 Magnetic study
To investigate the effect of the synthetic method on the magnetic properties the VSM
test was done at room temperature in an applied field of 10 kOe The results are represented in
httpsdoiorg1033263BRIAC12113351351
httpsbiointerfaceresearchcom 1342
Figure 6 which shows hysteresis loops referring to the ferromagnetic nature of all samples
The M(H) curves also show a linear part at higher magnetic fields signifying a meaningful
paramagnetic contribution to the magnetization The saturation magnetizations (Ms) are
evaluated by extrapolating the plots of M vs 1H employing data at high magnetic fields [14]
The magnetic parameters are extracted from M-H plots Figure 6 and listed in Table 3 The
coercivity (Hc) remanent magnetization (Mr) are extracted from M-H plots (Figure 6) and listed
with the saturation magnetizations (Ms) and the squareness values of the hysteresis loops for
all specimens in Table 3 The small values of the coercivity (Hc) of CoFe2O4 nanoparticles
denote that the studied samples lie near the super-paramagnetic limit
Figure 6 Magnetic hysteresis of investigated samples (a) CoFeg (b) CoFep (c) CoFes
For the ideal inverse spinel crystal structure of CoFe2O4 with all the Co2+ ions located
at the octahedral site the magnetization per formula unit can be theoretically evaluated using
Neels two sublattice model by considering the difference of total magnetic moments in
octahedral and tetrahedral sites [15-18] M=Moctahedral ndash Mtetrahedral The magnetic moment of
Fe3+ and Co2+ cations are 50 and 38 microB respectively the theoretical magnetic moment of
CoFe2O4 is 38 microB per formula unit Based on the cation distribution obtained from XPS the
magnetization per formula unit was also calculated and listed in Table 3 which shows that the
magnetic moments change with the preparation methods The magnetic moment values of the
investigated samples can also be determined experimentally by the following equation in Bohr
magneton
microB = MolwttimesMs5585 (4)
However the evaluated data from XPS and VSM are not equal which can be associated
with the finite size of nanoparticles conducting to the noncollinearity of magnetic moments on
the surface of the nanoparticles The disordered moments are developed due to the broken
exchange bonds at the outer layer On the other hand the competition antiferromagnetic
interactions precede a noncollinear arrangement of magnetic moments within interstitial
sublattices induced by the non-equilibrium cation distribution among tetrahedral and
octahedral sites [151718] Shifting of larger Co2+ (078 Aring) to substitute the smaller Fe3+ (0645
Aring) cations in octahedral sites produce strains on the surface due to the smaller space between
the octahedral site cations comparable to the tetrahedral site cations in nanoparticles The
strains obtained can break the surface exchange bonds which cause the canted spin structure
This type of tetrahedral-octahedral interaction points to lower magnetization values in the
ferrite nanoparticles than the bulk CoFe2O4 [17] The low Ms-value of the investigate ferrite
httpsdoiorg1033263BRIAC12113351351
httpsbiointerfaceresearchcom 1343
samples compared with that of the bulk one (809 emug) [3] can also be explained based on
the core-shell model which clarifies that the finite-size effects of the nanoparticles manage to
canting or non-collinearity of spins on their surface in that way reducing magnetization [16]
To sum up it can be said that the change in saturation magnetization with the variation
in the preparation methods is possibly due to the rearrangement of the cation distribution ie
the exchange of Co2+ and Fe3+ ions from octahedral and tetrahedral sites and vice versa The
low values of Ms for the investigated samples could be credited to surface distortion which
destabilizes the collinear spin arrangement and producing various canted spin structures at the
surface This effect is especially noticeable for ultrafine particles owing to their large surface-
to-volume ratio The reduction in coercivity with increasing particle size could be accredited
to the combination of surface anisotropy and thermal energies [19]
The values of the squareness ratio (MrMs) of investigated samples shown in Table 3
are below 05 refers to that these samples are multidomain and the particles interact by
magnetostatic interaction [20]
The magnetic anisotropy (K) has also been calculated using the following relation [21]
Hc = 098 KMs (5)
and the results obtained showed high values of 16711 13571 and 6181 emuOeg-1 for CoFep
CoFeg and CoFes respectively The increase in K value is going parallel with increasing the
presence of Co2+ ions in the octahedral sites as shown in XPS results (Table 2)
The effect of the preparation method on the magnetic parameters of our CoFe2O4
nanoparticles is compared with other methods present in the literature and listed in Table 4
Table 4 Effect of the preparation methods on magnetic parameters of CoFe2O4 nanoparticles
Preparation
method Particle Size (nm) Ms (emug) Mr (emug) Hc(Oe) Reference
Green
Co-precipitation
ceramic
combustion
Co-precipitation
Sol-gel
Co-precipitation
Co-precipitation
Sol-gel
hydrothermal
Microemulsion
21
31
36
33
32
55
42
21
18
120
28
380
431
466
316
356
424
27
104
30
60
158
101
125
369
96
13
89
87
10
10
23
0612
370
360
130
870
614
434
500
30
100
150
1357
Present work
Present work
Present work
[22]
[23]
[24]
[25]
[26]
[27]
[28]
[29]
33 Surface properties
The surface properties of the spinels investigated were studied using the BET technique
The isothermal N2 adsorption-desorption plots of these samples Figure 7 can be classified as
type IV for CoFep and type V for CoFeg and CoFes according to IUPAC which is characteristic
of the mesoporous material in which the adsorption proceeds via multilayer adsorption
followed by capillary condensation The hysteresis loops show the type H3 (aggregates of
platelike particles forming slit-shaped pores) for all samples The studied samples textural
properties including BET-surface area average pore diameter pore-volume and pore size
distribution calculated from BJH method are derived from N2 nitrogen adsorptiondesorption
isotherms and listed in Table 5 The data obtained refer to that the surface properties depend
largely on the method of preparation and CoFeg exhibits the highest surface area
httpsdoiorg1033263BRIAC12113351351
httpsbiointerfaceresearchcom 1344
Figure 7 Nitrogen adsorption-desorption isotherms of investigated samples (a) CoFeg (b) CoFep (c) CoFes
Table 5 Textural surface data obtained from BET measurements for CoFe2O4 samples
Samples Particle size dXRD
(nm) Vst (mlg) Vp (mlg) Vm (mlg)
SBET
(m2gm) r (Aring)
CoFes 36 62 009 6 25 98
CoFep 31 138 021 10 45 89
CoFeg 21 261 040 32 99 73
34 Optical properties
The prepared CoFe2O4 nanoparticles show still high magnetization that photocatalyst
appropriate for magnetically separable by a magnetic field and separation of photocatalyst from
solution Thus the photocatalytic activity of the investigated samples has been studied The
optical absorption property related to the electronic structure characteristic is documented as
the main factor in deciding the photocatalytic activity [30] The diffuse reflectance spectra of
our ferrites were recorded and converted to the Kubelka-Munk function K-M Figure 8 using
the following equation
K-M= (1minusR)2 2R (6)
Where R is absolute reflectance the results obtained are listed in Figure 8A The spectra
show that all synthesized CoFe2O4 samples exhibited photo-absorption in the visible light
httpsdoiorg1033263BRIAC12113351351
httpsbiointerfaceresearchcom 1345
region which implies the probability of high photocatalytic efficiency of these materials under
visible light The absorption behavior in the visible region is originated from the electronic
charge transformation of Co2+ and Fe3+ to their conduction level in the conduction band [7 31
32] The CoFe2O4 stoichiometry is organized in an incompletely inverse structure [27] with
the Co2+ ion at both tetrahedral and octahedral sites as shown in our results (XRD XPS and
magnetic data)
Figure 8 (A) UVndashvis spectra presented as the Kubelka-Munk function for CoFe2O4 nanoparticles (B)
Taucs plots for CoFe2O4 nanoparticles
Broad CondashO and FendashO charge transfers together with dndashd electron moves of Co2+ and
Fe3+ in numerous coordination guarantee the full absorption of the visible spectrum The
bandgap energies of the investigated ferrites were estimated according to Taucs [33] by
plotting (KM hν)1n versus hν where h is a Plancks constant n is the light frequency and n
is a constant relating to a mode of transition ( n = frac12 for allowed direct transition and n= 2 for
indirect transition) Taucs plots shown in Figure 8-b for every one of the specimens
demonstrated that the band-to-band direct transitions are more inclined to happen than the
indirect transitions The optical energy gaps Eg obtained from the intercept of the plot with
the X-axis are recorded in Table 6 from which it can be seen that Eg value decreases with
increasing the particle size and showed the smallest value for CoFeg sample
0
00005
0001
00015
0002
CoFes
CoFep
C0Feg
K-M
Wavelehgth (nm)
(A)
0
001
002
003
004
005
006
007
008
15 175 2 225 25 275 3
CoFes
CoFep
CoFeg
Energy (eV)
(K-M
E
)2
(B)
httpsdoiorg1033263BRIAC12113351351
httpsbiointerfaceresearchcom 1346
Table 6 Optical and surface acidity data of CoFe2O4 samples Table 6 Optical and surface acidity data
of CoFe2O4 samples
Samples Particle
size (nm)
λmax
(nm)
Eg
(eV)
Surface
Acidity sites
Weak
(mmolg)
Surface Acidity
sites medium
(mmolg)
Surface
Acidity sites
Strong
(mmolg)
Surface
Acidity
Total
sites
(mmolg)
Bulk --- 790 20 - - - -
CoFes 36 590 139 75 55 30 160
CoFep 31 610 138 60 41 21 132
CoFeg 21 620 137 110 61 40 211
341 Raman spectroscopy
Raman spectra were used to acquire a vision of the vibrational energy states within the
spinel ferrite and review the structural characteristics and compositional regularity throughout
the samples [34] The spinel ferrite exhibit five active Raman vibration modes [3536] The
Raman spectra of our samples showed only three bands due to peak overlapping at 284-297
cm-1 460-470 cm-1 and 640-650 cm-1 as shown in Figure 9 which was assigned as Eg 3T2g
and A1g (1) respectively [37] The A1g (1) band is related to symmetric stretching vibration
mode at the tetrahedral (A) site While A1g (1) band might be related to the vibration of Co-O
bonds at the tetrahedral (A) site The results obtained in Figure 9 show that the frequency of
Raman modes of the investigated spinels is slightly changed with the preparation method This
could be attributed to the variation in the cation distribution in the spinel lattice as mentioned
above
Figure 9 Raman spectra of investigated samples (a) CoFeg (b) CoFep (c) CoFes
342 Photoluminescence study
Photoluminescence (PL) spectroscopy is an outstanding procedure to get valuable
information concerning energy and the dynamics of charge carriers yielded during the exposure
of light The photoluminescence of the ferrite nanoparticles was studied using a 225 nm
excitation wavelength source and the results obtained are presented in Figure 10 The spectra
of all samples show broad visible emission peaks at 434 - 442 nm which are attributed to the
charge transport between Co2+ at tetrahedral sites and Fe3+ at octahedral sites that are
surrounded by O2- ions [38] The variation in the position and the intensity of luminescence
can be explained on the basis that the PL-spectra are sensitive to the character of nanoparticles
surface due to the existence of gap surface disorders developing from surface non-
stoichiometry and unsaturated bonds The defects produced in the nanomaterial lattice during
preparation are the base of luminescent properties [39] The emission intensity of CoFeg is
httpsdoiorg1033263BRIAC12113351351
httpsbiointerfaceresearchcom 1347
lower than that of the rest samples This indicates that this sample acted as traps for the photo-
induced charge carriers These outcomes confirm the previously mentioned results on the
influence of the preparation methods on the surface and optical properties
Figure 10 Photolumiscence spectra of investigated samples (a) CoFep (b) CoFes (c) CoFeg
343 Surface acidity
Temperature-programmed desorption of ammonia (TPD-NH3) is an appropriate
procedure for measuring the quantity and the spreading of the acid sites on the surface of our
samples The acid site distribution results for the studied samples are summarized in Table 6
The ammonia desorbed at 100 oC contains some physisorbed ammonia as well as overstating
the proportion of weak acid sites Whereas the ammonia desorbed at 220 ndash 370 oC and that at
450-600 oC are attributed to medium and strong acid sites respectively [40] The results
obtained show that the acidity varies with preparation methods For all samples the strength of
acidic sites follows the order Weak acid sites gt medium sites gt strong acid sites CoFeg exhibits
the highest total acidity than that of other samples
35 Photocatalytic activity of CoFe2O4 samples
According to the above-mentioned optical properties we studied the photocatalytic
activity of the investigated CoFe2O4 nanoparticles under visible light irradiation using the
degradation of Basic Red 18 (BR 18) aqueous solution as a basic dye model Before the
irradiation process the suspended solution of the dye and catalyst was stored in the dark for 45
min to assurance adsorptiondesorption equilibrium The photocatalytic degradation results are
illustrated in Figure 11 From which it can be seen that the degradation of the dye is very slow
in the absence of the catalyst and the CoFeg sample showed the highest photocatalytic
efficiency due to the high optical absorptions in vis The light region with lower bandgap
energy and a larger surface area Therefore this sample was selected to test the impact of
catalyst dosage dye concentration and pH of the solution on the dye degradation rate The
results obtained given in Fig 11 show that the rate of dye degradation has the highest rate at 3
mgL catalyst dosage and decreases with increasing dye concentration in the range of 10 -100
ppm and has the highest pH= 7 of the solution
httpsdoiorg1033263BRIAC12113351351
httpsbiointerfaceresearchcom 1348
Given literature reports the kinetic of photocatalytic reaction can be calculated
according to
- ln (CCo) = kobs t (7)
where Co and C are the concentrations of dye at zero time and time t respectively and kobs are
the pseudo-first-order rate constant The rate constant kobs evaluated from the slope of the
straight line of plotting minusln(CC0) vs reaction time Figure 11-b showed a value of 01 min-1
Figure 11 (A) Photocatalytic degradation rate for 10 ppm Basic Red 18 over investigated CoFe2O4 samples at
pH = 7 dye solution without catalyst and in the presence of 3 mgL catalysts of (b) CoFes (c) CoFep and (d)
CoFeg (B) Pseudo first order photocatalysis for 10 ppm Basic Red 18 dye over 3mgl CoFeg at pH = 7
351 Mechanism of photocatalysis
The major oxidative species in the photocatalytic progression are positive holes (h+VB)
and the OH- hydroxyl radical formed during the irradiation process In the present work the
trapping experiments were used to determine which one of these species is active for organic
degradation
Figure 12 Effect of additives on the photocatalytic degradation rate of 10 ppm Basic Red 18 over 3
mgL FeCog at pH = 7 (a) Without additive (b) Isopropyl alcohol (c) EDTA
EDTA-2Na and isopropyl alcohol were used as an H+ and isopropyl alcohol as an OH
scavenger respectively [32] The results showed that the additive of isopropyl alcohol slightly
changed the dye degradation indicating that OH radicals were minor factors in the
photocatalytic degradation process whereas the addition of h+ capture (EDTA-2Na) caused a
great decrease in the degradation efficiency as shown in Figure 12 This foundation distinctly
denoted that positive holes are the major active species of dye dissociation
httpsdoiorg1033263BRIAC12113351351
httpsbiointerfaceresearchcom 1349
4 Conclusions
Nanosized cobalt ferrite (CoFe2O4) particles are synthesized through three different
methods (sol-gel solid-state blending and co-precipitation) The proposed preparations are
inexpensive and thus appropriate for the large-scale production of such type nanoparticles
XRD approves the formation of a spinel phase in all preparation methods The FT-IR spectra
displayed two characteristic metal-oxygen vibrational bands for the spinel structure The results
reveal that the synthetic route affected each particle size morphological structure surface
textures surface acidic properties cation distribution optical and magnetic properties Both
Fe3+and Co2+ are distributed in octahedral and tetrahedral sites in a ratio depending on the
preparation method The variation in this ratio controlled the studied properties The results
showed that the prepared ferrite exhibits either ferromagnetic or super-paramagnetic behavior
with magnetic parameters of particular importance for allowing the magnetic recovery and
reuse of the catalyst and the possibility to be used in recording media Ammonia TPD analyses
showed that weak acid sites prevail medium-strength sites whereas the number of strong acid
sites is the least The obtained ferrite is utilized as photocatalytic for degradation Basic Red 18
(BR 18) dye under visible light irradiation with the highest degradation rate for the sample
prepared by the gel method The prepared ferrite photocatalysts can potentially be used for
cleaning polluted water with the help of magnetic separation
Funding
This research received no external funding
Acknowledgments
The authors declare no acknowledgments
Conflicts of Interest
The authors declare no conflict of interest
References
1 Gratiet A L Amora M D Duocastella M Marongiu R Bendand A Giordani S Bianchini P
Diaspro A Zebrafish structural development in Mueller-matrix scanning microscopy J Scien Repor 2019
9 19974-19984
2 Prabhakaran T Mangalaraja RV Denardin JC Jimenez JA The effect of calcination temperature on
the structural and magnetic properties of co-precipitated CoFe2O4 nanoparticles J Alloys Compd 2017 716
171ndash183
3 Safi R Ghasemi A Shoja-Razavi R Factors controlling magnetic properties of CoFe2O4 nanoparticles
synthesized by chemical co-precipitation Modeling and optimization using response surface methodology
Ceram Int 2016 42 15818ndash15825
4 Vileacutem B David S Štepaacuten H Švecovaacute M Pavel U Ondrej J Synthesis and Properties of Nanosized
Stoichiometric Cobalt Ferrite Spinel Materials 2018 11 1241
5 Jalalian M Mirkazemi SM Alamolhoda S Phase constituents and magnetic properties of the CoFe2O4
nanoparticles prepared by polyvinylpyrrolidone (PVP)-assisted hydrothermal route Appl Phys 2016 A 122
835
6 Liu M Lu M Wang L Xu SC Zhao JL Li HB Mossbauer study on the magnetic properties and
cation distribution of CoFe2O4 nanoparticles synthesized by hydrothermal method J Mater Sci 2016 51
5487ndash5492
httpsdoiorg1033263BRIAC12113351351
httpsbiointerfaceresearchcom 1350
7 Mishra S Sahoo SS Debnath AK Muthe KP Dasb N P Cobalt ferrite nanoparticles prepared by
microwave hydrothermal synthesis and adsorption efficiency for organic dyes Isotherms thermodynamics
and kinetic studies J Advan Powde Techno 2020 31 11 4552-4562
8 Ikram S Arshad M I Mahmood K Alia A Amin N Structural magnetic and dielectric study of La3+
substituted Cu08Cd02Fe2O4 ferrite nanoparticles synthesized by the co-precipitation method J
AlloyCompo 2018 15 1019-1025
9 Yadava R S Kuřitka I Vilcakova J Havlica J Kalina L Urbaacutenek P Machovsky M Skoda D
Masař M Holek M Sonochemical synthesis of Gd3+ doped CoFe2O4 spinel ferrite nanoparticles and its
physical properties J Ultraso Sonochem 2018 40 773-783
10 Samoila P Cojocaru C Sacarescu L Dorneanu PP Domocos A-A Aurelian Rotaruca Remarkable
catalytic properties of rare-earth doped nickel ferrites synthesized by sol-gel auto-combustion with maleic
acid as fuel for CWPO of dyes J Appl Catal 2017 B 202 21ndash32
11 Babu KR Rao KR Babu B R Cu2+-modified physical properties of Cobalt-Nickel ferrite J Magn
Magn Mater 2017 434 118ndash125
12 Torkian S Ghasemi A Razavi R S Cation distribution and magnetic analysis of wideband microwave
absorptive CoxNi1minusxFe2O4 ferrites Ceram Int 2017 43 6987ndash6995
13 Alves T M L Amorim B F Torres MAM Bezerra CG Medeiros SN Gastelois P L Outon L
E F Macedo WAA Wasp-waisted behavior in magnetic hysteresis curves of CoFe2O4 nanopowder at a
low temperature experimental evidence and theoretical approach RSC Adv 2017 7 22187
14 Annie VP Immaculate NMG Mahalakshmi K Ansel ML Jerome DS Study on Cobalt Ferrite
Nanoparticles Synthesized by Co-Precipitation Technique for Photo-Fenton Application Mech Mater Sci
Eng 2017 9 110-115
15 Baldini A Petrecca M Sangregorio C Tamburini UA Magnetic properties of bulk nanocrystalline
cobalt ferrite obtained by high-pressure field assisted sintering J Phys D Appl Phys 2021 54 194006
16 Bhagwat VR Khedkar MV Kulkarni G Kharat PB Jadhav KM Dextrose assisted sol-gel auto
combustion synthesis and magnetic characterizations of cobalt ferrite nanoparticles J AIP Confere Proceed
2020 2265 030085 httpsdoiorg10106350017310
17 Gupta M Das A Mohapatra S Das D Datta A Surfactant based synthesis and magnetic studies of
cobalt ferrite J Appli Phys A 2020 126 660
18 Swatsitang E Phokha S Hunpratub S Usher B Bootchanont A Maensiri S Chindaprasirt P
Characterization and magnetic properties of cobalt ferrite nanoparticles J Alloy Compo 2016 664 15 792-
797
19 Allaedini G Tasirin S M Aminayi P Magnetic properties of cobalt ferrite synthesized by hydrothermal
method J Inter Nano Letter 2015 5 183ndash186
20 Najeehah C Z Chaudhary K T Ali J Synthesis and Characterization of Cobalt Ferrite Nanoparticles via
Sol-Gel Auto Combustion Method J Soli Stat Phenom 2020 307 58-63
21 Ateia1 EE Abdelatif G Soliman FS Optimizing the physical properties of calcium nano ferrites to be
suitable in many applications J Mater Sci Mater Elect 2017 28 5846ndash5851
22 Mazrouei A Saidi A Microstructure and magnetic properties of cobalt ferrite nano powder prepared by
solution combustion synthesis J Mater Chem Phys 2018 209 152-158
23 Purnama B Wijayanta AT Suharyana Effect of calcination temperature on structural and magnetic
properties in cobalt ferrite nano particles J King Saud Univ Sci 2019 31 956-960
24 Rao KS Choudaryb GSVRK Rao KH Sujatha Ch Structural and Magnetic properties of Ultrafine
CoFe2O4 J Nanoparticles J Proc Mater Sci 2015 10 19-27
25 Kurian M Thankachan S Nair DS Aswathy EK Babu A Thomas A Krishna K T B Structural
magnetic and acidic properties of cobalt ferrite nanoparticles synthesised by wet chemical methods J Adv
Ceram 2015 4 199-205
26 Kovacheva D Ruskov T Krystev P Asenov S Tanev N Moumlnch I Koseva R Wolff U Gemming
T Markova-Velichkova Nihtianova D Arndt Synthesis and characterization of magnetic nano-sized
Fe3O4 and CoFe2O4 J Bulg Chem Commun 2012 44 90-97
27 George T Sunny A T Varghese T Magnetic properties of cobalt ferrite nanoparticles synthesized by sol-
gel method Mater Sci and Eng 2015 73 012050 httpsdoiorg1010881757-899X731012050
httpsdoiorg1033263BRIAC12113351351
httpsbiointerfaceresearchcom 1351
28 Reddy M P Mohamed AMA Zhou XB Duc S Huang Q A facile hydrothermal synthesis
characterization and magnetic properties of mesoporous CoFe2O4 nanospheres J Magn Magnet Mater
2015 38840-44
29 Panchal NR Jotania RB Cobalt ferrite nano particles by microemulsion route J Nanotech Nanosci
2010 1 17-18
30 Naik M M Vinuth M Karthik K Suresha B Nagaraju G Sujatha H R Photocatalytic degradation
of dyes by cobalt ferrite nanoparticles synthesized by sol-gel method J AIP Conferen Proceed 2020 2274
040004 httpsdoiorg10106350022559
31 Andhare DD Patade SR Kounsalye JS Jadhav KM Effect of Zn doping on structural magnetic and
optical properties of cobalt ferrite nanoparticles synthesized via Co-precipitation method J Physica B
Conden Matte 2020 583 15 412051
32 Muthukumaran T Philip J Synthesis of water dispersible phosphate capped CoFe2O4 nanoparticles and
its applications in efficient organic dye removal J Collo Surf A Physicochem Engine Aspec 2021 5
125755
33 Sharma I Madara S R Sharma P Study of Tauc gap optical density and penetration depth of vacuum
evaporated Pb15Se85minusxGex (x = 0 3 6 at ) thin films supported by chemical bond approach and physical
parameters J MateToday 2020 28 2 402-407
34 Schrader B Infrared and Raman Spectroscopy Methods and Applications VCH Weinheim Germany 1995
100 807
35 Wanga F Mab Y Zhang H Gu J Yin J Jia X Zhang H Wang Y Fu X Yu R Wang Z Han
S Wang G Rheological properties and sedimentation stability of magnetorheological fluid based on multi-
walled carbon nanotubescobalt ferrite nanocomposites J Molec Liqu 2021 324 15 115103
36 Gil A F Benavides O Vargas S M May L De LaC Carachure C P Synthesis and Characterization
of Cobalt Ferrite CoxFe3-xO4 Nanoparticles by Raman Spectroscopy and X-Ray Diffraction Int J Meta Met
Phys 2020 5 047
37 Omiddezyani S Gharehkhani S Asli V Y Khazaee I Ashjaee M Nayebi R Shemirani F
Houshfar E Experimental investigation on thermo-physical properties and heat transfer characteristics of
green synthesized highly stable CoFe2O4rGO nanofluid J Collo Surf A Physicochemi Engin Aspec 2021
610 5 125923
38 Monisha P Dharshini PP Gomathi SS Pushpanathan K Ferro to super-paramagnetic transition
Outcome of Ni doping in polyethylene glycol capped CoFe2O4 nanoparticles J Alloy Comp 2021 856 5
157447
39 Revathi J JohnAbel M Archana V Sumithra T Thiruneelakandan R Prince JJ Synthesis and
characterization of CoFe2O4 and Ni-doped CoFe2O4 nanoparticles by chemical Co-precipitation technique for
photo-degradation of organic dyestuffs under direct sunlight 2020 587 15 412136
40 Mmelesi O K Masunga N Kuvarega A Nkambule TTI Mamba B B Kefenia KK Photocatalytic
antimicrobial activity and toxicity in water treatment J Mate Scien Semicond Proce 2021 123 1 105523

httpsdoiorg1033263BRIAC12113351351
httpsbiointerfaceresearchcom 1342
Figure 6 which shows hysteresis loops referring to the ferromagnetic nature of all samples
The M(H) curves also show a linear part at higher magnetic fields signifying a meaningful
paramagnetic contribution to the magnetization The saturation magnetizations (Ms) are
evaluated by extrapolating the plots of M vs 1H employing data at high magnetic fields [14]
The magnetic parameters are extracted from M-H plots Figure 6 and listed in Table 3 The
coercivity (Hc) remanent magnetization (Mr) are extracted from M-H plots (Figure 6) and listed
with the saturation magnetizations (Ms) and the squareness values of the hysteresis loops for
all specimens in Table 3 The small values of the coercivity (Hc) of CoFe2O4 nanoparticles
denote that the studied samples lie near the super-paramagnetic limit
Figure 6 Magnetic hysteresis of investigated samples (a) CoFeg (b) CoFep (c) CoFes
For the ideal inverse spinel crystal structure of CoFe2O4 with all the Co2+ ions located
at the octahedral site the magnetization per formula unit can be theoretically evaluated using
Neels two sublattice model by considering the difference of total magnetic moments in
octahedral and tetrahedral sites [15-18] M=Moctahedral ndash Mtetrahedral The magnetic moment of
Fe3+ and Co2+ cations are 50 and 38 microB respectively the theoretical magnetic moment of
CoFe2O4 is 38 microB per formula unit Based on the cation distribution obtained from XPS the
magnetization per formula unit was also calculated and listed in Table 3 which shows that the
magnetic moments change with the preparation methods The magnetic moment values of the
investigated samples can also be determined experimentally by the following equation in Bohr
magneton
microB = MolwttimesMs5585 (4)
However the evaluated data from XPS and VSM are not equal which can be associated
with the finite size of nanoparticles conducting to the noncollinearity of magnetic moments on
the surface of the nanoparticles The disordered moments are developed due to the broken
exchange bonds at the outer layer On the other hand the competition antiferromagnetic
interactions precede a noncollinear arrangement of magnetic moments within interstitial
sublattices induced by the non-equilibrium cation distribution among tetrahedral and
octahedral sites [151718] Shifting of larger Co2+ (078 Aring) to substitute the smaller Fe3+ (0645
Aring) cations in octahedral sites produce strains on the surface due to the smaller space between
the octahedral site cations comparable to the tetrahedral site cations in nanoparticles The
strains obtained can break the surface exchange bonds which cause the canted spin structure
This type of tetrahedral-octahedral interaction points to lower magnetization values in the
ferrite nanoparticles than the bulk CoFe2O4 [17] The low Ms-value of the investigate ferrite
httpsdoiorg1033263BRIAC12113351351
httpsbiointerfaceresearchcom 1343
samples compared with that of the bulk one (809 emug) [3] can also be explained based on
the core-shell model which clarifies that the finite-size effects of the nanoparticles manage to
canting or non-collinearity of spins on their surface in that way reducing magnetization [16]
To sum up it can be said that the change in saturation magnetization with the variation
in the preparation methods is possibly due to the rearrangement of the cation distribution ie
the exchange of Co2+ and Fe3+ ions from octahedral and tetrahedral sites and vice versa The
low values of Ms for the investigated samples could be credited to surface distortion which
destabilizes the collinear spin arrangement and producing various canted spin structures at the
surface This effect is especially noticeable for ultrafine particles owing to their large surface-
to-volume ratio The reduction in coercivity with increasing particle size could be accredited
to the combination of surface anisotropy and thermal energies [19]
The values of the squareness ratio (MrMs) of investigated samples shown in Table 3
are below 05 refers to that these samples are multidomain and the particles interact by
magnetostatic interaction [20]
The magnetic anisotropy (K) has also been calculated using the following relation [21]
Hc = 098 KMs (5)
and the results obtained showed high values of 16711 13571 and 6181 emuOeg-1 for CoFep
CoFeg and CoFes respectively The increase in K value is going parallel with increasing the
presence of Co2+ ions in the octahedral sites as shown in XPS results (Table 2)
The effect of the preparation method on the magnetic parameters of our CoFe2O4
nanoparticles is compared with other methods present in the literature and listed in Table 4
Table 4 Effect of the preparation methods on magnetic parameters of CoFe2O4 nanoparticles
Preparation
method Particle Size (nm) Ms (emug) Mr (emug) Hc(Oe) Reference
Green
Co-precipitation
ceramic
combustion
Co-precipitation
Sol-gel
Co-precipitation
Co-precipitation
Sol-gel
hydrothermal
Microemulsion
21
31
36
33
32
55
42
21
18
120
28
380
431
466
316
356
424
27
104
30
60
158
101
125
369
96
13
89
87
10
10
23
0612
370
360
130
870
614
434
500
30
100
150
1357
Present work
Present work
Present work
[22]
[23]
[24]
[25]
[26]
[27]
[28]
[29]
33 Surface properties
The surface properties of the spinels investigated were studied using the BET technique
The isothermal N2 adsorption-desorption plots of these samples Figure 7 can be classified as
type IV for CoFep and type V for CoFeg and CoFes according to IUPAC which is characteristic
of the mesoporous material in which the adsorption proceeds via multilayer adsorption
followed by capillary condensation The hysteresis loops show the type H3 (aggregates of
platelike particles forming slit-shaped pores) for all samples The studied samples textural
properties including BET-surface area average pore diameter pore-volume and pore size
distribution calculated from BJH method are derived from N2 nitrogen adsorptiondesorption
isotherms and listed in Table 5 The data obtained refer to that the surface properties depend
largely on the method of preparation and CoFeg exhibits the highest surface area
httpsdoiorg1033263BRIAC12113351351
httpsbiointerfaceresearchcom 1344
Figure 7 Nitrogen adsorption-desorption isotherms of investigated samples (a) CoFeg (b) CoFep (c) CoFes
Table 5 Textural surface data obtained from BET measurements for CoFe2O4 samples
Samples Particle size dXRD
(nm) Vst (mlg) Vp (mlg) Vm (mlg)
SBET
(m2gm) r (Aring)
CoFes 36 62 009 6 25 98
CoFep 31 138 021 10 45 89
CoFeg 21 261 040 32 99 73
34 Optical properties
The prepared CoFe2O4 nanoparticles show still high magnetization that photocatalyst
appropriate for magnetically separable by a magnetic field and separation of photocatalyst from
solution Thus the photocatalytic activity of the investigated samples has been studied The
optical absorption property related to the electronic structure characteristic is documented as
the main factor in deciding the photocatalytic activity [30] The diffuse reflectance spectra of
our ferrites were recorded and converted to the Kubelka-Munk function K-M Figure 8 using
the following equation
K-M= (1minusR)2 2R (6)
Where R is absolute reflectance the results obtained are listed in Figure 8A The spectra
show that all synthesized CoFe2O4 samples exhibited photo-absorption in the visible light
httpsdoiorg1033263BRIAC12113351351
httpsbiointerfaceresearchcom 1345
region which implies the probability of high photocatalytic efficiency of these materials under
visible light The absorption behavior in the visible region is originated from the electronic
charge transformation of Co2+ and Fe3+ to their conduction level in the conduction band [7 31
32] The CoFe2O4 stoichiometry is organized in an incompletely inverse structure [27] with
the Co2+ ion at both tetrahedral and octahedral sites as shown in our results (XRD XPS and
magnetic data)
Figure 8 (A) UVndashvis spectra presented as the Kubelka-Munk function for CoFe2O4 nanoparticles (B)
Taucs plots for CoFe2O4 nanoparticles
Broad CondashO and FendashO charge transfers together with dndashd electron moves of Co2+ and
Fe3+ in numerous coordination guarantee the full absorption of the visible spectrum The
bandgap energies of the investigated ferrites were estimated according to Taucs [33] by
plotting (KM hν)1n versus hν where h is a Plancks constant n is the light frequency and n
is a constant relating to a mode of transition ( n = frac12 for allowed direct transition and n= 2 for
indirect transition) Taucs plots shown in Figure 8-b for every one of the specimens
demonstrated that the band-to-band direct transitions are more inclined to happen than the
indirect transitions The optical energy gaps Eg obtained from the intercept of the plot with
the X-axis are recorded in Table 6 from which it can be seen that Eg value decreases with
increasing the particle size and showed the smallest value for CoFeg sample
0
00005
0001
00015
0002
CoFes
CoFep
C0Feg
K-M
Wavelehgth (nm)
(A)
0
001
002
003
004
005
006
007
008
15 175 2 225 25 275 3
CoFes
CoFep
CoFeg
Energy (eV)
(K-M
E
)2
(B)
httpsdoiorg1033263BRIAC12113351351
httpsbiointerfaceresearchcom 1346
Table 6 Optical and surface acidity data of CoFe2O4 samples Table 6 Optical and surface acidity data
of CoFe2O4 samples
Samples Particle
size (nm)
λmax
(nm)
Eg
(eV)
Surface
Acidity sites
Weak
(mmolg)
Surface Acidity
sites medium
(mmolg)
Surface
Acidity sites
Strong
(mmolg)
Surface
Acidity
Total
sites
(mmolg)
Bulk --- 790 20 - - - -
CoFes 36 590 139 75 55 30 160
CoFep 31 610 138 60 41 21 132
CoFeg 21 620 137 110 61 40 211
341 Raman spectroscopy
Raman spectra were used to acquire a vision of the vibrational energy states within the
spinel ferrite and review the structural characteristics and compositional regularity throughout
the samples [34] The spinel ferrite exhibit five active Raman vibration modes [3536] The
Raman spectra of our samples showed only three bands due to peak overlapping at 284-297
cm-1 460-470 cm-1 and 640-650 cm-1 as shown in Figure 9 which was assigned as Eg 3T2g
and A1g (1) respectively [37] The A1g (1) band is related to symmetric stretching vibration
mode at the tetrahedral (A) site While A1g (1) band might be related to the vibration of Co-O
bonds at the tetrahedral (A) site The results obtained in Figure 9 show that the frequency of
Raman modes of the investigated spinels is slightly changed with the preparation method This
could be attributed to the variation in the cation distribution in the spinel lattice as mentioned
above
Figure 9 Raman spectra of investigated samples (a) CoFeg (b) CoFep (c) CoFes
342 Photoluminescence study
Photoluminescence (PL) spectroscopy is an outstanding procedure to get valuable
information concerning energy and the dynamics of charge carriers yielded during the exposure
of light The photoluminescence of the ferrite nanoparticles was studied using a 225 nm
excitation wavelength source and the results obtained are presented in Figure 10 The spectra
of all samples show broad visible emission peaks at 434 - 442 nm which are attributed to the
charge transport between Co2+ at tetrahedral sites and Fe3+ at octahedral sites that are
surrounded by O2- ions [38] The variation in the position and the intensity of luminescence
can be explained on the basis that the PL-spectra are sensitive to the character of nanoparticles
surface due to the existence of gap surface disorders developing from surface non-
stoichiometry and unsaturated bonds The defects produced in the nanomaterial lattice during
preparation are the base of luminescent properties [39] The emission intensity of CoFeg is
httpsdoiorg1033263BRIAC12113351351
httpsbiointerfaceresearchcom 1347
lower than that of the rest samples This indicates that this sample acted as traps for the photo-
induced charge carriers These outcomes confirm the previously mentioned results on the
influence of the preparation methods on the surface and optical properties
Figure 10 Photolumiscence spectra of investigated samples (a) CoFep (b) CoFes (c) CoFeg
343 Surface acidity
Temperature-programmed desorption of ammonia (TPD-NH3) is an appropriate
procedure for measuring the quantity and the spreading of the acid sites on the surface of our
samples The acid site distribution results for the studied samples are summarized in Table 6
The ammonia desorbed at 100 oC contains some physisorbed ammonia as well as overstating
the proportion of weak acid sites Whereas the ammonia desorbed at 220 ndash 370 oC and that at
450-600 oC are attributed to medium and strong acid sites respectively [40] The results
obtained show that the acidity varies with preparation methods For all samples the strength of
acidic sites follows the order Weak acid sites gt medium sites gt strong acid sites CoFeg exhibits
the highest total acidity than that of other samples
35 Photocatalytic activity of CoFe2O4 samples
According to the above-mentioned optical properties we studied the photocatalytic
activity of the investigated CoFe2O4 nanoparticles under visible light irradiation using the
degradation of Basic Red 18 (BR 18) aqueous solution as a basic dye model Before the
irradiation process the suspended solution of the dye and catalyst was stored in the dark for 45
min to assurance adsorptiondesorption equilibrium The photocatalytic degradation results are
illustrated in Figure 11 From which it can be seen that the degradation of the dye is very slow
in the absence of the catalyst and the CoFeg sample showed the highest photocatalytic
efficiency due to the high optical absorptions in vis The light region with lower bandgap
energy and a larger surface area Therefore this sample was selected to test the impact of
catalyst dosage dye concentration and pH of the solution on the dye degradation rate The
results obtained given in Fig 11 show that the rate of dye degradation has the highest rate at 3
mgL catalyst dosage and decreases with increasing dye concentration in the range of 10 -100
ppm and has the highest pH= 7 of the solution
httpsdoiorg1033263BRIAC12113351351
httpsbiointerfaceresearchcom 1348
Given literature reports the kinetic of photocatalytic reaction can be calculated
according to
- ln (CCo) = kobs t (7)
where Co and C are the concentrations of dye at zero time and time t respectively and kobs are
the pseudo-first-order rate constant The rate constant kobs evaluated from the slope of the
straight line of plotting minusln(CC0) vs reaction time Figure 11-b showed a value of 01 min-1
Figure 11 (A) Photocatalytic degradation rate for 10 ppm Basic Red 18 over investigated CoFe2O4 samples at
pH = 7 dye solution without catalyst and in the presence of 3 mgL catalysts of (b) CoFes (c) CoFep and (d)
CoFeg (B) Pseudo first order photocatalysis for 10 ppm Basic Red 18 dye over 3mgl CoFeg at pH = 7
351 Mechanism of photocatalysis
The major oxidative species in the photocatalytic progression are positive holes (h+VB)
and the OH- hydroxyl radical formed during the irradiation process In the present work the
trapping experiments were used to determine which one of these species is active for organic
degradation
Figure 12 Effect of additives on the photocatalytic degradation rate of 10 ppm Basic Red 18 over 3
mgL FeCog at pH = 7 (a) Without additive (b) Isopropyl alcohol (c) EDTA
EDTA-2Na and isopropyl alcohol were used as an H+ and isopropyl alcohol as an OH
scavenger respectively [32] The results showed that the additive of isopropyl alcohol slightly
changed the dye degradation indicating that OH radicals were minor factors in the
photocatalytic degradation process whereas the addition of h+ capture (EDTA-2Na) caused a
great decrease in the degradation efficiency as shown in Figure 12 This foundation distinctly
denoted that positive holes are the major active species of dye dissociation
httpsdoiorg1033263BRIAC12113351351
httpsbiointerfaceresearchcom 1349
4 Conclusions
Nanosized cobalt ferrite (CoFe2O4) particles are synthesized through three different
methods (sol-gel solid-state blending and co-precipitation) The proposed preparations are
inexpensive and thus appropriate for the large-scale production of such type nanoparticles
XRD approves the formation of a spinel phase in all preparation methods The FT-IR spectra
displayed two characteristic metal-oxygen vibrational bands for the spinel structure The results
reveal that the synthetic route affected each particle size morphological structure surface
textures surface acidic properties cation distribution optical and magnetic properties Both
Fe3+and Co2+ are distributed in octahedral and tetrahedral sites in a ratio depending on the
preparation method The variation in this ratio controlled the studied properties The results
showed that the prepared ferrite exhibits either ferromagnetic or super-paramagnetic behavior
with magnetic parameters of particular importance for allowing the magnetic recovery and
reuse of the catalyst and the possibility to be used in recording media Ammonia TPD analyses
showed that weak acid sites prevail medium-strength sites whereas the number of strong acid
sites is the least The obtained ferrite is utilized as photocatalytic for degradation Basic Red 18
(BR 18) dye under visible light irradiation with the highest degradation rate for the sample
prepared by the gel method The prepared ferrite photocatalysts can potentially be used for
cleaning polluted water with the help of magnetic separation
Funding
This research received no external funding
Acknowledgments
The authors declare no acknowledgments
Conflicts of Interest
The authors declare no conflict of interest
References
1 Gratiet A L Amora M D Duocastella M Marongiu R Bendand A Giordani S Bianchini P
Diaspro A Zebrafish structural development in Mueller-matrix scanning microscopy J Scien Repor 2019
9 19974-19984
2 Prabhakaran T Mangalaraja RV Denardin JC Jimenez JA The effect of calcination temperature on
the structural and magnetic properties of co-precipitated CoFe2O4 nanoparticles J Alloys Compd 2017 716
171ndash183
3 Safi R Ghasemi A Shoja-Razavi R Factors controlling magnetic properties of CoFe2O4 nanoparticles
synthesized by chemical co-precipitation Modeling and optimization using response surface methodology
Ceram Int 2016 42 15818ndash15825
4 Vileacutem B David S Štepaacuten H Švecovaacute M Pavel U Ondrej J Synthesis and Properties of Nanosized
Stoichiometric Cobalt Ferrite Spinel Materials 2018 11 1241
5 Jalalian M Mirkazemi SM Alamolhoda S Phase constituents and magnetic properties of the CoFe2O4
nanoparticles prepared by polyvinylpyrrolidone (PVP)-assisted hydrothermal route Appl Phys 2016 A 122
835
6 Liu M Lu M Wang L Xu SC Zhao JL Li HB Mossbauer study on the magnetic properties and
cation distribution of CoFe2O4 nanoparticles synthesized by hydrothermal method J Mater Sci 2016 51
5487ndash5492
httpsdoiorg1033263BRIAC12113351351
httpsbiointerfaceresearchcom 1350
7 Mishra S Sahoo SS Debnath AK Muthe KP Dasb N P Cobalt ferrite nanoparticles prepared by
microwave hydrothermal synthesis and adsorption efficiency for organic dyes Isotherms thermodynamics
and kinetic studies J Advan Powde Techno 2020 31 11 4552-4562
8 Ikram S Arshad M I Mahmood K Alia A Amin N Structural magnetic and dielectric study of La3+
substituted Cu08Cd02Fe2O4 ferrite nanoparticles synthesized by the co-precipitation method J
AlloyCompo 2018 15 1019-1025
9 Yadava R S Kuřitka I Vilcakova J Havlica J Kalina L Urbaacutenek P Machovsky M Skoda D
Masař M Holek M Sonochemical synthesis of Gd3+ doped CoFe2O4 spinel ferrite nanoparticles and its
physical properties J Ultraso Sonochem 2018 40 773-783
10 Samoila P Cojocaru C Sacarescu L Dorneanu PP Domocos A-A Aurelian Rotaruca Remarkable
catalytic properties of rare-earth doped nickel ferrites synthesized by sol-gel auto-combustion with maleic
acid as fuel for CWPO of dyes J Appl Catal 2017 B 202 21ndash32
11 Babu KR Rao KR Babu B R Cu2+-modified physical properties of Cobalt-Nickel ferrite J Magn
Magn Mater 2017 434 118ndash125
12 Torkian S Ghasemi A Razavi R S Cation distribution and magnetic analysis of wideband microwave
absorptive CoxNi1minusxFe2O4 ferrites Ceram Int 2017 43 6987ndash6995
13 Alves T M L Amorim B F Torres MAM Bezerra CG Medeiros SN Gastelois P L Outon L
E F Macedo WAA Wasp-waisted behavior in magnetic hysteresis curves of CoFe2O4 nanopowder at a
low temperature experimental evidence and theoretical approach RSC Adv 2017 7 22187
14 Annie VP Immaculate NMG Mahalakshmi K Ansel ML Jerome DS Study on Cobalt Ferrite
Nanoparticles Synthesized by Co-Precipitation Technique for Photo-Fenton Application Mech Mater Sci
Eng 2017 9 110-115
15 Baldini A Petrecca M Sangregorio C Tamburini UA Magnetic properties of bulk nanocrystalline
cobalt ferrite obtained by high-pressure field assisted sintering J Phys D Appl Phys 2021 54 194006
16 Bhagwat VR Khedkar MV Kulkarni G Kharat PB Jadhav KM Dextrose assisted sol-gel auto
combustion synthesis and magnetic characterizations of cobalt ferrite nanoparticles J AIP Confere Proceed
2020 2265 030085 httpsdoiorg10106350017310
17 Gupta M Das A Mohapatra S Das D Datta A Surfactant based synthesis and magnetic studies of
cobalt ferrite J Appli Phys A 2020 126 660
18 Swatsitang E Phokha S Hunpratub S Usher B Bootchanont A Maensiri S Chindaprasirt P
Characterization and magnetic properties of cobalt ferrite nanoparticles J Alloy Compo 2016 664 15 792-
797
19 Allaedini G Tasirin S M Aminayi P Magnetic properties of cobalt ferrite synthesized by hydrothermal
method J Inter Nano Letter 2015 5 183ndash186
20 Najeehah C Z Chaudhary K T Ali J Synthesis and Characterization of Cobalt Ferrite Nanoparticles via
Sol-Gel Auto Combustion Method J Soli Stat Phenom 2020 307 58-63
21 Ateia1 EE Abdelatif G Soliman FS Optimizing the physical properties of calcium nano ferrites to be
suitable in many applications J Mater Sci Mater Elect 2017 28 5846ndash5851
22 Mazrouei A Saidi A Microstructure and magnetic properties of cobalt ferrite nano powder prepared by
solution combustion synthesis J Mater Chem Phys 2018 209 152-158
23 Purnama B Wijayanta AT Suharyana Effect of calcination temperature on structural and magnetic
properties in cobalt ferrite nano particles J King Saud Univ Sci 2019 31 956-960
24 Rao KS Choudaryb GSVRK Rao KH Sujatha Ch Structural and Magnetic properties of Ultrafine
CoFe2O4 J Nanoparticles J Proc Mater Sci 2015 10 19-27
25 Kurian M Thankachan S Nair DS Aswathy EK Babu A Thomas A Krishna K T B Structural
magnetic and acidic properties of cobalt ferrite nanoparticles synthesised by wet chemical methods J Adv
Ceram 2015 4 199-205
26 Kovacheva D Ruskov T Krystev P Asenov S Tanev N Moumlnch I Koseva R Wolff U Gemming
T Markova-Velichkova Nihtianova D Arndt Synthesis and characterization of magnetic nano-sized
Fe3O4 and CoFe2O4 J Bulg Chem Commun 2012 44 90-97
27 George T Sunny A T Varghese T Magnetic properties of cobalt ferrite nanoparticles synthesized by sol-
gel method Mater Sci and Eng 2015 73 012050 httpsdoiorg1010881757-899X731012050
httpsdoiorg1033263BRIAC12113351351
httpsbiointerfaceresearchcom 1351
28 Reddy M P Mohamed AMA Zhou XB Duc S Huang Q A facile hydrothermal synthesis
characterization and magnetic properties of mesoporous CoFe2O4 nanospheres J Magn Magnet Mater
2015 38840-44
29 Panchal NR Jotania RB Cobalt ferrite nano particles by microemulsion route J Nanotech Nanosci
2010 1 17-18
30 Naik M M Vinuth M Karthik K Suresha B Nagaraju G Sujatha H R Photocatalytic degradation
of dyes by cobalt ferrite nanoparticles synthesized by sol-gel method J AIP Conferen Proceed 2020 2274
040004 httpsdoiorg10106350022559
31 Andhare DD Patade SR Kounsalye JS Jadhav KM Effect of Zn doping on structural magnetic and
optical properties of cobalt ferrite nanoparticles synthesized via Co-precipitation method J Physica B
Conden Matte 2020 583 15 412051
32 Muthukumaran T Philip J Synthesis of water dispersible phosphate capped CoFe2O4 nanoparticles and
its applications in efficient organic dye removal J Collo Surf A Physicochem Engine Aspec 2021 5
125755
33 Sharma I Madara S R Sharma P Study of Tauc gap optical density and penetration depth of vacuum
evaporated Pb15Se85minusxGex (x = 0 3 6 at ) thin films supported by chemical bond approach and physical
parameters J MateToday 2020 28 2 402-407
34 Schrader B Infrared and Raman Spectroscopy Methods and Applications VCH Weinheim Germany 1995
100 807
35 Wanga F Mab Y Zhang H Gu J Yin J Jia X Zhang H Wang Y Fu X Yu R Wang Z Han
S Wang G Rheological properties and sedimentation stability of magnetorheological fluid based on multi-
walled carbon nanotubescobalt ferrite nanocomposites J Molec Liqu 2021 324 15 115103
36 Gil A F Benavides O Vargas S M May L De LaC Carachure C P Synthesis and Characterization
of Cobalt Ferrite CoxFe3-xO4 Nanoparticles by Raman Spectroscopy and X-Ray Diffraction Int J Meta Met
Phys 2020 5 047
37 Omiddezyani S Gharehkhani S Asli V Y Khazaee I Ashjaee M Nayebi R Shemirani F
Houshfar E Experimental investigation on thermo-physical properties and heat transfer characteristics of
green synthesized highly stable CoFe2O4rGO nanofluid J Collo Surf A Physicochemi Engin Aspec 2021
610 5 125923
38 Monisha P Dharshini PP Gomathi SS Pushpanathan K Ferro to super-paramagnetic transition
Outcome of Ni doping in polyethylene glycol capped CoFe2O4 nanoparticles J Alloy Comp 2021 856 5
157447
39 Revathi J JohnAbel M Archana V Sumithra T Thiruneelakandan R Prince JJ Synthesis and
characterization of CoFe2O4 and Ni-doped CoFe2O4 nanoparticles by chemical Co-precipitation technique for
photo-degradation of organic dyestuffs under direct sunlight 2020 587 15 412136
40 Mmelesi O K Masunga N Kuvarega A Nkambule TTI Mamba B B Kefenia KK Photocatalytic
antimicrobial activity and toxicity in water treatment J Mate Scien Semicond Proce 2021 123 1 105523
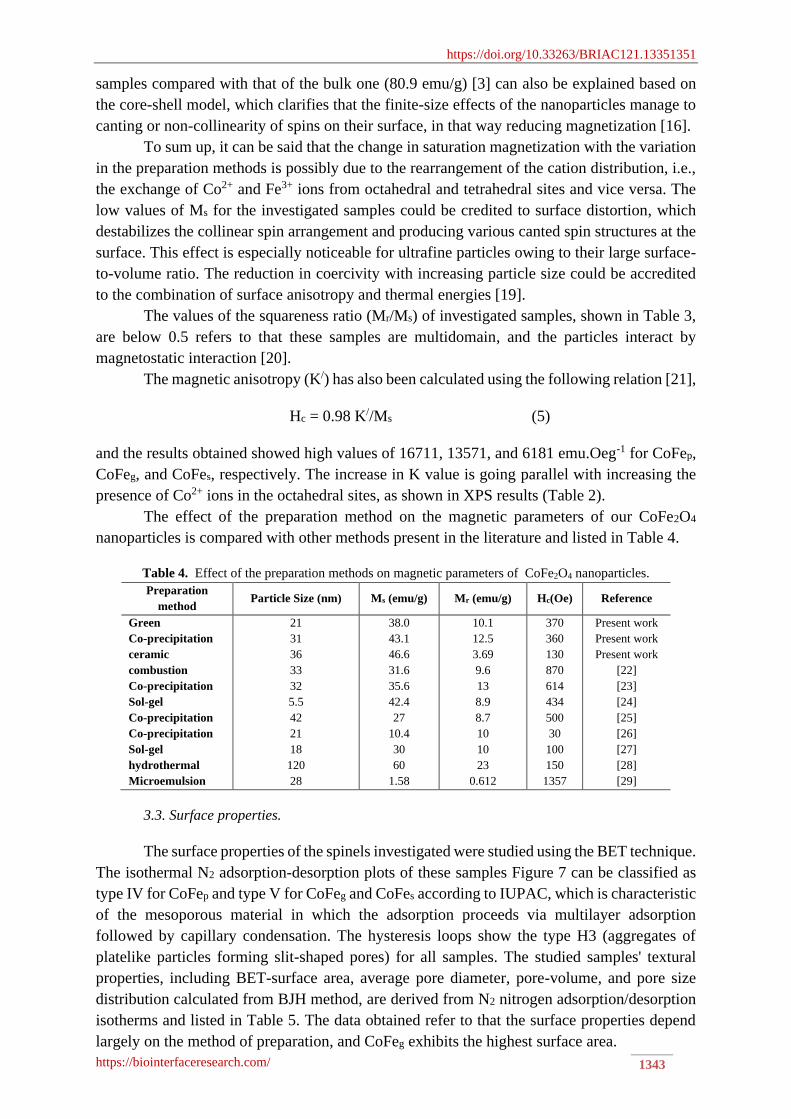
httpsdoiorg1033263BRIAC12113351351
httpsbiointerfaceresearchcom 1351
28 Reddy M P Mohamed AMA Zhou XB Duc S Huang Q A facile hydrothermal synthesis
characterization and magnetic properties of mesoporous CoFe2O4 nanospheres J Magn Magnet Mater
2015 38840-44
29 Panchal NR Jotania RB Cobalt ferrite nano particles by microemulsion route J Nanotech Nanosci
2010 1 17-18
30 Naik M M Vinuth M Karthik K Suresha B Nagaraju G Sujatha H R Photocatalytic degradation
of dyes by cobalt ferrite nanoparticles synthesized by sol-gel method J AIP Conferen Proceed 2020 2274
040004 httpsdoiorg10106350022559
31 Andhare DD Patade SR Kounsalye JS Jadhav KM Effect of Zn doping on structural magnetic and
optical properties of cobalt ferrite nanoparticles synthesized via Co-precipitation method J Physica B
Conden Matte 2020 583 15 412051
32 Muthukumaran T Philip J Synthesis of water dispersible phosphate capped CoFe2O4 nanoparticles and
its applications in efficient organic dye removal J Collo Surf A Physicochem Engine Aspec 2021 5
125755
33 Sharma I Madara S R Sharma P Study of Tauc gap optical density and penetration depth of vacuum
evaporated Pb15Se85minusxGex (x = 0 3 6 at ) thin films supported by chemical bond approach and physical
parameters J MateToday 2020 28 2 402-407
34 Schrader B Infrared and Raman Spectroscopy Methods and Applications VCH Weinheim Germany 1995
100 807
35 Wanga F Mab Y Zhang H Gu J Yin J Jia X Zhang H Wang Y Fu X Yu R Wang Z Han
S Wang G Rheological properties and sedimentation stability of magnetorheological fluid based on multi-
walled carbon nanotubescobalt ferrite nanocomposites J Molec Liqu 2021 324 15 115103
36 Gil A F Benavides O Vargas S M May L De LaC Carachure C P Synthesis and Characterization
of Cobalt Ferrite CoxFe3-xO4 Nanoparticles by Raman Spectroscopy and X-Ray Diffraction Int J Meta Met
Phys 2020 5 047
37 Omiddezyani S Gharehkhani S Asli V Y Khazaee I Ashjaee M Nayebi R Shemirani F
Houshfar E Experimental investigation on thermo-physical properties and heat transfer characteristics of
green synthesized highly stable CoFe2O4rGO nanofluid J Collo Surf A Physicochemi Engin Aspec 2021
610 5 125923
38 Monisha P Dharshini PP Gomathi SS Pushpanathan K Ferro to super-paramagnetic transition
Outcome of Ni doping in polyethylene glycol capped CoFe2O4 nanoparticles J Alloy Comp 2021 856 5
157447
39 Revathi J JohnAbel M Archana V Sumithra T Thiruneelakandan R Prince JJ Synthesis and
characterization of CoFe2O4 and Ni-doped CoFe2O4 nanoparticles by chemical Co-precipitation technique for
photo-degradation of organic dyestuffs under direct sunlight 2020 587 15 412136
40 Mmelesi O K Masunga N Kuvarega A Nkambule TTI Mamba B B Kefenia KK Photocatalytic
antimicrobial activity and toxicity in water treatment J Mate Scien Semicond Proce 2021 123 1 105523