
Structural Issues of Light-Harvesting Aggregates
16
molecules Article Limitations of Linear Dichroism Spectroscopy for Elucidating Structural Issues of Light-Harvesting Aggregates in Chlorosomes Lisa M. Günther 1 , Jasper Knoester 2 and Jürgen Köhler 1,3,4, * Citation: Günther, L.M.; Knoester, J.; Köhler, J. Limitations of Linear Dichroism Spectroscopy for Elucidating Structural Issues of Light-Harvesting Aggregates in Chlorosomes. Molecules 2021, 26, 899. https://doi.org/10.3390/ molecules26040899 Academic Editor: Leszek Fiedor Received: 22 December 2020 Accepted: 2 February 2021 Published: 9 February 2021 Publisher’s Note: MDPI stays neutral with regard to jurisdictional claims in published maps and institutional affil- iations. Copyright: © 2021 by the authors. Licensee MDPI, Basel, Switzerland. This article is an open access article distributed under the terms and conditions of the Creative Commons Attribution (CC BY) license (https:// creativecommons.org/licenses/by/ 4.0/). 1 Spectroscopy of Soft Matter, University of Bayreuth, Universitätsstr. 30, 95440 Bayreuth, Germany; [email protected] 2 University of Groningen, Zernike Institute for Advanced Materials, Nijenborgh 4, 9747 AG Groningen, The Netherlands; [email protected] 3 Bayreuth Institute for Macromolecular Research (BIMF), University of Bayreuth, Universitätsstr. 30, 95440 Bayreuth, Germany 4 Bavarian Polymer Institute, University of Bayreuth, Universitätsstr. 30, 95440 Bayreuth, Germany * Correspondence: [email protected] Abstract: Linear dichroism (LD) spectroscopy is a widely used technique for studying the mutual ori- entation of the transition-dipole moments of the electronically excited states of molecular aggregates. Often the method is applied to aggregates where detailed information about the geometrical arrange- ment of the monomers is lacking. However, for complex molecular assemblies where the monomers are assembled hierarchically in tiers of supramolecular structural elements, the method cannot extract well-founded information about the monomer arrangement. Here we discuss this difficulty on the example of chlorosomes, which are the light-harvesting aggregates of photosynthetic green-(non) sulfur bacteria. Chlorosomes consist of hundreds of thousands of bacteriochlorophyll molecules that self-assemble into secondary structural elements of curved lamellar or cylindrical morphology. We exploit data from polarization-resolved fluorescence-excitation spectroscopy performed on single chlorosomes for reconstructing the corresponding LD spectra. This reveals that LD spectroscopy is not suited for benchmarking structural models in particular for complex hierarchically organized molecular supramolecular assemblies. Keywords: linear dichroism; molecular aggregates; light harvesting; chlorosomes; photosynthesis 1. Introduction Green-(non-)sulfur bacteria [1,2] are known to grow photosynthetically under the low- est light conditions [3–5] owing to their highly efficient light-harvesting antenna, so-called chlorosomes. These are organelles enclosed by a monolipid envelope that accommodates hundreds of thousands of densely packed bacteriochlorophyll (BChl) c,d,e molecules, that are organized in self-assembling secondary structures featuring curved lamellar or cylindri- cal geometry [4,6,7]. In particular, natural chlorosomes contain mixtures of BChl homologs with modifications of the methylation status giving rise to a tremendous variety for the possible building blocks that are involved in the self-assembly process for the molecular aggregates within the chlorosomes [8,9]. Given the variations in size, shape, and the number of aggregates within a single chlorosome, it is not surprising that these molec- ular assemblies feature a large degree of structural heterogeneity. As a consequence of this, structure determination by high-resolution X-ray crystallography is not feasible, and chlorosomes have been investigated by various combinations of other techniques including atomic force microscopy [10–12], solid-state NMR [13,14], optical spectroscopy both on en- sembles [11,15–22], and single-chlorosomes [12,23–29], cryo-electron microscopy [4,30,31], and computational approaches [6,32–34]. Nevertheless, details about their structural orga- nization are still the subject of an ongoing debate. Molecules 2021, 26, 899. https://doi.org/10.3390/molecules26040899 https://www.mdpi.com/journal/molecules
Transcript of Structural Issues of Light-Harvesting Aggregates
molecules
Article
Limitations of Linear Dichroism Spectroscopy for ElucidatingStructural Issues of Light-Harvesting Aggregatesin Chlorosomes
Lisa M. Günther 1 , Jasper Knoester 2 and Jürgen Köhler 1,3,4,*
�����������������
Citation: Günther, L.M.; Knoester, J.;
Köhler, J. Limitations of Linear
Dichroism Spectroscopy for
Elucidating Structural Issues of
Light-Harvesting Aggregates in
Chlorosomes. Molecules 2021, 26, 899.
https://doi.org/10.3390/
molecules26040899
Academic Editor: Leszek Fiedor
Received: 22 December 2020
Accepted: 2 February 2021
Published: 9 February 2021
Publisher’s Note: MDPI stays neutral
with regard to jurisdictional claims in
published maps and institutional affil-
iations.
Copyright: © 2021 by the authors.
Licensee MDPI, Basel, Switzerland.
This article is an open access article
distributed under the terms and
conditions of the Creative Commons
Attribution (CC BY) license (https://
creativecommons.org/licenses/by/
4.0/).
1 Spectroscopy of Soft Matter, University of Bayreuth, Universitätsstr. 30, 95440 Bayreuth, Germany;[email protected]
2 University of Groningen, Zernike Institute for Advanced Materials, Nijenborgh 4,9747 AG Groningen, The Netherlands; [email protected]
3 Bayreuth Institute for Macromolecular Research (BIMF), University of Bayreuth, Universitätsstr. 30,95440 Bayreuth, Germany
4 Bavarian Polymer Institute, University of Bayreuth, Universitätsstr. 30, 95440 Bayreuth, Germany* Correspondence: [email protected]
Abstract: Linear dichroism (LD) spectroscopy is a widely used technique for studying the mutual ori-entation of the transition-dipole moments of the electronically excited states of molecular aggregates.Often the method is applied to aggregates where detailed information about the geometrical arrange-ment of the monomers is lacking. However, for complex molecular assemblies where the monomersare assembled hierarchically in tiers of supramolecular structural elements, the method cannot extractwell-founded information about the monomer arrangement. Here we discuss this difficulty on theexample of chlorosomes, which are the light-harvesting aggregates of photosynthetic green-(non)sulfur bacteria. Chlorosomes consist of hundreds of thousands of bacteriochlorophyll molecules thatself-assemble into secondary structural elements of curved lamellar or cylindrical morphology. Weexploit data from polarization-resolved fluorescence-excitation spectroscopy performed on singlechlorosomes for reconstructing the corresponding LD spectra. This reveals that LD spectroscopy isnot suited for benchmarking structural models in particular for complex hierarchically organizedmolecular supramolecular assemblies.
Keywords: linear dichroism; molecular aggregates; light harvesting; chlorosomes; photosynthesis
1. Introduction
Green-(non-)sulfur bacteria [1,2] are known to grow photosynthetically under the low-est light conditions [3–5] owing to their highly efficient light-harvesting antenna, so-calledchlorosomes. These are organelles enclosed by a monolipid envelope that accommodateshundreds of thousands of densely packed bacteriochlorophyll (BChl) c,d,e molecules, thatare organized in self-assembling secondary structures featuring curved lamellar or cylindri-cal geometry [4,6,7]. In particular, natural chlorosomes contain mixtures of BChl homologswith modifications of the methylation status giving rise to a tremendous variety for thepossible building blocks that are involved in the self-assembly process for the molecularaggregates within the chlorosomes [8,9]. Given the variations in size, shape, and thenumber of aggregates within a single chlorosome, it is not surprising that these molec-ular assemblies feature a large degree of structural heterogeneity. As a consequence ofthis, structure determination by high-resolution X-ray crystallography is not feasible, andchlorosomes have been investigated by various combinations of other techniques includingatomic force microscopy [10–12], solid-state NMR [13,14], optical spectroscopy both on en-sembles [11,15–22], and single-chlorosomes [12,23–29], cryo-electron microscopy [4,30,31],and computational approaches [6,32–34]. Nevertheless, details about their structural orga-nization are still the subject of an ongoing debate.
Molecules 2021, 26, 899. https://doi.org/10.3390/molecules26040899 https://www.mdpi.com/journal/molecules
Molecules 2021, 26, 899 2 of 16
In molecular aggregates, such as chlorosomes, the character of the electronically ex-cited states is determined by the intermolecular interactions, which in turn are imposed bythe geometrical arrangement of the molecular building blocks, i.e., the distances and mutualorientations of the monomers [35–38]. For strongly interacting monomers, the fundamentalelectronic excitations are delocalized over a substantial part of the aggregate and referredto as (molecular) excitons [39,40]. The formation of excitons has strong consequences forthe optical spectra, causing shifts of the excitation energies and a redistribution of oscillatorstrengths with respect to the monomer spectra. Therefore, some information about the mu-tual orientation of the transition-dipole moments becomes available via spectroscopy withpolarized light [41]. This allows to compare experimental spectra with predictions derivedfrom structural models, and forms the starting point for example for linear dichroism (LD)spectroscopy, sometimes referred to as the “poor man’s crystallography” [42].
A linear dichroism (LD) spectrum corresponds to the difference of two absorptionspectra that are recorded with incident light of mutually orthogonal linear polarization, i.e.,
LD(ν) ∝(
A‖(ν)− A⊥(ν))
(1)
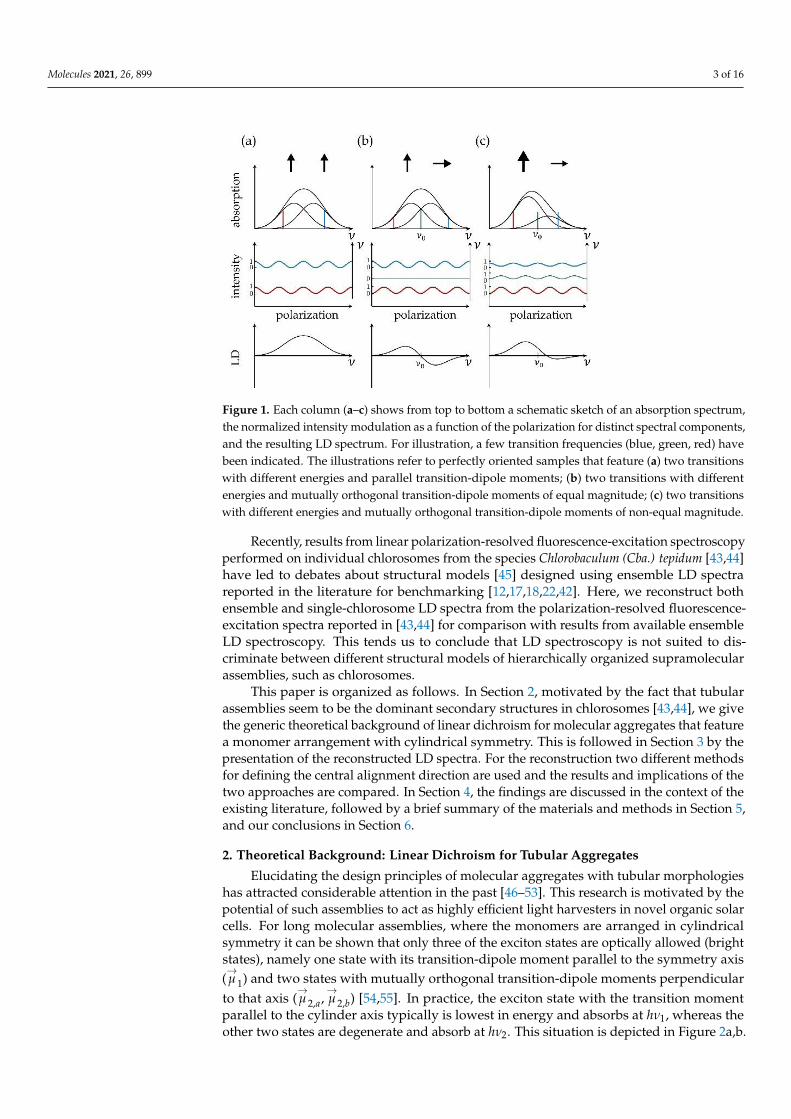
where A‖(ν) and A⊥(ν) refer to the absorption spectra recorded for light that is linearlypolarized parallel and perpendicular with respect to a reference direction. Obviously, theLD spectrum vanishes for a sample that consists of an ensemble of randomly orientedabsorbers. Hence, measuring an LD spectrum requires a sample that features at least somedegree of anisotropy for the orientation of its absorbers. This concept is illustrated inFigure 1. Consider a perfectly oriented sample with a broad, spectrally poorly resolvedabsorption band that is composed of two contributions from two electronic transitions withdifferent transition energies but with transition-dipole moments of equal magnitude thatare aligned parallel with respect to each other, Figure 1a top. Recording the absorptionspectrum as a function of the linear polarization of the incident light for various excitationfrequencies ν across the band yields a modulation of the absorption strength A(ν) ∝ cos2 α.Here, α refers to the angle between the projection of the transition-dipole moment of thecorresponding transition on the plane perpendicular to the propagation of the incidentlight and the direction of the polarization of the electric field vector. Assigning A‖(ν) tothe maximum and A⊥(ν) to the minimum of the modulation results in an LD spectrumthat reproduces the absorption spectrum.
The situation changes if the transition-dipole moments of the two (or more) electronictransitions are not oriented parallel with respect to each other, Figure 1b,c top. For illustra-tion purposes we assume that the transition-dipole moment that can be associated withthe red wing of the spectrum is oriented parallel with respect to the reference direction,and vice versa, that the transition-dipole moment that can be associated with the bluewing of the spectrum is oriented perpendicular with respect to the reference direction.Then for some excitation energy hν0 in-between, hνred < hν0 < hνblue, the two absorptionsA‖(ν0) and A⊥(ν0) will be of equal strengths and the resulting LD spectrum will reverseits sign with a zero at hν0. In other words, the relative phases of the intensity modulationsof the absorption strengths will undergo a change as a function of the excitation energy.Then the added value of an LD spectrum is that it provides the evidence that more thanone transition contributes to the broad unresolved absorption band. However, the LDspectrum does not allow to disentangle unambiguously the relative strengths and the exactnumber of the transitions that contribute to the band. Nevertheless, LD spectra can be usedas a first coarse test whether a proposed structure is compatible with the experimentallyobserved spectra.
Molecules 2021, 26, 899 3 of 16Molecules 2021, 26, x FOR PEER REVIEW 3 of 16
Figure 1. Each column (a–c) shows from top to bottom a schematic sketch of an absorption spec-
trum, the normalized intensity modulation as a function of the polarization for distinct spectral
components, and the resulting LD spectrum. For illustration, a few transition frequencies (blue,
green, red) have been indicated. The illustrations refer to perfectly oriented samples that feature
(a) two transitions with different energies and parallel transition-dipole moments; (b) two transi-
tions with different energies and mutually orthogonal transition-dipole moments of equal magni-
tude; (c) two transitions with different energies and mutually orthogonal transition-dipole mo-
ments of non-equal magnitude.
Recently, results from linear polarization-resolved fluorescence-excitation spectros-
copy performed on individual chlorosomes from the species Chlorobaculum (Cba.) tepidum
[43,44] have led to debates about structural models [45] designed using ensemble LD spec-
tra reported in the literature for benchmarking [12,17,18,22,42]. Here, we reconstruct both
ensemble and single-chlorosome LD spectra from the polarization-resolved fluorescence-
excitation spectra reported in [43,44] for comparison with results from available ensemble
LD spectroscopy. This tends us to conclude that LD spectroscopy is not suited to discrim-
inate between different structural models of hierarchically organized supramolecular as-
semblies, such as chlorosomes.
This paper is organized as follows. In Section 2, motivated by the fact that tubular
assemblies seem to be the dominant secondary structures in chlorosomes [43,44], we give
the generic theoretical background of linear dichroism for molecular aggregates that fea-
ture a monomer arrangement with cylindrical symmetry. This is followed in Section 3 by
the presentation of the reconstructed LD spectra. For the reconstruction two different
methods for defining the central alignment direction are used and the results and impli-
cations of the two approaches are compared. In Section 4, the findings are discussed in the
context of the existing literature, followed by a brief summary of the materials and meth-
ods in Section 5, and our conclusions in Section 6.
2. Theoretical Background: Linear Dichroism for Tubular Aggregates
Elucidating the design principles of molecular aggregates with tubular morphologies
has attracted considerable attention in the past [46–53]. This research is motivated by the
potential of such assemblies to act as highly efficient light harvesters in novel organic solar
cells. For long molecular assemblies, where the monomers are arranged in cylindrical
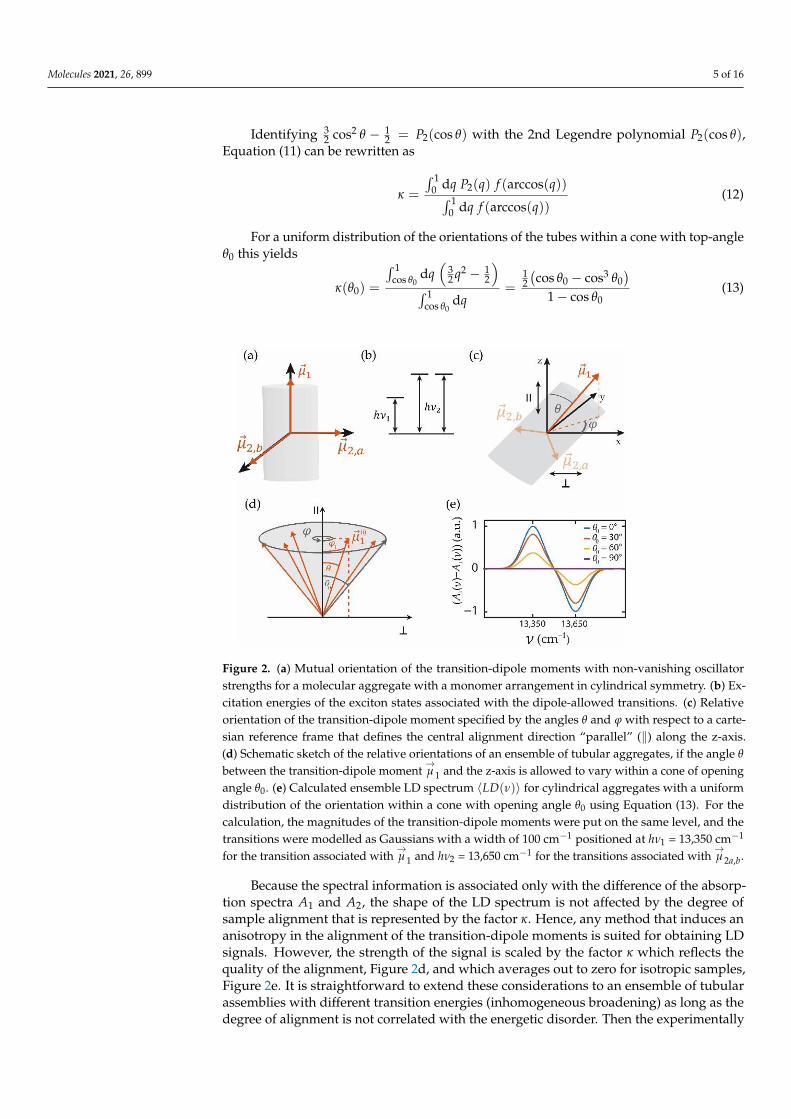
symmetry it can be shown that only three of the exciton states are optically allowed (bright
states), namely one state with its transition-dipole moment parallel to the symmetry axis
(��1) and two states with mutually orthogonal transition-dipole moments perpendicular to
that axis (��2,𝑎, ��2,𝑏) [54,55]. In practice, the exciton state with the transition moment paral-
lel to the cylinder axis typically is lowest in energy and absorbs at ℎ𝜈1, whereas the other
two states are degenerate and absorb at ℎ𝜈2. This situation is depicted in Figure 2a,b.
As mentioned above, registering an LD spectrum requires necessarily a sample with
some degree of alignment. For getting started to calculate the LD spectrum from an en-
semble of tubular aggregates with an arbitrary degree of alignment, we assume that all
Figure 1. Each column (a–c) shows from top to bottom a schematic sketch of an absorption spectrum,the normalized intensity modulation as a function of the polarization for distinct spectral components,and the resulting LD spectrum. For illustration, a few transition frequencies (blue, green, red) havebeen indicated. The illustrations refer to perfectly oriented samples that feature (a) two transitionswith different energies and parallel transition-dipole moments; (b) two transitions with differentenergies and mutually orthogonal transition-dipole moments of equal magnitude; (c) two transitionswith different energies and mutually orthogonal transition-dipole moments of non-equal magnitude.
Recently, results from linear polarization-resolved fluorescence-excitation spectroscopyperformed on individual chlorosomes from the species Chlorobaculum (Cba.) tepidum [43,44]have led to debates about structural models [45] designed using ensemble LD spectrareported in the literature for benchmarking [12,17,18,22,42]. Here, we reconstruct bothensemble and single-chlorosome LD spectra from the polarization-resolved fluorescence-excitation spectra reported in [43,44] for comparison with results from available ensembleLD spectroscopy. This tends us to conclude that LD spectroscopy is not suited to dis-criminate between different structural models of hierarchically organized supramolecularassemblies, such as chlorosomes.
This paper is organized as follows. In Section 2, motivated by the fact that tubularassemblies seem to be the dominant secondary structures in chlorosomes [43,44], we givethe generic theoretical background of linear dichroism for molecular aggregates that featurea monomer arrangement with cylindrical symmetry. This is followed in Section 3 by thepresentation of the reconstructed LD spectra. For the reconstruction two different methodsfor defining the central alignment direction are used and the results and implications of thetwo approaches are compared. In Section 4, the findings are discussed in the context of theexisting literature, followed by a brief summary of the materials and methods in Section 5,and our conclusions in Section 6.
2. Theoretical Background: Linear Dichroism for Tubular Aggregates
Elucidating the design principles of molecular aggregates with tubular morphologieshas attracted considerable attention in the past [46–53]. This research is motivated by thepotential of such assemblies to act as highly efficient light harvesters in novel organic solarcells. For long molecular assemblies, where the monomers are arranged in cylindricalsymmetry it can be shown that only three of the exciton states are optically allowed (brightstates), namely one state with its transition-dipole moment parallel to the symmetry axis(→µ 1) and two states with mutually orthogonal transition-dipole moments perpendicular
to that axis (→µ 2,a,
→µ 2,b) [54,55]. In practice, the exciton state with the transition moment
parallel to the cylinder axis typically is lowest in energy and absorbs at hν1, whereas theother two states are degenerate and absorb at hν2. This situation is depicted in Figure 2a,b.

Molecules 2021, 26, 899 4 of 16
As mentioned above, registering an LD spectrum requires necessarily a sample withsome degree of alignment. For getting started to calculate the LD spectrum from anensemble of tubular aggregates with an arbitrary degree of alignment, we assume thatall tubes are identical and address the effects of disorder (inhomogeneity) later on. In thefollowing, we define the z-axis as the central alignment direction, referred to as the paralleldirection (‖). Then the orientation of an individual tubular molecular aggregate can bespecified by the angle θ of its transition-dipole moment
→µ 1 with respect to the z-axis, and
the angle ϕ between the projection of the transition-dipole moment→µ 1 on the x,y plane
and the x-axis, see Figure 2c. Given the degeneracy of the other two states, the relativeorientation of the tubular aggregate around the
→µ 1 axis needs not to be specified, because
any linear combination of the exciton states connected with→µ 2,a,
→µ 2,b is again an eigenstate
of the system. Then, the transition-dipole moments of an individual aggregate can berepresented in (x,y,z) coordinates by
→µ 1 = µ1(sin θ cos ϕ, sin θ sin ϕ, cos θ) (2)
→µ 2,a = µ2(cos θ cos ϕ, cos θ sin ϕ,− sin θ) (3)
→µ 2,b = µ2(− sin ϕ, cos ϕ, 0) (4)
where µ1 and µ2 denote the magnitudes of the transition-dipole moments. The contributionof this particular aggregate to the LD spectrum can be obtained from the projections on thez- and the x-axis, respectively
A‖(ν) = A1(ν) cos2 θ + A2(ν) sin2 θ (5)
A⊥(ν) = A1(ν) sin2 θ cos2 ϕ + A2(ν) cos2 θ cos2 ϕ + A2(ν) sin2 ϕ (6)
where A1 (A2) refers to the absorption spectrum associated with the oscillator strength µ21
(µ22) centred at the frequency ν1(ν2), which yields for the LD spectrum
LD(ν) ∝ A1(ν)(
cos2 θ − sin2 θ cos2 ϕ)+ A2(ν)
(sin2 θ − cos2 θ cos2 ϕ− sin2 ϕ
)(7)
The LD spectrum of an ensemble of tubular systems with an arbitrary degree ofalignment that is cylindrically symmetric around the z-axis is then obtained by averagingthese contributions over the orientations, Figure 2d,
〈LD(ν)〉 = C∫ π
2
0dθ∫ 2π
0dϕ sin θ f (θ)LD(ν) (8)
Here, f (θ) specifies the distribution of orientations of the tubes relative to the z-axis,i.e., the degree of alignment, and C is a normalization factor. Note that θ runs from 0 toπ/2, because the absolute direction of the dipole does not affect the absorption strength.Inserting Equation (7) into Equation (8), and using
C =
(2π∫ π
2
0dθ sin θ f (θ)
)−1
(9)
for the normalization, we obtain after integrating over the angle ϕ
〈LD(ν)〉 = κ · (A1(ν)− A2(ν)) (10)
with
κ =
∫ π2
0 dθ sin θ f (θ)[
32 cos2(θ)− 1
2
]∫ π
20 dθ sin θ f (θ)
(11)
Molecules 2021, 26, 899 5 of 16
Identifying 32 cos2 θ − 1
2 = P2(cos θ) with the 2nd Legendre polynomial P2(cos θ),Equation (11) can be rewritten as
κ =
∫ 10 dq P2(q) f (arccos(q))∫ 1
0 dq f (arccos(q))(12)
For a uniform distribution of the orientations of the tubes within a cone with top-angleθ0 this yields
κ(θ0) =
∫ 1cos θ0
dq(
32 q2 − 1
2
)∫ 1
cos θ0dq
=12(cos θ0 − cos3 θ0
)1− cos θ0
(13)
Molecules 2021, 26, x FOR PEER REVIEW 5 of 16
𝜅 =∫ d𝑞 𝑃2(𝑞) 𝑓(arccos (𝑞))
1
0
∫ d𝑞 𝑓(arccos(𝑞))1
0
(12)
For a uniform distribution of the orientations of the tubes within a cone with top-
angle 𝜃0 this yields
𝜅(𝜃0) =∫ dq (
32
𝑞2 − 12
)1
cos 𝜃0
∫ d𝑞 1
cos 𝜃0
=
12
(cos 𝜃0 − cos3 𝜃0)
1 − cos 𝜃0 (13)
Figure 2. (a) Mutual orientation of the transition-dipole moments with non-vanishing oscillator
strengths for a molecular aggregate with a monomer arrangement in cylindrical symmetry. (b)
Excitation energies of the exciton states associated with the dipole-allowed transitions. (c) Relative
orientation of the transition-dipole moment specified by the angles 𝜃 and 𝜑 with respect to a
cartesian reference frame that defines the central alignment direction “parallel” (∥) along the z-
axis. (d) Schematic sketch of the relative orientations of an ensemble of tubular aggregates, if the
angle 𝜃 between the transition-dipole moment 𝜇1 and the z-axis is allowed to vary within a cone
of opening angle 𝜃0. (e) Calculated ensemble LD spectrum ⟨𝐿𝐷(𝜈)⟩ for cylindrical aggregates
with a uniform distribution of the orientation within a cone with opening angle 𝜃0 using Equa-
tion (13). For the calculation, the magnitudes of the transition-dipole moments were put on the
same level, and the transitions were modelled as Gaussians with a width of 100 cm−1 positioned at
ℎ𝜈1 = 13,350 cm−1 for the transition associated with 𝜇1 and ℎ𝜈2 = 13,650 cm−1 for the transitions
associated with ��2𝑎,𝑏.
Because the spectral information is associated only with the difference of the absorp-
tion spectra 𝐴1 and 𝐴2, the shape of the LD spectrum is not affected by the degree of
sample alignment that is represented by the factor κ. Hence, any method that induces an
anisotropy in the alignment of the transition-dipole moments is suited for obtaining LD
signals. However, the strength of the signal is scaled by the factor which reflects the
quality of the alignment, Figure 2d, and which averages out to zero for isotropic samples,
Figure 2e. It is straightforward to extend these considerations to an ensemble of tubular
assemblies with different transition energies (inhomogeneous broadening) as long as the
degree of alignment is not correlated with the energetic disorder. Then the experimentally
observed ensemble LD spectrum corresponds to the difference of the individual absorp-
tion spectra 𝐴1(𝜈) and 𝐴2(𝜈) averaged over the relevant disorder
⟨𝐿𝐷(𝜈)⟩ = 𝜅 ⋅ (𝐴1(𝜈) − 𝐴2(𝜈) ) (14)
Figure 2. (a) Mutual orientation of the transition-dipole moments with non-vanishing oscillatorstrengths for a molecular aggregate with a monomer arrangement in cylindrical symmetry. (b) Ex-citation energies of the exciton states associated with the dipole-allowed transitions. (c) Relativeorientation of the transition-dipole moment specified by the angles θ and ϕ with respect to a carte-sian reference frame that defines the central alignment direction “parallel” (‖) along the z-axis.(d) Schematic sketch of the relative orientations of an ensemble of tubular aggregates, if the angle θ
between the transition-dipole moment→µ 1 and the z-axis is allowed to vary within a cone of opening
angle θ0. (e) Calculated ensemble LD spectrum 〈LD(ν)〉 for cylindrical aggregates with a uniformdistribution of the orientation within a cone with opening angle θ0 using Equation (13). For thecalculation, the magnitudes of the transition-dipole moments were put on the same level, and thetransitions were modelled as Gaussians with a width of 100 cm−1 positioned at hν1 = 13,350 cm−1
for the transition associated with→µ 1 and hν2 = 13,650 cm−1 for the transitions associated with
→µ 2a,b.
Because the spectral information is associated only with the difference of the absorp-tion spectra A1 and A2, the shape of the LD spectrum is not affected by the degree ofsample alignment that is represented by the factor κ. Hence, any method that induces ananisotropy in the alignment of the transition-dipole moments is suited for obtaining LDsignals. However, the strength of the signal is scaled by the factor κ which reflects thequality of the alignment, Figure 2d, and which averages out to zero for isotropic samples,Figure 2e. It is straightforward to extend these considerations to an ensemble of tubularassemblies with different transition energies (inhomogeneous broadening) as long as thedegree of alignment is not correlated with the energetic disorder. Then the experimentally
Molecules 2021, 26, 899 6 of 16
observed ensemble LD spectrum corresponds to the difference of the individual absorptionspectra A1(ν) and A2(ν) averaged over the relevant disorder
〈LD(ν)〉 = κ ·(
A1(ν)− A2(ν))
(14)
3. Results: Linear Dichroism of Chlorosomes
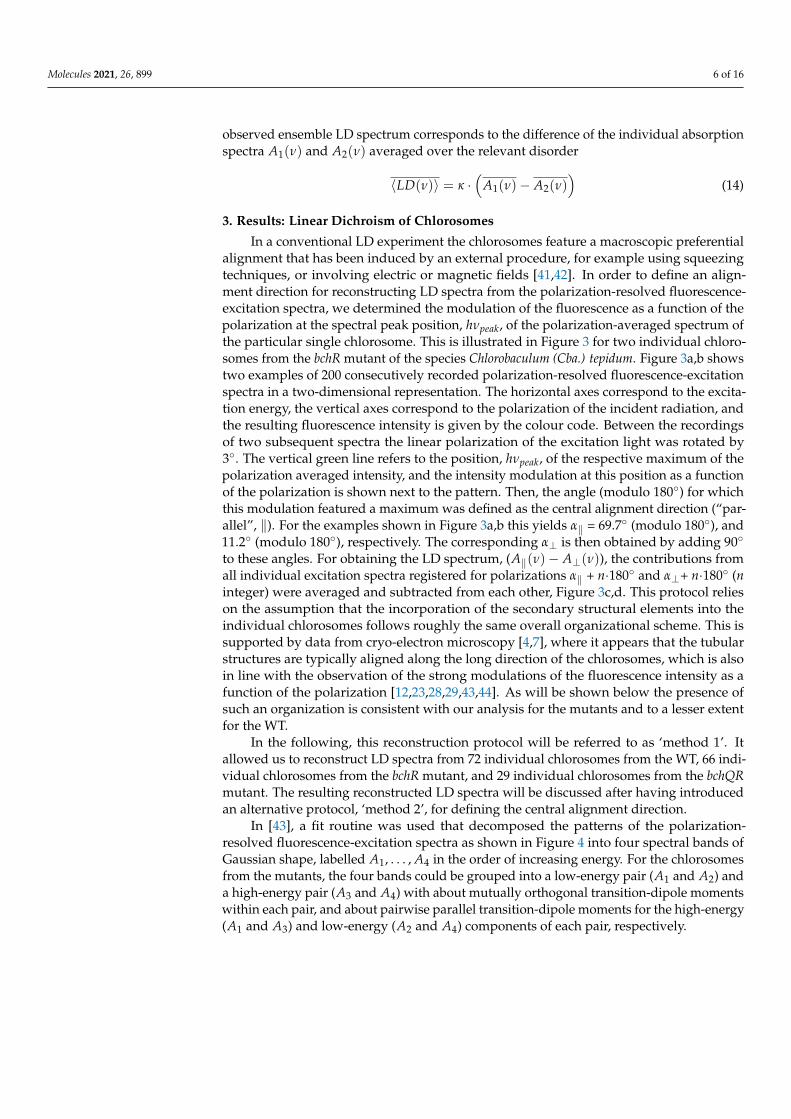
In a conventional LD experiment the chlorosomes feature a macroscopic preferentialalignment that has been induced by an external procedure, for example using squeezingtechniques, or involving electric or magnetic fields [41,42]. In order to define an align-ment direction for reconstructing LD spectra from the polarization-resolved fluorescence-excitation spectra, we determined the modulation of the fluorescence as a function of thepolarization at the spectral peak position, hνpeak, of the polarization-averaged spectrum ofthe particular single chlorosome. This is illustrated in Figure 3 for two individual chloro-somes from the bchR mutant of the species Chlorobaculum (Cba.) tepidum. Figure 3a,b showstwo examples of 200 consecutively recorded polarization-resolved fluorescence-excitationspectra in a two-dimensional representation. The horizontal axes correspond to the excita-tion energy, the vertical axes correspond to the polarization of the incident radiation, andthe resulting fluorescence intensity is given by the colour code. Between the recordingsof two subsequent spectra the linear polarization of the excitation light was rotated by3◦. The vertical green line refers to the position, hνpeak, of the respective maximum of thepolarization averaged intensity, and the intensity modulation at this position as a functionof the polarization is shown next to the pattern. Then, the angle (modulo 180◦) for whichthis modulation featured a maximum was defined as the central alignment direction (“par-allel”, ‖). For the examples shown in Figure 3a,b this yields α‖ = 69.7◦ (modulo 180◦), and11.2◦ (modulo 180◦), respectively. The corresponding α⊥ is then obtained by adding 90◦
to these angles. For obtaining the LD spectrum, (A‖(ν)− A⊥(ν)), the contributions fromall individual excitation spectra registered for polarizations α‖ + n·180◦ and α⊥+ n·180◦ (ninteger) were averaged and subtracted from each other, Figure 3c,d. This protocol relieson the assumption that the incorporation of the secondary structural elements into theindividual chlorosomes follows roughly the same overall organizational scheme. This issupported by data from cryo-electron microscopy [4,7], where it appears that the tubularstructures are typically aligned along the long direction of the chlorosomes, which is alsoin line with the observation of the strong modulations of the fluorescence intensity as afunction of the polarization [12,23,28,29,43,44]. As will be shown below the presence ofsuch an organization is consistent with our analysis for the mutants and to a lesser extentfor the WT.
In the following, this reconstruction protocol will be referred to as ‘method 1’. Itallowed us to reconstruct LD spectra from 72 individual chlorosomes from the WT, 66 indi-vidual chlorosomes from the bchR mutant, and 29 individual chlorosomes from the bchQRmutant. The resulting reconstructed LD spectra will be discussed after having introducedan alternative protocol, ‘method 2’, for defining the central alignment direction.
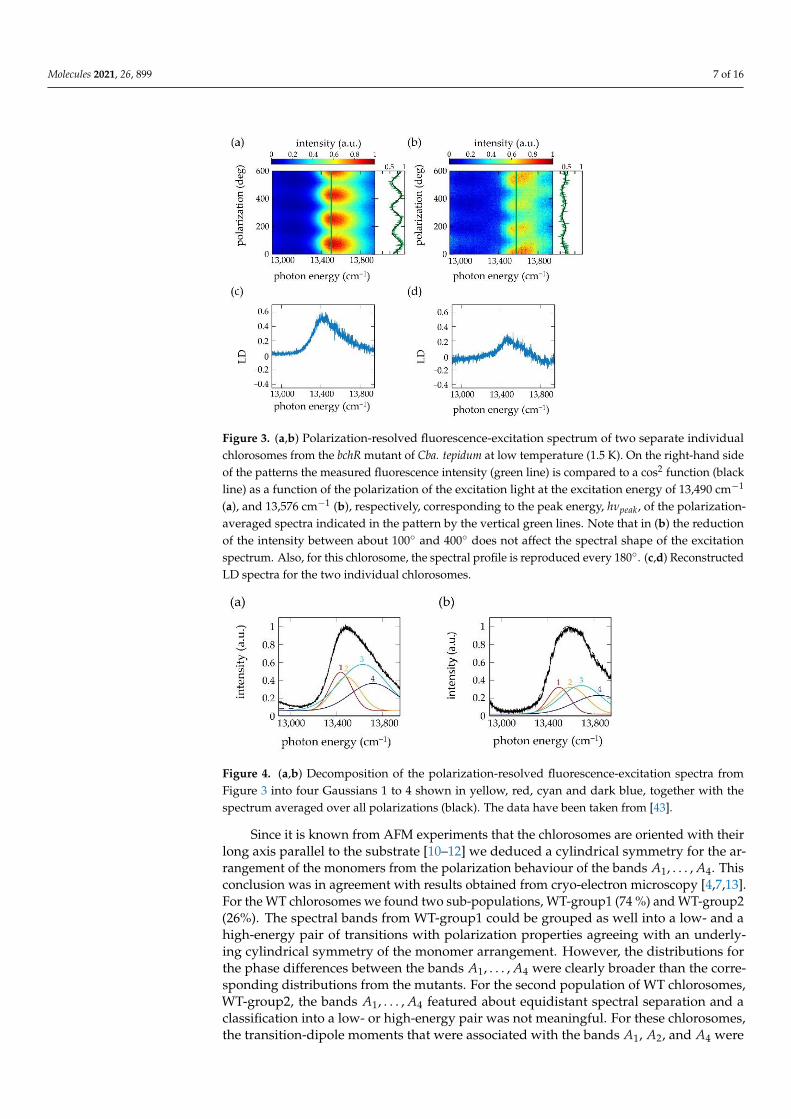
In [43], a fit routine was used that decomposed the patterns of the polarization-resolved fluorescence-excitation spectra as shown in Figure 4 into four spectral bands ofGaussian shape, labelled A1, . . . , A4 in the order of increasing energy. For the chlorosomesfrom the mutants, the four bands could be grouped into a low-energy pair (A1 and A2) anda high-energy pair (A3 and A4) with about mutually orthogonal transition-dipole momentswithin each pair, and about pairwise parallel transition-dipole moments for the high-energy(A1 and A3) and low-energy (A2 and A4) components of each pair, respectively.
Molecules 2021, 26, 899 7 of 16Molecules 2021, 26, x FOR PEER REVIEW 7 of 16
Figure 3. (a,b) Polarization-resolved fluorescence-excitation spectrum of two separate individual
chlorosomes from the bchR mutant of Cba. tepidum at low temperature (1.5 K). On the right-hand
side of the patterns the measured fluorescence intensity (green line) is compared to a cos2 function
(black line) as a function of the polarization of the excitation light at the excitation energy of 13,490
cm−1 (a), and 13,576 cm−1 (b), respectively, corresponding to the peak energy, ℎ𝜈𝑝𝑒𝑎𝑘, of the polari-
zation-averaged spectra indicated in the pattern by the vertical green lines. Note that in (b) the
reduction of the intensity between about 100° and 400° does not affect the spectral shape of the
excitation spectrum. Also, for this chlorosome, the spectral profile is reproduced every 180°. (c,d)
Reconstructed LD spectra for the two individual chlorosomes.
Figure 4. (a,b) Decomposition of the polarization-resolved fluorescence-excitation spectra from
Figure 3 into four Gaussians 1 to 4 shown in yellow, red, cyan and dark blue, together with the
spectrum averaged over all polarizations (black). The data have been taken from [43].
Since it is known from AFM experiments that the chlorosomes are oriented with their
long axis parallel to the substrate [10–12] we deduced a cylindrical symmetry for the ar-
rangement of the monomers from the polarization behaviour of the bands 𝐴1, … , 𝐴4. This
conclusion was in agreement with results obtained from cryo-electron microscopy
[4,7,13]. For the WT chlorosomes we found two sub-populations, WT-group1 (74 %) and
WT-group2 (26%). The spectral bands from WT-group1 could be grouped as well into a
low- and a high-energy pair of transitions with polarization properties agreeing with an
underlying cylindrical symmetry of the monomer arrangement. However, the distribu-
tions for the phase differences between the bands 𝐴1, … , 𝐴4 were clearly broader than the
corresponding distributions from the mutants. For the second population of WT chloro-
somes, WT-group2, the bands 𝐴1, … , 𝐴4featured about equidistant spectral separation and
a classification into a low- or high-energy pair was not meaningful. For these chlorosomes,
the transition-dipole moments that were associated with the bands 𝐴1, 𝐴2, and 𝐴4 were
oriented about parallel with respect to each other, and about perpendicular with respect
to the transition-dipole moment that was associated with the band 𝐴3. For WT-group-2
chlorosomes, the structure that underlies the polarization properties still is unclear.
Figure 3. (a,b) Polarization-resolved fluorescence-excitation spectrum of two separate individualchlorosomes from the bchR mutant of Cba. tepidum at low temperature (1.5 K). On the right-hand sideof the patterns the measured fluorescence intensity (green line) is compared to a cos2 function (blackline) as a function of the polarization of the excitation light at the excitation energy of 13,490 cm−1
(a), and 13,576 cm−1 (b), respectively, corresponding to the peak energy, hνpeak, of the polarization-averaged spectra indicated in the pattern by the vertical green lines. Note that in (b) the reductionof the intensity between about 100◦ and 400◦ does not affect the spectral shape of the excitationspectrum. Also, for this chlorosome, the spectral profile is reproduced every 180◦. (c,d) ReconstructedLD spectra for the two individual chlorosomes.
Molecules 2021, 26, x FOR PEER REVIEW 7 of 16
Figure 3. (a,b) Polarization-resolved fluorescence-excitation spectrum of two separate individual
chlorosomes from the bchR mutant of Cba. tepidum at low temperature (1.5 K). On the right-hand
side of the patterns the measured fluorescence intensity (green line) is compared to a cos2 function
(black line) as a function of the polarization of the excitation light at the excitation energy of 13,490
cm−1 (a), and 13,576 cm−1 (b), respectively, corresponding to the peak energy, ℎ𝜈𝑝𝑒𝑎𝑘, of the polari-
zation-averaged spectra indicated in the pattern by the vertical green lines. Note that in (b) the
reduction of the intensity between about 100° and 400° does not affect the spectral shape of the
excitation spectrum. Also, for this chlorosome, the spectral profile is reproduced every 180°. (c,d)
Reconstructed LD spectra for the two individual chlorosomes.
Figure 4. (a,b) Decomposition of the polarization-resolved fluorescence-excitation spectra from
Figure 3 into four Gaussians 1 to 4 shown in yellow, red, cyan and dark blue, together with the
spectrum averaged over all polarizations (black). The data have been taken from [43].
Since it is known from AFM experiments that the chlorosomes are oriented with their
long axis parallel to the substrate [10–12] we deduced a cylindrical symmetry for the ar-
rangement of the monomers from the polarization behaviour of the bands 𝐴1, … , 𝐴4. This
conclusion was in agreement with results obtained from cryo-electron microscopy
[4,7,13]. For the WT chlorosomes we found two sub-populations, WT-group1 (74 %) and
WT-group2 (26%). The spectral bands from WT-group1 could be grouped as well into a
low- and a high-energy pair of transitions with polarization properties agreeing with an
underlying cylindrical symmetry of the monomer arrangement. However, the distribu-
tions for the phase differences between the bands 𝐴1, … , 𝐴4 were clearly broader than the
corresponding distributions from the mutants. For the second population of WT chloro-
somes, WT-group2, the bands 𝐴1, … , 𝐴4featured about equidistant spectral separation and
a classification into a low- or high-energy pair was not meaningful. For these chlorosomes,
the transition-dipole moments that were associated with the bands 𝐴1, 𝐴2, and 𝐴4 were
oriented about parallel with respect to each other, and about perpendicular with respect
to the transition-dipole moment that was associated with the band 𝐴3. For WT-group-2
chlorosomes, the structure that underlies the polarization properties still is unclear.
Figure 4. (a,b) Decomposition of the polarization-resolved fluorescence-excitation spectra fromFigure 3 into four Gaussians 1 to 4 shown in yellow, red, cyan and dark blue, together with thespectrum averaged over all polarizations (black). The data have been taken from [43].
Since it is known from AFM experiments that the chlorosomes are oriented with theirlong axis parallel to the substrate [10–12] we deduced a cylindrical symmetry for the ar-rangement of the monomers from the polarization behaviour of the bands A1, . . . , A4. Thisconclusion was in agreement with results obtained from cryo-electron microscopy [4,7,13].For the WT chlorosomes we found two sub-populations, WT-group1 (74 %) and WT-group2(26%). The spectral bands from WT-group1 could be grouped as well into a low- and ahigh-energy pair of transitions with polarization properties agreeing with an underly-ing cylindrical symmetry of the monomer arrangement. However, the distributions forthe phase differences between the bands A1, . . . , A4 were clearly broader than the corre-sponding distributions from the mutants. For the second population of WT chlorosomes,WT-group2, the bands A1, . . . , A4 featured about equidistant spectral separation and aclassification into a low- or high-energy pair was not meaningful. For these chlorosomes,the transition-dipole moments that were associated with the bands A1, A2, and A4 were
Molecules 2021, 26, 899 8 of 16
oriented about parallel with respect to each other, and about perpendicular with respectto the transition-dipole moment that was associated with the band A3. For WT-group-2chlorosomes, the structure that underlies the polarization properties still is unclear.
For those chlorosomes whose spectral signatures are consistent with a monomerarrangement in cylindrical symmetry—i.e., for bchR, bchQR, and WT-group1—the aboveconsiderations leading to Equation (14) can be generalized to the situation encounteredhere, i.e., for two parallel transitions and four pair-wise degenerate perpendicular ones.Accordingly, the transition-dipole moments of the low-energy transitions, A1 and A3, areoriented parallel with respect to the symmetry axis of the tubular structures providing anunambiguous criterion for defining the central alignment direction (“parallel”, ‖) of thetubular secondary structural elements, referred to as ‘method 2’ in the following.
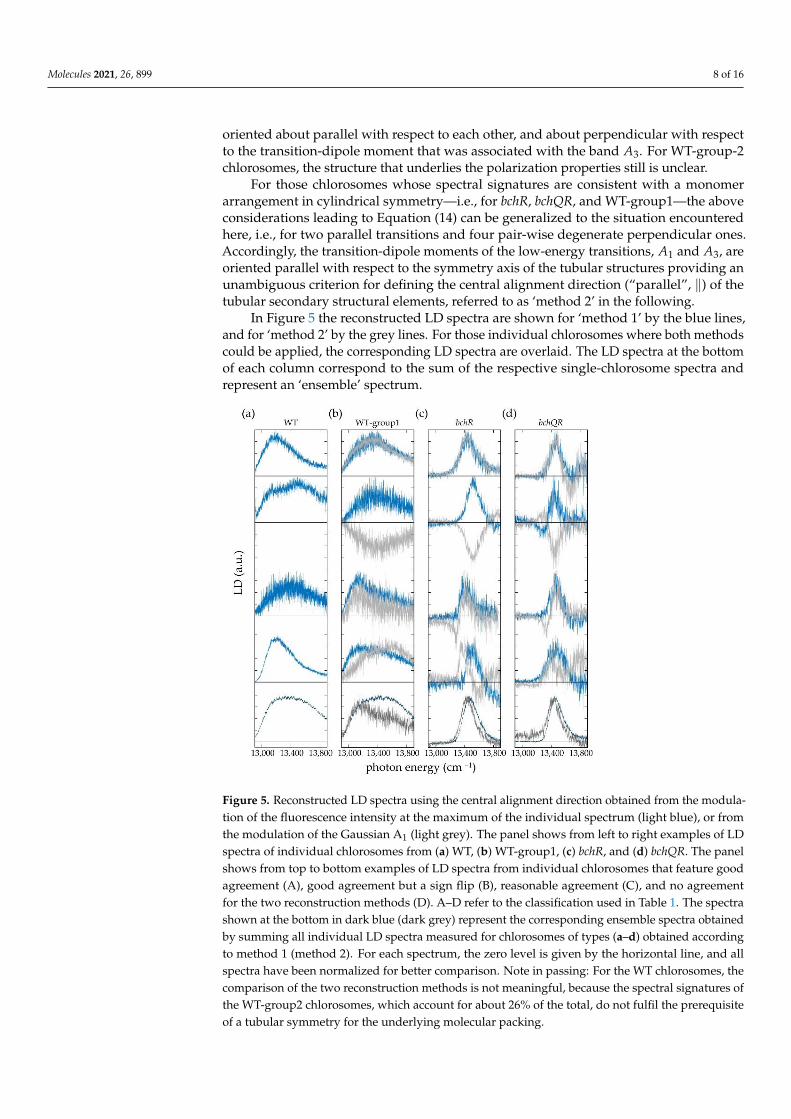
In Figure 5 the reconstructed LD spectra are shown for ‘method 1’ by the blue lines,and for ‘method 2’ by the grey lines. For those individual chlorosomes where both methodscould be applied, the corresponding LD spectra are overlaid. The LD spectra at the bottomof each column correspond to the sum of the respective single-chlorosome spectra andrepresent an ‘ensemble’ spectrum.
Molecules 2021, 26, x FOR PEER REVIEW 8 of 16
For those chlorosomes whose spectral signatures are consistent with a monomer ar-
rangement in cylindrical symmetry—i.e., for bchR, bchQR, and WT-group1—the above
considerations leading to Equation (14) can be generalized to the situation encountered
here, i.e., for two parallel transitions and four pair-wise degenerate perpendicular ones.
Accordingly, the transition-dipole moments of the low-energy transitions, 𝐴1 and 𝐴3, are
oriented parallel with respect to the symmetry axis of the tubular structures providing an
unambiguous criterion for defining the central alignment direction (“parallel”, ∥) of the
tubular secondary structural elements, referred to as ‘method 2’ in the following.
In Figure 5 the reconstructed LD spectra are shown for ‘method 1’ by the blue lines,
and for ‘method 2’ by the grey lines. For those individual chlorosomes where both meth-
ods could be applied, the corresponding LD spectra are overlaid. The LD spectra at the
bottom of each column correspond to the sum of the respective single-chlorosome spectra
and represent an ‘ensemble’ spectrum.
Figure 5. Reconstructed LD spectra using the central alignment direction obtained from the modu-
lation of the fluorescence intensity at the maximum of the individual spectrum (light blue), or
from the modulation of the Gaussian A1 (light grey). The panel shows from left to right examples
of LD spectra of individual chlorosomes from (a) WT, (b) WT-group1, (c) bchR, and (d) bchQR. The
panel shows from top to bottom examples of LD spectra from individual chlorosomes that feature
good agreement (A), good agreement but a sign flip (B), reasonable agreement (C), and no agree-
ment for the two reconstruction methods (D). A–D refer to the classification used in Table 1. The
spectra shown at the bottom in dark blue (dark grey) represent the corresponding ensemble spec-
tra obtained by summing all individual LD spectra measured for chlorosomes of types (a–d) ob-
tained according to method 1 (method 2). For each spectrum, the zero level is given by the hori-
zontal line, and all spectra have been normalized for better comparison. Note in passing: For the
WT chlorosomes, the comparison of the two reconstruction methods is not meaningful, because
the spectral signatures of the WT-group2 chlorosomes, which account for about 26% of the total,
do not fulfil the prerequisite of a tubular symmetry for the underlying molecular packing.
In general, the LD spectra reveal large differences in the widths of the spectral fea-
tures for the three types of chlorosomes. While the spectra from the two mutants cover a
spectral range of about 400 cm−1 the spectra from the WT cover about twice this range.
This observation is in agreement with previous work, where we observed similar differ-
ences for the widths of the absorption bands from the three species [44], and which simply
reflects the reduction of the structural heterogeneity by decreasing the BChl homolog
Figure 5. Reconstructed LD spectra using the central alignment direction obtained from the modula-tion of the fluorescence intensity at the maximum of the individual spectrum (light blue), or fromthe modulation of the Gaussian A1 (light grey). The panel shows from left to right examples of LDspectra of individual chlorosomes from (a) WT, (b) WT-group1, (c) bchR, and (d) bchQR. The panelshows from top to bottom examples of LD spectra from individual chlorosomes that feature goodagreement (A), good agreement but a sign flip (B), reasonable agreement (C), and no agreementfor the two reconstruction methods (D). A–D refer to the classification used in Table 1. The spectrashown at the bottom in dark blue (dark grey) represent the corresponding ensemble spectra obtainedby summing all individual LD spectra measured for chlorosomes of types (a–d) obtained accordingto method 1 (method 2). For each spectrum, the zero level is given by the horizontal line, and allspectra have been normalized for better comparison. Note in passing: For the WT chlorosomes, thecomparison of the two reconstruction methods is not meaningful, because the spectral signatures ofthe WT-group2 chlorosomes, which account for about 26% of the total, do not fulfil the prerequisiteof a tubular symmetry for the underlying molecular packing.
Molecules 2021, 26, 899 9 of 16
In general, the LD spectra reveal large differences in the widths of the spectral featuresfor the three types of chlorosomes. While the spectra from the two mutants cover a spectralrange of about 400 cm−1 the spectra from the WT cover about twice this range. Thisobservation is in agreement with previous work, where we observed similar differencesfor the widths of the absorption bands from the three species [44], and which simplyreflects the reduction of the structural heterogeneity by decreasing the BChl homologsidechain heterogeneity employing mutagenesis [56]. Pairwise comparison of the LDspectra reconstructed using the two different methods reveals that these can be categorizedinto those that show good agreement (A), good agreement but a sign flip (B), reasonableagreement (C), and those that do not agree (D) with each other, as exemplified in Figure 5from top to bottom, and summarized in Table 1.
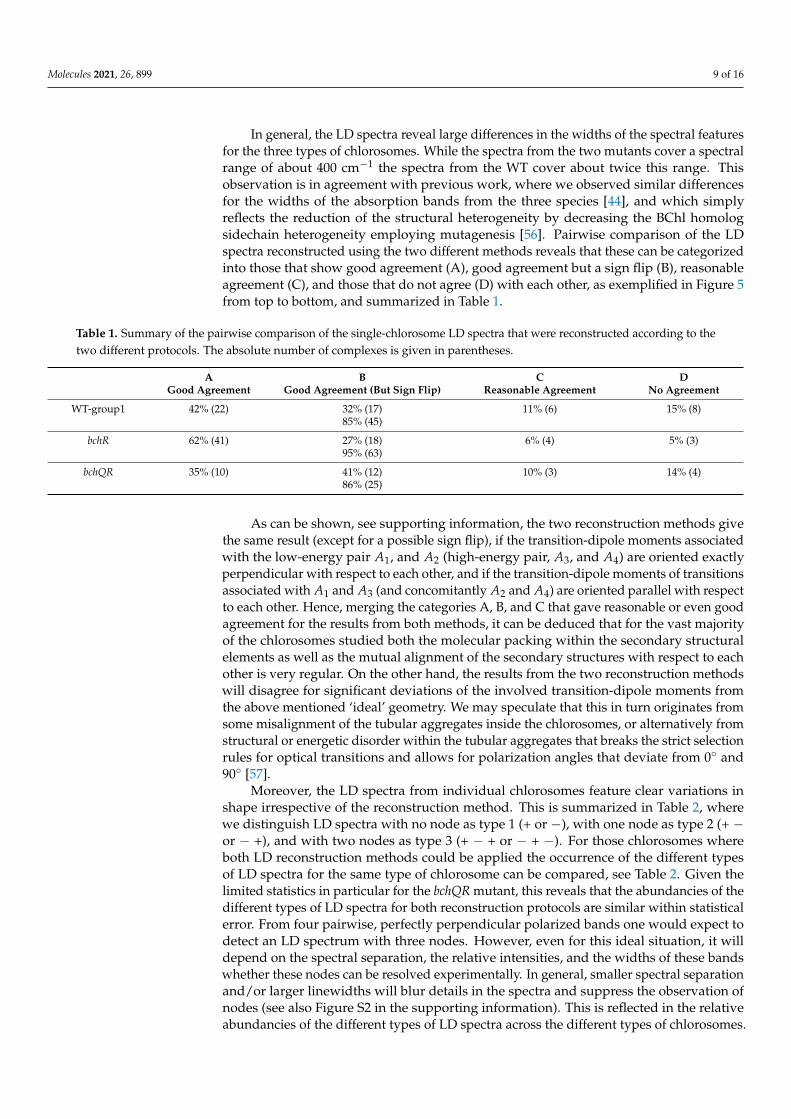
Table 1. Summary of the pairwise comparison of the single-chlorosome LD spectra that were reconstructed according to thetwo different protocols. The absolute number of complexes is given in parentheses.
A B C DGood Agreement Good Agreement (But Sign Flip) Reasonable Agreement No Agreement
WT-group1 42% (22) 32% (17) 11% (6) 15% (8)85% (45)
bchR 62% (41) 27% (18) 6% (4) 5% (3)95% (63)
bchQR 35% (10) 41% (12) 10% (3) 14% (4)86% (25)
As can be shown, see supporting information, the two reconstruction methods givethe same result (except for a possible sign flip), if the transition-dipole moments associatedwith the low-energy pair A1, and A2 (high-energy pair, A3, and A4) are oriented exactlyperpendicular with respect to each other, and if the transition-dipole moments of transitionsassociated with A1 and A3 (and concomitantly A2 and A4) are oriented parallel with respectto each other. Hence, merging the categories A, B, and C that gave reasonable or even goodagreement for the results from both methods, it can be deduced that for the vast majorityof the chlorosomes studied both the molecular packing within the secondary structuralelements as well as the mutual alignment of the secondary structures with respect to eachother is very regular. On the other hand, the results from the two reconstruction methodswill disagree for significant deviations of the involved transition-dipole moments fromthe above mentioned ‘ideal’ geometry. We may speculate that this in turn originates fromsome misalignment of the tubular aggregates inside the chlorosomes, or alternatively fromstructural or energetic disorder within the tubular aggregates that breaks the strict selectionrules for optical transitions and allows for polarization angles that deviate from 0◦ and90◦ [57].
Moreover, the LD spectra from individual chlorosomes feature clear variations inshape irrespective of the reconstruction method. This is summarized in Table 2, wherewe distinguish LD spectra with no node as type 1 (+ or −), with one node as type 2 (+ −or − +), and with two nodes as type 3 (+ − + or − + −). For those chlorosomes whereboth LD reconstruction methods could be applied the occurrence of the different typesof LD spectra for the same type of chlorosome can be compared, see Table 2. Given thelimited statistics in particular for the bchQR mutant, this reveals that the abundancies of thedifferent types of LD spectra for both reconstruction protocols are similar within statisticalerror. From four pairwise, perfectly perpendicular polarized bands one would expect todetect an LD spectrum with three nodes. However, even for this ideal situation, it willdepend on the spectral separation, the relative intensities, and the widths of these bandswhether these nodes can be resolved experimentally. In general, smaller spectral separationand/or larger linewidths will blur details in the spectra and suppress the observation ofnodes (see also Figure S2 in the supporting information). This is reflected in the relativeabundancies of the different types of LD spectra across the different types of chlorosomes.

Molecules 2021, 26, 899 10 of 16
The occurrence of LD spectra with one or two nodes increases slightly in the order WT <bchR < bchQR, see Table 2, which is the same order in which the widths of the absorptionbands decrease [44], reflecting the (spectral) heterogeneity of the chlorosomes. In any case,most of the reconstructed LD spectra correspond to those without a node. Therefore, it isnot surprising that the more complex LD spectra are fully averaged out in the ensembleLD spectra.
Table 2. Summary of the different types of single-chlorosome LD spectra. The colour code refers to the colour code used inFigure 5 for distinguishing the two reconstruction protocols, method 1 (blue) and method 2 (grey).
Type 1: No Node Type 2: One Node Type 3: Two Nodes Relative AbundanceT1:T2:T3
LD Type + − + − − + + − + − + −WT
68 4 0 94%: 6%: 0%method 1 67 1 1 3 0 0
WT-group1Sign flips 32% (17)
49 4 0 92%:8%:0%method 1 48 1 1 3 0 0method 2 27 15 7 3 1 0
42 10 1 79%: 19%:2%WT-group2
19 0 0 100%:0%:0%method 1 19 0 0 0 0 0
bchR mutantsign flips 27% (18)
52 14 0 79%:21%:0%method 1 52 0 4 10 0 0method 2 40 11 12 3 0 0
51 15 0 77%:23%:0%bchQR mutant
sign flips 41% (12)21 6 2 72%:21%:7%
method 1 21 0 2 4 2 0method 2 10 7 5 4 2 1
17 9 3 59%:31%:10%
4. Discussion
In an experiment on a large ensemble of chlorosomes the macroscopic preferentialalignment is induced externally. This, however, refers to the alignment of the chlorosomes,whereas the optical response to polarized light originates from the secondary structureswithin the chlorosomes. For the reconstruction of the LD spectra, we used a definition forthe central alignment direction that was either based on the modulation of the fluorescenceresponse at the maximum of the absorption spectrum of the respective chlorosome, or bytaking advantage of the underlying symmetry properties of the spectral signatures (forthose chlorosomes whose spectral signatures complied with cylindrical symmetry of themonomer arrangement). These definitions, however, are both related to the alignment ofthe secondary structures within the chlorosomes irrespective of their orientation relative tothe chlorosome. Hence, single-chlorosome and ensemble LD spectroscopy are supposedto give equivalent results (apart from a possible sign flip) only if the secondary structuralelements are incorporated into the chlorosomes according to a unique scheme, for instanceif the long axis of the tubular aggregates is always parallel (or always perpendicular) to thelong axis of the chlorosome.
To the best of our knowledge, LD spectra from the bchR and bchQR mutants fromthe green-sulfur bacterium Cba. tepidum have not been published before, and the only LDspectra from this species that have been reported so far are those from the WT documented
Molecules 2021, 26, 899 11 of 16
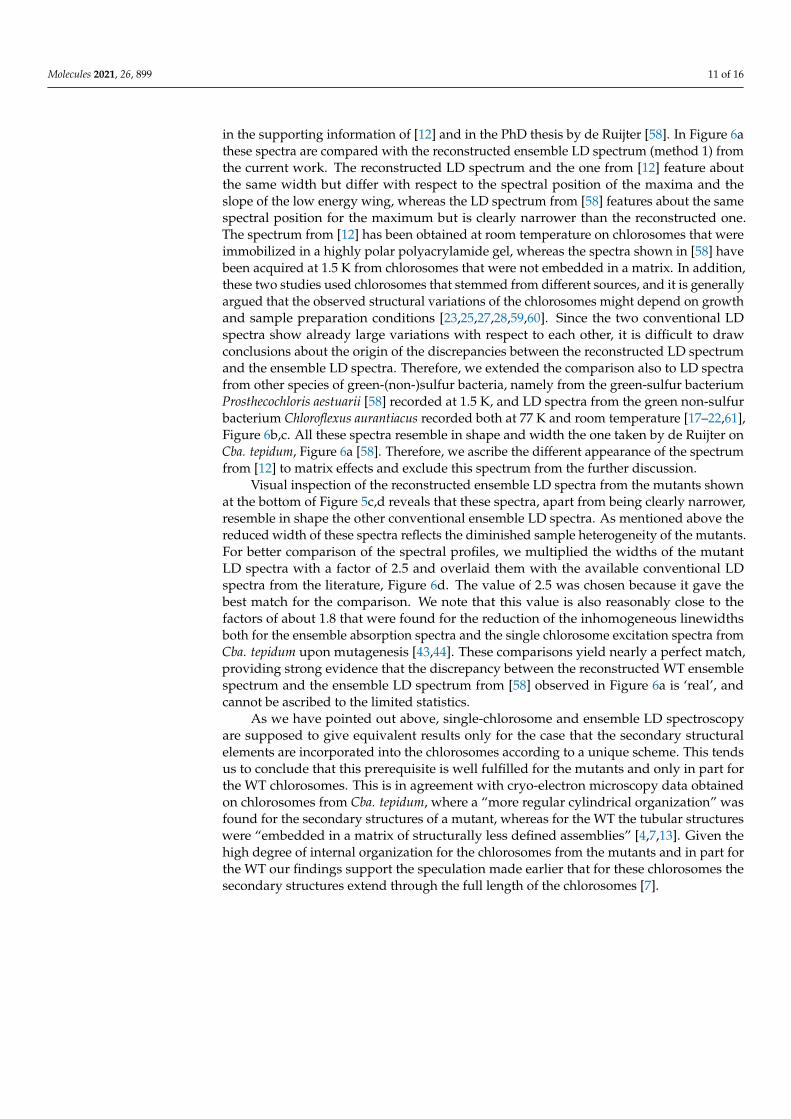
in the supporting information of [12] and in the PhD thesis by de Ruijter [58]. In Figure 6athese spectra are compared with the reconstructed ensemble LD spectrum (method 1) fromthe current work. The reconstructed LD spectrum and the one from [12] feature aboutthe same width but differ with respect to the spectral position of the maxima and theslope of the low energy wing, whereas the LD spectrum from [58] features about the samespectral position for the maximum but is clearly narrower than the reconstructed one.The spectrum from [12] has been obtained at room temperature on chlorosomes that wereimmobilized in a highly polar polyacrylamide gel, whereas the spectra shown in [58] havebeen acquired at 1.5 K from chlorosomes that were not embedded in a matrix. In addition,these two studies used chlorosomes that stemmed from different sources, and it is generallyargued that the observed structural variations of the chlorosomes might depend on growthand sample preparation conditions [23,25,27,28,59,60]. Since the two conventional LDspectra show already large variations with respect to each other, it is difficult to drawconclusions about the origin of the discrepancies between the reconstructed LD spectrumand the ensemble LD spectra. Therefore, we extended the comparison also to LD spectrafrom other species of green-(non-)sulfur bacteria, namely from the green-sulfur bacteriumProsthecochloris aestuarii [58] recorded at 1.5 K, and LD spectra from the green non-sulfurbacterium Chloroflexus aurantiacus recorded both at 77 K and room temperature [17–22,61],Figure 6b,c. All these spectra resemble in shape and width the one taken by de Ruijter onCba. tepidum, Figure 6a [58]. Therefore, we ascribe the different appearance of the spectrumfrom [12] to matrix effects and exclude this spectrum from the further discussion.
Visual inspection of the reconstructed ensemble LD spectra from the mutants shownat the bottom of Figure 5c,d reveals that these spectra, apart from being clearly narrower,resemble in shape the other conventional ensemble LD spectra. As mentioned above thereduced width of these spectra reflects the diminished sample heterogeneity of the mutants.For better comparison of the spectral profiles, we multiplied the widths of the mutantLD spectra with a factor of 2.5 and overlaid them with the available conventional LDspectra from the literature, Figure 6d. The value of 2.5 was chosen because it gave thebest match for the comparison. We note that this value is also reasonably close to thefactors of about 1.8 that were found for the reduction of the inhomogeneous linewidthsboth for the ensemble absorption spectra and the single chlorosome excitation spectra fromCba. tepidum upon mutagenesis [43,44]. These comparisons yield nearly a perfect match,providing strong evidence that the discrepancy between the reconstructed WT ensemblespectrum and the ensemble LD spectrum from [58] observed in Figure 6a is ‘real’, andcannot be ascribed to the limited statistics.
As we have pointed out above, single-chlorosome and ensemble LD spectroscopyare supposed to give equivalent results only for the case that the secondary structuralelements are incorporated into the chlorosomes according to a unique scheme. This tendsus to conclude that this prerequisite is well fulfilled for the mutants and only in part forthe WT chlorosomes. This is in agreement with cryo-electron microscopy data obtainedon chlorosomes from Cba. tepidum, where a “more regular cylindrical organization” wasfound for the secondary structures of a mutant, whereas for the WT the tubular structureswere “embedded in a matrix of structurally less defined assemblies” [4,7,13]. Given thehigh degree of internal organization for the chlorosomes from the mutants and in part forthe WT our findings support the speculation made earlier that for these chlorosomes thesecondary structures extend through the full length of the chlorosomes [7].

Molecules 2021, 26, 899 12 of 16Molecules 2021, 26, x FOR PEER REVIEW 12 of 16
Figure 6. (a) Comparison of ensemble LD spectra from chlorosomes from the WT of Cba. tepidum.
The noisy line (black) corresponds to the sum LD spectrum from 72 individual chlorosomes, the
dashed line to the spectrum from [58], and the full line to the spectrum from ref [12]. (b) Ensemble
LD spectrum from the WT of Ptc. aestuarii from [58]. (c) Ensemble LD spectra from the WT of C.
aurantiacus. The spectra have been taken from [17–22,61] For better comparison all spectra have
been normalized. (d) Same spectra as in (c) overlaid with the reconstructed ensemble spectra
(method 1) for the bchR (green) and bchQR (red) mutants from Cba. tepidum. For facilitating this
comparison, the widths of the reconstructed spectra have been multiplied by factor of 2.5, which
gave the best agreement with the ensemble LD spectra from the WT of C. aurantiacus.
For WT-group2 the polarization properties of the bands 𝐴1 and 𝐴2 do clearly not
comply with an underlying cylindrical symmetry for the secondary structural elements,
whereas the mutual orthogonal polarization of the bands 𝐴3 and 𝐴4 does at least not ex-
clude this morphology. As has been shown in [12], mutually orthogonal transition-dipole
moments do not necessarily require closed tubular molecular assemblies. An anisotropy
that allows to define a preferential axis, as for example for a quarter of a cylinder or a
rolled lamella, is already sufficient to obtain to a good approximation such spectral signa-
tures. We may speculate that the less defined assemblies observed in cryo-electron mi-
croscopy might arise from WT-group2 chlorosomes, and that such chlorosomes contain a
mixture of structural elements, some resembling lamella that are rolled up to different
extents, others that are more similar to undulated sheets. Furthermore, it might be possi-
ble that the differences between the two groups of WT chlorosomes are associated with
Figure 6. (a) Comparison of ensemble LD spectra from chlorosomes from the WT of Cba. tepidum.The noisy line (black) corresponds to the sum LD spectrum from 72 individual chlorosomes, thedashed line to the spectrum from [58], and the full line to the spectrum from ref [12]. (b) EnsembleLD spectrum from the WT of Ptc. aestuarii from [58]. (c) Ensemble LD spectra from the WT ofC. aurantiacus. The spectra have been taken from [17–22,61] For better comparison all spectra havebeen normalized. (d) Same spectra as in (c) overlaid with the reconstructed ensemble spectra(method 1) for the bchR (green) and bchQR (red) mutants from Cba. tepidum. For facilitating thiscomparison, the widths of the reconstructed spectra have been multiplied by factor of 2.5, whichgave the best agreement with the ensemble LD spectra from the WT of C. aurantiacus.
For WT-group2 the polarization properties of the bands A1 and A2 do clearly notcomply with an underlying cylindrical symmetry for the secondary structural elements,whereas the mutual orthogonal polarization of the bands A3 and A4 does at least notexclude this morphology. As has been shown in [12], mutually orthogonal transition-dipolemoments do not necessarily require closed tubular molecular assemblies. An anisotropythat allows to define a preferential axis, as for example for a quarter of a cylinder ora rolled lamella, is already sufficient to obtain to a good approximation such spectral
Molecules 2021, 26, 899 13 of 16
signatures. We may speculate that the less defined assemblies observed in cryo-electronmicroscopy might arise from WT-group2 chlorosomes, and that such chlorosomes containa mixture of structural elements, some resembling lamella that are rolled up to differentextents, others that are more similar to undulated sheets. Furthermore, it might be possiblethat the differences between the two groups of WT chlorosomes are associated with thegrowing stage of the bacteria, and that there is a gradual transition between WT-group2and WT-group1 chlorosomes.
5. Materials and Methods
The experimental data used in this paper for reconstructing the LD spectra have beenobtained from samples that were prepared by Don Bryant and coworkers (The PennsylvaniaState University, State College, PA, USA) [2,9,59–61], and have been published in [43,44].All experiments have been conducted at 1.2 K. Detailed descriptions of the experimentalprotocols and procedures are given in the references.
6. Conclusions
For the comparison of the polarization-resolved spectroscopy on individual chloro-somes with ensemble LD spectroscopy we disposed over detailed information about thesingle-chlorosome absorption bands beforehand. Taking advantage of this informationbrought us to the conclusion that the molecular packing within the secondary structuresas well as the overall alignment of the secondary structures within the chlorosomes isreasonably uniform for the mutants, and less uniform for the WT.
In general, the reconstruction of the LD spectra leads to an inherent loss of informationwith respect to the polarization-resolved fluorescence-excitation spectra, and it turns outthat for complex molecular aggregates the information that can be extracted from LDspectroscopy alone is rather limited. Commonly, LD spectroscopy cannot disentangle thenumber and relative strengths of multiple transitions that contribute to an absorption band.In particular for the chlorosomes, it has to be taken into account that in an experiment on amacroscopic sample the central alignment direction refers to the alignment of the chloro-somes, rather than to the alignment of the secondary structures within the chlorosomes.However, the optical response to polarized light stems solely from the secondary structuralelements within the chlorosomes, whose precise alignment with respect to the long axisof the chlorosomes is not necessarily uniform. Hence, based on LD spectroscopy on en-sembles of chlorosomes alone, it is extremely difficult to obtain reliable information aboutthe mutual orientation of transition-dipole moments of the BChl monomers within thechlorosomes. Altogether this explains the discrepancies between the numerical values thatwere proposed for the angle between the transition-dipole moments of the BChl monomersand the symmetry axis of the secondary structures, ranging from 15–40◦ [17–22,58,61], andthe value of about 55◦ that was found in [43,44], and which is in very close agreement withwhat has been found for a biomimetic model system [49]. For the individual chlorosomes,the reconstruction of the LD spectra uncovers clear differences in the spectral profiles withrespect to widths and spectral shape, which were all averaged out in the correspondingensemble LD spectra. It appears that LD spectroscopy alone is not suited to be used forbenchmarking structural models of more intricate molecular assemblies.
Supplementary Materials: The following are available online, Figure S1: Comparison of LD recon-struction methods 1 and 2, Figure S2: Comment on observing nodes in the LD spectra.
Author Contributions: Conceptualization, L.M.G., J.K. (Jasper Knoester), J.K. (Jürgen Köhler);Methodology, L.M.G., J.K. (Jasper Knoester), J.K. (Jürgen Köhler); Validation, J.K. (Jasper Knoester),J.K. (Jürgen Köhler); formal analysis, J.K. (Jasper Knoester), J.K. (Jürgen Köhler); investigation, L.M.G.;data curation, L.M.G.; writing—original draft preparation, J.K. (Jürgen Köhler); writing—review andediting, L.M.G., J.K. (Jasper Knoester); visualization, L.M.G.; supervision, J.K. (Jasper Knoester), J.K.(Jürgen Köhler), project administration, J.K. (Jürgen Köhler); funding acquisition, J.K. (Jürgen Köhler).All authors have read and agreed to the published version of the manuscript.
Molecules 2021, 26, 899 14 of 16
Funding: This research was funded by Deutsche Forschungsgemeinschaft (GRK1640, Ko 1359/27-1)and the State of Bavaria within the initiative “Solar Technologies go Hybrid.
Institutional Review Board Statement: Not applicable.
Informed Consent Statement: Not applicable.
Data Availability Statement: Data is contained within the article or supplementary material. Thedata presented in this study are available in [Günther, L.M.; et al. J. Phys. Chem. B 2016, 120,5367–5376, and Günther, L.M.; et al. J. Phys. Chem. B 2018, 122, 6712–6723.].
Acknowledgments: We thank Alexander Löhner, Marc Jendrny, Carolin Reiher, Tobias Meier, Car-men Wolfring, Eric Bloemsma, Tenzin Kunzel, Thomas Jansen, Marcus Tank, and Don Bryant, whocontributed to the previously published polarization-resolved fluorescence excitation spectroscopy,its theoretical analysis and the associated sample preparation.
Conflicts of Interest: The authors declare no conflict of interest.
References1. Saer, R.G.; Blankenship, R.E. Light harvesting in phototrophic bacteria: Structure and function. Biochem. J. 2017, 474, 2107–2131.
[CrossRef]2. Bryant, D.A.; Canniffe, D.P. How nature designs light-harvesting antenna systems: Design principles and functional realization
in chlorophototrophic prokaryotes. J. Phys. B At. Mol. Opt. 2018, 51, 33001. [CrossRef]3. Beatty, J.T.; Overmann, J.; Lince, M.T.; Manske, A.K.; Lang, A.S.; Blankenship, R.E.; van Dover, C.L.; Martinson, T.A.; Plumley, F.G.
An obligately photosynthetic bacterial anaerobe from a deep-sea hydrothermal vent. Proc. Natl. Acad. Sci. USA 2005, 102,9306–9310. [CrossRef] [PubMed]
4. Oostergetel, G.T.; van Amerongen, H.; Boekema, E.J. The chlorosome: A prototype for efficient light harvesting in photosynthesis.Photosynth. Res. 2010, 104, 245–255. [CrossRef]
5. Overmann, J.; Cypionka, H.; Pfennig, N. An extremely low-light adapted phototrophic sulfur bacterium from the Black Sea.Limnol. Oceangr. 1992, 37, 150–155. [CrossRef]
6. Alster, J.; Kabelác, M.; Tuma, R.; Pšencík, J.; Burda, J.V. Computational study of short-range interactions in bacteriochlorophyllaggregates. Comput. Theor. Chem. 2012, 998, 87–97. [CrossRef]
7. Oostergetel, G.T.; Reus, M.; Gomez Maqueo Chew, A.; Bryant, D.A.; Boekema, E.J.; Holzwarth, A.R. Long-range organizationof bacteriochlorophyll in chlorosomes of Chlorobium tepidum investigated by cryo-electron microscopy. FEBS Lett. 2007, 581,5435–5439. [CrossRef]
8. Chew, A.G.M.; Bryant, D.A. Chlorophyll biosynthesis in bacteria: The origins of structural and functional diversity. Annu. Rev.Microbiol. 2007, 61, 113–129. [CrossRef]
9. Liu, Z.; Bryant, D.A. Bacteriochlorophyll biosynthesis and assembly in green chlorophototrophic bacteria: Theme and variations.In Handbook of Porphyrin Science: With Applications to Chemistry, Physics, Materials Science, Engineering, Biology and Medicine;Kadish, K.M., Smith, K.M., Guilard, R., Eds.; World Scientific Publishing: Singapore, 2012; pp. 107–140.
10. Blankenship, R.E.; Olson, J.M.; Miller, M. Antenna complexes from green photosynthetic bacteria. In Anoxygenic PhotosyntheticBacteria; Blankenship, R.E., Madigan, M.T., Bauer, C.E., Eds.; Kluwer Academic Publishers: Dordrecht, The Netherlands, 1995;pp. 399–435, ISBN 978-0-306-47954-0.
11. Tamiaki, H.; Tateishi, S.; Nakabayashi, S.; Shibata, Y.; Itoh, S. Linearly polarized light absorption spectra of chlorosomes,light-harvesting antennas of photosynthetic green sulfur bacteria. Chem. Phys. Lett. 2010, 484, 333–337. [CrossRef]
12. Furumaki, S.; Vacha, F.; Habuchi, S.; Tsukatani, Y.; Bryant, D.A.; Vacha, M. Absorption linear dichroism measured directly on asingle light-harvesting system: The role of disorder in chlorosomes of green photosynthetic bacteria. J. Am. Chem. Soc. 2011, 133,6703–6710. [CrossRef]
13. Ganapathy, S.; Oostergetel, G.T.; Reus, M.; Tsukatani, Y.; Gomez Maqueo Chew, A.; Buda, F.; Bryant, D.A.; Holzwarth, A.R.;de Groot, H.J.M. Structural variability in wild-type and bchQ bchR mutant chlorosomes of the green sulfur bacterium chlorobac-ulum tepidum. Biochemistry-US 2012, 51, 4488–4498. [CrossRef]
14. Ganapathy, S.; Oostergetel, G.T.; Wawrzyniak, P.K.; Reus, M.; Gomez Maqueo Chew, A.; Buda, F.; Boekema, E.J.; Bryant, D.A.;Holzwarth, A.R.; de Groot, H.J.M. Alternating syn-anti bacteriochlorophylls form concentric helical nanotubes in chlorosomes.Proc. Natl. Acad. Sci. USA 2009, 106, 8525–8530. [CrossRef]
15. Pšencík, J.; Butcher, S.J.; Tuma, R. Chlorosomes: Structure, Function and Assembly. Struct. Basis Biol. Energy Gener. 2014, 39,77–109. [CrossRef]
16. Fetisova, Z.G.; Kharchenko, S.G.; Abdourakhmanov, I.A. Strong orientational ordering of the near-infrared transition momentvectors of light-harvesting antenna bacterioviridin in chromatophores of the green photosynthetic bacterium Chlorobium limicola.FEBS Lett. 1986, 199, 234–236. [CrossRef]
17. Van Dorssen, R.J.; Vasmel, H.; Amesz, J. Pigment organization and energy transfer in the green photosynthetic bacteriumChloroflexus aurantiacus: II. The chlorosome. Photosynth. Res. 1986, 9, 33–45. [CrossRef] [PubMed]
Molecules 2021, 26, 899 15 of 16
18. Van Amerongen, H.; Vasmel, H.; van Grondelle, R. Linear Dichroism of Chlorosomes from Chloroflexus Aurantiacus inCompressed Gels and Electric Fields. Biophys. J. 1988, 54, 65–76. [CrossRef]
19. Griebenow, K.; Holzwarth, A.R.; van Mourik, F.; van Grondelle, R. Pigment organization and energy transfer in green bacteria.2. Circular and linear dichroism spectra of protein-containing and protein-free chlorosomes isolated from Chloroflexus aurantiacusstrain Ok-70-fl. Biochim. Biophy. Acta Bioenerg. 1991, 1058, 194–202. [CrossRef]
20. Frese, R.; Oberheide, U.; van Stokkum, I.; van Grondelle, R.; Foidl, M.; Oelze, J.; van Amerongen, H. The organization of bayteri-ochlorophyll c in clorosomes from Chloroflexus aurantiacus and the structural role of carotenoids and protein. Photosynthesis Res.1997, 54, 115–126. [CrossRef]
21. Matsuura, K.; Hirota, M.; Shimada, K.; Mimuro, M. Spectral forms and orientation of bacteriochlorophylls c and α in chlorosomesof the green photosynthetic bacterium Chloroflexus aurantiacus. Photochem. Photobiol. 1993, 57, 92–97. [CrossRef]
22. Betti, J.A.; Blankenship, R.E.; Natarajan, L.V.; Dickinson, L.C.; Fuller, R.C. Antenna organization and evidence for the function ofa new antenna pigment species in the green photosynthetic bacterium Chloroflexus aurantiacus. Biochim. Biophy. Acta Bioenerg.1982, 680, 194–201. [CrossRef]
23. Tian, Y.; Camacho, R.; Thomsson, D.; Reus, M.; Holzwarth, A.R.; Scheblykin, I.G. Organization of Bacteriochlorophylls inIndividual Chlorosomes from Chlorobaculum tepidum Studied by 2-Dimensional Polarization Fluorescence Microscopy. J. Am.Chem. Soc. 2011, 133, 17192–17199. [CrossRef]
24. Furumaki, S.; Yabiku, Y.; Habuchi, S.; Tsukatani, Y.; Bryant, D.A.; Vacha, M. Circular Dichroism Measured on Single ChlorosomalLight-Harvesting Complexes of Green Photosynthetic Bacteria. J. Phys. Chem. Lett. 2012, 3, 3545–3549. [CrossRef] [PubMed]
25. Saga, Y.; Wazawa, T.; Mizoguchi, T.; Ishii, Y.; Yanagida, T.; Tamiaki, H. Spectral heterogeneity in single light-harvestingchlorosomes from green sulfur photosynthetic bacterium Chlorobium tepidum. Photochem. Photobiol. 2002, 75, 433. [CrossRef]
26. Saga, Y.; Tamiaki, H.; Shibata, Y.; Itoh, S. Excitation energy transfer in individual light-harvesting chlorosome from greenphotosynthetic bacterium Chloroflexus aurantiacus at cryogenic temperature. Chem. Phys. Lett. 2005, 409, 34–37. [CrossRef]
27. Shibata, Y.; Saga, Y.; Tamiaki, H.; Itoh, S. Low-temperature fluorescence from single chlorosomes, photosynthetic antennacomplexes of green filamentous and sulfur bacteria. Biophys. J. 2006, 91, 3787–3796. [CrossRef] [PubMed]
28. Jendrny, M.; Aartsma, T.J.; Köhler, J. Fluorescence excitation spectra from individual chlorosomes of the green sulfur bacteriumChlorobaculum tepidum. J. Phys. Chem. Lett. 2012, 3, 3745–3750. [CrossRef]
29. Jendrny, M.; Aartsma, T.J.; Köhler, J. Insights into the excitonic states of individual chlorosomes from Chlorobaculum tepidum.Biophys. J. 2014, 106, 1921–1927. [CrossRef]
30. Ikonen, T.P.; Li, H.; Pšencík, J.; Laurinmaki, P.A.; Butcher, S.J.; Frigaard, N.-U.; Serimaa, R.E.; Bryant, D.A.; Tuma, R. X-rayscattering and electron cryomicroscopy study on the effect of carotenoid biosynthesis to the structure of Chlorobium tepidumchlorosomes. Biophys. J. 2007, 93, 620–628. [CrossRef]
31. Pšencík, J.; Ikonen, T.P.; Laurinmaki, P.; Merckel, M.C.; Butcher, S.J.; Serimaa, R.E.; Tuma, R. Lamellar organization of pigments inchlorosomes, the light harvesting complexes of green photosynthetic bacteria. Biophys. J. 2004, 87, 1165–1172. [CrossRef]
32. Li, X.; Buda, F.; de Groot, H.J.M.; Sevink, G.J.A. Contrasting Modes of self-assembly and hydrogen-bonding heterogeneity inchlorosomes of Chlorobaculum tepidum. J. Phys. Chem. C Nanomater. Interfaces 2018, 122, 14877–14888. [CrossRef]
33. Li, X.; Buda, F.; de Groot, H.J.M.; Sevink, G.J.A. Dynamic disorder drives exciton transfer in tubular chlorosomal assemblies. J.Phys. Chem. B 2020, 125, 4026–4035. [CrossRef]
34. Linnanto, J.M.; Korppi-Tommola, J.E.I. Investigation on chlorosomal antenna geometries: Tube, lamella and spiral-type self-aggregates. Photosynth. Res. 2008, 96, 227–245. [CrossRef] [PubMed]
35. Kasha, M.; Rawls, H.R.; El-Bayoumi, A.M. The exciton model in molecular spectroscopy. Pure Appl. Chem. 1965, 11. [CrossRef]36. Hestand, N.J.; Tempelaar, R.; Knoester, J.; Jansen, T.L.C.; Spano, F.C. Exciton mobility control through sub−Å packing modifica-
tions in molecular crystals. Phys. Rev. B 2015, 91. [CrossRef]37. Hestand, N.J.; Spano, F.C. Molecular Aggregate photophysics beyond the Kasha Model: Novel design principles for organic
materials. Acc. Chem. Res. 2017, 50, 341–350. [CrossRef] [PubMed]38. Brixner, T.; Hildner, R.; Köhler, J.; Lambert, C.; Würthner, F. Exciton transport in molecular aggregates—From natural antennas to
synthetic chromophore systems. Adv. Energy Mater. 2017, 7, 1700236. [CrossRef]39. Davydov, A.S. Theory of Molecular Excitons; Plenum Press: New York, NY, USA, 1971.40. Knox, R.S. Theory of Excitons. In Theory of Excitons; Ehrenreich, H., Seitz, F., Turnbull, D., Eds.; Academic Press: Cambridge, MA,
USA, 1963.41. Garab, G. Linear and Circular Dichroism. In Biophysical Techniques in Photosynthesis. Advances in Photosynthesis and Respiration;
Amesz, J., Hoff, A.J., Eds.; Springer: Dordrecht, The Netherland, 1996; pp. 11–40. [CrossRef]42. Günther, L.M.; Jendrny, M.; Bloemsma, E.A.; Tank, M.; Oostergetel, G.T.; Bryant, D.A.; Knoester, J.; Köhler, J. Structure of
light-harvesting aggregates in individual chlorosomes. J. Phys. Chem. B 2016, 120, 5367–5376. [CrossRef]43. Günther, L.M.; Löhner, A.; Reiher, C.; Kunsel, T.; Jansen, T.L.C.; Tank, M.; Bryant, D.A.; Knoester, J.; Köhler, J. Structural variations
in chlorosomes from wild-type and a bchQR mutant of Chlorobaculum tepidum revealed by single-molecule spectroscopy. J.Phys. Chem. B 2018, 122, 6712–6723. [CrossRef]
44. Li, X.; Buda, F.; de Groot, H.J.M.; Sevink, G.J.A. Molecular insight in the optical response of tubular chlorosomal assemblies. J.Phys. Chem. C 2019, 124, 16462–16478. [CrossRef]

Molecules 2021, 26, 899 16 of 16
45. Balaban, S.; Tamiaki, H.; Holzwarth, A.R. Chlorins programmed for self-assembly. In Supermolecular Dye Chemistry;Würthner, F., Ed.; Springer: Berlin/Heidelberg, Germany, 2005; pp. 1–38, ISBN 978-3-540-27758-3.
46. Sengupta, S.; Ebeling, D.; Patwardhan, S.; Zhang, X.; von Berlepsch, H.; Bottcher, C.; Stepanenko, V.; Uemura, S.; Hentschel, C.;Fuchs, H.; et al. Biosupramolecular nanowires from chlorophyll dyes with exceptional charge-transport properties. Angew. Chem.Int. Edit. 2012, 51, 6378–6382. [CrossRef]
47. Eisele, D.M.; Arias, D.H.; Fu, X.; Bloemsma, E.A.; Steiner, C.P.; Jensen, R.A.; Rebentrost, P.; Eisele, H.; Tokmakoff, A.; Lloyd, S.; et al.Robust excitons inhabit soft supramolecular nanotubes. Proc. Natl. Acad. Sci. USA 2014, 111, E3367–E3375. [CrossRef]
48. Löhner, A.; Kunsel, T.; Röhr, M.I.S.; Jansen, T.L.C.; Sengupta, S.; Würthner, F.; Knoester, J.; Köhler, J. Spectral and structuralvariations of biomimetic light-harvesting nanotubes. J. Phys. Chem. Lett. 2019, 10, 2715–2724. [CrossRef] [PubMed]
49. Didraga, C.; Pugžlys, A.; Hania, P.R.; von Berlepsch, H.; Duppen, K.; Knoester, J. Structure, spectroscopy, and microscopic modelof tubular carbocyanine dye aggregates. J. Phys. Chem. B 2004, 108, 14976–14985. [CrossRef]
50. Eisele, D.M.; Cone, C.W.; Bloemsma, E.A.; Vlaming, S.M.; van der Kwaak, C.G.F.; Silbey, R.J.; Bawendi, M.G.; Knoester, J.;Rabe, J.P.; Vanden Bout, D.A. Utilizing redox-chemistry to elucidate the nature of exciton transitions in supramolecular dyenanotubes. Nat. Chem. 2012, 4, 655–662. [CrossRef] [PubMed]
51. Stradomska, A.; Knoester, J. Shape of the Q band in the absorption spectra of porphyrin nanotubes: Vibronic coupling or excitoneffects? J. Chem. Phys. 2010, 133, 94701. [CrossRef]
52. Spitz, C.; Knoester, J.; Ouart, A.; Daehne, S. Polarized absorption and anomalous temperature dependence of fluorescencedepolarization in cylindrical J-aggregates. Chem. Phys. 2002, 275, 271–284. [CrossRef]
53. Didraga, C.; Knoester, J. Excitons in tubular molecular aggregates. J. Lumin. 2004, 110, 239–245. [CrossRef]54. Didraga, C.; Klugkist, J.A.; Knoester, J. Optical properties of helical cylindrical molecular aggregates: The homogeneous limit. J.
Phys. Chem. B 2002, 106, 11474–11486. [CrossRef]55. Frigaard, N.-U.; Chew, A.G.M.; Li, H.; Maresca, J.A.; Bryant, D.A. Chlorobium tepidum: Insights into the structure, physiology,
and metabolism of a green sulfur bacterium derived from the complete genome sequence. Photosynth. Res. 2003, 78, 93–117.[CrossRef]
56. Vlaming, S.M.; Bloemsma, E.A.; Nietiadi, M.L.; Knoester, J. Disorder-induced exciton localization and violation of optical selectionrules in supramolecular nanotubes. J. Chem. Phys. 2011, 134, 114507. [CrossRef]
57. de Ruijter, W.P.F.; Magis, J.G.; Miller, M.; Aartsma, T.J. Photodynamics of Light-Harvesting Systems—Structural Variations inChlorosomes Revealed by Single Particle Spectroscopy and AFM; Universiteit Leiden: Leiden, The Netherlands, 2005.
58. Chew, A.G.M.; Frigaard, N.-U.; Bryant, D.A. Bacteriochlorophyllide c C-82 and C-121 methyltransferases are essential foradaptation to low light in Chlorobaculum tepidum. J. Bacteriol. 2007, 189, 6176–6184. [CrossRef]
59. Maresca, J.A.; Chew, A.G.M.; Ros Ponsati, M.; Frigaard, N.-U.; Ormerod, J.G.; Bryant, D.A. The bchU gene of Chlorobiumtepidum encodes the C-20 methyltransferase in bacteriochlorophyll c biosynthesis. J. Bacteriol. 2004, 186, 2558–2566. [CrossRef]
60. Abetz, V. Isoporous block copolymer membranes. Macromol. Rapid Commun. 2015, 36, 10–22. [CrossRef] [PubMed]61. Vassilieva, E.V.; Frigaard, N.-U.; Bryant, D.A. Chlorosomes: The light-harvesting complexes of the green bacteria. Spectrum (Cent.
Photochem. Sci.) 2000, 13, 7–13.