Design and Structural Thermal Analysis of Gas Turbine Rotor Blade with Radial Holes using Solidworks

Structural Holes and Good IdeasAuthor(s): Ronald S. BurtReviewed work(s):Source: American Journal of Sociology, Vol. 110, No. 2 (September 2004), pp. 349-399Published by: The University of Chicago PressStable URL: http://www.jstor.org/stable/10.1086/421787 .Accessed: 29/11/2011 10:59
Your use of the JSTOR archive indicates your acceptance of the Terms & Conditions of Use, available at .http://www.jstor.org/page/info/about/policies/terms.jsp
JSTOR is a not-for-profit service that helps scholars, researchers, and students discover, use, and build upon a wide range ofcontent in a trusted digital archive. We use information technology and tools to increase productivity and facilitate new formsof scholarship. For more information about JSTOR, please contact [email protected].
The University of Chicago Press is collaborating with JSTOR to digitize, preserve and extend access toAmerican Journal of Sociology.
http://www.jstor.org

AJS Volume 110 Number 2 (September 2004): 349–99 349
� 2004 by The University of Chicago. All rights reserved.0002-9602/2004/11002-0004$10.00
Structural Holes and Good Ideas1
Ronald S. BurtUniversity of Chicago
This article outlines the mechanism by which brokerage providessocial capital. Opinion and behavior are more homogeneous withinthan between groups, so people connected across groups are morefamiliar with alternative ways of thinking and behaving. Brokerageacross the structural holes between groups provides a vision of op-tions otherwise unseen, which is the mechanism by which brokeragebecomes social capital. I review evidence consistent with the hy-pothesis, then look at the networks around managers in a largeAmerican electronics company. The organization is rife with struc-tural holes, and brokerage has its expected correlates. Compensation,positive performance evaluations, promotions, and good ideas aredisproportionately in the hands of people whose networks spanstructural holes. The between-group brokers are more likely to ex-press ideas, less likely to have ideas dismissed, and more likely tohave ideas evaluated as valuable. I close with implications for cre-ativity and structural change.
The hypothesis in this article is that people who stand near the holes ina social structure are at higher risk of having good ideas. The argumentis that opinion and behavior are more homogeneous within than betweengroups, so people connected across groups are more familiar with alter-
1 Portions of this material were presented as the 2003 Coleman Lecture at the Universityof Chicago, at the Harvard-MIT workshop on economic sociology, in workshops atthe University of California at Berkeley, the University of Chicago, the University ofKentucky, the Russell Sage Foundation, the Stanford Graduate School of Business,the University of Texas at Dallas, Universiteit Utrecht, and the “Social Aspects ofRationality” conference at the 2003 meetings of the American Sociological Association.I am grateful to Christina Hardy for her assistance on the manuscript and to severalcolleagues for comments affecting the final text: William Barnett, James Baron, Jon-athan Bendor, Jack Birner, Matthew Bothner, Frank Dobbin, Chip Heath, RachelKranton, Rakesh Khurana, Jeffrey Pfeffer, Joel Podolny, Holly Raider, James Rauch,Don Ronchi, Ezra Zuckerman, and two AJS reviewers. I am especially grateful toPeter Marsden for his comments as discussant at the Coleman Lecture. Direct cor-respondence to Ron Burt, Graduate School of Business, University of Chicago, Chi-cago, Illinois 60637. E-mail: [email protected]

American Journal of Sociology
350
native ways of thinking and behaving, which gives them more optionsto select from and synthesize. New ideas emerge from selection and syn-thesis across the structural holes between groups. Some fraction of thosenew ideas are good. “Good” will take on specific meaning with empiricaldata, but for the moment, a good idea broadly will be understood to beone that people praise and value.
Novelty is not a feature of this hypothesis. It is familiar in the socio-logical theory of Simmel ([1922] 1955) on conflicting group affiliations orMerton ([1948] 1968a, [1957] 1968c) on role sets and serendipity in science.The hypothesis is so broadly familiar, in fact, that one can see it in theremarks of prominent creatives. For example, discussing commerce andmanners, Adam Smith ([1766] 1982, p. 539) noted that “when the mindis employed about a variety of objects it is some how expanded andenlarged.” Swedberg (1990, p. 3) begins his book on academics workingthe boundary between economics and sociology with John Stuart Mills’s([1848] 1987, p. 581) opinion that “it is hardly possible to overrate thevalue . . . of placing human beings in contact with persons dissimilar tothemselves, and with modes of thought and action unlike those with whichthey are familiar. . . . Such communication has always been, and is pe-culiarly in the present age, one of the primary sources of progress.” Jean-Rene Fourtou, former CEO of the French chemical giant Rhone-Poulenc,observed that his scientists were stimulated to their best ideas by peopleoutside their own discipline. Fourtou emphasized le vide—literally, theemptiness; conceptually, structural holes—as essential to coming up withnew ideas (Stewart 1996, p. 165): “Le vide has a huge function in orga-nizations. . . . Shock comes when different things meet. It’s the interfacethat’s interesting. . . . If you don’t leave le vide, you have no unexpectedthings, no creation. There are two types of management. You can try todesign for everything, or you can leave le vide and say, ‘I don’t knoweither; what do you think?’” Biochemist Alex Zaffaroni is an exemplar.A former subordinate is quoted in an INSEAD video case explainingZaffaroni’s value to his organization: “He is reading and thinking verywidely. He is totally unafraid of any new technology in any area of humancreativity. He has wonderful contacts with people in many different areas,so he sees the bridges between otherwise disparate fields.”2
2 Also see Hatch (1999) on the importance of empty places to the integrated impro-visation among jazz musicians playing together, Giuffe (1999) on the greater attentiongiven to photographers with careers in networks of sparsely connected photographers,and more broadly, White (1993) on art as a struggle to establish identity in a networkof brokering arrangements among agents and other artists. Productive analogy can bedrawn to Merton’s (1968a) view of serendipity in science. Expanding on research’sfamiliar passive role in testing theory, Merton discusses active roles that research canplay in shaping theory, one of which is the serendipity pattern in which an “unantic-

Structural Holes and Good Ideas
351
Though the hypothesis might lack novelty, it is intrinsically interestingto people who work with ideas and has a role in the theory of socialcapital. The link between good ideas and structural holes is key to thesocial capital of brokerage. I begin, in the next section, explaining howbrokerage across structural holes provides a vision advantage that cantranslate into social capital. I then turn to a study population rich instructural holes and in which people are rewarded for building relationsacross the holes. If brokerage affects performance through the proposedvision advantage, there should be evidence of brokerage being associatedwith good ideas. I find that there is.
SMALL WORLDS, BROKERAGE, AND THE VISION ADVANTAGE
Social capital exists where people have an advantage because of theirlocation in a social structure. There is a great variety of work on thesubject (e.g., Coleman 1990; Portes 1998; Lin 2002). The generic contextis a social structure such as the one illustrated in figure 1. This figureshows a sociogram in which lines indicate where information flows moreroutinely, or more clearly, between people or groups, which are representedby dots. Solid lines indicate stronger flow. The defining features of thesocial structure are clusters of dense connection linked by occasionalbridge relations between clusters. As a point of reference for later dis-cussion, a network segment is enlarged in the overlay box to highlightfour clusters. Clusters A, B, and C are variably closed-network groupsin the sense that relations are more dense within than between the groups.(The density table within the figure shows average relations within andbetween groups.) Cluster D (represented by open dots in the figure) isdefined by structural equivalence. (The density table shows that peoplein cluster D have stronger relations with group C than with one another.)Structures of clusters connected by bridges occur in a wide variety ofcircumstances across different levels of aggregation (Watts and Strogatz1998). Whether communities in a geographic region, divisions in a cor-poration, groups within a profession, or members of a team, people spe-cialize within clusters and integrate via bridges across clusters.
ipated, anomalous, and strategic datum” exerts pressure for initiating theory (p. 158).Serendipity must involve an unanticipated result (datum) inconsistent with establishedfacts or the theory being tested, but the third attribute, strategic, is the key thatdistinguishes Merton’s view. The strategic value of a research result lies in its impli-cations for generalized theory, by which Merton (1968a, p. 159) refers to “what theobserver brings to the datum rather than to the datum itself.” Research has strategicvalue when an observer sees how a finding has implications for what other people seeas unrelated theory. The creative spark on which serendipity depends, in short, is tosee bridges where others see holes.

Fig. 1.—The small world of markets and organizations

Structural Holes and Good Ideas
353
The social structure represented in figure 1 corresponds to a divisionof labor familiar from Durkheim ([1893] 1933) but here focused on networkstructure within and across cluster specializations. Illustrative work ineconomics on factors responsible for such structures ranges from Hayek(1937, 1945) on the division of labor dependent on coordination acrossindividuals with specialized knowledge (see Birner [1999] for explicit net-work imagery) to Becker and Murphy (1992) on the incentives to integraterather than specialize (cf. Meltzer [2001] on integrating specialists in med-ical care). Network studies of such structures in sociology are illustratedby Feld (1981) on the social foci responsible for network clusters, buildingon Festinger, Schachter, and Back’s (1950) analysis of location effects innetwork formation and Blau’s (1977) work on integration parameters ofsocial structure (cf. Bothner, Stuart, and White [2003] on cohesion withstatus differentiation). Applications to organization networks show thereproduction of ties (e.g., Gulati 1995; Gulati and Gargiulo 1999) in robustbridge-and-cluster structures (e.g., Kogut and Walker 2001; Baum, Ship-ilov, and Rowley 2003).
Two leadership roles are highlighted and are illustrated by Robert andJames in figure 1. These two roles have long been studied in the litera-ture—for example, Schumpeter ([1912] 1934) on entrepreneurial “leaders”bringing together elements from separate production spheres in whichpeople live by routines, Merton ([1949] 1968b) and Katz and Lazarsfeld(1955) on the diffusion of tastes through cosmopolitan “opinion leaders”whose relationships bridge the gaps between social worlds (see also Burt1999), Rees (1966) on “extensive” search for information on job oppor-tunities versus “intensive” search for information about a specific oppor-tunity, Milgram (1967) and Travers and Milgram (1969) on the “smallworld” phenomenon in which people at great geographic distance cancommunicate with one another through surprisingly few intermediariesbecause of bridges between social worlds (see Watts 1999), Granovetter(1973) on the critical role that “weak ties” would play in information accessand flow if bridge relations were weak rather than strong, Burt (1982,1992) on the information access and control advantages created whenrelations span the “structural holes” between groups, March (1991) onorganizations “exploring” for new opportunities versus “exploiting” knownrevenue streams, or Padgett and Ansell (1993) on the “robust action” madepossible by structural holes between groups (cf. Fernandez and Gould[1993] on government agents bridging structural holes). A theme in thiswork is that behavior, opinion, and information, broadly conceived, aremore homogeneous within than between groups. People focus on activitiesinside their own group, which creates holes in the information flow be-tween groups, or more simply, structural holes.
Robert is better positioned than James for the social capital of bro-

American Journal of Sociology
354
kerage. The seven people connected to James are densely connected withone another within cluster B. The seven people connected to Robert arenot connected with one another and are drawn from separate groups A,B, and C. Where James is positioned to integrate the work of people whohave much in common, Robert is positioned to benefit from differencesbetween people who vary in their behavior and opinions. Where Jamesis positioned to drive variation out of group B, Robert is positioned tointroduce into group B variation from groups A and C, with which heis familiar. Given greater homogeneity within than between groups, peoplewhose networks bridge the structural holes between groups have earlieraccess to a broader diversity of information and have experience in trans-lating information across groups. This is the social capital of brokerage(Burt 1992, 2000, 2002). People whose networks bridge the structural holesbetween groups have an advantage in detecting and developing rewardingopportunities. Information arbitrage is their advantage. They are able tosee early, see more broadly, and translate information across groups. Likeover-the-horizon radar in an airplane, or an MRI in a medical procedure,brokerage across the structural holes between groups provides a visionof options otherwise unseen.
There are shades of gray. Robert is better positioned than James forbrokerage, but note in the figure 1 insert box how James connects anorthern and southern segment of cluster B. Within his immediate en-vironment, James has strong ties to both segments and so is positionedto broker their integration. The caution here is that structural holes andbrokerage can be found in almost any task, depending on point of view.
That caution stated, there is abundant and accumulating empiricalevidence of increased returns to brokerage—in terms of more positiveperformance evaluations, faster promotions, higher compensation, andmore successful teams (e.g., see Burt [2000, 2002] for review and Lin[2002] for broader context). There are also returns of a less desirable kind,such as success in organized crime (Williams 1998; Morselli 2003), fraud(Tillman and Indergaard 1999), or corporate misgovernance (Mitchell2003, on Enron and Worldcom). Whatever the returns, constructive orcorrosive, the issue in this article is not whether brokerage yields returns;at issue is the mechanism by which brokerage yields its documentedreturns.
Evidence on the mechanism is not abundant. Initial research establishedthe social capital potential of brokerage by focusing on aggregate andcontingent returns to brokerage. The association cannot be causal. Net-works do not act, they are a context for action. The next phase of workis to understand the information arbitrage by which people acting asbrokers harvest the value buried in structural holes. Padgett and Ansell’s(1993) description of robust action is an exemplar. More generally, the

Structural Holes and Good Ideas
355
sociology of information will be central in the work, but there are manyvariations.
For example, consider four levels of brokerage through which a personcould create value. The simplest act of brokerage is to make people onboth sides of a structural hole aware of interests and difficulties in theother group. People who can communicate these issues between groupsare important because so much conflict and confusion in organizationsresults from misunderstandings of the constraints on colleagues in othergroups. Transferring best practice is a higher level of brokerage. Peoplefamiliar with activities in two groups are more able than people confinedwithin either group to see how a belief or practice in one group couldcreate value in the other and to know how to translate the belief or practiceinto language digestible in the target group. A third level of brokerage isto draw analogies between groups ostensibly irrelevant to one another.People who recognize that the way other groups think or behave mayhave implications for the value of operations in their own group will havean advantage over those who do not. This step can be difficult, especiallyfor people who have spent a long time inside one group. Such peopleoften look for differences between themselves and others to justify theirassertion that “our situation is different” so they can feel comfortableignoring beliefs and behaviors different from their own. Differences canalways be found if one wants to find them. The question is whether thereare, by analogy, elements of belief or practice in one group that couldhave value in another. Synthesis is a fourth level of brokerage. Peoplefamiliar with activities in two groups are more likely to see new beliefsor behaviors that combine elements from both groups.3
3 I ignore idea content across the four levels of brokerage in idea production. I havetwo reasons: data and traction. It would be difficult to accurately and reliably evaluateideas across a foreign content domain. Below, I defer to senior management in thestudy population. Second, I have no tools that provide novel insights into idea content(relative to the network analysis tools that can pry open the link between ideas andsocial structure). The presumption in this article is that the content of ideas reflectsthe social structure in which they emerge. If you vary the groups to which a personis attached, you vary the content of the person’s ideas. I do not believe that this isentirely true, but my hypothesis is that there is some truth to it. The other extremewould be to ignore social structure to focus entirely on the organization of bits andbytes within an idea. Czernich and Heath (2001) provide an illustration. They describethe dot-com evolution of the idea that Web site value increases with its number ofviewers. They describe analogies to other ideas and recombinations of elements withinthe idea. Sociologists will recognize the sociolinguistics of ethnomethodology and theindexical nature of expressions in the analysis (e.g., Denzin 1969; Hudson 1980), butthe familiar microlevel insights are used by Czernich and Heath to describe macrolevelchange in market rhetoric. The subject could be analyzed from the perspective of thisarticle. The brokerage hypothesis says that analogies and recombinations in the evo-lution of “eyeballs to Web sites” should have come from people with attachments tothe separate groups focused on the elements across which analogies and combinations

American Journal of Sociology
356
Given these four levels of information arbitrage, one could draw theconclusion from industry and organization stories that brokers are criticalto learning and creativity. People whose networks span structural holeshave early access to diverse, often contradictory, information and inter-pretations, which gives them a competitive advantage in seeing goodideas. To be sure, ideas come over a variety of paths from a variety ofsources (e.g., Von Hippel 1988; Geroski and Mazzucato 2002; Menon andPfeffer 2003), but idea generation at some point involves someone movingknowledge from this group to that, or combining bits of knowledge acrossgroups. Where brokerage is social capital, there should be evidence ofbrokerage being associated with good ideas, and vice versa.
EVIDENCE ANECDOTAL AND AGGREGATE
Anecdotal evidence for the outlined hypothesis can be found in the re-marks of prominent creatives, such as the quotes from Mills and Fourtouwith which I introduced this article. Archives on historical figures linkbrokerage and ideas in wider perspective. For example, Caro (1982, chap.15) describes Lyndon Johnson’s creation of a Washington power base in1933 from the “Little Congress,” through which he brokered connectionsbetween journalists and prominent people in government. Dalzell (1987,p. 1) describes Francis Lowell’s role as broker in creating the Americancotton industry. DiMaggio (1992, esp. pp. 129–30) describes Paul Sachs’srole as broker in establishing the Museum of Modern Art in New York:“Sachs could employ his talents precisely because his strong ties to sectorsthat had previously been only weakly connected—museums, universities,and finance—placed him at the center of structural holes that were criticalto the art world of his time.” Padgett and Ansell (1993) describe Cosimode Medici’s use of contacts with opposing family factions to establish hisMedicean political party in Renaissance Florence. McGuire and Grano-vetter (in press) describe Samuel Insull’s use of his network of contactsin finance, politics, and technology to shape the electric utility industryat the turn of the century (cf. Sediatis [1998, esp. pp. 373–74] on thegreater flexibility, adaptability, and volume of business in Russian com-
were made. For example, Collins (1987, p. 67) refers to an imaginary social life ofintellectuals (cf. White [1993] on the dialogue between artist and art world and Collins[1998, chap. 1] for elaboration): “The intellectual alone, reading or writing . . . is notmentally alone. His or her ideas are loaded with social significance, because theysymbolize membership in existing and prospective coalitions in the intellectual network.New ideas are created as combinations of old ones; and the intellectual’s creativeintuitions are feelings of what groups these ideas are appealing to [and against whichintellectual enemies]. The market structure of the intellectual world is transposed intothe creative individual’s mind”).

Structural Holes and Good Ideas
357
modity markets created by organizers who had little previous contactwith one another and Granovetter [2002] on polycentric networks facil-itating economic cooperation). In his panoramic analysis of the history ofphilosophy, Collins presents sociograms of intergenerational social net-works among philosophers to illustrate his argument that the philosophersof greatest repute tended to be rivals representing conflicting schools ofthought for their generation: “The famous names, and the semi-famousones as well who hold the stage less long, are those persons situated atjust those points where the networks heat up the emotional energy to thehighest pitch. Creativity is the friction of the attention space at the mo-ments when the structural blocks are grinding against one another thehardest” (Collins 1998, p. 76).
There is related evidence of this at the aggregate level of organizations.In particular, it has been popular to study the ways in which technologicalchange affects social structure at the same time that social structure affectstechnological advance (e.g., Barley [1990, pp. 92–95] provides crisp illus-tration with network data). Electronics and biotechnology have been fa-vored research sites, with the works of Walter Powell (e.g., Powell andBrantley 1992; Powell, Koput, and Smith-Doerr 1996; Powell et al. 1999;Koput and Powell 2003) and Toby Stuart (Stuart 1998; Stuart, Hoang,and Hybels 1999; Stuart and Podolny 1999; Sorenson and Stuart 2001)serving as prominent ports of entry into the research. More generally,Kogut (2000) builds on a series of papers (e.g., Kogut and Zander 1992,1996; Walker, Kogut, and Shan 1997; Kogut and Walker 2001) to proposea network theory of the firm in which value is derived from a firm’sability to create and lay claim to knowledge derived from its own mem-bership and participation in networks (cf. Nahapiet and Ghoshal [1998]on social capital and knowledge and Powell and Smith-Doerr [1994] oninformation issues in the economic sociology of networks, especially withrespect to interorganization networks). Structural holes are a correlate oforganizational learning, often discussed in terms of ability to learn—whatCohen and Levinthal (1990, p. 128) describe as an organization’s ab-sorptive capacity, that is, “the ability of a firm to recognize the value ofnew, external information, assimilate it, and apply it to commercial ends,”which can be studied in terms of industry factors, internal networks, andexternal networks that enhance absorptive capacity (see Argote 1999;Kogut 2000; Knoke 2001; Argote, McEvily, and Reagans 2003).
Organizations with management and collaboration networks thatbridge structural holes in their markets seem to learn faster and be moreproductively creative. Sutton and Hargadon (1996) describe processes bywhich a firm, IDEO, used brainstorming to create product designs. Theythen clarify in Hargadon and Sutton (1997) the brokerage function served(see Hargadon [2002] for broader discussion). The firm has clients in

American Journal of Sociology
358
diverse industries. In the brainstorming sessions, technological solutionsfrom one industry are used to solve client issues in other industries wherethe solutions are rare or unknown. The firm profited, in other words,from bridge relations through which employees brokered technology flowbetween industries (cf. Allen and Cohen [1969] on gatekeepers, Lazegaand Pattison [2001] on network management of status auctions, Argote[1999] and Argote et al. [2003] on organizations moving down a learningcurve). Fleming (2002) describes such a process within Hewlett-Packardwhere company policy was to move engineers between projects ratherthan having each project hire and fire individually. The result was thatHewlett-Packard technologies were constantly mixed in new combina-tions. As an engineer described the experience: “I had to work in a singlefield for only two or three years and then like magic it was a whole newfield; a paradise for creativity” (Fleming 2002, p. 1073).
Similar results are available across organizations. Provan and Milward(1995) show higher performance from mental-health systems with a hi-erarchical rather than a dense network structure. Geletkanycz and Ham-brick (1997) report higher company performance when top managers haveboundary-spanning relationships beyond their firm and beyond their in-dustry. McEvily and Zaheer (1999) report greater access to competitiveideas for small manufacturers with more nonredundant sources of advicebeyond the firm (and McEvily and Marcus [2002] show lower absorptivecapacity when the sales network is concentrated in a single customer).Stuart and Podolny (1999) report a higher probability of innovation fromsemiconductor firms that establish alliances with firms outside their owntechnological area. Comparing biotechnology districts in Minneapolis andPhiladelphia, Llobrera, Meyer, and Nammacher (2000) attribute thegrowth and adaptation of Philadelphia’s district to its many nonredundantnetworks around organizations in the district. Baum, Calabrese, and Sil-verman (2000) study Canadian companies in biotechnology for growth inrevenues, number of patents granted, and the extent to which a companyhad multiple kinds of alliance partners at start-up. Companies with aheterogeneous mix of alliance partners enjoyed faster revenue growth anda dramatic advantage in obtaining patents. Koput and Powell (2003)report higher earnings and survival chances of biotechnology firms withmore kinds of activities in alliances with more kinds of partner firms.Podolny (2001) describes venture-capital firms spanning structural holesby linking coinvestors that were not otherwise investing together. Firmswith a “deal-flow” network that often spans structural holes invest moreoften in early product development—where the information benefits ofspanning structural holes could be a competitive advantage in detectingpotentially valuable ideas—and are more successful in developing theirearly-stage investments into profitable IPOs (cf. Beckman and Haunschild

Structural Holes and Good Ideas
359
[2002] on firms with more heterogeneous boards of directors paying lowerpremiums for acquisitions, Ruef [2002] on the tendency for entrepreneurs“attempting to combine disparate ideas or routines” to discuss their ven-ture with varied kinds of contacts, Shane and Cable [2002] on early-stageinvestors using social networks to decide between ventures, and Pollock,Porac, and Wade [2003] for a review of the brokerage role in creatingdeal networks).
SUPPLY CHAIN IN A LARGE ELECTRONICS COMPANY
The cited work offers anecdotal and aggregate evidence consistent withthe hypothesis that brokerage increases the risk of having a good idea.To study the hypothesis at the level of individual people proposing ideas,I draw on data describing 673 managers who ran the supply chain in2001 for one of America’s largest electronics companies. Here, as in mostwalks of life, people vary in the quality of their ideas. The study populationwas going through a leadership change triggered by exogenous events.The incoming leadership thought that a Web-based network analysiswould be a quick way to become familiar with the current informalorganization of leaders in the supply chain. They believed that knowingthe current organization would be useful for thinking about and com-municating future strategy.
Background Data
Data on manager backgrounds were taken from company personnel rec-ords. This provided the organization division and the geographic sitewhere a manager worked, as well as the manager’s job rank. An executiverank was composed of people with job titles of director or vice president.Below them were senior managers, followed by managers 3, 2, and 1.Further, managers at all ranks were assigned to one of two roles in thesupply chain: some purchased goods from external vendors, while othersmoved goods inside the company. I include the role distinction becausepurchasing pays a higher salary ($22,111 higher on average, 5.4 t-test)and could affect a manager’s ideas about the supply chain since it involvescontacts in other companies.
I recorded manager education because it is so integral to the conceptof human capital, especially for a study of ideas. A substantial numberof the managers had gone to graduate school (25% held master’s degrees,and 3% held doctorates). A similar number had less than a college degree(17% had some college, short of a bachelor’s degree, and 10% had a highschool education or less). I also looked at race (86% of the study population
American Journal of Sociology
360
was white), gender (26% female), and marital status (78% married), butnone was a statistically significant predictor or slope-adjustment in theanalysis, so they are not reported.
Judging from age and seniority, there was a great deal of work expe-rience in the study population. The average manager was 50 years old,had worked 18 years in the company, and had known his or her citeddiscussion partners for 8 years. Many managers had spent their wholecareer in the company. A large number had spent their whole career inthe industry. Age turned out to be more strongly correlated with perfor-mance and idea value, so I use age as the control for work experience.
Network Data
Network data were collected by the standard survey method of namegenerators and interpreters (e.g., Marsden 1990, 2004). The Web-basedquestionnaire contained two name generators. After managers were askedfor an idea to improve the supply chain (below), they were asked if theyhad discussed the idea with anyone. If yes, they were asked to providethe name of the person with whom they had discussed the idea. Nextthey were asked, “More generally, who are the people with whom youmost often discuss supply-chain issues?” The questionnaire then listed twoname interpreters. The first asked for years of acquaintance with eachcited person. The second asked about connections among the cited con-tacts. To answer, the respondent was guided through a matrix in whichthe respondent’s perceived connection between each pair of cited peoplewas coded as “often,” “sometimes,” or “rarely” in regards to how oftenthey discussed supply-chain issues with one another. Of the 673 managers,455 completed the network questions (68%). Another 149 supply-chainmanagers of varying ranks were cited by respondents and so were includedin the network data because respondents described relations among con-tacts. There are 193 social isolates in the study population (29%). Theseisolates must have had a circle of local contacts, but they were not citedas a discussion partner by any other supply-chain manager.4
4 Respondents are, by and large, representative of the study population. I have back-ground and performance data on all 673 managers so I can compare the 218 nonre-spondents to the 455 who responded. In a logit model predicting response from 16background and performance variables in table 1, plus gender and race, there are nosignificant differences between respondents and nonrespondents except one—managersrecently promoted were more likely to respond (2.8 z-score test statistic for the de-pendent variable in model 4 in table 1). With 18 predictors, this one statisticallysignificant difference is acceptable. The zero-order difference is that 58% of promotedpeople responded vs. 46% respondent rate among people not promoted in the year ofthe survey.

Structural Holes and Good Ideas
361
The survey provides 5,010 observations of 4,139 relationships distin-guishing five levels of connection between two people: (1) one person citedthe other as someone with whom their idea was discussed and with whomsupply-chain issues were frequently discussed, or colleague(s) reported thatthe two people often discussed supply-chain issues (1,363 relations,strength 1.00); (2) one cited the other as someone with whom he or shefrequently discussed supply-chain issues, but not as someone with whomtheir idea was discussed (1,188 relations, strength .86); (3) colleagues saidthat the two people sometimes discussed supply-chain issues, but neithercited the other (675 relations, strength .65); (4) one cited the other onlyas someone with whom their idea was discussed (333 relations, strength.50); or (5) neither person cited the other, and colleagues said the twopeople rarely discussed supply-chain issues (580 relations, strength .00).5
The survey provides 1,072 discussion partners, 480 of whom were sup-
5 Quantitative scores for relationships are based on loglinear analysis of the surveynetwork data. Here are loglinear test statistics for relations between cited contacts:
Rare Sometimes Often
No citation 8.5 3.3 �11.6Yes-No �1.6 �2.9 .6No-Yes �2.5 2.4 5.8Yes-Yes �5.2 1.9 11.7
The three columns distinguish relations by the perceived strength of connection be-tween a pair of cited contacts (“rarely,” “sometimes,” or “often” discussing supply-chainissues). The four rows distinguish relations by citations. The possibilities are that twopeople did not cite one another, they cited one or the other only on the first-namegenerator (discussed best idea), they cited one or the other only on the second-namegenerator (frequently discuss supply-chain issues), or they cited one or the other onboth name generators. The first row of the table shows that uncited relations werelikely to be perceived as “rare” discussion (8.5 z-score) and extremely unlikely to beperceived as “often” (�11.6 z-score). The bottom two rows of the table show thatpeople cited as frequent discussion partners were perceived as “often” discussing sup-ply-chain issues with the respondent (5.8 and 11.7 z-scores). A one-dimensional loglinearassociation model yields the following raw scores for the rows and columns: �.74,�.06, .45, and .65 for the rows, �.76, .15, and .64 for the columns. Normalizing rawscores to vary from zero (minimum connection) to one (maximum connection) yieldsthe scores reported in the text. Where multiple observations of a relationship arecontradictory, I use the strongest reported value. For example, if one manager citedanother as a frequent discussion partner, and there is a second observation in whicha mutual colleague reported that the two managers “sometimes” discuss supply-chainissues, connection between the two managers is set to .86 because of the strongerconnection implied by the direct citation. Consistency is more typical than contradic-tion: stronger relations were more likely to be cited by both managers involved, morelikely to be reported by multiple respondents, and more likely to be reported betweenpeople perceived to often discuss supply-chain issues. At the other extreme, managersperceived to “rarely” discuss supply-chain issues almost never cited one another.
American Journal of Sociology
362
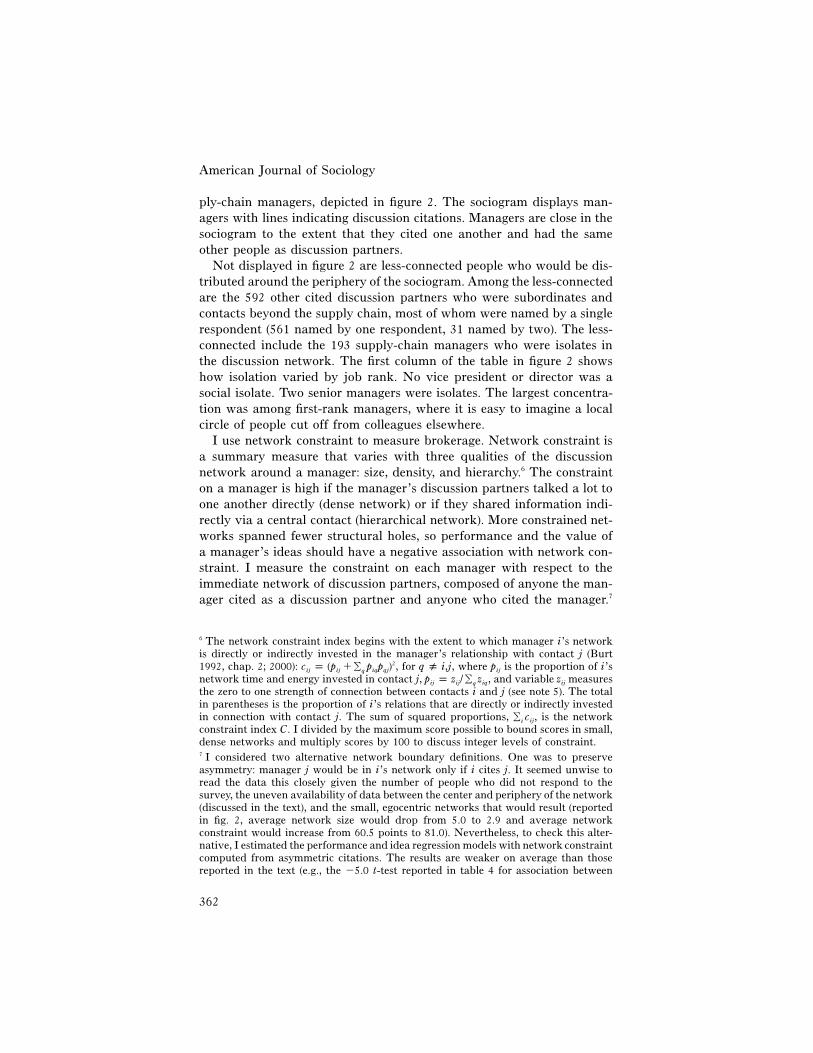
ply-chain managers, depicted in figure 2. The sociogram displays man-agers with lines indicating discussion citations. Managers are close in thesociogram to the extent that they cited one another and had the sameother people as discussion partners.
Not displayed in figure 2 are less-connected people who would be dis-tributed around the periphery of the sociogram. Among the less-connectedare the 592 other cited discussion partners who were subordinates andcontacts beyond the supply chain, most of whom were named by a singlerespondent (561 named by one respondent, 31 named by two). The less-connected include the 193 supply-chain managers who were isolates inthe discussion network. The first column of the table in figure 2 showshow isolation varied by job rank. No vice president or director was asocial isolate. Two senior managers were isolates. The largest concentra-tion was among first-rank managers, where it is easy to imagine a localcircle of people cut off from colleagues elsewhere.
I use network constraint to measure brokerage. Network constraint isa summary measure that varies with three qualities of the discussionnetwork around a manager: size, density, and hierarchy.6 The constrainton a manager is high if the manager’s discussion partners talked a lot toone another directly (dense network) or if they shared information indi-rectly via a central contact (hierarchical network). More constrained net-works spanned fewer structural holes, so performance and the value ofa manager’s ideas should have a negative association with network con-straint. I measure the constraint on each manager with respect to theimmediate network of discussion partners, composed of anyone the man-ager cited as a discussion partner and anyone who cited the manager.7
6 The network constraint index begins with the extent to which manager i’s networkis directly or indirectly invested in the manager’s relationship with contact j (Burt1992, chap. 2; 2000): , for , where is the proportion of i’s2c p (p �� p p ) q ( i,j pij ij iq qj ijq
network time and energy invested in contact j, , and variable measuresp p z /� z zij ij iq ijq
the zero to one strength of connection between contacts i and j (see note 5). The totalin parentheses is the proportion of i’s relations that are directly or indirectly investedin connection with contact j. The sum of squared proportions, , is the network� ciji
constraint index C. I divided by the maximum score possible to bound scores in small,dense networks and multiply scores by 100 to discuss integer levels of constraint.7 I considered two alternative network boundary definitions. One was to preserveasymmetry: manager j would be in i’s network only if i cites j. It seemed unwise toread the data this closely given the number of people who did not respond to thesurvey, the uneven availability of data between the center and periphery of the network(discussed in the text), and the small, egocentric networks that would result (reportedin fig. 2, average network size would drop from 5.0 to 2.9 and average networkconstraint would increase from 60.5 points to 81.0). Nevertheless, to check this alter-native, I estimated the performance and idea regression models with network constraintcomputed from asymmetric citations. The results are weaker on average than thosereported in the text (e.g., the �5.0 t-test reported in table 4 for association between
Structural Holes and Good Ideas
363
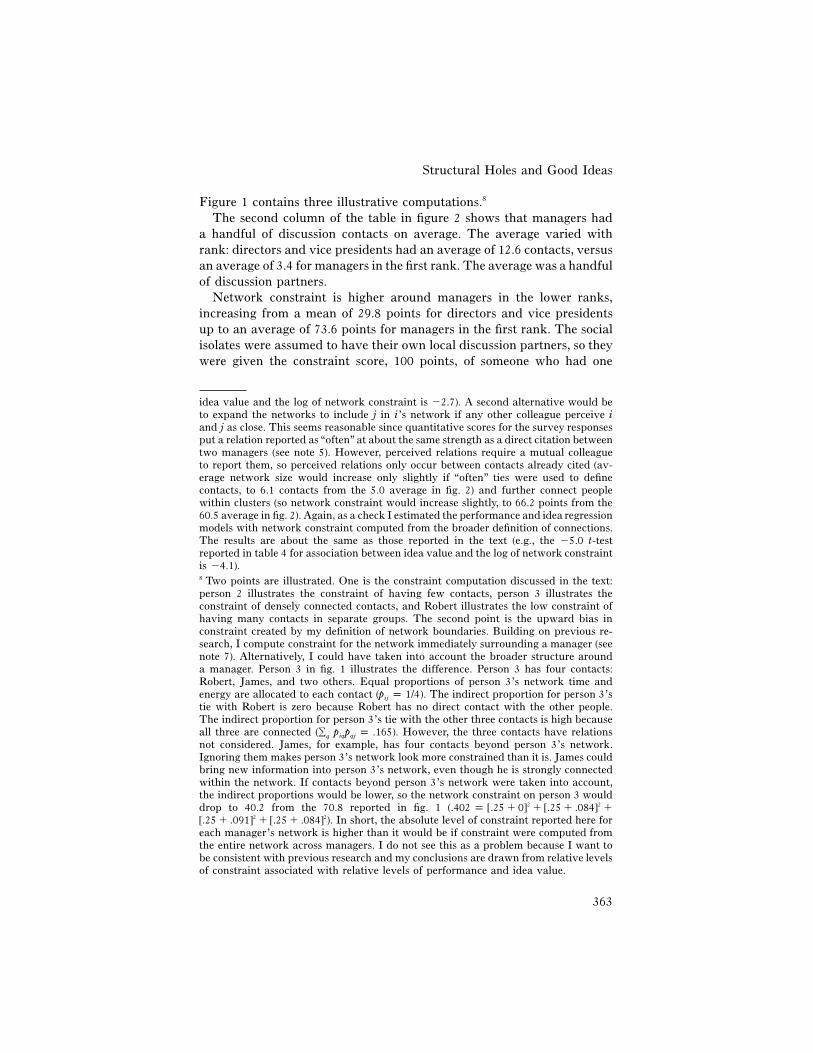
Figure 1 contains three illustrative computations.8
The second column of the table in figure 2 shows that managers hada handful of discussion contacts on average. The average varied withrank: directors and vice presidents had an average of 12.6 contacts, versusan average of 3.4 for managers in the first rank. The average was a handfulof discussion partners.
Network constraint is higher around managers in the lower ranks,increasing from a mean of 29.8 points for directors and vice presidentsup to an average of 73.6 points for managers in the first rank. The socialisolates were assumed to have their own local discussion partners, so theywere given the constraint score, 100 points, of someone who had one
idea value and the log of network constraint is �2.7). A second alternative would beto expand the networks to include j in i’s network if any other colleague perceive iand j as close. This seems reasonable since quantitative scores for the survey responsesput a relation reported as “often” at about the same strength as a direct citation betweentwo managers (see note 5). However, perceived relations require a mutual colleagueto report them, so perceived relations only occur between contacts already cited (av-erage network size would increase only slightly if “often” ties were used to definecontacts, to 6.1 contacts from the 5.0 average in fig. 2) and further connect peoplewithin clusters (so network constraint would increase slightly, to 66.2 points from the60.5 average in fig. 2). Again, as a check I estimated the performance and idea regressionmodels with network constraint computed from the broader definition of connections.The results are about the same as those reported in the text (e.g., the �5.0 t-testreported in table 4 for association between idea value and the log of network constraintis �4.1).8 Two points are illustrated. One is the constraint computation discussed in the text:person 2 illustrates the constraint of having few contacts, person 3 illustrates theconstraint of densely connected contacts, and Robert illustrates the low constraint ofhaving many contacts in separate groups. The second point is the upward bias inconstraint created by my definition of network boundaries. Building on previous re-search, I compute constraint for the network immediately surrounding a manager (seenote 7). Alternatively, I could have taken into account the broader structure arounda manager. Person 3 in fig. 1 illustrates the difference. Person 3 has four contacts:Robert, James, and two others. Equal proportions of person 3’s network time andenergy are allocated to each contact ( ). The indirect proportion for person 3’sp p 1/4ij
tie with Robert is zero because Robert has no direct contact with the other people.The indirect proportion for person 3’s tie with the other three contacts is high becauseall three are connected ( ). However, the three contacts have relations� p p p .165iq qjq
not considered. James, for example, has four contacts beyond person 3’s network.Ignoring them makes person 3’s network look more constrained than it is. James couldbring new information into person 3’s network, even though he is strongly connectedwithin the network. If contacts beyond person 3’s network were taken into account,the indirect proportions would be lower, so the network constraint on person 3 woulddrop to 40.2 from the 70.8 reported in fig. 1 ( 2 2.402 p [.25 � 0] � [.25 � .084] �
). In short, the absolute level of constraint reported here for2 2[.25 � .091] � [.25 � .084]each manager’s network is higher than it would be if constraint were computed fromthe entire network across managers. I do not see this as a problem because I want tobe consistent with previous research and my conclusions are drawn from relative levelsof constraint associated with relative levels of performance and idea value.

Fig. 2.—Supply-chain discussion network (excludes 193 social isolates)

Structural Holes and Good Ideas
365
discussion partner or a completely interconnected circle of discussion part-ners (a control for the social isolates is tested in the analysis).
BROKERAGE OPPORTUNITIES
The study population was three ways rich in opportunities for brokerage.First, these managers were a functional silo relatively isolated from therest of the company. Social leaders in the supply chain are indicated infigure 2 by dense intersections of relations with other managers. In con-trast, managers toward the periphery of the sociogram often have a singlerelationship back into the network (e.g., managers 409, 208, 499, 329, 444at the top of fig. 2). That single tendril far from the center of the systemis the pattern of a peripheral person; they are connected into the network,but only barely. That pattern characterizes connections beyond the supplychain. Many people were named (592 outside vs. 480 inside the supplychain), but almost all were named by a single respondent (95%). The fewnamed by multiple respondents were cited twice. None were named bymore than two respondents. In other words, no business leaders outsidethe supply chain were a focus of supply-chain discussion. The supply-chain managers primarily turned to one another—which was an oppor-tunity for enterprising managers to build bridging ties out to the businessunits to better integrate supply-chain processes into production.
Second, there were structural holes between business units in the or-ganization. The center of the sociogram in figure 2 is corporate head-quarters. Clusters of managers within business units radiate from thecenter like five spokes on a wheel. The clusters appear in the sociogramto the southeast, south, southwest, northwest, and northeast. To make theclusters more apparent, I looked more closely at the top 89 senior peopleto see the core of the supply-chain network, drawn in figure 3. Managersare close together in figure 3 to the extent that they cited one another andhad the same other people as discussion partners. Shaded areas indicatebusiness units. Managers not in a shaded area work at corporate head-quarters. The many lines in the shaded areas show discussion concentratedwithin business units. There are 514 connections in the sociogram at thetop of figure 3: 321 between managers in the same business unit (62%),178 with managers at headquarters (35%), and a meager 15 direct con-nections between managers in different business units (3%). To highlightthe concentration, I removed the headquarters’ managers. Connectionsto headquarters are bridges of a kind, but they are also a continuationof the bureaucratic structure up from each division. In contrast, directdiscussion between managers in separate divisions cuts across lines ofcorporate control. The sociogram at the bottom of figure 3—exactly the

American Journal of Sociology
366
Fig. 3.—Core network in the supply chain
sociogram at the top, but with headquarters removed—provides a starkillustration of the fragile contact across business units. Again, the orga-nization is rich with opportunities for an enterprising manager to discoverand bring home best practice in other divisions and, by so doing, toenhance coordination across the supply chain.
A third category of opportunities was between individual managers.

Structural Holes and Good Ideas
367
Managers on average were surrounded by a small clique of colleagueswith whom they discussed their work. The second to the last column infigure 2 is the mean network constraint among a manager’s cited dis-cussion partners. The average across ranks is a near-maximum 81.0, andthe 70.2 average for the highest-rank managers is not much lower. To putthis in more concrete terms, discussion partners were reported 52% of thetime to “often” discuss supply-chain issues with one another, and 80%were reported to at least “sometimes” discuss supply-chain issues withone another. As a frame of reference for these averages, Marsden (1987)reports an average network density of 62% for a national probabilitysample of Americans citing about the same number of discussion partners.However, half of the cited contacts were family, so Marsden’s densityaverage would have been lower if contacts were limited to work. Burt(2000) reports a 27.9 average level of colleague network constraint forabout a thousand senior managers drawn from five study populations,an average much lower than those in figure 2, even with controls fornetwork size.9
Despite dense clustering within business units and around individualmanagers, the managers in figure 2 are connected by short path distances.Path distance is the minimum number of relations required to connecttwo people. Path distance to direct contacts is one. Path distance to friendsof direct contacts is two, and so on. In tracing a path of indirect con-nections from one side to the other in figure 2, intermediaries add upquickly. A computer search shows that the longest path distance is 11steps. The average is just 4.2 steps.
The average path distance varies with job rank. The last column offigure 2 shows more senior people with shorter path distances across thesupply chain (3.3 mean for directors and vice presidents vs. 4.6 mean for
9 The thousand senior managers were able to name a larger number of contacts thanallowed in the supply-chain survey, so accurate comparison requires a control fornetwork size. The constraint-size equation in the baseline data is , where NbNC p a(e )is the number of contacts in a manager’s network, C is the projected level of networkconstraint for networks of size N, the estimated coefficients a and b are 48.7 and �.075,respectively. Estimating the equation for the supply-chain discussion network yields
for network constraint among cited discussion partners (second to last�.10N68.4(e )column in fig. 2) and for constraint when the network is expanded to include�.12N60.8(e )people citing the manager (third column in fig. 2). The intercepts show high levels ofnetwork constraint in the supply chain. The standard error for the intercept is onepoint in both study-population equations, so test statistics are large for the 20-pointdifference between the baseline 48.7 level of constraint for five-contact networks vs.the mean 68.4 constraint among discussion partners in the supply chain, or the mean60.8 constraint in the broader networks including people who cited a manager.

American Journal of Sociology
368
manager 1).10 For example, senior managers on average required 3.7 stepsto reach anyone in figure 2—that is, one direct connection to a colleague,plus two intermediaries past the colleague, to reach anyone. The best-connected actors could reach everyone in 2.9 steps on average. The worst-connected actors required an average of 6.4 steps (putting aside the twosenior managers who were social isolates). Shorter paths to more seniorpeople is to be expected since more senior people had more bridgingrelations, indicated by their lower levels of network constraint, so theycould more often reach directly out of their own social cluster into others(mean path distance is correlated .57 with network constraint in fig. 2and .55 for the 89 people in fig. 3).
The connection with job rank means that senior people were moreresponsible for connections across the supply chain. A histogram of figure2 path distances peaks over the average of four steps. The distributionlooks the same for the core network of 89 people at the top of figure 3,except the distribution shifts one step shorter (average path distance is4.2 steps in fig. 2 vs. 3.2 steps at the top of fig. 3). In other words,connections across the supply chain are primarily determined by pathdistances among the 89 people at the top of figure 3. The excluded less-connected managers in figure 2 require one connection to access the corenetwork in figure 3, which then connects them across the supply chain.Within the core network, removing the headquarters managers increasesaverage path distance by two steps (3.2 mean path distance at the top offig. 3 is 5.2 at the bottom of fig. 3). Without the headquarters managers,communication across the business units would depend on getting to thefew people who occupy the 15 positions at the bottom of figure 3 thatbridge business units.
In short, formal chains of command were integral to communicationacross the supply chain. This is illustrated by the critical role that head-quarters played in shortening path distances across business units and bythe tendency for managers to turn to a small clique of interconnectedcolleagues to discuss supply-chain issues. With respect to brokerage op-portunities, a setting dependent on formal chains of command for com-munication is a setting rich in opportunities for managers to coordinatedirectly across the formal chains.
10 Average path distances are computed across 476 managers instead of all 480 in fig.2 because I excluded the four people in the two disconnected dyads in the lower-rightcorner of fig. 2. Path distance is infinite to colleagues outside their isolated dyads.

Structural Holes and Good Ideas
369
BROKERAGE INCENTIVES
The many opportunities for brokerage raise a question about incentives.If managers have incentives to coordinate across structural holes in andaround the supply chain, why do so many holes still exist?
It is easy to imagine the lack of incentive. For example, the networkstructure just described would result from managers being encouraged tofocus on their immediate assignments and to rely on headquarters forstrategic thinking about how to coordinate across the supply chain. Infact, such a view was crisply stated to me by a program manager de-scribing how he ran his group: “I don’t want my people even thinkingabout alternatives. They spend two weeks thinking about an alternative,only to learn that what we have is 90% as good. The result is that theywasted two weeks and I’m behind schedule. I get some complaints aboutstifling creativity, but all I want is to be good enough and on schedule.”If one combines this view with a premium on personal loyalty from sub-ordinates and considers the relative ease with which complex knowledgemoves over strong connections between people in a dense network (Rea-gans and McEvily 2003), one can quickly imagine an organization ofmanagers rewarded for sticking to an interconnected circle of colleaguesfocused on their immediate tasks.
Despite views such as the one quoted above, the company, in practice,actually recognized and rewarded brokerage. Managers who often dis-cussed supply-chain issues with managers in other groups were betterpaid, received more positive job evaluations, and were more likely to bepromoted.
Salary
Salary measures an employee’s accumulated performance in that nextyear’s salary is typically an incremental addition to current salary. Per-formance was reviewed annually by each manager’s supervisor. Salaryand evaluation data for this analysis come from company personnel rec-ords for the annual cycle six months before the network survey, and thesubsequent cycle six months after the survey. Salaries increased slightlyin the second year (5.5% on average, 0% minimum, 30% maximum), butrelative salary did not change much between the years (.99 correlationbetween salaries in the two years, .96 partial correlation with job rankand age held constant). I use salary current at the time of the networksurvey (rather than aggregating across the years) because salary is sohighly correlated between the years and I have complete data on salaryat the time of the survey (there was 5.2% turnover in managers between

American Journal of Sociology
370
the two years, and I have no second-year salary data for managers wholeft the firm).
Models 1 and 2 in table 1 describe the association between salary andbrokerage. Job rank is an obvious control: the average salary of a first-rank manager was $31,099 less than the average salary of a manager inthe third rank. Senior managers, on average, had salaries $19,638 higherthan a third-rank manager. Intercepts are not presented for models 1 and2 to preserve confidentiality. Effects are expressed with respect to man-agers in the third rank as a reference group. Beyond job rank, managersplayed two assigned roles in the supply chain: some purchased goods fromexternal vendors, while others moved goods within the company. Thosewho dealt with external vendors (purchasing) had higher salaries, but thedifference is statistically negligible when job rank and age are held con-stant. Education was not directly associated with salary, but managerswere compensated for experience. Salary increased with age ($338 peryear on average). People tend to spend their whole career within thisindustry, so years in the company were less correlated with salary thanyears of age (6.5 t-test for age in table 1 vs. 2.1 for years in the company).
To hold constant differences between business units, I regressed theresiduals from job rank, job role, age, and education across dummy var-iables distinguishing 15 business units. Salaries were significantly low inthe one unit for which supplies were largely commodity goods so supply-chain managers were not required to have technical expertise (“LowTech”in table 1). Salaries were significantly high in four units where supply-chain managers had to deal with higher-end electronic equipment andcomponents (“HighTech” in table 1).
I then took studentized residuals from the regression model includingthe two organization controls (LowTech and HighTech) and distributedthe residuals across a map of the United States to find pockets of deviantsalaries. Residuals were significantly high in two high-cost urban areas,defined by control variables “Urban 1” and “Urban 2” in table 1.
The above control variables measuring job rank, role, age, education,business unit, and location account for 78.6% of salary variance acrossthe 673 managers. The amount by which a manager’s salary exceeds, orfalls below, the salary expected from his or her rank, role, age, education,business unit, and location measures the company view of the manager’sperformance relative to peers.
That view is correlated with brokerage, as described by the results inthe bottom five rows of table 1. The “network constraint” row is theassociation with brokerage for first-rank managers, then the next fourrows are slope adjustments for stronger or weaker associations at eachof the other ranks. The five rows at the bottom of table 1 for models 1and 2 show no association with network constraint for managers in the

Structural Holes and Good Ideas
371
TABLE 1Predicting Performance
1Salary
2Salary
3Evaluation
4Promotion
Manager 1 . . . . . . . . . . . . �31,099** (2,882) �35,707** (3,498) �.973 (.678) .689 (.670)Manager 2 . . . . . . . . . . . . �16,652** (2,745) �19,892** (3,479) �.863 (.631) 1.165 (.648)Manager 3
(reference) . . . . . . . . . . . . . . . . . . . . . .Sr. manager . . . . . . . . . . . 19,638** (3,782) 15,484** (4,143) .116 (.843) �.635 (.885)Executive . . . . . . . . . . . . . 65,394** (4,522) 61,930** (4,835) .423 (1.01) .221 (1.08)Purchasing . . . . . . . . . . . . 754 (1,351) 1,811 (1,884) .410 (.313) .478 (.345)Age . . . . . . . . . . . . . . . . . . . 338** (52) 300** (71) �.085** (.013) �.084** (.013)Bachelor . . . . . . . . . . . . . . 1,610 (1,003) 200 (1,401) �.211 (.237) .118 (.240)Graduate . . . . . . . . . . . . . . 734 (864) �451 (1,155) �.208 (.203) .182 (.204)Hightech . . . . . . . . . . . . . . 3,516** (880) 3,150* (1,189) .087 (.209) .162 (.210)Lowtech . . . . . . . . . . . . . . �6,927** (1,481) �6,607* (2,375) �.351 (.342) �.409 (.378)Urban 1 . . . . . . . . . . . . . . . 3,613** (1,046) 3,947** (1,456) .423 (.247) �.152 (.252)Urban 2 . . . . . . . . . . . . . . . 5,049** (1,010) 5,585* (1,427) �.564 (.238) �.052 (.243)Network constraint . . . . �7 (25) �1 (38) �.014** (.004) �.022** (.006)Mgr2 # constraint . . . . �19 (35) �47 (58) .004 (.008) �.008 (.009)Mgr3 # constraint . . . . �47 (38) �159* (59) �.007 (.009) .003 (.009)SrMgr #
constraint . . . . . . . . . . . �214* (75) �216* (84) �.005 (.017) .010 (.019)Executive #
constraint . . . . . . . . . . . �681** (124) �697** (132) �.011 (.028) .024 (.030)N . . . . . . . . . . . . . . . . . . . . . 673 398 673 638
Note.—Coefficients in models 1 and 2 are change in salary dollars with a unit increase in row variable(respectively .80 and .83 squared multiple correlations; network effect plotted in fig. 4). Coefficients inmodel 3 predict three levels of evaluation for an ordinal logit model (114.8 x2 with 17 df; network effectsare plotted in fig. 4 holding age constant). Coefficients in model 4 are for a logit model predicting whetherthe employee was promoted in the year after the network survey or received an above average raise(100.5 x2 with 17 df; network effect is plotted in fig. 4 holding age constant). SEs are given in parentheses.
* P ! .05.** P ! .001.
first rank, nor for managers in the second rank. However, the slope in-creases with job rank, showing a stronger salary association with bro-kerage in the higher ranks as a manager becomes more the author of hisor her own job and as success depends more on reading the organizationto identify valuable projects and know who can be brought together toimplement the projects (cf. Burt 1997).11 Salary in model 1 decreases forfirst-rank managers by $7 with a one-point increase in network constraint.The decrease is larger for managers in the second rank (add $19 to the
11 Model 2 is the same as model 1 except it is estimated from the data on managerswho had two or more discussion partners. The results of model 1 highlight the thirdrank of managers as a transition point after which managers enjoyed the salary benefitsof brokerage. I looked through the third-rank managers to see where salary benefitswere accumulating. Initially, I thought seniority would be a key. Managers who hadbeen in the third rank for a while could have been playing a senior manager role andso perhaps compensated for that. The answer was more simple. Third-rank managersinvolved in the informal discussion network showed the salary benefits of brokerage.Model 2 shows the same pattern of salary correlates as model 1, except the salary ofthird-rank managers is significantly correlated with network constraint.
American Journal of Sociology
372
$7) and larger still for managers in the third rank (add $47 to the $7).The statistically significant association is at the senior–manager and ex-ecutive ranks. The $214 additional decrement for senior managers is sig-nificantly more negative than the $7 for first-rank managers (2.9 t-test).The $681 additional decrement for directors and vice presidents is evenmore negative (5.5 t-test). Adding a dummy variable distinguishing the193 social isolates does not add to the prediction (.4 test statistic).12
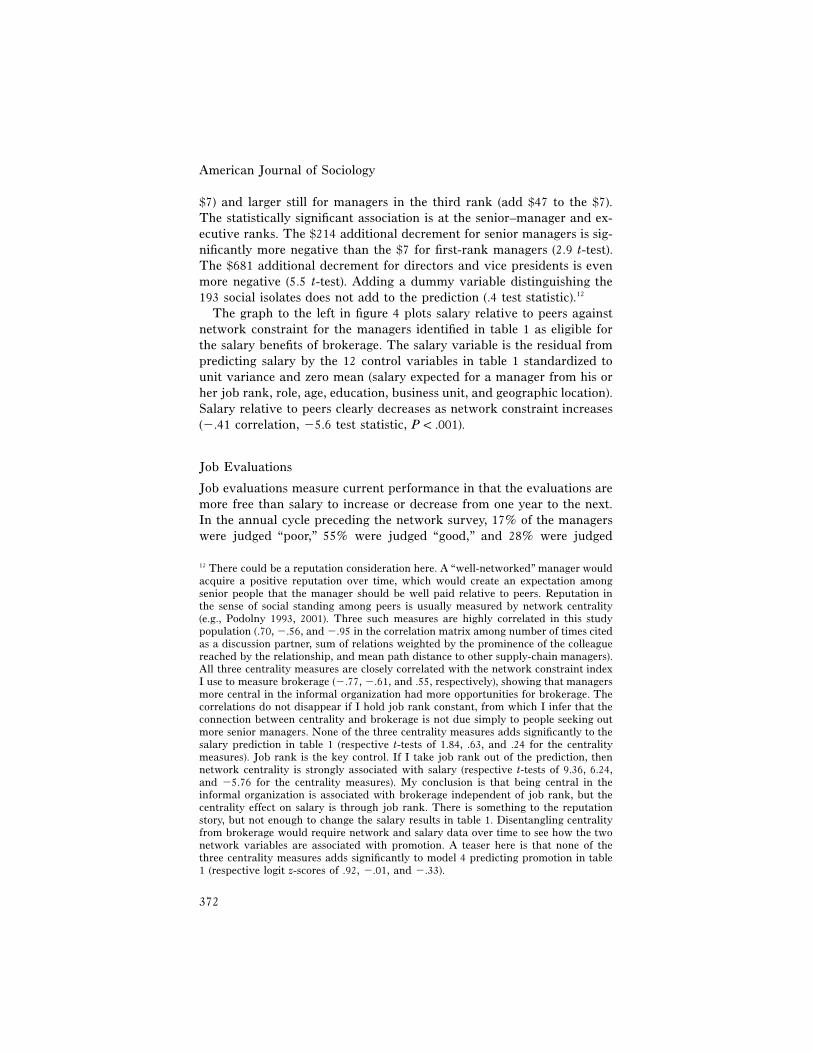
The graph to the left in figure 4 plots salary relative to peers againstnetwork constraint for the managers identified in table 1 as eligible forthe salary benefits of brokerage. The salary variable is the residual frompredicting salary by the 12 control variables in table 1 standardized tounit variance and zero mean (salary expected for a manager from his orher job rank, role, age, education, business unit, and geographic location).Salary relative to peers clearly decreases as network constraint increases(�.41 correlation, �5.6 test statistic, ).P ! .001
Job Evaluations
Job evaluations measure current performance in that the evaluations aremore free than salary to increase or decrease from one year to the next.In the annual cycle preceding the network survey, 17% of the managerswere judged “poor,” 55% were judged “good,” and 28% were judged
12 There could be a reputation consideration here. A “well-networked” manager wouldacquire a positive reputation over time, which would create an expectation amongsenior people that the manager should be well paid relative to peers. Reputation inthe sense of social standing among peers is usually measured by network centrality(e.g., Podolny 1993, 2001). Three such measures are highly correlated in this studypopulation (.70, �.56, and �.95 in the correlation matrix among number of times citedas a discussion partner, sum of relations weighted by the prominence of the colleaguereached by the relationship, and mean path distance to other supply-chain managers).All three centrality measures are closely correlated with the network constraint indexI use to measure brokerage (�.77, �.61, and .55, respectively), showing that managersmore central in the informal organization had more opportunities for brokerage. Thecorrelations do not disappear if I hold job rank constant, from which I infer that theconnection between centrality and brokerage is not due simply to people seeking outmore senior managers. None of the three centrality measures adds significantly to thesalary prediction in table 1 (respective t-tests of 1.84, .63, and .24 for the centralitymeasures). Job rank is the key control. If I take job rank out of the prediction, thennetwork centrality is strongly associated with salary (respective t-tests of 9.36, 6.24,and �5.76 for the centrality measures). My conclusion is that being central in theinformal organization is associated with brokerage independent of job rank, but thecentrality effect on salary is through job rank. There is something to the reputationstory, but not enough to change the salary results in table 1. Disentangling centralityfrom brokerage would require network and salary data over time to see how the twonetwork variables are associated with promotion. A teaser here is that none of thethree centrality measures adds significantly to model 4 predicting promotion in table1 (respective logit z-scores of .92, �.01, and �.33).

Fig. 4.—Brokerage and employee performance

American Journal of Sociology
374
“outstanding.” With pressure from top management to identify more weakperformers, the proportion of managers assigned to the “poor” categoryincreased to 25% in the second year, with 53% judged “good” and theremaining 22% judged “outstanding.” A manager’s evaluation in the firstyear is a good predictor of his or her evaluation in the second year;however, there were improvements and reversals. Of the managers judged“poor” in the first year, most were judged “poor” in the second year, thoughmany rose to “good” (81% and 19%, respectively; none rose to “outstand-ing”). Of those judged “outstanding” in the first year, the majority con-tinued to be “outstanding” in the second year, but a large number droppedto “good” and a minority dropped to “poor” (63%, 31%, and 6%, respec-tively). I focused on consistently high or low evaluations to define a sum-mary measure of performance, assigning managers into three categories:continuously poor (13% of the managers were judged “poor” in both years),continuously outstanding (16% were judged “outstanding” in both years),versus everyone else in the middle (71%, of whom 97% were given themiddling code of “good” for one or both of the years). The summarymeasure is strongly correlated with evaluations in each year (correlationsof .84 and .83 for the first and second years, respectively), but it moreclearly distinguishes extremes of poor versus outstanding performance.Managers who left the firm before the second annual review cycle wereassigned to a category based on their evaluation in the previous year. Itis not surprising that exit was most likely for managers who received a“poor” evaluation (13% exit for those judged “poor” vs. 4% exit for every-one else).
Model 3 in table 1 is an ordinal logit equation predicting the three-category job evaluations (outstanding, good, poor). Performance evalu-ations did not vary systematically with any of the control variables exceptage: older managers were less likely to receive positive evaluations. Aboveand beyond the control variables, there is a statistically significant neg-ative association with network constraint—the more interconnected amanager’s discussion contacts, the less positive his or her annual perfor-mance evaluation (�.014 coefficient, .004 SE in parentheses, for a �3.5test statistic). All of the slope adjustments in the four bottom rows aresmaller than their standard errors. In other words, there is a strong neg-ative association between network constraint and performance evaluationat each job rank. Adding a dummy variable distinguishing the 193 socialisolates does not add anything to the prediction (�1.6 test statistic), nordoes it change the fact that age and network constraint are the onlystatistically significant predictors.
The graph to the right in figure 4 plots the aggregate association for alogit model predicting evaluations from age and network constraint, thetwo statistically significant predictors in table 1. Few received a “poor”

Structural Holes and Good Ideas
375
evaluation two years in a row, but the few who did were disproportion-ately managers surrounded by a circle of densely interconnected discussionpartners. At the other extreme, being evaluated “outstanding” for bothyears was unlikely on average ( ), but a manager whose discussionP p .16network spanned numerous structural holes had twice those odds (P p
when ).13.32 C p 10
Promotion
Promotion measures company-rewarded performance. Of managers stillwith the company in the second year, 14% were promoted to a higherjob grade. A few were promoted two job grades, but most were a singlegrade, so I treat promotion as a dichotomy. Pay was sometimes a substitutefor promotion, for example, if a person was doing a good job but hadbeen promoted recently. Of the managers not promoted in the second year,34% received an above-average salary increase. The percentage by whicha manager’s salary increased is a continuous variable—salaries increasedin the second year by an average of 5.5% over a range of 0%–30%—butthe performance signal managers discuss is whether they received anabove-average raise. Supervisors were given a budget sufficient to coveran average raise for each subordinate, then directed to allocate higherand lower increases according to merit. The average was defined by head-quarters and varied from one year to the next, so average was the con-
13 A more intuitive, less robust, demonstration of the association with brokerage is tosort managers into three broad groups with respect to business units: nonbrokers (312managers in a group of densely interconnected discussion partners, as indicated byabove-average network constraint), local brokers (196 managers with discussion part-ners in other groups, but all within the manager’s own business unit, e.g., persons 283,504, 528 in fig. 3), and enterprise brokers (165 managers with discussion partners inother groups, some outside the manager’s own business unit, e.g., persons 9, 234, 402in fig. 3). The hypothesis is that good ideas are borne of engaging alternative ways ofthinking and behaving. Since variation is more likely between than within businessunits, enterprise brokers have the most of whatever brokerage provides, local brokershave less, and nonbrokers the least. Consistent with the hypothesis, the odds of beingevaluated “outstanding” in the annual reviews before and after the survey drop from24% of enterprise brokers, to 19% of local brokers, and 10% of nonbrokers. The oddsof being evaluated “poor” in both years double from 5% of enterprise brokers, to 10%of local brokers, and 19% of nonbrokers. The two trends are nonrandom (33.5 x2 with4 df, ), but they disappear when network constraint is held constant (�6.4 testP ! 0.01statistic for network constraint vs. .3 and �.1 for dummy variables distinguishing localand enterprise brokers respectively from nonbrokers). The same conclusion holds formodel 5 in table 4 predicting the value of a manager’s best idea (�4.3 test statisticfor network constraint vs. �1.1 and .9 for local and enterprise brokers), so I do notdiscuss with respect to table 4 the intuitive appealing distinction between local andenterprise brokers. The summary conclusion is that performance increases with bro-kerage, in or beyond the manager’s own business unit.

American Journal of Sociology
376
sistent benchmark against which managers could interpret individual payincreases. In sum, I have three promotion measures. In addition to in-creased job grade and percentage increase in salary, my summary measureis a dichotomy distinguishing the 42% of managers promoted or givenan above-average salary increase.
Model 4 in table 1 shows the brokerage association with promotion.The more interconnected a manager’s discussion contacts last year, thelower the probability of being promoted or receiving an above-averagepay increase this year (�.022 coefficient, �3.7 test statistic). The associ-ation is consistent across job ranks (negligible slope adjustments). Theonly significant control variable again is age. Holding age constant, thegraph to the right in figure 4 shows how the probability predicted bymodel 4 changes with network constraint. The odds were good for beingpromoted or for receiving an above-average raise between the two yearsobserved (42%). Managers brokering connections across segregated groupshad significantly higher odds of a promotion or above-average salaryincrease ( for ). Managers limited to a circle of denselyP p .68 C p 10interconnected colleagues had the least chance ( for ).P p .28 C p 100Adding a dummy variable distinguishing the 193 social isolates does notchange the prediction (�1.4 test statistic). The same conclusion holds ifthe logit model is used to predict promotion to a higher job rank (�3.4z-score for network constraint) or if a regression model is used to predictthe percentage by which a manager’s salary increased in the second year(�3.2 t-test for network constraint).14
GOOD IDEAS
Given the performance association with brokerage, there should be evi-dence of good ideas being associated with brokerage—if brokerage pro-vides the hypothesized vision advantage.
Idea Data
Managers were asked, “From your perspective, what is the one thing thatyou would change to improve [the company’s] supply-chain manage-
14 The many salary correlates in models 1 and 2 that are negligible in model 4 lowerthe direct effect of network constraint in model 4. Retaining only age and networkconstraint in the prediction yields about the same age effect (�6.2 test statistic), butthe higher constraint effect in fig. 4 (�6.5 test statistic). The network-constraint as-sociation with percentage raise is similarly stronger when age alone is the controlvariable (�5.1 t-test vs. �3.2 in the text), but the association with promotion alone islittle changed (�3.0 test statistic vs. �3.4 in the text).

Structural Holes and Good Ideas
377
ment?” The box into which responses were typed held a maximum of2,000 characters. The survey elicited 455 ideas.
Evaluating the ideas requires a point of view. I deferred to top man-agement for this study. I do not recommend this point of view for allstudies, nor do I propose it as the best point of view. At the same time,the view from the top is an eminently reasonable frame of reference; topmanagement was the expert panel familiar with business operations inthe study population. They were the people who would reward ideas.They were the people whose careers would rise or fall with the value ofthe ideas they sponsored.
Two senior managers evaluated the ideas. Each led one of the com-pany’s largest business units, and they were geographically distant fromone another. Both judges were prominent for their experience in runningthe supply chain for their respective businesses. Each was given a list ofthe ideas—unattributed to their sources—and was asked the question:“How much value could be generated if the idea were well executed?”The answer scale ranged from one (“low value or can’t say”) to five (“valuecould be high”).15
Table 2 lists four illustrative ideas. The first two, judged high-value,propose extending supply-chain operations into exogenous sources of in-efficiency. Supply-chain managers were widely viewed by company en-gineers as administrative assistants who executed equipment orders. En-gineers were deemed better informed about alternative vendors, so thedecision between vendors was theirs to make. Often, however, equivalentvendors exist for a product, but the local engineer has dealt with onlyone vendor in the past, which was the vendor written into the proposal.The first idea in table 2 is to move supply-chain operations into the
15 The judges were under pressure from the new leadership to provide quality eval-uations, but rating 455 ideas is a daunting task. It seemed likely that the judges wouldfatigue. It also seemed likely that higher-quality ideas would come from more seniorpeople because they had a broader view across the bureaucratic silos in the supplychain (illustrated in figs. 2 and 3). To guard against unreliable evaluations of the betterideas, ideas were presented anonymously to the judges in two categories: the first 48ideas were a random order of responses from respondents in the three highest ranks(vice president, director, and senior manager). The subsequent 407 were a randomorder of ideas offered by managers in lower ranks. As expected, ratings are lower forideas later on the list (�3.5 t-test; 2.7 mean value for the first 50 ideas, 1.4 mean valuefor the last 50 ideas) and higher for the ideas from people in more senior ranks (6.9t-test; 3.0 mean value of ideas from directors and vice presidents, 2.5 for ideas fromsenior managers, and 1.8 for ideas from the less senior managers). Effects of respondentrank and judge fatigue are confounded in the ratings (since ideas from high-rankmanagers were listed before ideas from other managers), but the two factors do notneed to be separated for the purposes of this article, so that is not as important asholding constant both job rank and an idea’s sequential order of evaluation whenpredicting the value of ideas. This, and other bias issues, are discussed below.

TABLE 2Four Illustrative Ideas: Two High Value and Two Low Value
(4.5 value, 38 net-work constraint)
Involve SCM in the proposal process. Most of the risk in supplychain is at the front end of the business, where little involve-ment from the SCM community is found. Opportunities to im-prove our win rate through innovative SCM ideas and out-of-the-box procurement are often overlooked or missed altogether.For example, on a proposal with a plug number for material,SCM is oftentimes not considered. We could be utilizing ourpowerful processes to decrement that material cost substan-tially, thus creating a competitive advantage.
(4.5 value, 31 net-work constraint)
We need to develop and train our SCM people in the Subcon-tracts area to manage our critical subcontractors. We need toinstitute a standard process for subcontract management and atraining program to deploy this process within SCM across ourlocations. We also need to have sufficient experienced subcon-tracts people available to support the program offices in orderto adequately manage the subcontract process.
(1.0 value, 72 net-work constraint)
If you go through all the training to unify a process then thewhole supply chain regardless of location should be requiredto continue to use the process. We tend to train a lot, but arenot required to continue to use the process once it has beenincorporated. Supply Chain has a lot of great processes, butthey get lost after the initial training, or not everyone is re-quired to follow the process, based on location. We need tocontinue to work with our counterparts to ensure that the pro-cesses are being followed. Where there is a lack of training, wemust take the time to train our fellow team members so that itbenefits us in the long run.
(0.5 value, 80 net-work constraint)
My SixSigma Team was tasked with developing an easiermethod to get Budgets and Targets posted, by part number, sothat the buyers would not waste time contacting individualSCMs. This process requires utilizing the Materials Systemand Buyer Web System. The team ran into several roadblocks,but we identified solutions to resolve those roadblocks. Someprogramming changes were required (none of which was ex-tremely high cost). In addition, we tried to have all SCMs di-rected to get all of their contracts loaded into the system by acertain cut-off date. We went through three or four cut-offdate delays for various reasons, and each time our team metthe challenge. So much time went by, however, theprogrammers were all diverted to the new SAP system. With-out the programming changes, meeting the initial goals of theteam (making ALL budgets and targets available to the buy-ers) is no longer possible. Therefore, the one thing I wouldchange is to implement the changes that my team came upwith. This would make the buyer much more efficient, andless frustrated.
Note.—SCM stands for supply-chain management or supply-chain manager.

Structural Holes and Good Ideas
379
proposal process so that the company can benefit from the scale economiesof purchasing from preferred vendors before low-volume, high-priceequipment purchases are written into a contract. A related inefficiencywas created in large subcontracts to vendors familiar to local engineers.The second idea in table 2 is to move supply-chain operations into sub-contracts to control high prices that subcontractors pay for supplies, whichare then charged back to the company.
The bottom two ideas in table 2 were judged low in value. Both judgesgave a score of one to the third idea, which is a call for more consistencyacross geographic locations. The bit of strategic thinking missing in theidea is a focus on consistency to create value, as opposed to consistencyfor its own sake. As stated, the third idea is a classic lament from bu-reaucrats—we need people to adhere more consistently to agreed-uponprocesses. The fourth idea in table 2 has a tone of the bureaucrat’s lament,but it offers substantive detail, in fact so much detail that it is difficultto judge the value of the idea. The respondent is down in the weeds withdetails about his Six Sigma project and the computer systems utilized inthe project. It is difficult to evaluate the value of this idea without knowingmore about the specific project and computer systems (cf. Reagans andMcEvily 2003). One of the two judges gave the idea a score of one, theminimum on the printed rating scale. The other judge dismissed the ideawithout rating it (scored as zero, resulting in the .5 average across judges)and explained with a note at the end of his ratings: “for ideas that wereeither too local in nature, incomprehensible, vague, or too whiny, I didn’trate them.”
Correlates of Good Ideas
Table 3 shows that good ideas came from people who were expected toprovide good ideas. For example, judges saw more value in the ideas ofmanagers in more senior ranks. Average ratings of their ideas were higher(3.0 average for directors and vice presidents vs. 1.5 for the first rank ofmanagers), and their ideas were less likely to be dismissed (0% of directorand vice president ideas were dismissed by both judges vs. 47% of ideasfrom first-rank managers). Better ideas came from the purchasing man-agers, whose work brought them into contact with other companies. Moreeducated managers had better ideas. Managers in the urban centers hadbetter ideas. In keeping with the brokerage hypothesis, managers con-strained in a closed discussion network were less likely to have valuableideas (1.5 average) and more likely to have their ideas dismissed by bothjudges (43%).

American Journal of Sociology
380
TABLE 3Correlates of Good Ideas
Mean Valueof Ideas % Dismissed
Job rank (81.4 , 8 df, ):2x P ! .001Manager 1 . . . . . . . . . . . . . . . . . . . . . . . . . . . . . . . . . . . . 1.5 47Manager 2 . . . . . . . . . . . . . . . . . . . . . . . . . . . . . . . . . . . . 1.9 26Manager 3 . . . . . . . . . . . . . . . . . . . . . . . . . . . . . . . . . . . . 2.3 13Sr. manager . . . . . . . . . . . . . . . . . . . . . . . . . . . . . . . . . . 2.5 0Executive . . . . . . . . . . . . . . . . . . . . . . . . . . . . . . . . . . . . . 3.0 0
Work role (12.3 , 2 df, ):2x P p .002Purchasing . . . . . . . . . . . . . . . . . . . . . . . . . . . . . . . . . . . . 1.9 29Other role . . . . . . . . . . . . . . . . . . . . . . . . . . . . . . . . . . . . 1.4 52
Age (10.0 , 4 df, ):2x P p .04Younger (24–45) . . . . . . . . . . . . . . . . . . . . . . . . . . . . . 1.9 30Average (46–51) . . . . . . . . . . . . . . . . . . . . . . . . . . . . . . 1.7 41Older (52–68) . . . . . . . . . . . . . . . . . . . . . . . . . . . . . . . . . 2.0 25
Education (26.8 , 4 df, ):2x P ! .001Graduate . . . . . . . . . . . . . . . . . . . . . . . . . . . . . . . . . . . . . 2.2 20Bachelor . . . . . . . . . . . . . . . . . . . . . . . . . . . . . . . . . . . . . . 1.9 29Less . . . . . . . . . . . . . . . . . . . . . . . . . . . . . . . . . . . . . . . . . . . 1.5 47
Organization (1.8 , 4 df, ):2x P 1 .5Hightech . . . . . . . . . . . . . . . . . . . . . . . . . . . . . . . . . . . . . . 2.1 25Lowtech . . . . . . . . . . . . . . . . . . . . . . . . . . . . . . . . . . . . . . 1.9 31Other . . . . . . . . . . . . . . . . . . . . . . . . . . . . . . . . . . . . . . . . . . 1.8 33
Geography (10.3 , 4 df, ):2x P p .04Urban 1 . . . . . . . . . . . . . . . . . . . . . . . . . . . . . . . . . . . . . . . 2.0 22Urban 2 . . . . . . . . . . . . . . . . . . . . . . . . . . . . . . . . . . . . . . . 2.1 24Other . . . . . . . . . . . . . . . . . . . . . . . . . . . . . . . . . . . . . . . . . . 1.8 36
Network constraint (44.4 , 4 df, ):2x P ! .001Little (11–45) . . . . . . . . . . . . . . . . . . . . . . . . . . . . . . . . . 2.4 14Average (46–71) . . . . . . . . . . . . . . . . . . . . . . . . . . . . . . 1.7 37Much (72–100) . . . . . . . . . . . . . . . . . . . . . . . . . . . . . . . 1.5 43
Note.—Correlates (in rows) are from table 1. Correlates that are continuous variables aredivided into approximately equal categories of low, middle, and high (e.g., about a third of themanagers were age 52 or higher). Mean value is on a five-point scale. statistics in parentheses2xare for a multinomial logit model of association between categories and the good-idea variables.
Idea Value
Model 5 in table 4 predicts idea value holding constant the control var-iables in table 1. The left-hand graph in figure 5 shows the nonlinearassociation with brokerage. The steepest drop in value happens withinitial network constraint, when a manager first begins to rely on redun-dant discussion partners. Circles in the graph indicate ratings by one ofthe two judges (averaged across five-point intervals of network constraint),and squares indicate pooled ratings from the other judge. One judge wasmore generous than the other (circles higher than the squares on average),

Structural Holes and Good Ideas
381
TABLE 4Predicting Good Ideas
5Idea Value
6Idea Dismissed
7No Idea
8Discuss Idea
Intercept . . . . . . . . . . . . . . 4.082 �3.739 �9.689 5.328Manager 1 . . . . . . . . . . . . �.228 (.159) .721* (.285) �.015 (.281) �.300 (.290)Manager 2 . . . . . . . . . . . . �.133 (.168) .287 (.313) �.054 (.283) .067 (.319)Manager 3
(reference) . . . . . . . . . . . . . . . . . . . . . .Sr. manager . . . . . . . . . . . .042 (.276) . . . .401 (.458) �.295 (.525)Executive . . . . . . . . . . . . . .291 (.336) . . . .438 (.621) .210 (.758)Purchasing . . . . . . . . . . . . .335 (.177) �.715 (.513) .399 (.322) �.160 (.323)Age . . . . . . . . . . . . . . . . . . . .004 (.008) �.006 (.015) �.012 (.012) �.013 (.015)Bachelor . . . . . . . . . . . . . . .226 (.148) �.472 (.266) �.101 (.239) �.019 (.267)Graduate . . . . . . . . . . . . . . .094 (.143) �.367 (.289) �.205 (.210) .198 (.270)Hightech . . . . . . . . . . . . . . .086 (.138) .071 (.260) �.099 (.212) �.151 (.251)Lowtech . . . . . . . . . . . . . . .404 (.231) �.595 (.465) .697 (.372) .338 (.451)Urban 1 . . . . . . . . . . . . . . . .004 (.183) �.590 (.371) .488 (.253) .165 (.349)Urban 2 . . . . . . . . . . . . . . . .071 (.174) �.277 (.332) .323 (.243) �.531 (.313)Length of idea . . . . . . . . �.0002 (.0002) �.0001 (.0005) . . . .0013* (.0006)Sequential order . . . . . . . �.0005 (.0005) .0011 (.0010) . . . �.0006 (.0010)Network constraint . . . . �.694** (.144) .972** (.281) 2.356** (.243) �.939** (.267)N . . . . . . . . . . . . . . . . . . . . . 455 455 673 455
Note.—Network constraint is the log of constraint in this table. Model 5 predicts idea value on aone-to-five scale (.15 squared multiple correlation; network effect plotted in fig. 5). Models 6–8 are logitpredictions of the idea being dismissed (64.6 with 13 df; network effect plotted in fig. 5), no idea being2xexpressed (177.2 with 13 df; network effect plotted in fig. 5), and discussing the idea with a named2xcolleague (35.2 with 15 df). SEs are given in parentheses.2x
* .P ! .05** .P ! .001
but the point highlighted is that evaluations by both judges show thesame association with brokerage: thin regression lines in figure 5 throughtheir respective ratings show similar strong negative associations withnetwork constraint (t-tests of �5.8 and �3.9 for their 455 individualratings; see fig. 5 insert for parameter estimates).
None of the control variables are associated with idea value whennetwork constraint is held constant. Higher-rank managers were moreoften the source of valuable ideas, but the zero-order association withrank disappears when network constraint is held constant. Even in thetop ranks, people limited to a small circle of densely interconnected dis-cussion partners were likely to have weak ideas for improving supply-chain operations (�.43 correlation between idea value and network con-straint for the senior managers, directors, and vice presidents, �3.2t-test).16
16 The lack of association with job rank has measurement interest: The two seniorpeople judging value are at the top of the corporate ladder, so the ideas that theywould find valuable are the ideas most relevant to their personal concerns with in-tegrating across business units—which would be the ideas of managers who havediscussion partners in other business units. Therefore, it would not be surprising to

Fig. 5.—Brokerage and employee best idea

Structural Holes and Good Ideas
383
The age and education measures of human capital pale next to thenetwork measure of social capital. Idea value and network constrainthave a strong negative association within levels of education. The zero-order association with education in table 3 disappears when networkconstraint is held constant. Model 5 shows no association between valueand education.17 Measuring work experience, age has no direct associationwith value in model 5, and a graph of value across age (not presented)is a random scatter showing no linear, curvilinear, or episodic association(.04 correlation with age and a similarly negligible .02 correlation withyears in the company).
The two bias effects in model 5 are negligible. First, it seemed possiblethat value ratings would be higher for ideas offered with more expla-nation. Responses explaining ideas ranged from 13 to 1,897 characters(253 mean). However, there is no zero-order association with either judge’sevaluation of value (.06 and �.07 correlations) or in the model 5 prediction(�.8 t-test). Second, it seemed likely that judges would fatigue as theyrated ideas so value would be lower for ideas later on the list presentedto the judges. There is a negative zero-order association between valueand sequential order (�3.5 t-test), but the association is negligible under
find this measure of value associated with brokerage. A generic response is to deferto the people in charge. The perceptions of the most senior managers guide the allo-cation of this company’s resources to people and projects. What they see as value iswhat is valuable in this organization. The job-rank results offer another response. Ifthere is an egocentric bias in the perception of value by the two senior people judgingvalue, then ratings should increases with job rank because people of higher rank havejob concerns more similar to the two most senior people. Judged value does increasewith the job rank of the person proposing an idea, but the association disappears whennetwork constraint is held constant. I do not believe the judges were impressed withideas relevant to their own jobs so much as they were impressed with the extent towhich an idea reflected alternative ways of thinking or behaving. That is my hunchfueled by the table 3 and table 4 results on job rank—rank is associated with goodideas, but the direct predictor is brokerage at each rank. A definitive answer to themeasurement question would require an experimental design in which idea value isjudged under a mix of two factors: idea similarity to the concerns of the person judgingvalue, and idea quality reflecting alternative ways of thinking and behaving.17 Another measure of individual ability shows the same lack of direct association withvalue: 114 people in the study population had graduated from the company’s middle-manager leadership program. I have the grade on a four-point scale that each receivedin the program. Managers whose networks span structural holes did well in the pro-gram (�4.1 t-test for network constraint predicting grade), but the rated value of theiridea for improving supply-chain operations is associated with their network, not withtheir program grade (regressing value over program grade and network constraintyields a .3 t-test for grade and �3.3 for network constraint).

American Journal of Sociology
384
the controls in model 5 (�.9 t-test for sequential order).18 Adding to model5 a dummy variable distinguishing the 193 social isolates does not addsignificantly to the prediction (1.7 test statistic).
Ideas Dismissed
One in three ideas was dismissed by both judges (32%), which is theoutcome predicted by model 6 in table 4. The positive association betweennetwork constraint and being dismissed (3.5 test statistic) shows that man-agers buried in networks of densely interconnected discussion partnerswere less successful in communicating their idea to the senior managersjudging value. Here again, the association with network constraint isnonlinear. The dashed line through the triangles in the graph to the rightin figure 5 shows that the steepest increase in the odds of being dismissedhappens with initial network constraint, in other words, when a managerfirst begins to rely on redundant discussion partners.
The control variables in model 6 are again interesting for their lack ofassociation with dismissal. Job rank is more complicated than in model5. The first-rank managers have a statistically significant higher risk ofbeing dismissed. Managers in the top ranks had none of their ideas dis-missed (see table 3), so dummy variables distinguishing them had to beremoved from the model. Age, education, and the other control variableshad no association with dismissal. Adding to model 6 a dummy variabledistinguishing the 193 social isolates does not add anything to the pre-diction (�.9 test statistic).
Ideas Unexpressed
Among the managers not responding to the survey were 16 who enteredtheir name in the survey Web site, then left before answering the question
18 I checked for another possible rating bias. The two senior managers, familiar withtheir own operations, might recognize and overpraise an idea from one of their sub-ordinates. Rivalry is a related possibility (e.g., Bothner [2003] on rivalry and socialinfluence). The two judges ran the two largest supply-chain operations in the company,so competition between them was inevitable. Feelings of competition might result inlower ratings for ideas from the rival organization. Neither bias was statistically sig-nificant in the ratings. I regressed ratings from each judge over two dummy variables(with controls for the rank of the respondent proposing an idea and the sequentialorder in which an idea was evaluated). One dummy variable identified respondentsin the judge’s own division. The other dummy variable distinguished respondents inthe other judge’s division. The reference group was respondents in neither division.Ratings were biased in the expected direction, but negligibly so (.9 t-test for positiveevaluations of ideas within a judge’s own division, �1.3 t-test for evaluations of ideasfrom the other judge’s division).

Structural Holes and Good Ideas
385
about their best idea for improving supply-chain operations. I have noway of knowing how many other potential respondents decided not toanswer the survey after seeing the questions, but I do know which man-agers chose not to complete the survey. I estimated model 7 in table 4 tosee whether not completing the survey and nonresponse more generallyis idea-related in the sense of having the same pattern of correlates asidea value and idea dismissal. Managers probably had various reasonsfor not responding to the survey, but the pattern of correlates predictingnonresponse in model 7 looks like the pattern in model 5 predicting ideavalue, and the pattern in model 6 predicting idea dismissal: there is astrong association with network constraint and negligible associationswith job rank, role, age, education, business unit, and location. The steepdashed line through the solid dots in figure 5’s right-hand graph showsthe dramatic association with network constraint. Managers with net-works that spanned structural holes were likely to express an idea, whilethose surrounded by densely interconnected discussion partners were un-likely to express an idea.
Ideas Discussed
The step past expressing an idea is to discuss it with people. After typingtheir idea, managers were asked whether they had discussed it with any-one in the company. If yes, they were asked to name the person withwhom they had their most detailed discussion. A substantial minority ofthe supply-chain managers were dead-ends in the sense of never discussingtheir idea (31%). A few said that they had discussed their idea, but wereambiguous about the discussion partner (7%; e.g., “everyone I can get tolisten,” “various,” “other managers in supply chain”). The majority nameda specific person with whom they had discussed their idea (67%), andsome went on to name two or more discussion partners (14%).
Model 8 in table 4 shows that idea discussion has two statisticallysignificant predictors: idea length and brokerage. The length of a man-ager’s explanation makes sense in that a person sufficiently interested totype a long explanation of an idea is more likely to spend effort talkingabout the idea.19 The pattern of correlates other than length looks like
19 The brokerage effect in model 8 is stable across three alternative variables measuringmanager effort in mobilizing colleague interest in an idea. In an ordinal logit modelpredicting three categories of targeted discussion (no discussion, discussion with un-known colleague, discussion with named colleagues), there are no statistically signif-icant associations with any of the control variables in model 8 (including length ofexplanation, 1.8 test statistic), and there is the strong negative association with networkconstraint (�3.4 test statistic). The same is true for an ordinal logit model predictingthree categories of discussion effort (no discussion, discussion with one named col-

American Journal of Sociology
386
the pattern in the other table 4 models, with brokerage providing thestrongest predictor. Regardless of job rank, age, education, business unit,or region, the people likely to discuss their ideas were the people whosenetworks spanned structural holes. Job rank initially seemed to matter(3.2 test statistic for association between job rank and idea discussion),but more senior people were more involved in bridging structural holes,and the negligible effects for job rank in model 8 show that it is thebridging that is directly associated with idea discussion. Adding to model8 a dummy variable distinguishing the 193 social isolates does not addanything to the prediction (�.5 test statistic). There is a zero-order as-sociation between an idea’s value and its probability of being discussed.Discussed ideas have higher value scores (3.1 t-test) and were less likelyto be dismissed by the two senior managers evaluating value—27% ofdiscussed ideas were dismissed versus 42% of the undiscussed ideas (8.7x2, 1 df, , where dismissed is the dependent variable in model 6).P ! .01However, neither idea value (dependent variable for model 5) nor adummy variable distinguishing ideas dismissed (dependent variable formodel 6) adds anything to model 8 (respective test statistics of .8 and�.6).
CONCLUSIONS AND DISCUSSION
There is evidence of a vision advantage associated with brokerage. Ianalyzed archival and survey data on several hundred managers in alarge company. The study population was well-suited to testing the hy-pothesized vision advantage. There were numerous opportunities for bro-kerage (fig. 2 and fig. 3), and managers were rewarded for brokerage inthe sense that compensation, positive performance evaluations, and pro-motions were disproportionately given to managers who brokered con-nections across structural holes (fig. 4). If brokerage affected performancethrough the hypothesized vision advantage, there should be evidence ofbrokerage being associated with good ideas—and there is. The results intable 4—illustrated in figure 5—show that managers whose networksspanned structural holes were more likely to express an idea and to discussit with colleagues (models 7 and 8), have the idea engaged by seniormanagement (model 6), and have it judged valuable (model 5). The em-pirical support invites detailed study of processes by which information
league, discussion with multiple colleague; �2.8 test statistic for brokerage), and anordinal logit model distinguishing action from discussion (no discussion, discussiononly, discussion and action where the third category contains the 16 managers distin-guished in the conclusion section of this article for tying to mobilize support for theiridea; �3.9 test statistic for brokerage).
Structural Holes and Good Ideas
387
arbitrage occurs. More generally, the results have implications for crea-tivity and the reproduction of social structures in which ideas emerge.
Creativity
Stories about the creation of a good idea are often heroic, distinguishingexceptional people from the mundane. The creator is attributed with greatintellectual ability, a fresh perspective, a productive way of thinking, acreative personality, or some other quality that enabled him or her togenerate the good idea. Every discipline has its heroes and heroines andstories that serve productive ends other than truth. There is even evidenceto support such stories. For example, Simonton (1984) reports that cre-ativity is less likely after age 40 (p. 111); it is most likely in people withalmost a college education (pp. 65, 191); it is more likely in firstborn sons(pp. 26–28); it increases with IQ score (p. 45); and so on.
Sociologists typically emphasize environmental factors in the predictionof creativity—factors such as the family and era variables in Simonton’sanalysis (e.g., Kavolis [1966] on the link between artistic creativity andsocial disequilibrium). In fact, though somewhat obscured in mysticalterms, the link between creativity and sociometric citations was a centraltheme in the early development of network analysis (e.g., Moreno 1940,1955; Northway and Rooks 1955). Individual and environment can bedifficult to disentangle with available data. For example, age is a personalattribute negatively associated with creating good ideas in science (seeStephan and Levin [1992] for a review and Chandrasekhar [(1975) 1987]for an engaging illustration).20 Beyond the person-specific factors of youth-ful energy and skills is the environmental factor of a new generation lessinvested in, or blinded by, the prevailing paradigm (Kuhn 1962). The viewis bluntly phrased in physicist Max Planck’s ([1949] 1968, p. 33) comment:“A new scientific truth does not triumph by convincing its opponents andmaking them see the light, but rather because its opponents eventuallydie.” Of course, the environment exists in its own right. Collins’s (1998)analysis, with its emphasis on philosopher greatness adjacent to structural
20 Chandrasekhar (1987) is after the more subtle point that the negative age/creativitycorrelation in science is reversed in the arts, where good ideas are more likely to comefrom more experienced minds (cf. Simonton 1984, chap. 6). He presents a novel contrastbetween obituaries to illustrate what is lost by the early death of a creative in the artsvs. the sciences (pp. 47–49). For example, playwright Christopher Marlowe’s earlydeath at age 29 and poet Shelley’s early death at age 30 were bemoaned for the lossof what the artists could have given us in their mature years. In contrast, the earlydeath of mathematician Ramanujan did not deny us his best work. Or, as mathe-matician Hardy (1940, p. 72) expresses it: “If a mature man loses interest in andabandons mathematics, the loss is not likely to be very serious either for mathematicsor for himself.”

American Journal of Sociology
388
holes, could be viewed as an exemplar of a Simonton analysis run by agifted structural sociologist.
The analysis reported in this article corroborates Collins’s point withsystematic evidence on the less ethereal work of a business supply chain.In this case, managers who broker connections across structural holes intheir organization are more likely to have good ideas.
The more consequential creativity implication of analyzing good ideasin terms of brokerage is the shift in focus from the production of ideasto the value produced. The brokerage value of an idea resides in a sit-uation, in the transaction through which an idea is delivered to an au-dience; not in the source of the idea, nor in the idea itself. Debate overindividual and environment factors predisposing a person to create is anaside. The source of an idea is no longer the focal question; what mattersis the value produced by the idea, whatever its source. People with con-nections across structural holes have early access to diverse, often con-tradictory, information and interpretations, which gives them a compet-itive advantage in seeing and developing good ideas.21 People connectedto groups beyond their own can expect to find themselves deliveringvaluable ideas, seeming to be gifted with creativity. This is not creativityborn of genius; it is creativity as an import-export business. An ideamundane in one group can be a valuable insight in another. In our ageof ready technology, people often make the mistake of thinking that theycreate value when they have an idea born of sophisticated analysis. Thatis not true. An idea is as valuable as an audience is willing to credit itwith being. An idea is no less valuable to its recipients because there are
21 To further appreciate the network model on this point, consider how Schumpeter,despite his respect for, and emphasis on, what I have discussed as the social capitalof brokerage, left the mechanism a mystery (1947, p. 150): “From the standpoint ofthe observer who is in full possession of all relevant facts, it can always be understoodex post: but it can practically never be understood ex ante; that is to say, it cannot bepredicted by applying the ordinary rules of inference from the pre-existing facts.”Schumpeter, as a young man, similarly discusses the phenomenon with admiration—“Carrying out a new plan and acting according to a customary one are things asdifferent as making a road and walking along it” (1934, p. 85)—and with mystery—“the success of everything depends on intuition, the capacity of seeing things in a waywhich afterwards proves to be true, even though it cannot be established at the moment,and of grasping the essential fact, discarding the unessential, even though one cangive no account of the principles by which this is done” (1934, p. 85). The import-export nature of brokerage-based creativity makes less heroic the task of detectingand developing a good idea, in that contacts in target markets inform a vision of howthe idea could be positioned to be well received.
Structural Holes and Good Ideas
389
people elsewhere who do not value it.22 The certain path to feeling creativeis to find a constituency more ignorant than you and poised to benefitfrom your idea. This is a familiar phenomenon in academic work (e.g.,see Stigler [(1982) 1986] on the quick acceptance of his economic analysisof information, or Lamont [1987] on the popularity of Derrida’s work inculture markets as different as France and the United States). We spe-cialize by method, theory, and topic. It is impossible to keep up withdevelopments in other specialities. It would be inefficient even if it werepossible. So there is a market for the information arbitrage of networkentrepreneurs, and the evidence of their work is that valuable new ideasin any one specialty are often a familiar concept in some distant specialty.Across the clusters in an organization or market, creativity is a diffusionprocess of repeated discovery in which a good idea is carried across struc-tural holes to be discovered in one cluster of people, rediscovered inanother, then rediscovered in still others—and each discovery is no lessan experience of creativity for people encountering the good idea.23 Thus,value accumulates as an idea moves through the social structure; eachtransmission from one group to another has the potential to add value.In this light, there is an incentive to define work situations such thatpeople are forced to engage diverse ideas. That incentive underlies theRhone-Poulenc quote on managing le vide with which I began this article.
Structural Reproduction
Brokerage is typically discussed as an engine for productive change. Theargument is an Austrian market metaphor made operational with a net-work model of structural holes: organizations and markets are viewed asillustrated in figure 1, with beliefs and behavior, knowledge and practice,homogeneous within clusters relative to the heterogeneity between clus-ters. People who have relations that span the structural holes betweengroups have a vision advantage in detecting and developing good ideas.
22 The word “elsewhere” refers to network parameters of diffusion. People elsewhereare neither part of a cohesive group containing the individuals now evaluating theidea, nor structurally equivalent to the current evaluators. Disbelievers cohesive with,or structurally equivalent to, current evaluators would certainly affect the perceivedvalue of the idea (Burt 1999). There is also status insecurity to consider (Phillips andZuckerman 2002; Menon and Pfeffer 2003). Knowing an idea has low value amongelites, or is advocated by competitors, can affect the idea’s value for people aspiringto look like elites.23 As Fleck ([1935] 1979, pp. 109–10) so long ago described the social construction offacts with respect to ideas that move between scientific disciplines, “communicationof ideas always results in a shift or a change in the currency of thought. . . . Thischange in thought style, that is, change in readiness for directed perception, offers newpossibilities for discovery and creates new facts.”

American Journal of Sociology
390
For their integrative efforts, these people receive disproportionate returns.The returns signal a price for integrating the work of one group withanother. Thus, brokerage brings market price into focus, and price is acriterion for coordinating people whose knowledge is necessarily limitedby time and place.
Its attractions notwithstanding, the argument seems not to describe thestudy population analyzed in this article. Brokerage opportunities wereabundant, visible, and rewarded—but apparently irrelevant. There shouldbe an integrated supply chain rather than the organization riddled withstructural holes. There are holes around the supply-chain function, be-tween the unit functional organizations, and between individuals withinthe function. Dramatic change could have disrupted previous integration,but it seems unlikely here. The supply-chain managers have been withthe company a long time (18 years on average) and are connected by long-standing relationships (8 years on average).
I see evidence of structural reproduction. This point is in the discussionsection because my evidence on it is less direct than the evidence I havelinking brokerage with good ideas. The point warrants attention becauseit describes brokerage—a mechanism for change and value creation—prevalent and rewarded in a fragmented, static organization.
There are positive and negative cycles to the reproduction. The negativecycle is clear from the results in figure 5: managers surrounded by denselyinterconnected discussion partners (high network constraint) were likelyto have their ideas dismissed by senior management or have their ideasseen as low-value, so they have learned not to express ideas. These man-agers can be expected to obey the maxim that a closed mouth gathers nofeet and withdraw into their local social world to wait for orders, therebycontributing to the continued segregation of groups in the supply chain(see Morrison and Milliken [2002] on organizational silence and itscorrelates).
The positive cycle is less obvious. Managers whose networks spannedstructural holes (low network constraint) were likely to express and discusstheir ideas, likely to have their ideas engaged by senior management, andlikely to have their ideas perceived as valuable. These managers can beexpected to continue to propose ideas.
So what end does this bring? Managers with discussion partners inother groups were positioned to spread good ideas across business units,but the people with whom they discussed their ideas were overwhelminglycolleagues already close in their informal discussion network.
Consider, as a baseline, an inertia model of social convenience. Who ismost likely to be cited by a manager putting no effort into spreading orbuilding support for an idea? The more that John speaks to the peoplewith whom I frequently speak, the more likely John will be present in

Structural Holes and Good Ideas
391
my conversations with colleagues. If I were to have a conversation witha colleague selected at random, John has a good chance of being thatcolleague. In network terms, John is central in my discussion network:he speaks often to the people with whom I often discuss my work. Thisimage of centrality is measured by network constraint (see note 6). Themore a contact is connected with others in a manager’s network, thehigher the constraint score for the contact.
Figure 6 shows manager contacts sorted from most to least central. Thefirst position contains the contact with whom the manager had the mostmutual friends. This is the person most likely to be cited if social con-venience determined who was selected for idea discussion. At the otherextreme of the horizontal axis are the most distant contacts. These distantcontacts are people with whom a manager had no mutual colleagues andpeople with whom the manager had the least experience.24 I put aside the662 contacts cited by managers who did not discuss their best idea becausethose contacts were not at risk of being cited for idea discussion (graybars in the lower-left corner of the graph in fig. 6). At risk were the contactsof managers who did discuss their best idea. There were 1,788 contactsnot cited for this discussion (white bars in fig. 6) and 340 cited contacts(dark segments at the top of the white bars).
The inertia model accounts for the distribution of good ideas, fromwhich I infer that ideas were not discussed to change business practiceso much as they were discussed to display competence and to entertainfamiliar colleagues. The dark segments at the top of the white bars infigure 6 show idea discussion concentrated at the center of a manager’snetwork: 36% of the people cited were the most central in a manager’snetwork, 25% were the second most central, and 13% were the third mostcentral. The number of citations decreases at further removes from themanager, but so does the number of contacts available to be cited. A logitmodel predicting the probability of discussion from centrality in figure 6shows discussion likely only with the first three people, and in stronglydecreasing order (coefficients of 2.18, 1.70, .83, and .12 for the four closestcolleagues, with respective z-score test statistics of 10.5, 7.8, 3.6, and .4).On average, contacts with whom managers discussed their idea posed
24 Of the 2,790 contacts, 1,991 could be ordered by network constraint. Where contactsposed the same level of constraint (e.g., a network in which every contact discusseswork frequently with every other contact), another 61 contacts could be ordered byputting colleagues in the manager’s business unit ahead of contacts in other businessunits (there are so few because most discussion partners were in the same businessunit). Another 443 contacts could be ordered by their years of relationship with themanager, which left 295 contacts to be ordered at random within same level of networkconstraint, same business unit, and same years known to manager.

Fig. 6.—Idea discussion and individual contacts

Structural Holes and Good Ideas
393
13.6 points of constraint versus 7.6 points for other contacts (9.2 teststatistic).25
The inference of social convenience guiding idea discussion strains thelimits of my data. I know the names of the people with whom managershad their most detailed discussion. I do not have a census of the peoplewith whom managers discussed their idea. Managers could have had theirmost detailed discussion with socially convenient colleagues, then movedon to mobilize support in subsequent discussion with people beyond theirown group. I do not think this is true because there are multiple indicatorsof inertia: from the tendency for managers at all ranks to cite a densecircle of colleagues for work discussion (81% density on average, fig. 2),to the segregation of work discussion from the formal authority structure(discussion network around 69% of the managers excluded their imme-diate supervisor).
As a check on my inference, I returned to the organization (10 monthsafter collecting the data reported in the article) to ask a favor of the long-time employee who had been promoted to run supply-chain operationsfor the company (not one of the original two judges who evaluated ideas).I presented a list of the top 100 ideas, with the names and business unitsof the people proposing the ideas, and asked: “To your knowledge, hasthe person mobilized support to implement the idea or made an effort tomobilize support for the idea?” The list of 100 included all ideas thateither of the two judges had given a maximum-value rating, all ideas thatthe judges together gave a 3.5 or higher average rating, and all ideasproposed by senior managers, directors, or vice presidents. If any of theoriginal ideas were acted upon, these 100 would be the most likely (itseemed too big a favor to ask for an update on all ideas in the originaldata).
The results corroborate the inference about social convenience. Thereis little evidence of managers acting on their ideas. Of the 100 top-ideamanagers, 16 were perceived to have worked on mobilizing support fortheir idea. A logistic model of the 100 ideas shows that action was morelikely for more valuable ideas (2.6 test statistic), from managers withcontacts in other groups (�3.1 test statistic for network constraint) whocited more distant contacts for idea discussion (2.9 test statistic for idea-
25 The survey generated 2,790 contacts for the 455 managers proposing an idea forimproving supply-chain operations. The contacts are discussion partners cited by the455 managers and people citing the managers as discussion partners. All test statisticscomputed from manager-contact relations have been adjusted for autocorrelationwithin manager networks (e.g., Kish and Frankel 1974). Network constraint is cor-related across relations within a network (connection between two contacts increasesthe level of network constraint they each pose), so the autocorrelation adjustment islarge (9.2 test statistic in the text is 12.7 without the autocorrelation adjustment).

American Journal of Sociology
394
discussion contact centrality, fig. 6). People holding more senior rank weremore likely to act on their idea, but the association disappears whennetwork constraint is held constant (3.0 zero-order test statistic drops to1.4), showing that action was less a function of rank than connections toother groups. With respect to figure 6, the managers who acted on theirideas rose above social convenience to discuss their ideas with contactsbeyond their closest colleagues (average rank 5.5 in fig. 6). The managersnot taking action cited much closer colleagues, as expected if social con-venience determined their selection of discussion partners (2.4 rank in fig.6; 3.5 test statistic for difference).
My summary conclusion is that good ideas emerged, as hypothesized,from the intersection of social worlds, but spread—in the organizationstudies here—in a way that would continue segregation between theworlds. There was a brokerage advantage in producing ideas, and com-pany systems were working correctly to reward brokers who producedgood ideas. However, the potential value for integrating operations acrossthe company was dissipated in the distribution of ideas.
REFERENCES
Allen, Thomas J., and Saul Cohen. 1969. “Information Flow in R&D Labs.”Administrative Science Quarterly 14:12–19.
Argote, Linda. 1999. Organizational Learning. Norwell, Mass.: Kluwer Academic.Argote, Linda, Bill McEvily, and Ray Reagans. 2003. “Introduction to the Special Issue
on Managing Knowledge in Organizations: Creating, Retaining, and TransferringKnowledge.” Management Science 49:v–viii.
Barley, Stephen R. 1990. “The Alignment of Technology and Structure through Rolesand Networks.” Administrative Science Quarterly 35:61–103.
Baum, Joel A. C., Tony Calabrese, and Brian S. Silverman. 2000. “Don’t Go It Alone:Alliance Network Composition and Startups’ Performance in CanadianBiotechnology.” Strategic Management Journal 21:267–94.
Baum, Joel A. C., Andrew V. Shipilov, and Tim J. Rowley. 2003. “Where Do SmallWorlds Come From?” Industrial and Corporate Change 12:697–725.
Becker, Gary S., and Kevin M. Murphy. 1992. “The Division of Labor, CoordinationCosts, and Knowledge.” Quarterly Journal of Economics 107:1137–60.
Beckman, Christine M., and Pamela R. Haunschild. 2002. “Network Learning: TheEffects of Partners’ Heterogeneity of Experience on Corporate Acquisitions.”Administrative Science Quarterly 47:92–124.
Birner, Jack. 1999. “Making Markets.” Pp. 36–56 in Economic Organization andEconomic Knowledge, edited by Sheila C. Dow and Peter E. Earl. Northhampton,Mass.: Edward Elgar.
Blau, Peter M. 1977. Heterogeneity and Inequality. New York: Free Press.Bothner, Matthew S. 2003. “Competition and Social Influence: The Diffusion of the
Sixth Generation in the Global Computer Industry.” American Journal of Sociology108:1175–1210.
Bothner, Matthew S., Toby E. Stuart, and Harrison C. White. 2003. “StatusDifferentiation and the Cohesion of Social Networks.” Working paper. GraduateSchool of Business, University of Chicago.

Structural Holes and Good Ideas
395
Burt, Ronald S. 1982. Toward a Structural Theory of Action. New York: AcademicPress.
———. 1992. Structural Holes. Cambridge, Mass.: Harvard University Press.———. 1997. “The Contingent Value of Social Capital.” Administrative Science
Quarterly 42:339–65.———. 1999. “The Social Capital of Opinion Leaders.” Annals 566:37–54.———. 2000. “The Network Structure of Social Capital.” Pp. 345–423 in Research in
Organizational Behavior, edited by Robert I. Sutton and Barry M. Staw. Greenwich,Conn.: JAI Press.
———. 2002. “The Social Capital of Structural Holes.” Pp. 148–92 in The NewEconomic Sociology, edited by Mauro F. Guillen, Randall Collins, Paula England,and Marshall Meyer. New York: Russell Sage Foundation.
Caro, Robert A. 1982. The Path to Power. New York: Alfred A. Knopf.Chandrasekhar, Subrahmanyan. (1975) 1987. “Shakespeare, Newton, and Beethoven,
or Patterns of Creativity.” Pp. 29–58 in Truth and Beauty, edited by SubrahmanyanChandrasekhar. Chicago: University of Chicago Press.
Cohen, Wesley M., and Daniel A. Levinthal. 1990. “Absorptive Capacity: A NewPerspective on Learning and Innovation.” Administrative Science Quarterly 35:128–52.
Coleman, James S. 1990. Foundations of Social Theory. Cambridge, Mass.: HarvardUniversity Press.
Collins, Randall. 1987. “A Micro-Macro Theory of Intellectual Creativity: The Caseof German Idealist Philosophy.” Sociological Theory 5:47–69.
———. 1998. The Sociology of Philosophies. Cambridge, Mass.: Harvard UniversityPress.
Czernich, Christian, and Chip Heath. 2001. “Toward a Theory of Variation in Idea-Markets: Attracting ‘Eyeballs’ to Websites during the Dot-Com Boom and Bust.”Working paper. Graduate School of Business, Stanford University.
Dalzell, Robert F. 1987. Enterprising Elite. New York: W. W. Norton.Denzin, Norman K. 1969. “Symbolic Interactionism and Ethnomethodology: A
Proposed Synthesis.” American Sociological Review 34:922–34.DiMaggio, Paul. 1992. “Nadel’s Paradox Revisited: Relational and Cultural Aspects
of Organizational Structure.” Pp. 118–42 in Networks and Organizations, edited byNitin Nohria and Robert G. Eccles. Boston: Harvard Business School Press.
Durkheim, Emile. (1893) 1933. The Division of Labor in Society, translated by GeorgeSimpson. New York: Free Press.
Feld, Scott L. 1981. “The Focused Organization of Social Ties.” American Journal ofSociology 86:1015–35.
Fernandez, Roberto M., and Roger V. Gould. 1993. “A Dilemma of State Power:Brokerage and Influence in the National Health Policy Domain.” American Journalof Sociology 99:1455–91.
Festinger, Leon, Stanley Schachter, and Kurt W. Back. 1950. Social Pressures inInformal Groups. Stanford, Calif.: Stanford University Press.
Fleck, Ludwik. (1935) 1979. Genesis and Development of a Scientific Fact, translatedby Fred Bradley and Thaddeus J. Trenn. Chicago: University of Chicago Press.
Fleming, Lee. 2002. “Finding the Organizational Sources of TechnologicalBreakthroughs: The Story of Hewlett-Packard’s Thermal Ink-Jet.” Industrial andCorporate Change 11:1059–84.
Geletkanycz, Marta A., and Donald C. Hambrick. 1997. “The External Ties of TopExecutives: Implications for Strategic Choice and Performance.” AdministrativeScience Quarterly 42:654–81.
Geroski, Paul, and Mariana Mazzucato. 2002. “Learning and the Sources of CorporateGrowth.” Industrial and Corporate Change 11:623–44.

American Journal of Sociology
396
Giuffe, Katherine A. 1999. “Sandpiles of Opportunity: Success in the Art World.” SocialForces 77:815–32.
Granovetter, Mark S. 1973. “The Strength of Weak Ties.” American Journal ofSociology 78:1360–80.
———. 2002. “A Theoretical Agenda for Economic Sociology.” Pp. 46–80 in The NewEconomic Sociology, edited by Mauro F. Guillen, Randall Collins, Paula England,and Marshall Meyer. New York: Russell Sage Foundation.
Gulati, Ranjay. 1995. “Social Structure and Alliance Formation Patterns: ALongitudinal Analysis.” Administrative Science Quarterly 40:619–52.
Gulati, Ranjay, and Martin Gargiulo. 1999. “Where Do Interorganizational NetworksCome From?” American Journal of Sociology 104:1439–93.
Hardy, G. H. 1940. A Mathematician’s Apology. New York: Cambridge UniversityPress.
Hargadon, Andrew B. 2002. “Brokering Knowledge: Linking Learning andInnovation.” Pp. 41–85 in Research in Organizational Behavior, vol. 24. Edited byBarry M. Staw and Roderick M. Kramer. Greenwich, Conn.: JAI Press.
Hargadon, Andrew B., and Robert I. Sutton. 1997. “Technology Brokering andInnovation in a Product Development Firm.” Administrative Science Quarterly 42:716–49.
Hatch, Mary Jo. 1999. “Exploring the Empty Spaces of Organizing: HowImprovisational Jazz Helps Redescribe Organizational Structure.” OrganizationStudies 20:75–100.
Hayek, Friedrich A. 1937. “Economics and Knowledge.” Economica 5:33–54.———. 1945. “The Use of Knowledge in Society.” American Economic Review 35:
519–30.Hudson, R. A. 1980. Sociolinguistics. New York: Cambridge University Press.Katz, Elihu, and Paul F. Lazarsfeld. 1955. Personal Influence. New York: Free Press.Kavolis, Vytautas. 1966. “Community Dynamics and Artistic Creativity.” American
Sociological Review 31:208–17.Kish, Leslie, and Martin R. Frankel. 1974. “Inference from Complex Samples.” Journal
of the Royal Statistical Society, Series A 36:1–37.Knoke, David. 2001. Changing Organizations. Boulder, Colo.: Westview Press.Kogut, Bruce. 2000. “The Network as Knowledge: Generative Rules and the
Emergence of Structure.” Strategic Management Journal 21:405–25.Kogut, Bruce, and Gordon Walker. 2001. “The Small World of Germany and the
Durability of National Networks.” American Sociological Review 66:317–35.Kogut, Bruce, and Udo Zander. 1992. “Knowledge of the Firm, Combinative
Capabilities, and the Replication of Technology.” Organization Science 3:383–97.———. 1996. “What Firms Do? Coordination, Identity, and Learning.” Organization
Science 7:502–18.Koput, Kenneth, and Walter W. Powell. 2003. “Organizational Growth and Alliance
Capability: Science and Strategy in a Knowledge-Intensive Industry.” Workingpaper. College of Business and Public Administration, University of Arizona.
Kuhn, Thomas S. 1962. The Structure of Scientific Revolutions. Chicago: Universityof Chicago Press.
Lamont, Michele. 1987. “How to Become a Dominant French Philosopher: The Caseof Jacques Derrida.” American Journal of Sociology 93:584–622.
Lazega, Emmanuel, and Philippa E. Pattison. 2001. “Social Capital as SocialMechanisms and Collective Assets: The Example of Status Auctions amongColleagues.” Pp. 185–208 in Social Capital, edited by Nan Lin, Karen S. Cook, andRonald S. Burt. Chicago: Aldine de Gruyter.
Lin, Nan. 2002. Social Capital. New York: Cambridge University Press.Llobrera, Joseph T., David R. Meyer, and Gregory Nammacher. 2000. “Trajectories

Structural Holes and Good Ideas
397
of Industrial Districts: Impact of Strategic Intervention in Medical Districts.”Economic Geography 76:68–98.
March, James G. 1991. “Exploration and Exploitation in Organization Learning.”Organization Science 2:71–87.
Marsden, Peter V. 1987. “Core Discussion Networks of Americans.” AmericanSociological Review 52:122–31.
———. 1990. “Network Data and Measurement.” Annual Review of Sociology 16:435–63.
———. 2004. “Recent Developments in Network Measurement.” In Models andMethods in Social Network Analysis, edited by Peter J. Carrington, John Scott, andStanley Wasserman. New York: Cambridge University Press.
McEvily, Bill, and Alfred Marcus. 2002. “Embeddedness and the Acquisition ofCompetitive Capabilities.” Working paper. Graduate School of IndustrialAdministration, Carnegie Mellon University.
McEvily, Bill, and Akbar Zaheer. 1999. “Bridging Ties: A Source of Firm Heterogeneityin Competitive Capabilities.” Strategic Management Journal 20:1133–56.
McGuire, Patrick, and Mark Granovetter. In press. “The Social Construction of theElectric Utility Industry, 1878–1919.” In Constructing Industries and Markets, editedby Joe Porac and Marc Ventresca. New York: Pergamon.
Meltzer, David. 2001. “Hospitalists and the Doctor-Patient Relationship.” Journal ofLegal Studies 30:589–606.
Menon, Tanya, and Jeffrey Pfeffer. 2003. “Valuing Internal vs. External Knowledge:Explaining the Preference for Outsiders.” Management Science 49:497–513.
Merton, Robert K. (1948) 1968a. “The Bearing of Empirical Research on SociologicalTheory.” Pp. 156–71 in Social Theory and Social Structure. New York: Free Press.
———. (1949) 1968b. “Patterns of Influence: Local and Cosmopolitan Influentials.”Pp. 441–74 in Social Theory and Social Structure. New York: Free Press.
———. (1957) 1968c. “Continuities in the Theory of Reference Group Behavior.” Pp.335–440 in Social Theory and Social Structure. New York: Free Press.
Milgram, Stanley. 1967. “The Small World Problem.” Psychology Today 1:61–67.Mills, John Stuart. (1848) 1987. Principles of Political Economy. Fairchild, N.J.:
Augustus M. Kelley.Mitchell, Lawrence E. 2003. “Structural Holes, CEOs, and Informational Monopolies:
The Missing Link in Corporate Governance.” Working paper. Law School, GeorgeWashington University.
Moreno, Jacob L. 1940. “Mental Catharsis and the Psychodrama.” Sociometry 3:209–43.
———. 1955. “Theory of Spontaneity-Creativity.” Sociometry 18:105–18.Morrison, Elizabeth Wolfe, and Frances J. Milliken. 2002. “Organizational Silence: A
Barrier to Change and Development in a Pluralistic World.” Academy ofManagement Review 25:706–25.
Morselli, Carlo. 2003. “Career Opportunities and Network-Based Privileges in the CosaNostra.” Crime, Law, and Social Change 37:383–418.
Nahapiet, Janine, and Sumantra Ghoshal. 1998. “Social Capital, Intellectual Capital,and the Organization Advantage.” Academy of Management Review 23:242–66.
Northway, Mary L., and Margaret McCallum Rooks. 1955. “Creativity and SociometricStatus in Children.” Sociometry 18:194–201.
Padgett, John F., and Christopher K. Ansell. 1993. “Robust Action and the Rise of theMedici, 1400–1434.” American Journal of Sociology 98:1259–1319.
Phillips, Damon J., and Ezra W. Zuckerman. 2002. “Middle-Status Conformity:Theoretical Restatement and Empirical Demonstration in Two Markets.” AmericanJournal of Sociology 107:379–429.
Planck, Max. (1949) 1968. Scientific Autobiography and Other Papers. Westport, Conn.:Greenwood Publishing Group.

American Journal of Sociology
398
Podolny, Joel M. 1993. “A Status-Based Model of Market Competition.” AmericanJournal of Sociology 98:829–72.
———. 2001. “Networks as the Pipes and Prisms of the Market.” American Journalof Sociology 107:33–60.
Pollock, Timothy G., Joseph F. Porac, James B. Wade. 2003. “Constructing DealNetworks: Brokers as Network Architects in the U.S. IPO Market and OtherExamples.” Academy of Management Review 29:50–72.
Portes, Alejandro. 1998. “Social Capital: Its Origins and Applications in ModernSociology.” Annual Review of Sociology 24:1–24.
Powell, Walter W., and Peter Brantley. 1992. “Competitive Cooperation inBiotechnology: Learning through Networks?” Pp. 366–94 in Networks andOrganizations, edited by Nitin Nohria and Robert G. Eccles. Boston: HarvardBusiness School Press.
Powell, Walter W., Kenneth W. Koput, and Laurel Smith-Doerr. 1996.“Interorganizational Collaboration and the Locus of Innovation: Networks ofLearning in Biotechnology.” Administrative Science Quarterly 41:116–45.
Powell, Walter W., Kenneth W. Koput, Laurel Smith-Doerr, and Jason Owen-Smith.1999. “Network Position and Firm Performance: Organizational Returns toCollaboration.” Pp. 129–60 in Research in the Sociology of Organizations, edited bySteven Andrews and David Knoke. Greenwich, Conn.: JAI Press.
Powell, Walter W., and Laurel Smith-Doerr. 1994. “Networks and Economic Life.”Pp. 368–402 in The Handbook of Economic Sociology, edited by Neil J. Smelserand Richard Swedberg. Princeton, N.J.: Princeton University Press.
Provan, Keith G., and H. Brinton Milward. 1995. “A Preliminary Theory ofInterorganizational Network Effectiveness: A Comparative Study of FourCommunity Mental Health Systems.” Administrative Science Quarterly 40:1–33.
Reagans, Ray, and Bill McEvily. 2003. “Network Structure and Knowledge Transfer:The Effects of Cohesion and Range.” Administrative Science Quarterly 48:240–67.
Rees, Albert. 1966. “Information Networks in Labor Markets.” American EconomicReview 56:559–66.
Ruef, Martin. 2002. “Strong Ties, Weak Ties and Islands: Structural and CulturalPredictors of Organizational Innovation.” Industrial and Corporate Change 11:427–49.
Schumpeter, Joseph A. (1912) 1934. The Theory of Economic Development, translatedby Redvers Opie. Cambridge, Mass.: Harvard University Press.
———. 1947. “The Creative Response in Economic History.” Journal of EconomicHistory 7:149–59.
Sediatis, Judith. 1998. “The Alliances of Spin-offs Versus Start-ups: Social Ties in theGenesis of Post-Soviet Alliances.” Organization Science 9:368–81.
Shane, Scott, and Daniel Cable. 2002. “Network Ties, Reputation, and the Financingof New Ventures.” Management Science 48:364–81.
Simmel, Georg. (1922) 1955. Conflict and the Web of Group Affiliations. New York:Free Press.
Simonton, Dean Keith. 1984. Genius, Creativity, and Leadership. Cambridge, Mass.:Harvard University Press.
Smith, Adam. (1766) 1982. Lectures on Jurisprudence. Indianapolis, Ind.: Liberty Fund.Sorenson, Olav, and Toby E. Stuart. 2001. “Syndication Networks and the Spatial
Distribution of Venture Capital Investments.” American Journal of Sociology 106:1546–88.
Stephan, Paula E., and Sharon G. Levin. 1992. Striking the Mother Lode in Science.New York: Oxford University Press.
Stewart, Thomas A. 1996. “The Great Conundrum: You vs. the Team.” Fortune 134(November): 165–66.
Stigler, George J. (1982) 1986. “The Process and Progress of Economics.” Pp. 134–49

Structural Holes and Good Ideas
399
in The Essence of Stigler, edited by Kurt R. Leube and Thomas Gale Moore.Stanford, Calif.: Hoover Institution Press.
Stuart, Toby E. 1998. “Producer Network Positions and Propensities to Collaborate:An Investigation of Strategic Alliance Formations in a High-Technology Industry.”Administrative Science Quarterly 43:668–98.
Stuart, Toby E., Ha Hoang, and Ralph C. Hybels. 1999. “InterorganizationalEndorsements and the Performance of Entrepreneurial Ventures.” AdministrativeScience Quarterly 44:315–49.
Stuart, Toby E., and Joel M. Podolny. 1999. “Positional Causes and Correlates ofStrategic Alliances in the Semiconductor Industry.” Pp. 161–82 in Research in theSociology of Organizations, edited by Steven Andrews and David Knoke. Greenwich,Conn.: JAI Press.
Sutton, Robert I., and Andrew B. Hargadon. 1996. “Brainstorming Groups in Context:Effectiveness in a Product Design Firm.” Administrative Science Quarterly 41:685–718.
Swedberg, Richard. 1990. Economics and Sociology. Princeton, N.J.: PrincetonUniversity Press.
Tillman, Robert, and Michael Indergaard. 1999. “Field of Schemes: Health InsuranceFraud in the Small Business Sector.” Social Problems 46:572–90.
Travers, Jeffrey, and Stanley Milgram. 1969. “An Experimental Study of the SmallWorld Phenomenon.” Sociometry 32:425–43.
Von Hippel, Eric. 1988. The Sources of Innovation. New York: Oxford UniversityPress.
Walker, Gordon, Bruce Kogut, and Weijian Shan. 1997. “Social Capital, StructuralHoles and the Formation of an Industry Network.” Organization Science 8:109–25.
Watts, Duncan J. 1999. “Networks, Dynamics, and the Small-World Phenomenon.”American Journal of Sociology 105:493–527.
Watts, Duncan J., and Steven H. Strogatz. 1998. “Collective Dynamics of ‘Small-World’Networks.” Nature 393:440–42.
White, Harrison C. 1993. Careers and Creativity. Boulder, Colo.: Westview Press.Williams, Phil. 1998. “The Nature of Drug-Trafficking Networks.” Current History
97:154–59.