STRUCTURAL HEALTH MONITORING OF HISTORIC MASONRY MONUMENTS
77
Clemson University TigerPrints All eses eses 8-2011 STRUCTUL HEALTH MONITORING OF HISTORIC MASONRY MONUMENTS Saurabh Prabhu Clemson University, [email protected] Follow this and additional works at: hps://tigerprints.clemson.edu/all_theses Part of the Civil Engineering Commons is esis is brought to you for free and open access by the eses at TigerPrints. It has been accepted for inclusion in All eses by an authorized administrator of TigerPrints. For more information, please contact [email protected]. Recommended Citation Prabhu, Saurabh, "STRUCTUL HEALTH MONITORING OF HISTORIC MASONRY MONUMENTS" (2011). All eses. 1160. hps://tigerprints.clemson.edu/all_theses/1160
Transcript of STRUCTURAL HEALTH MONITORING OF HISTORIC MASONRY MONUMENTS
Clemson UniversityTigerPrints
All Theses Theses
8-2011
STRUCTURAL HEALTH MONITORING OFHISTORIC MASONRY MONUMENTSSaurabh PrabhuClemson University, [email protected]
Follow this and additional works at: https://tigerprints.clemson.edu/all_theses
Part of the Civil Engineering Commons
This Thesis is brought to you for free and open access by the Theses at TigerPrints. It has been accepted for inclusion in All Theses by an authorizedadministrator of TigerPrints. For more information, please contact [email protected].
Recommended CitationPrabhu, Saurabh, "STRUCTURAL HEALTH MONITORING OF HISTORIC MASONRY MONUMENTS" (2011). All Theses.1160.https://tigerprints.clemson.edu/all_theses/1160

i
STRUCTURAL HEALTH MONITORING OF HISTORIC MASONRY
MONUMENTS
A Thesis
Presented to
the Graduate School of
Clemson University
In Partial Fulfillment
of the Requirements for the Degree
Master of Science
Civil Engineering
by
Saurabh Arvind Prabhu
August 2011
Accepted by:
Dr. Sez Atamturktur, committee chair
Dr. Nadarajah Ravichandran
Dr. Bryant Nielson
Craig M. Bennett Jr.

ii
ABSTRACT
Structural Health Monitoring (SHM) is a well-accepted diagnostic technique being used to
evaluate modern structures. This method involves monitoring the vibration response of a structure
to detect changes in its structural state. The primary intention of this thesis is to address two
practical and technical difficulties encountered in deploying SHM on historic masonry
monuments: (i) the selection of suitable low dimensional vibration response features that are
highly sensitive to the presence and extent of damage, while having low sensitivity to extraneous
noise and (ii) the selection of optimal sensor locations for efficient system identification applied
to Gothic Cathedrals. Both of the features of this thesis achieve reduction in the size of the raw
data to be analyzed leading to reduced computational as well as monetary effort. Compression of
the raw vibration response data acquired from the vibration tests on structures is vital from the
standpoint of faster real time monitoring of historic structures.
This thesis is composed of two manuscripts. The first manuscript illustrates the concepts of
feature assimilation and noise sensitivity on an arch-like structure using both numerical and
experimental analysis. The second study is focused on finding optimal sensor locations for
vibration testing of Gothic Cathedrals. A modified version of the Effective Independence Method
is used for this purpose. This thesis aims to develop a best-practices guide for effective
application of SHM for the use of professionals involved in assessing, preserving and maintaining
cultural monuments.

iii
DEDICATION
I would like to dedicate this thesis to my parents Arvind Prabhu and Meena Prabhu and my sister
Gauri Prabhu.

iv
ACKNOWLEDGMENTS
I would like to thank my adviser Dr. Sez Atamturktur and my committee members Dr. Ravi, Dr.
Nielson and Mr. Bennett for their constant support and encouragement throughout my degree
program. I also want to thank my collaborator, Jordan Supler whose meticulous work has
contributed to this thesis. I also would like to thank the PTT Grants program of National Center
for Preservation Technology and Training (NCPTT) of Department of Interior, for providing the
funds that made this work possible.

v
TABLE OF CONTENTS
Page
TITLE PAGE ...................................................................................................................... i
ABSTRACT ........................................................................................................................ ii
DEDICATION .................................................................................................................... iii
ACKNOWLEDGEMENTS ................................................................................................ iv
LIST OF FIGURES ............................................................................................................ vi
LIST OF TABLES .............................................................................................................. ix
CHAPTER
I. INTRODUCTION ................................................................................................. 1
II. FEATURE ASSIMILATION FOR
CONDITION BASED MAINTENANCE ....................................................... 6
Introduction .................................................................................................................. 7
Case Study Application: Arch Prototype ..................................................................... 10
Experimental Procedure ............................................................................................... 11
Extracting Vibration Response Features ...................................................................... 13
Assimilating Vibration Response Features .................................................................. 20
Discussions ................................................................................................................... 25
Conclusions .................................................................................................................. 26
Acknowledgements ...................................................................................................... 27
References .................................................................................................................... 27
III. VIBRATION TESTING OF GOTHIC CATHEDRALS:
OPTIMAL SENSOR LOCATIONS BASED ON
MODIFIED EFFECTIVE INDEPENDENCE METHOD ............................ 32
Introduction .................................................................................................................. 33
Modified Effective Independence Method ................................................................... 35
The Case Study Structure ............................................................................................. 40
Development and Validation of Finite Element Model................................................ 41
Sensor Optimization ..................................................................................................... 47
Discussions ................................................................................................................... 52
Conclusions .................................................................................................................. 57
Acknowledgments ........................................................................................................ 59
References .................................................................................................................... 59
CONCLUSIONS .............................................................................................................. 66

vi
LIST OF FIGURES
Figure Page
2.1 Sensitivity of damage indicators to varying levels of damage. .......................... 8
2.2 Crack locations in an arch due to concentrated load at the
quarter span using the inverted chain analogy, reprinted
from Heyman (1997) with permission. ....................................................... 10
2.3 (Left) FE model of the arch with a static load at
quarter span, (Right) arch experiencing maximum
damage through artificial cracks. ................................................................ 11
2.4 (Left) Test structure used for experimental study, (Right) hammer
impact locations on the test arch. ................................................................ 12
2.5 Percentage change in the first four natural frequencies with
progressive damage. .................................................................................... 14
2.6 Percentage change in the first four mode shape vectors with
progressive damage.. ................................................................................... 15
2.7 Percentage change in mode shape curvature with
progressive damage. .................................................................................... 16
2.8 (top) Skewness and (bottom) kurtosis of FRF
measurements from the experimental hammer
impact test. .................................................................................................. 18
2.9 Absolute percentage change in the (Left) skewness
and (Right) kurtosis for FRFs from the experimental
campaign with the dashed lines signifying
the noise sensitivity.. ................................................................................... 19
2.10 Singular Value Decomposition (SVD) scores for
AR model parameters of the FRFs from the
experimental campaign................................................................................ 20
2.11 Damage sensitivity comparison of various damage
indicators with progressive damage:
(Top) experimental campaign with three features,
(Bottom) experimental campaign with five features.. ................................. 22

vii
List of Figures (Continued)
Figure Page
2.12 Changes in FRFs for increasing damage levels
with and without ambient noise.. ................................................................. 24
2.13 Assimilated damage indicator with the change
in skewness and kurtosis and the assimilated
noise level for the two features.. .................................................................. 25
3.1 (a) The west front of the Cathedral Church of St. John the.
Divine, New York, (b) sectional elevation drawing
of the nave. .................................................................................................. 40
3.2 (a) Photo of the nave vaults, (b) FE model of
the vaults. .................................................................................................... 43
3.3 The 3-D meshed FE model of the bay. .............................................................. 45
3.4 Cracks at the rose opening (highlighted) corresponding to
high tensile stress regions in the FE model. ................................................ 46
3.5 Cracks at the walkways (highlighted) between the buttress
and the nave corresponding to the high tensile stress
regions in the FE model............................................................................... 47
3.6 (a) The accessible locations on the structure highlighted;
(b) the candidate sensor locations shown as dots. ....................................... 48
3.7 Nine target mode shapes desired to be extracted
during the in-situ modal analysis. ................................................................ 49
3.8 Fisher information matrix determinant updated with sensors
eliminated iteratively. .................................................................................. 50
3.9 Effective independence values of the sensors with respect
to the iteratively updated mode shape matrix; (inset)
zoomed in to 80 optimal sensors. ................................................................ 50
3.10 Optimal sensor locations for triaxial sensors on the full bay
(a) without DBC, (b) with DBC of 3 meters. .............................................. 51
3.11 Behavior of the Fisher information matrix determinant
for different DBC. ....................................................................................... 52
viii
List of Figures (Continued)
Figure Page
3.12 Optimal sensor locations after 5% reduction in the
Elastic modulus of each of five materials without a DBC. ......................... 54
3.13 The optimal sensor locations for the 6 models with DBC
of (a) 0 m (or no DBC); (b) 1 m; (c) 1.5 m; (d) 2 m;
(e) 2.5 m; (f) 3 m. ........................................................................................ 55
3.14 Optimum sensor locations in the six FE models using a DBC
of 1.5m and applying the error theory. ........................................................ 56

ix
LIST OF TABLES
Table Page
3.1 Comparison of experimental and analytical modal analysis
results of the vaults of St John the Divine. .................................................. 44
3.2 Element type and material properties used in the FE model
for different parts of the structure. ............................................................... 45

1
CHAPTER ONE
INTRODUCTION
There are a large number of monumental masonry buildings currently in service that have
been built using medieval construction techniques. The U.S. National Register of Historic Places
(National Park Service 2009) for instance, lists over 2,000 historic buildings in the continental
U.S. built in the 'Gothic' style alone. These historic masonry monuments experience the
degrading effects of aging and accumulated damage over their lifetime. If the structural integrity
of these monuments is not proactively maintained, these monuments may experience sudden loss
of integrity without warning. In the past few decades, numerous historic masonry structures have
suddenly lost their structural integrity resulting in partial collapse; some of the more notable
examples include the Civic Tower of Pavia, Italy (Binda et al. 1992); the bell tower of St.
Magdalena in Goch, Germany (Gantert Engineering Studio 1993); Cathedral of Noto, Italy
(Binda et al. 1999); the bell tower of the St. Willibrordus Church in Meldert, Belgium (Ignoul and
Van Gemert 2006); “Maagdentoren” in Zichem, Belgium (Ignoul and Van Gemert 2007); Church
of Kerksken, Belgium (Verstrynge et al. 2011). These incidents have increased the relevance and
awareness of safeguarding culturally significant masonry structures through periodic evaluation
and assessment. This is currently accomplished using localized techniques (such as endoscopes,
thermographs, sonic tomography, ultrasonic, acoustics, radiographs, and the impact-echo method)
that are limited in effectiveness when the vicinity of damage is unknown or inaccessible. Also,
localized methods are labor intensive and require highly trained personnel. Structural Health
Monitoring (SHM) has the potential to be a fully automated, long-term diagnostic approach for

2
use in the continuous monitoring of structural behaviors (for a review of the method, see Carden
and Fanning 2004 and Doebling et al. 1996).
SHM techniques based on global vibration measurements are particularly advantageous when
structural problems occur internally, making visual identification of impending loss of integrity
difficult. Through early diagnosis, sudden collapse of the structure can be avoided and, thus, the
costs of reconstruction can be reduced significantly in addition to the life-safety of the occupants.
It is unlikely that one can perform destructive testing on historic monuments owing to its historic
and cultural significance.
The basic concept in SHM is that the vibration response of a structure is dependent upon
physical properties such as mass, stiffness, and damping. A change in the structural state of a
building will change these properties, which in turn alters the vibration response. The underlying
assumption is that changes in vibration response, as measured through in situ measurements, can
be related to the structural state of a building. Vibration testing is then typically accomplished by
exciting a structure using controlled vibrations (e.g. impact hammers, shakers) and capturing the
response of the system over time. These time history responses are then transformed into the
frequency domain through a fast Fourier transform (FFT). Estimates of the vibration parameters
of the structure i.e. the natural frequencies, mode shapes, and damping ratios are obtained by
applying various signal processing techniques.
By monitoring frequency response characteristics, SHM has been successively applied to
modern structures. However, the application of this new technology to existing historic masonry
monuments is still considered to be an unsolved issue (De Stefano and Ceravolo 2007). The
greatest obstacle to the successful application of SHM in existing monumental structures is the
lack of guidance in making suitable decisions about the following two aspects:

3
1. Selection of suitable vibration response features (damage indicator) for symptom-based
diagnosis of damage, such as peak response, FRF amplitude, natural frequencies, mode
shapes, mode shape curvature, etc. (Farrar et al. 2007).
2. Placement of sensors in optimum locations so that vibration response is sensitive to
damage.
This thesis, which aims at addressing these two major issues, is compilation of two
manuscripts. The first manuscript introduces the concept of feature assimilation with an intention
of early detection of damage in the structure and increased confidence in presence of extraneous
noise that corrupts the data. It is emphasized that observing multiple low dimensional features
together is more advantageous than focusing on a single feature. This concept is illustrated on an
arch, a common structural component of historic masonry construction. The second manuscript
presents an elaborate methodology applied for finding optimal sensor locations for deploying
SHM on Gothic style Cathedrals. Ultimately, this thesis supplies a best practice guide to be used
by engineers for testing Gothic style masonry Cathedrals. Although, demonstrated on Gothic style
Cathedral, the methodology applied is deemed suitable for any structure.
With proper guidance, the techniques of SHM can be extended beyond modern buildings to
existing historic masonry monuments. This thesis intends to make such guidance available to
professionals involved in assessing, preserving and maintaining historic structures.
REFERENCES
Binda, L., Gatti, G., Mangano, G., Poggi, C., and Landriani, G. S. (1992). "Collapse of the Civic
Tower of Pavia: A Survey of the Materials and Structure." Masonry International, 6(1), 11-20.

4
Binda, L., Baronio, G., Gavarini, C., De Benedictis, R., and Tringali, S. (1999). "Investigation on
materials and structures for the reconstruction of the partially collapsed Cathedral of Noto
(Sicily)." International conference structural studies, repairs and maintenance of historical
buildings, STREMAH 99, Dresden, Germany 323-332.
Carden, E. P., Fanning, P., (2004), “Vibration Based Condition Monitoring: A Review,”
Structural Health Monitoring, vol. 3, no. 4, pp. 355- 377.
De Stefano, A., and Ceravolo, r., (2007), “Assessing the Health State of Ancient Structures: The
Role of Vibration Tests,” Journal of Intelligent Material Systems and Structures, Vol. 1, No. 15,
pp. 1- 15.
Doebling S. W., Farrar, C.R., Prime, M. B., Shevitz, D.W., (1996), “Damaga Identification and
health monitoring of structural and mechanical systems from changes in their vibration
characteristics: A literature Review,: Research Rep. No LA-13070-MS, ESA-EA, Los Alamos
National Laboratory, Los Alamos, N.M.
Farrar, C. R., Worden, K., Todd, M. D., Park, G., Nichols, J., Adams, D. E., Bement, M. T. and
Farinholt, K., (2007), “Nonlinear System Identification for Damage Detection,” Los Alamos
National Laboratory Report, LA-14353, 2007.
Gantert Engineering Studio (1993) “Technical opinion about the collapse of the Bell Tower of St.
Maria Magdalena in Goch (Germany).”
Ignoul S., Van Gemert D., (2006). “Bell Tower of Church of St. Willibrordus”, D00466,
Triconsult NV, internal report to, in Dutch.

5
Ignoul S., Van Gemert D., (2007). “Maagdentoren at Zichem”, D00394, Triconsult NV, internal
report, in Dutch.
Verstrynge, E., Schueremans, L., Van Gemert, D., and Hendriks, M.A.N. (2011). “Modeling and
analysis of time-dependent behavior of historical masonry under high stress levels.” Engineering
Structures, 33(1), 210-217.

6
CHAPTER TWO
FEATURE ASSIMILATION FOR CONDITION BASED MAINTENANCE
ABSTRACT
Structural health monitoring (SHM) technology for the early detection and mitigation of
adverse structural effects, such as degradation or damage, is useful in enhancing the proactive
maintenance of civil infrastructure. SHM techniques are advantageous since they eliminate the
need for both a priori knowledge of the location of damage and access to the damaged portion of
the structure. The underlying principle behind SHM involves measuring changes in a system‟s
vibration response, which ultimately indicates changes in physical properties due to structural
damage. A challenge to the successful application of SHM to civil infrastructure is the selection
of suitable vibration response features that are highly sensitive to the presence and extent of
damage, while having low sensitivity to extraneous noise. This study reveals that both damage
and noise sensitivity of vibration response features vary for different states of structural health;
therefore, the selection of optimum features is dependent on the damage severity, which is not
known a priori. This study illustrates that assimilating multiple low-dimensional features lessens
this dependency and improves the sensitivity of the damage indicators for SHM diagnosis.
KEYWORDS: Vibration Testing, Experimental Modal Analysis, Damage Detection,
System Identification, Feature Extraction, Masonry Arches.

7
1 INTRODUCTION
Structural Health Monitoring (SHM) based on vibration measurements, has emerged as a
global monitoring technique to diagnose damage in a system prior to the structural condition
reaching a critical stage. The underlying principle of SHM is straightforward: the onset of
damage in a built system modifies the structural properties, such as mass, stiffness and damping,
which in turn alters the vibration response of the system. Focusing on this indirect relationship
between the structural damage and changes in the measured vibration response, SHM aims to
detect the onset of damage as well as determine damage characteristics [1]. In an ideal situation,
the changes in the measured vibration response are directly correlated with the desired damage
characteristics, such as the severity, type and location of damage [2]. However, attempts to
correlate the changes in the measured raw time domain vibration response to damage
characteristics are hindered by two factors: (i) the difficulty in monitoring the trends in the
oversized measurement data and (ii) the high sensitivity of the time domain measurements to
extraneous factors caused by the natural variations in the operational and environmental
conditions. Thus, low-dimensional vibration response features are extracted from the raw time
domain measurements through data processing and interrogation [3]. While the most common
vibration response features include natural frequencies, mode shapes, and basic properties of the
time history response, such as peak acceleration, many other forms of vibration response features
can be extracted from the raw time domain vibration measurements. Ideally, the extracted
vibration response features should be sensitive to damage, but insensitive to extraneous noise
factors [4]. For practical applications of SHM on civil structures, there has been much debate
over whether vibration response features can be sufficiently sensitive to damage, while remaining
insensitive to noise [5-8]. For instance, while some studies [9-12] found vibration response to be

8
insensitive to damage; other studies [13-17] observed vibration features to be reliable damage
indicators.
Figure 1 schematically illustrates the difference between a damage-sensitive and -insensitive
vibration response feature. In Figure 1, the unitless damage indicator represents the measured
change in a vibration response feature corresponding to the unitless damage index. The damage
index, which quantitatively represents the extent of damage, ranges from a value of zero,
representing an undamaged structure, to a value that represents the most severe damage condition
of interest. The slope of the plot, denoted by α, defines the damage sensitivity of a given feature.
A steeper slope, α, of the plot means a more sensitive feature. Hypothetically, in a worst case
scenario, as the damage sensitivity of a feature approaches zero, the feature has insignificant
sensitivity; and in a best case scenario, as the damage sensitivity approaches infinity, the feature
has significant sensitivity to damage.
Figure 1: Sensitivity of damage indicators to varying levels of damage.

9
The presence of extraneous noise during vibration testing decreases the ability of vibration
features to indicate changes due to damage. Therefore, the damage sensitivity must be considered
in light of the noise sensitivity of the feature, which also varies for varying structural states. The
schematic illustration in Figure 1 represents the noise sensitivity level gradually increasing for
increasing stages of damage. As Figure 1 illustrates, insensitive damage indicators may remain
below their noise level even for very high damage indices. On the other hand, sensitive indicators
are those that yield values significantly above noise levels at early stages of damage. The
schematic illustration of Figure 1 is, of course, an idealized approximation. In practice, both
damage and noise sensitivity of vibration response features may vary nonlinearly for different
states of structural health; therefore, the selection of optimum features may become dependent
upon the damage severity. Moreover, the difficulty in selection of optimum features is
compounded with the fact that the feature sensitivity may also change for different damage types.
Of course, neither the damage type nor the severity is known a priori; therefore, it becomes
necessary to use multiple vibration response features to account for the non-uniform relationship
of a feature‟s sensitivity to varying damage type and severity.
The objective of this study is to investigate if damage sensitivity of SHM diagnostics can be
improved by assimilating multiple low dimensional vibration response features instead of
focusing on a single feature. An experimental study is completed on a scaled semi-circular arch.
Section 2 introduces the case study structure and Section 3 overviews the design and execution of
the experimental campaign. Section 4 investigates discusses the damage sensitivity of commonly
used features. Section 5 overviews the practical application of the assimilation concept and
presents the noise sensitivity of selected features. Finally in Section 6, overview of the main
findings, discussions on the underlying premises and suggestions for future directions are given.

10
2 CASE STUDY APPLICATION: ARCH PROTOTYPE
The present study investigates the vibration response of an idealized arch model, a common
structural form found in masonry construction, and mimics a typical failure mechanism of
masonry arches. If a masonry arch is loaded beyond its capacity, cracks incrementally develop
within the arch assembly. A crack propagating through the entire depth of the arch forms a hinge.
According to mechanism analysis, the development of four hinges is needed to ensure the failure
of an arch with a fixed support [18] (Figure 2), while the location of these four hinges depends
upon the loading condition. Herein, a numerical model is used to determine the precise locations
of the cracks under a static concentrated load applied at quarter span (Figure 3). Four distinct
locations with the highest von Mises stress are approximated as the locations of the four hinges,
which agree well with those obtained through a nonlinear FE analysis by Ramos [19] (Figure 3).
Figure 2: Crack locations in an arch due to concentrated load at the quarter span using the
inverted chain analogy, reprinted from Heyman (1997) with permission.

11
Figure 3: (Left) FE model of the arch with a static load at quarter span, (Right) arch experiencing
maximum damage through artificial cracks.
For the experimental campaign, a PVC arch with a.31.8cm radius, 64cm depth and 2.5cm
thickness is used (Figure 4). The arch is damaged to four levels in succession, with a 2cm deep
crack at each of the four hinge locations as shown in Figure 3a. A total of four damage states are
obtained with varying levels of structural damage.
3 EXPERIMENTAL PROCEDURE
The response is measured at 33 equidistant measurement points with three across the width of
the arch and 11 on the perimeter. Hammer impact tests are performed exciting two points (points
21 and 23) on the arch, allowing the excitation of both bending and torsional modes (Figure 4).
Point 23, located through the centerline of the arch, primarily excites the bending modes, while
Point 21, located at the edge, primarily excites the torsional modes. Piezoelectric IEPE
accelerometers with a sensitivity of 500 mV/g are used to measure the vibrations, while an impact
hammer with a sensitivity of 2.27 mV/N and a maximum force capacity of 2200 N is used to
excite the structure. The impact hammer is used with the softest plastic tip available.

12
Figure 4: (Left) Test structure used for experimental study, (Right) hammer impact locations on
the test arch.
Impact hammer tests are performed with a frequency range of 0 to 1.6 kHz. The frequency
resolution is set to 1 Hz and the time resolution is set at 244 μsec. The acceleration response is
measured for 1 second, within which the response of the arch is attenuated; therefore, no
windowing function is applied. To reduce the degrading effects of noise and to increase statistical
reliability, a total of five averages are obtained. Anti-aliasing filters are used to prevent higher
frequencies from contaminating the measurements.
Using the Rational Fraction Polynomial algorithm, Frequency Response Functions (FRFs)
collected for each damage state, are analyzed to identify the natural frequency and mode shapes
of the arch. The modes are selected using both the Summation and Multivariate Mode Indicator
Functions (MMIF) [20]. These functions make the resonance peaks in the FRFs more evident.
The first four modes of the model arch are identified. Next, the tests are repeated in the presence
of artificial, random noise to investigate the effect of damage levels on the noise sensitivity of
FRFs.

13
4 EXTRACTING VIBRATION RESPONSE FEATURES
Rarely, multiple vibration response features are objectively and quantitatively compared in
their ability to indicate damage [6]. In this study, an extensive list of vibration response features is
evaluated, including Frequency Response Assurance Criterion (FRAC) [21], Root-Mean-Square
(RMS) Time Domain Response [22], Modal Assurance Criterion (MAC) [23], and Coordinate
Modal Assurance Criterion (COMAC) [24]. For brevity only a select few of the most common of
these features are reported in detail, while a brief summary of the results for the rest are provided
in Section 6.
4.1 NATURAL FREQUENCY CHANGES
Natural frequencies (also known as resonant frequencies) supply convenient, low-
dimensional and physically meaningful vibration response features [7, 25-27]. In earlier SHM
related studies, higher order natural frequencies are reported to be more sensitive to damage than
lower order natural frequencies [28-29]. For instance in a recent study, the first three natural
frequencies are observed to be identical for a damaged and undamaged masonry vault of Beverley
Minster, a masonry cathedral located in the U.K. [30]. In contrast with earlier studies, for the
arch studied herein, the natural frequencies are noted to exhibit sensitivity to the propagation of
cracks (Figure 5).
The measured changes in the first, third and fourth natural frequencies reach approximately
18% for the most severe damage state. The experiments identify the frequency of the second
mode as the least sensitive feature. The first, third and fourth natural frequencies exhibit a
monotonic increase for increasing levels of damage; while the second natural frequency exhibits
false-negatives since the % change in the frequency is reduced from the second damage state to
the third. In such a situation, the monitored structure may appear to be at the same (or better)

14
structural health level, while in fact the damage is propagating, i.e. the structure exhibits a false
negative.
Figure 5: Percentage change in the first four natural frequencies with progressive
damage.
4.2 MODE SHAPE DISTORTIONS
The onset of damage in a structural system tends to distort the mode shapes [31]. For SHM
purposes, the mode shape distortions can be exploited in a variety of forms, such as MAC
correlation or percentage change, as reviewed by Ewins and Ho [32]. In this study, when
determining mode shape distortion, the mode shape vectors are first normalized between 0 and 1,
and then the percentage change in mode shape difference is calculated according to Equation (1):
∑ | |
∑ (1)
where:
xd = the modal displacement of damaged structure
xu = the modal displacement of undamaged structure
N = the number of measurement points.

15
This percentage change is reported for the 33 measurement points of the experimental arch model
in Figure 6.
Figure 6: Percentage change in the first four mode shape vectors with progressive damage.
Compared to the natural frequencies, the sensitivity of the mode shape distortion is observed
to be significantly higher. The second, third and fourth mode shapes exhibit an approximately 65-
85% distortion for the most severe damage state; this value is only 30% for the first mode shape.
The experimental findings presented in Figure 6 reveal a nonlinear and non-monotonic
relationship between the mode shape distortions and the extent of damage. The sensitivity of
mode shape distortion as a damage-indicating feature is observed to decrease at certain damage
levels resulting in false-negatives.
4.3 MODE SHAPE CURVATURE
Mode shape curvature is a localized vibration feature that is inversely related to the stiffness
at the location it is calculated [33]. Since the presence of a crack or separation abruptly decreases
the stiffness in the vicinity of damage, the mode shape curvature also abruptly changes near the

16
location of the damage. The mode shape curvature at node i is calculated according to Equation
(2).
(2)
where:
Φi = Modal displacement at degree of freedom i
h = distance between degree of freedom i+1 and i-1
Figure 7 represents the summation of the mode shape curvature changes for the first four
modes summed for all 33 measurement points. The sensitivity of mode shape curvature is noted
to be slightly lower than that of the mode shape distortions varying between 55-80% for the most
severe damage state. The experimental campaign indicates that the second mode shape curvature
is the most sensitive to damage and the first mode shape curvature the least sensitive.
Figure 7: Percentage change in mode shape curvature with progressive damage.
4.4 STATISTICAL MOMENTS
Statistical moments, such as mean, standard deviation, skewness and kurtosis, can be used to
effectively compress and characterize raw vibration response measurements, xt. The first
statistical moment is the mean of the vibration response measurements given in Equation 3 [34],
17
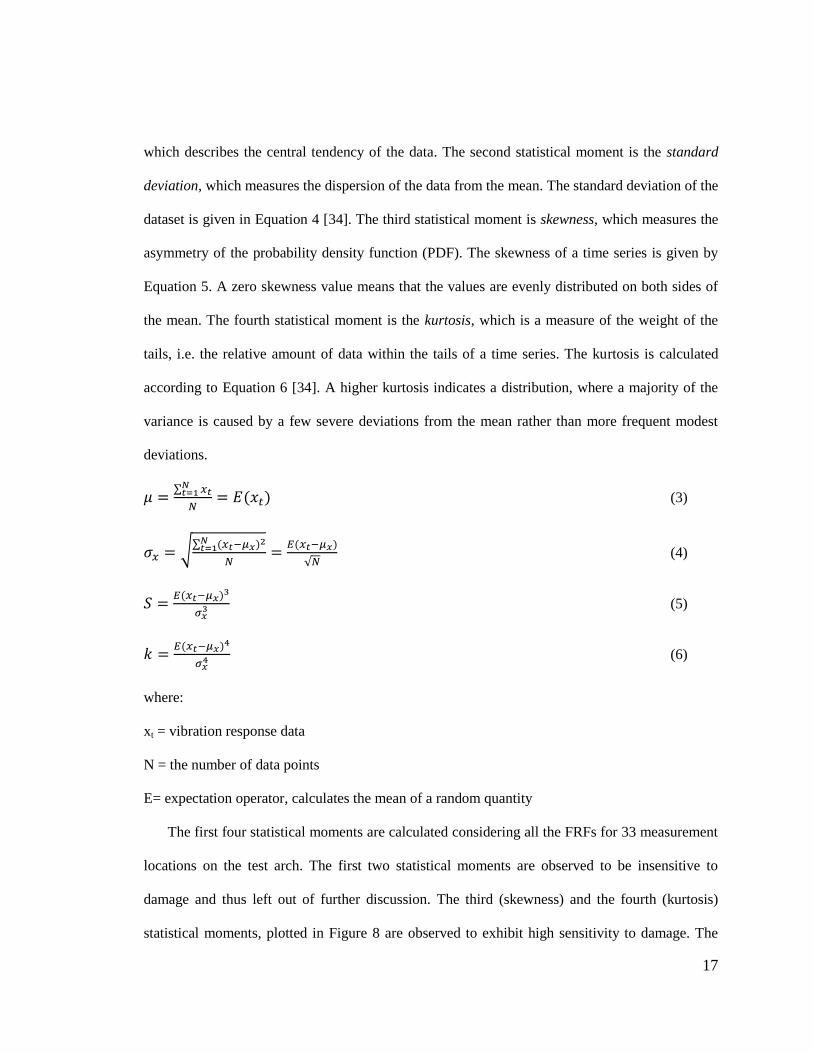
which describes the central tendency of the data. The second statistical moment is the standard
deviation, which measures the dispersion of the data from the mean. The standard deviation of the
dataset is given in Equation 4 [34]. The third statistical moment is skewness, which measures the
asymmetry of the probability density function (PDF). The skewness of a time series is given by
Equation 5. A zero skewness value means that the values are evenly distributed on both sides of
the mean. The fourth statistical moment is the kurtosis, which is a measure of the weight of the
tails, i.e. the relative amount of data within the tails of a time series. The kurtosis is calculated
according to Equation 6 [34]. A higher kurtosis indicates a distribution, where a majority of the
variance is caused by a few severe deviations from the mean rather than more frequent modest
deviations.
∑
(3)
√∑
√ (4)
(5)
(6)
where:
xt = vibration response data
N = the number of data points
E= expectation operator, calculates the mean of a random quantity
The first four statistical moments are calculated considering all the FRFs for 33 measurement
locations on the test arch. The first two statistical moments are observed to be insensitive to
damage and thus left out of further discussion. The third (skewness) and the fourth (kurtosis)
statistical moments, plotted in Figure 8 are observed to exhibit high sensitivity to damage. The

18
percentage changes in these two features are plotted for the experimental data in Figure 9. The
skewness feature yields a 90% total change for all sensor locations due to damage for the most
severe damage state. The kurtosis feature is more than 3 times as sensitive as the skewness and
yields a 300% change for the same damage level.
The damage sensitivity of the skewness and kurtosis are significantly higher compared to the
natural frequencies and mode shape derivatives. However, as it will be discussed in Section 4.3,
one must bear in mind that skewness and kurtosis are also sensitive to environmental noise.
Figure 8: (Top) Skewness and (Bottom) Kurtosis of FRF measurements from the experimental
hammer impact test.

19
Figure 9: Absolute percentage change in the (Left) skewness and (Right) kurtosis for FRFs from
the experimental campaign with the dashed lines signifying the noise sensitivity.
4.5 REGRESSION ANALYSIS
Time domain regression analysis aims to train models to fit auto-correlated time-series data.
The coefficients of the fitted model, the residuals between the model and the time domain data, or
as in our case, the singular values of the fitted model can be used as features. Perhaps, the most
common regression analysis is the Autoregressive (AR) model, which is given for an order p in
Equation 7 [35]. Herein, the Root Mean Square Error measure is implemented to find the optimal
AR order. Root Mean Square Error is a measure of the total difference between values estimated
by the AR model and actual measured values. A maximum order of 22 and a minimum order of 2
are obtained for the FRFs from the experiments. Therefore, to avoid any loss of information and
reduce the residuals, a model order of 22 is used for future analyses.
∑ (7)
where:
xt =the time or frequency domain response under investigation,
et = the residual term

20
φi = the AR parameters
Herein, an AR model is trained using the least squares estimation of the undamaged arch. The
magnitude of the singular values of these trained models act as features, while the changes in the
features are calculated based on Euclidean norm of residuals between the undamaged and
damaged singular values. The changes in features are normalized and summed for all 33
measurement points to obtain the damage indicator (Figure 10).
Figure10: Singular Value Decomposition (SVD) scores for AR model parameters of the FRFs
from the experimental campaign.
5 ASSIMILATING VIBRATION RESPONSE FEATURES
The vibration response features described in the previous section are advantageous, since they
are low-dimensional and thus make trends in the vibration response readily observable.
Moreover, the mathematical model-fitting during feature extraction acts as a filter and to a certain
extent, removes the extraneous effects of noise factors from these low-dimensional features.
However, while operating with such low dimensional features, there is the danger of excessively
reducing the measurement data, which may result in the loss of important information about the

21
structural damage. This section illustrates an approach to remedy this problem by assimilating
multiple low dimensional vibration features.
5.1 DAMAGE SENSITIVITY OF ASSIMILATED FEATURES
Earlier in the paper, Figure 1 introduced the concept of determining the damage sensitivity of
a vibration feature based on the slope, α, between the damage indicator and damage index. Recall
that the damage indicator is a unitless entity and thus, can be directly compared against each
other. Therefore, once all the damage indicators are normalized and made dimensionless, they can
be added together to increase the sensitivity to damage. This approach can be extended to all
possible combinations of vibration features, as long as the damage indicators derived from the
changes in the vibration features are treated as normalized values.
Figure 11 illustrates the assimilated damage indicators obtained through the experimental
campaigns considering only the frequency, mode shape distortion and mode shape curvature.
Here, the damage sensitive indicators of the vibration response features are summed together to
obtain a more sensitive damage indicator. As seen, assimilation of various vibration features
greatly increases the slope, α, of the damage indicator with respect to the damage index. By
adding new features through assimilation, this slope, α, can be further improved up to an
asymptote of infinity. For instance, see the bottom figure in Figure 11, where features obtained
from statistical moments and regression analysis are added to those in the top figure in Figure 11
to reach an even more sensitive damage indicator. As seen, the slope, α, of the plot increases
approximately from seven to 13 by the addition of two new features.

22
Figure11: Damage sensitivity comparison of various damage indicators with progressive
damage: (Top) experimental campaign with three features, (Bottom) experimental campaign with
five features.
Section 4 revealed that the sensitivity of features may vary for different damage levels and
exhibit decreasing trends. However, as seen in Figures 11, the assimilation of multiple low-
dimensional features yields a monotonic, non-decreasing trend and reduces the risk of false
negatives, i.e. interpreting the data as if the structure is maintaining its state, while the damage is
in fact propagating.

23
5.2 NOISE SENSITIVITY
The selection of vibration response features must go beyond damage sensitivity and consider
the effects of noise on features. In this study, the vibration response features are identified under
controlled excitation forces (i.e., impact excitation); therefore herein noise constitutes the effects
of ambient noise in the system on identified features.
This section investigates the degrading effects of random noise by applying an artificial white
noise signal with amplitude of 0.25Vrms and a frequency range of 0 to 1.6KHz to the scaled arch
structure using electrodynamic shakers. Figure 12 presents the FRFs for the five damage levels
obtained with and without artificial noise. As evidenced in Figure 12, the effect of noise on FRFs
is not constant for all damage levels. In fact, the noise sensitivity of FRFs increases as the damage
level increases. Therefore, as damage progresses, system identification of modal parameters and
extraction of other low dimensional features form FRFs become increasingly difficult and the
parameters extracted become increasingly uncertain. This implies that in Figure 1 the noise
sensitivity of features should in fact be represented as a non-constant variable.

24
Figure 12: Changes in FRFs for increasing damage levels with and without ambient noise.
In Figure 9, the dash-lines display the percentage change in the skewness and the kurtosis,
respectively, between the FRFs with and without the applied noise for all experimental damage
states. The change in noise sensitivity of skewness remains below 30% and exhibits a non-
monotonic trend as the damage increases. On the other hand, for increasing levels of damage, the
absolute change in kurtosis, i.e. the peakedness of the FRF, remains below 35%. As seen in

25
Figure 12, the FRFs become noisier as damage a level increase, which makes it more difficult to
identify features in the FRFs [36].
In Figure 13, the assimilation of both damage and noise sensitivity plots considering the
skewness and kurtosis features is demonstrated. Here, for the most severe damage state, the
assimilated damage indicator reaches as high as 400%, while the assimilated noise effects remain
as low as 50%, yielding a signal-to-noise ratio of eight to one. However, from Figure 13, it is also
evident that the first damage state with a single crack is not diagnosable when skewness and
kurtosis features are used. The changes in the selected vibration response features are
approximately 6%, which fall below the noise levels of 17%.
Figure 13: Assimilated damage indicator with the change in skewness and kurtosis and the
assimilated noise level for the two features.
6 DISCUSSION
Through the case study structure evaluated herein, it is observed that the noise sensitivity of a
structure increases as the damage level increases. Therefore, for varying levels of damage
severity, there is a need to determine optimum features, which concurrently exhibit high damage
sensitivity and low noise sensitivity, and thus yield high signal-to-noise ratios. A variety of
vibration response based features are experimentally evaluated for the semi-circular arch

26
considering the propagation of cracks due to a hypothetical, gradually increasing concentrated
load. The development of four distinct hinges is approximated as cut-outs from the cross-section.
Experimentally obtained natural frequencies, mode shape distortions, mode shape curvature, as
well as features obtained from statistical moments and regression analysis exhibit monotonic,
non-decreasing trends as the damage level increases. For higher order modes, difficulties are
observed when calculating the MAC and COMAC features due to the modes swapping order,
appearing and disappearing as damage propagates. Owing to the abrupt changes in the sequence
of modes, the FRAC are observed to yield significantly high changes. However, it must be
emphasized that the noise sensitivity of the FRFs is observed to increases with the increase in
damage; therefore, for practical applications a change in FRAC may overestimate the presence of
damage. The maximum vibration response of the structure is found to be increasing in a linear
relationship to an increase in the damage index, due to the increased flexibility of the structure.
However, the RMS vibration response feature is observed to have a highly nonlinear relationship
to the severity of damage.
7 CONCLUSION
SHM is a global diagnostic technique for condition-based maintenance of civil infrastructure.
In the past, the research community involved in SHM has used a variety of vibration based
features. Largely based on the convenience and ease in their identification from measurements,
natural frequencies and mode shapes as well as their derivatives have received the most attention
in published work. An overview of pertinent literature reveals that optimum damage indicating
features vary based on the varied user end requirements of SHM, i.e. the specifics of the structure
and damage types to be diagnosed. Therefore, it becomes challenging to select a single, best
feature, while maintaining the general applicability of the diagnostic procedure. Our contribution

27
to the state-of-the-art is the concept of assimilating normalized unitless damage indicators. By
first normalizing the damage indicators, one can obtain unitless quantities which cannot only be
objectively compared in their damage and noise sensitivity, but also be added together to become
better indicators of damage.
The experimental campaign is configured to mimic an impact hammer test, which is a type of
test where controlled excitation sources are used. However, the experimental findings of ambient
vibration testing can easily be incorporated into the proposed framework. This study presumes
the availability of measurements from the undamaged state of the structure of interest and this
assumption, in real life applications, may reduce the practicality of the proposed method.
Although the vibration response features are observed to be successful in indicating damage
in general, the results presented herein may vary for different structure types and damage
scenarios. Therefore, similar studies must be completed for other common forms of masonry
structures, such as domes, vaults, buttresses, etc.
ACKNOWLEDGMENTS
This work is performed under the auspices of the PTT Grants program of National Center for
Preservation Technology and Training (NCPTT) of Department of Interior: the Grant Agreement
Number MT-2210-10-NC-01.
REFERENCES
[1] Doebling, S.W., Farrar, C.R., Prime, M.B. and Shevitz, D.W., “Damage identification and
health monitoring of structural and mechanical systems from changes in their vibration
characteristics: A literature review,” Los Alamos National Laboratory report LA-13070-MS,
1996.

28
[2] Rytter, A, “Vibration based inspection of civil engineering structures,” Ph.D. Thesis, Dept. of
Bldg Tech. and Struct. Eng., Aalborg Univ., Denmark, 1993.
[3] Ruotolo, R. and Surace, C., “Damage assessment of multiple cracked beams: Numerical
results and experimental validation,” J. of Sound and Vibration, Vol. 206, No. 4, 1997, pp. 567-
588.
[4] Farrar, C.R. and Worden, K., “An introduction to structural health monitoring,” Phil. Trans.
R. Soc., Vol. 365, No. 1851, 2007, pp. 303-315.
[5] Maeck, J., “Damage Assessment of Civil Engineering Structures by Vibration Monitoring,”
Ph.D Thesis, Katholieke University, Leuven, Belgium, 2003.
[6] Garaygordóbil, J.C.A., “Dynamics Assessment of Structural Building Components,” Ph.D.
Thesis, Universitat Politècnica de Catalynya, Barcelona, Spain, 2003.
[7] Carden, E.P. and Fanning, P., “Vibration based condition monitoring: a review,”
Structural Health Monitoring, Vol. 3, No. 4, 2004, pp. 355-377.
[8] Chang, P.C., Flatau, A. and Liu, S.C., “Review Paper: Health Monitoring of Civil
Infrastructure,” Structural Health Monitoring, Vol. 2, No. 3, 2003, pp. 257-267.
[9] Begg, R.D., Mackenzie, A.C., Dodds, C.J. and Loland, O., “Structural Integrity Monitoring
Using Digital Processing of Vibration Signals,” in Proceedings of 8th Annual Offshore
Technology Conference, Houston, TX, 1976, pp. 305-311.
[10] Duggan, D.M., Wallace, E.R. and Caldwell, S.R., “Measured and Predicted Vibrational
Behavior of Gulf of Mexico Platforms,” in Proceedings of 12th Annual Offshore Technical
Conference, 1980, pp. 92-100.
[11] Fox, C.H.J., “the Location of Defects in Structures: A Comparison of the use of Natural
Frequency and Mode Shape Data,” in Proceedings of the 10th International Modal Analysis
Conference, 1992, pp. 522-528.
29
[12] Farrar, C.R., Baker, W.E., Bell, T.M., Cone, K.M., Darling, T.W., Duffey, T.A., Eklund, A.
and Migliori, A., “Dynamic Characterization and Damage Detection in the I-40 Bridge Over the
Rio Grande,” Los Alamos National Laboratory report LA-12767-MS, 1994.
[13] Ju, F. and Mimovich, M., “Modal Frequency Method in Diagnosis of Fracture Damage in
Structures,”in Proceedings of the 4th Internatinal Modal Analysis Conference, 1986, pp. 1168-
1174.
[14] Rizos, P., Aspragathos, N. and Dimarogonas, A., “Identification of crack location and
magnitude in a cantilever beam from the vibration modes,” J. of Sound and Vibration, Vol. 138,
No. 3, 1990, pp. 381-388.
[15] Dong, C., Zhang, P.Q., Feng, W.Q. and Huang, T.C., “The Sensitivity Study of the Modal
Parameters of a Cracked Beam,” in Proceedings of the 12th International Modal Analysis
Conference, 1994, pp. 98-104.
[16] Meneghetti, U., Maggiore, A., "Crack Detection by Sensitivity Analysis," in Proceedings of
the 12th International Modal Analysis Conference, 1994, pp. 1292-1298.
[17] Fritzen, C.P., Seibold, S. and Buchen, D., “Application of filter Techniques for Damage
Identification in Linear and Nonlinear Mechanical Structures,” in Proceedings of the 13th
International Modal Analysis Conference, 1995, pp. 1874-1881.
[18] Heyman, J., “The Stone Skeleton: Structural Engineering of Masonry
Architecture,” Cambridge University Press, 1997.
[19] Ramos, L.F., “Damage Identification on Masonry Structures Based on Vibration
Signatures,” Ph.D. Thesis, University of Minho, Portugal, 2007.
[20] Williams, R., Crowley, J. and Vold, H., “The Multivariate Mode Indicator Function in
Modal Analysis,” in Proceedings of Third International Modal Analysis Conference, 1985.

30
[21] Heylen, W. and Lammens, S., “FRAC: A Consistent Way of Comparing Frequency
Response Functions,” in Proceedings of International Conference on Identification in
Engineering, Swansea, UK, 1996, pp.48-57.
[22] Lawler, J.S., “Modal Coherent Equivalents Derived from an RMS Coherency Measure,”
Ph.D. Thesis, Michigan State University, USA, 1979.
[23] Allemang, R.J., “Investigation of Some Multiple Input/Ouput Frequency Response Function
Experimental Modal Analysis Techniques,” Ph.D. Thesis, University of Cincinnati, USA, 1980.
[24] Lieven, N.A.J. and Ewins, D.J., “Spatial Correlation of Mode Shapes, the Coordinate Modal
Assurance Criterion (COMAC),” in Proceedings of 6th International Modal Analysis Conference,
1988, pp. 690-695.
[25] Atamturktur, S., Pavic, A., Reynolds, P. and Boothby, T., "Full‐Scale Modal Testing Of
Vaulted Gothic Churches: Lessons Learned," Exp Tech, Vol. 33, No. 4, 2009, pp. 65-74.
[26] Aoki, T., Sabia, D., Rivella, D., Muto, H., “Dynamic Identification and Model Updating of
the Howa Brick Chimney, Tokoname, Japan,” Structural Studies, Repairs and Maintenance of
Heritage Architecture, IX, Vol. 83, 2005, pp. 265- 275.
[27] Gentile, C. and Saisi, A., “Ambient Vibration Testing of Historic Masonry Tower for
Structural Identification and Damage Assessment,” Construction and Building Materials, Vol.
21, No. 6, 2007, pp. 1311- 1321.
[28] Alampalli, S., Fu, G. and Dillon, E. W., “Signal Versus Noise In Damage Detection By
Experimental Modal Analysis,” Journal of Structural Engineering, Vol. 123, No. 2, 1997, pp.
237–245.
[29] Doebling, S., Farrar, C. R., Prime, M. B., “A summary review of vibration-based damage
identification methods,” Shock and Vibration Digest, Vol. 30, No. 91, 1998, pp. 91- 105.
31
[30] Atamturktur, S., Bornn, L., and Hemez, F., (November 2010, in review), "Damage Detection
in Masonry Vaults by Time-Domain Vibration Measurements," Journal of Engineering
Structures.
[31] Bayraktar, A., Altunisik, A.C., Sevim, B. and Türker, T., “Seismic Response of a Historical
Masonry Minaret using a Finite Element Model Updated with Operational Modal Analysis,” J. of
Vibration and Control, Vol. 17, No. 1, 2011, pp. 129-149.
[32] Ewins D. J. and Ho Y. K., “On the Structural Damage Identification with Mode Shapes,” in
Proceedings of the Conference held in E.T.S.I. Aeronauticos, Universidad Politecnica de Madrid,
Spain, June 2000, pp. 677-683.
[33] Panday, A.K., Biswas, M. and Samman, M.M. “Damage detection from changes in curvature
modes shapes,” J. of Sound and Vibration, Vol. 145, No. 2, 1991, pp. 221-332.
[34] Statistics Toolbox Users Guide, The Mathworks, Natick, MA, 2003.
[35] Akaike, H., “Power Spectrum Estimation Through Autoregressive Model Fitting,” Ann. Inst.
Statist. Math., Vol. 21, 1969, pp. 407-419.
[36] Balanda, K.P. and MacGillivray, H.L., “Kurtosis: A Critical Review,” The American
Statistician, Vol. 42, No. 2, 1988, pp. 111-119.

32
CHAPTER THREE
VIBRATION TESTING OF GOTHIC CATHEDRALS: OPTIMAL SENSOR
LOCATIONS BASED ON MODIFIED EFFECTIVE INFORMATION METHOD
ABSTRACT
This manuscript supplies guidance regarding the optimal regions for placing vibration
measurement sensors to properly extract the dynamic characteristics of Gothic style masonry
churches based on a study completed on the Cathedral of St. John the Divine. Placing sensors at
optimal locations cannot only reduce the cost and time related demands of vibration testing but
also lower the amount of measurement data to be post-processed. In this study, first, an accurate
finite element model of the Church is built and correlated against in-situ measurement and
inspection data. Using this correlated finite element model, optimal sensor locations are
determined through a modified version of the Effective Independence Method, in which the goal
is to both maximize the relative independence of mode shape vectors of interest and effectively
explore the geometry of the structure. A tradeoff between information gain and the visual
observability of mode shapes is noted. The relationship between the number of desired modes and
the required number of sensors is investigated. The robustness of the method to modeling errors
and thus, the validity of the guidelines presented herein are demonstrated. Although focus has
been given to large scale testing of Gothic Cathedrals, the methodology and concepts presented
herein can be applied to many forms of structural systems.
Keywords: Experimental Modal Analysis, Vibration Testing, Optimal Sensor Placement,
Structural Health Monitoring.

33
1. INTRODUCTION
Safeguarding heritage structures requires accurate numerical models for structural assessment
as well as reliable continuous monitoring systems for damage diagnosis. In both applications, in
situ experimental measurements become necessary. In this regard, modal analysis that supplies
the natural frequencies and mode shapes of the structure has gained popularity as a monitoring
and assessment tool (Atamturktur et al. 2009). Modal analysis can serve two specific purposes (i)
experimental evidence to calibrate and validate the numerical models of historic monuments and
(ii) non-destructive testing and evaluation method for periodic monitoring of historic monuments.
Implementing modal analysis as experimental evidence for the calibration and validation of
numerical models of historic masonry structures falls under the aegis of the concept known as
experiment-based validation. The primary concern of experiment-based validation is to ensure
that the boundary conditions and material properties of the block and mortar assembly are defined
properly. Successful applications of validation include masonry arches (Ramos et al. 2010);
domes (Atamturktur and Boothby 2007, Erdogmus 2008, Atamturktur and Sevim 2011); towers
(Bayraktar et al. 2009); buildings (Antonacci et al. 2001, De Sortis, Antonacci and Vestroni 2005,
Ramos, Laurenco and Costa. 2005); amphitheaters (Zonta 2000); and churches (Turek et al. 2002,
Boothby et al. 2006, De Stefano 2007, Erdogmus et al. 2007, Atamturktur and Boothby 2010).
Implementation of modal analysis as a non-destructive monitoring tool falls under the aegis of the
broader concept of Structural Health Monitoring (SHM) (Farrar and Worden 2007). The basic
idea behind vibration based SHM is that a change in a structure‟s physical properties, such as
stiffness or mass, causes a change in the vibration response of the structure, which can be
measured using a variety of vibration measurement techniques. The concept of vibration response

34
based monitoring of historic structures has gained increased popularity in the past two decades
(Armstrong et al. 1995, Ellis 1998, Gentile and Saisi 2007).
For the two applications of modal analysis discussed above, performing full scale testing on a
large scale historic masonry monument poses both technical difficulties and practical challenges
(Atamturktur et al. 2010 and Atamturktur and Laman 2010). One of the challenges comes from
the large size of these monuments. It is of course uneconomical, and more importantly
unnecessary, to envelop the entire structure with closely spaced sensors. By finding optimal
sensor locations from the perspective of information gain and thus, limiting the necessary number
of sensors, it is not only possible to reduce the demands on experimental resources (such as time
and budget), but also to reduce the volume of data that must be processed. Moreover, the success
of SHM techniques for diagnosing damage has been reported to be dependent upon the proper
selection of the sensor locations (Hemez and Farhat 1994); therefore, the optimal sensor
placement is crucial to the success of vibration based SHM.
In the earlier published work that involves vibration testing of historic masonry monuments,
the sensor locations are selected invariably based upon qualitative engineering judgment and
intuition (Atamturktur et al. 2009). The focus of this paper is to supply guidance regarding the
optimal sensor locations for Gothic style masonry churches based on quantitative, information
gain based criteria. The procedure implemented herein, the modified Effective Independence
Method (EIM), selects the optimal sensor locations such that the dynamic characteristics of the
structure are properly identified.

35
This manuscript begins with a detailed explanation of the EIM and the modification
introduced to EIM to improve the effective distribution of sensors across the structure. A
discussion focused on the details of the case study structure, the Cathedral of Saint John the
Divine, follows. The next section provides an overview of the development of the FE model and
its correlation with the structure‟s dynamic and static response. Then the relationship between the
desired mode shapes and the number of necessary sensor locations is demonstrated. Following the
discussion on the robustness of the sensor locations, the optimal sensor locations obtained
through EIM are provided. Finally, the paper concludes with guidelines for practicing engineers
and preservationists on efficiently conducting modal testing experiments on large scale Gothic
Cathedrals.
2 MODIFIED EFFECTIVE INDEPENDENCE METHOD
In this section, first an overview of the EIM as originally introduced by Kammer (1991) is
given. Next, to ensure that the sensor locations effectively explore the structure, a modification to
the EIM by adding a distance based criterion is suggested. It is shown that EIM may exhibit
sensitivity to modeling errors. Finally, to remedy this sensitivity and obtain more consistent
sensor locations, the error theory proposed by Kammer (1992) is implemented.
2.1 EFFECTIVE INDEPENDENCE METHOD:
The goal of EIM is to retain maximum information about the dynamic behavior of the
structural system with a reduced number of sensors through the maximization of the Fisher
information matrix (Kammer 1991). It is a relatively simple and rapid method compared to
exhaustive processes like those involving neural networks and genetic algorithms; therefore, EIM
is ideal for large structures with a high number of possible sensor locations (Kammer 1991).

36
Successful applications of EIM have been well documented in published literature; see for
instance Glassburn (1994), Heo et al. (1997), Meo and Zumpano (2005), and Kammer (1996).
Let us assume a scenario in which the number of candidate sensors is s, but due to the
resources available for testing it is only possible to use m << s sensors. The problem then
becomes the optimal placement of m sensors in s possible locations. The EIM iteratively
eliminates the sensors that contribute least to the independence of the modal vectors. First, a large
enough set of candidate sensors that can clearly identify the desired modes must be selected. EIM
initially assumes that the mode shape matrices, obtained from the FE model with the entire set of
candidate sensor locations, are linearly independent. Next, EIM chooses m optimum sensors from
the s candidate sensors, while maintaining as much linear independence and orthogonality of
mode shapes vectors as possible.
Conceptually, the response at any point in an elastic structure can be represented, in the time
or frequency domain, as a linear combination of mode shapes (Ewins 2000). The vector of the
measured vibration response ys can be estimated as a combination of n mode shapes and a noise
term through the expression:
𝑦𝑠 𝑞Φ 𝑤 (1)
Φ is the mode shape matrix with n mode shape vectors;
q is the coefficient response vector, a function of time or the natural frequency;
w is the stationary Gaussian white noise with a zero mean value;
To obtain the best estimate of a mode shape, the covariance matrix of the estimate errors must
be minimized (see Equation 2). As explained by Udwadia (1994), the covariance matrix of the
estimate errors is bound by the Cramer-Rao lower bound.

37
[ 𝑞 �� 𝑞 �� ] (2)
Udwadia (1994) explains that for unbiased and efficient estimators, the inequality in Equation
2 becomes an equality. The right hand side of Equation 2 then yields the inverse of the Fisher
information matrix, Q. Alternatively, one can derive the Fisher information matrix as given in
Equation 3. Accordingly, by maximizing the Fisher information matrix in Equation 3, one can
obtain the best estimates of the coefficients of the response vector in Equation 2.
[(
)
(
)] (3)
where,
is the Gaussian white noise variance and
�� is the efficient unbiased estimator of q
Next, by substituting Equation 1 into Equation 3, Fisher information matrix is obtained in the
following form:
[Φ
Φ] (4)
Considering the noise as uncorrelated and having identical statistical properties at all
locations, the effective independence values (EIV) of the each of the sensors, i, can thus be
calculated as:
EIV
i=1,2,…k (5)
where ϕi is the vector of the target modal co-ordinates of the ith sensor, and k is the remaining
number of sensors considered in that particular iteration. The EIV of a sensor location lies
between 0 and 1, where a value of 0 implies that the target modes are not observable from the
sensor location (or that the corresponding row in the mode shape matrix is null). On the other
hand, an EIV of 1 implies that the sensor location is vital for maintaining independence of the
mode shape matrix and for identifying the target modes. EIM, in an iterative manner, eliminates

38
the sensor with the minimum EIV from the list of candidate sensors. Both the mode shape and
Fisher information matrices are updated after each iteration until the pre-defined number of
sensors remains to serve as the optimal set of sensor locations. Because of the iterative nature of
the algorithm, the final sensor configuration can be suboptimal; however, Kammer (1991) states
that the mode shape estimates from this configuration are close approximations of the actual
optimal configuration.
2.2 DISTANCE BASED CRITERION:
One major drawback of the EIM, which is especially evident for symmetric structures, is that
it can select measurement locations nearly adjacent to each other. This problem occurs when
there are several sensors with approximately the same value of effective independence. The
closely spaced sensors measure similar (or near-similar) response and supply an incomplete
spatial representation of the mode shape of the structure. Therefore, it is of value to maximize the
minimum distance between the sensor locations to assure that sensors effectively explore the
geometry of the structure. This way, a better visualization of the mode shapes can be obtained,
which is particularly relevant when visually correlating analytical and experimental mode shapes.
Therefore, a modification is made to the EIM, originally proposed by Kammer (1991), by
introducing a distance based criterion (DBC) to the optimal sensor selection as follows:
√ 𝑦 𝑦 i=1,2,…m; j=1,2,…s (6)
where, x, y and z are the co-ordinates of the ith optimal sensor chosen by the EIM and , 𝑦 and
are the co-ordinates of the jth sensor locations. If d j i < DBC, the sensor location j is
eliminated. This criterion assures that the sensors are not clustered in certain regions.

39
2.3 ROBUSTNESS TO MODEL ERROR:
The sensor locations chosen by the EIM may be sensitive to the errors in the numerical model
predictions. Such errors may be caused by imprecisions in the material properties and boundary
conditions. Therefore, it is crucial to correlate the FE model predictions against experimental
evidence to ensure the input values of the FE model are realistic. However, even after elaborate
and successful test-analysis correlation, a level of uncertainty in model predictions may remain.
To remedy the sensitivity of EIM to the uncertainty in model predictions and to obtain more
consistent sensor locations, Kammer (1992) suggested the use of error theory, where the error
between the mode shapes of the FE model and those obtained by slightly inaccurate model is
calculated as:
𝑠 Φ 𝑠 Φ 𝑠 (7)
where, Φ 𝑠 is the mode shape matrix obtained by the FE model with uncertain input parameters
and Φ 𝑠 is the reference mode shape matrix.
The net information matrix In is then calculated as:
(8)
where, Φ 𝑠 Φ 𝑠 and 𝑠
𝑠. The information matrix, Ar, corresponds to the reference
mode shapes and D is the information matrix of the mode shape errors. If the matrix In is positive
definite (Bhatia 2007) for a particular sensor configuration, then Ar is greater than D, which
means that there is more information in the reference modes than in the mode shape errors. The
positive definiteness of In is a sufficient condition for the positive definiteness of the reference
mode shape information matrix Ar (Kammer 1992). In the course of the EIM, In is calculated at
every iteration and if it is determined to be positive definite, then the sensor eliminated by the
EIM at that iteration is not vital to the independence of the reference modes.

40
3 THE CASE STUDY STRUCTURE
The structure considered for this study is the Cathedral Church of St. John the Divine (SJD)
(Figure 1a). Located in the heart of New York City, this Cathedral of Gothic Revival design is
currently the fourth largest in the world (Hall 1920). The construction of the Church began in
December 1892 and is still under completion. This study focuses on one of the bays along the
nave of the Cathedral (Figure 1b). The 37.8m high and 75.6m long nave consists of four bays
each 44.5m wide (Wickersham 1998).
Figure 3: (a) The west front of the Cathedral Church of St. John the Divine, New York, (b)
sectional elevation drawing of the nave.
The main walls of SJD are made of Maine granite with Mohegan golden granite facing on the
outside and Frontenac stone facing on the inside, while the piers and buttresses are in-filled with
concrete (Hall 1920). The webbing of the vaults is composed of Guastavino tile (Rossell 1995)
and the vault ribs are made of cut schist (Hall 1920).

41
In this study, a reconnaissance survey of the church building is completed and all possible
sensor locations are scouted for (shown later in the highlighted regions of Figure 6a). The
walkways between the buttress and the nave, as well as mezzanines inside the nave, allow the
placement of sensors at intermediate levels on the piers, walls and buttresses on the inside and
outside of the church. The entire nave vault is accessible from the top. The availability of power
sources and the length of sensor cables are also considered while selecting the candidate sensor
locations.
4 DEVELOPMENT AND VALIDATION OF THE FINITE ELEMENT MODEL
A linear elastic FE model of SJD is built in two systematic phases using the FE software
package ANSYS. In the first phase, a substructure consisting of the vaulted section of the naves is
built and correlated with experimentally obtained dynamical characteristics of the vaults. In the
second phase, the entirety of a single bay is modeled by adding the piers, buttresses and the walls.
4.1 FIRST PHASE: VAULTS OF THE NAVE
Model development: According to available construction drawings, the geometry of the
Cathedral is first simplified and idealized preserving the structural properties, such as cross
sectional area and the moment of inertia. The vault ribs and the vault webbing are modeled using
20-node SOLID95 brick elements and 8-node SHELL93 shell elements, respectively (ANSYS
2005). Since the stresses in the surcharge are less important, the surcharge material is modeled
using lower order, 10-node SOLID92 elements. The entire model of one nave bay consists of
47194 elements.

42
The initial material property values for the elastic modulus, density and Poisson‟s ratio are
determined according to historic documentation and engineering judgment (Theodossopoulos
2004, Özen 2006). The vault webbing is built out of Guastavino tile with the thickness varying
from 15 cm to 20 cm. The elastic modulus and density of the Guastavino tile is reported by
Saliklis, Kurtz and Furnbach (2003). Atamturktur and Sevim (2011) have conducted laboratory
experiments on Guastavino tile and mortar specimens and obtained the homogenized material
properties for a tile-mortar assembly. The surcharge volume behind the vaults is composed of
masonry rubble for which the material properties are determined according to Erdogmus et al.
(2007). The initial material properties for the ribs and arches are assigned based upon available
documentation on cut schist (URL-1). The element type and material property assignments for
different structural components are summarized later in Table 2.
The initial boundary conditions are applied according to a combination of visual
observations of support conditions, engineering judgment and the recommendations of Erdogmus
(2004). These initial material properties and boundary conditions are then adjusted according to
the experimentally measured natural frequencies and mode shapes, respectively. The single bay
model is then reflected to obtain a three-vault model as shown in Figure 2.

43
Figure 2: (a) Photo of the nave vaults, (b) FE model of the vaults.
Test-Analysis Correlation: Since only the vaulted section of SJD is modeled in the first
phase, the structural effects of the unmodeled sections of the nave, such as the nave walls, aisles
and buttresses are represented as boundary conditions. The initial boundary conditions in the FE
model are tuned iteratively by systematically comparing the analytically obtained mode shapes
and mode shape sequence with those obtained experimentally (see Table 1). The final boundary
conditions consist of the following: (i) displacement and rotational restraint applied in all
directions at the base of the vault springing, (ii) longitudinal horizontal restraint to represent the
unmodeled adjacent vaults, and (iii) transverse horizontal restrain along the length of the piers
where buttresses rest. The initial material properties of the Cathedral are fine-tuned according to
the natural frequency agreement. The final values obtained for material properties are given in the
first three rows of Table 2 (Boothby, Atamturktur and Hanagan 2006).
The fine-tuning of the material properties and boundary conditions are uncoupled, where the
boundary conditions are adjusted according to the mode shape agreement and material properties
are fine-tuned according to the natural frequency agreement. Atamturktur and Laman (2011)
cautions such uncoupling since the relative ratio of material properties may also have an effect on

44
the mode shape vectors as well as their sequence. In this study, by perturbing the ratio of different
material properties, it is verified that the mode shapes are not altered.
Table 1: Comparison of experimental and analytical modal analysis results of the vaults of St
John the Divine.
Mode Shape
Experimental 13.61 Hz 15.84 Hz 16.27 Hz 17.70 Hz 20.24 Hz
Analytical 12.31 Hz 15.71 Hz 16.68 Hz 17.13 Hz 20.51 Hz
4.2 SECOND PHASE: ENTIRETY OF THE NAVE
Model development: In the second phase, the model of the first phase is extended to represent
an entire bay, including full length piers, the buttresses and aisle vaults (Figure 3). The element
types as well as the material properties are kept consistent with those used in the first phase. A
new material is added to represent the granite walls and piers. For the elastic modulus of granite,
a range of 30-55 GPa is suggested by Özen (2006) and 40-100 GPa in Gere and Timoshenko
(1997). In this study, 50 GPa for the granite piers and walls is used. The densities used for the
piers and walls are based on historic correspondences obtained from the SJD archives (Adamson
1917). When adding the aisle vaults, BEAM188 elements are used for the ribs. The entire model
of one nave bay consists of 125,920 elements.

45
Figure 3: The 3-D meshed FE model of the bay.
A fully rigid boundary condition, which prevents translation and rotation in all three
directions, is applied to the base of each foundation. At the floor level, piers and buttresses are
restrained horizontally to mimic the restraining effect of floor slabs. Symmetry boundary
conditions are applied to both the east and west face of the bay to simulate the existence of
adjacent bays in the nave.
Table 2: Element type and material properties used in the FE model for different parts of the
structure.
Structural Member ANSYS Element Density (kg/m3) E (GPa) Poisson's Ratio
Ribs/Arches SOLID95 2100 12 0.2
Vault Webbing SHELL93 1600 6.5 0.15
Rubble Surcharge SOLID92 1000 4.5 0.1
Piers SOLID95 2640 50 0.2
Walls SOLID92 2700 50 0.2

46
Inspection-Analysis Correlation: During the reconnaissance survey, the structure is closely
inspected for cracking and hinging of the masonry structure. Cracks are consistently observed at
the rose openings (see Figure 4) and in the walkways between the buttress and nave (see Figure
5). It is important to note that these cracks are symmetric on both sides of the nave in each of the
four nave bays. If the FE model is an accurate representation of reality, then the FE model
simulations under the self-weight of the structure should yield high stress concentrations at the
locations of these existing cracks (Mark and Hutchinson 1986 and Ricart-Nouel 1991). However,
one must take care to ensure that the cracks and hinges are indeed caused by the self-weight of
the structure, and not by the differential support settlements. Therefore, during the reconnaissance
survey, the entirety of the nave is inspected to determine if there are any signs of support
settlement. However, no significant geometric distortions are observed in the structure. Therefore,
the cracks are concluded to be caused primarily by gravitational forces, such as the self-weight of
the structure; and thus the test-analysis correlation of crack locations is deemed appropriate.
Figure 4: Cracks at the rose opening (highlighted) corresponding to high tensile stress regions in
the FE model: (Left) Existing cracks in the structure, (Right) tensile stress concentrations in the
FE model.

47
Figure 5: Cracks at the walkways (highlighted) between the buttress and the nave corresponding
to the high tensile stress regions in the FE model: (Left) Existing cracks in the structure, (Right)
tensile stress concentrations in the FE model.
The FE model is executed to analyze the behavior of SJD under its own self-weight and the
regions with high tensile stresses are marked as shown in Figures 4 and 5. A close match is
observed between the high tensile stress regions in the FE model and the existing crack locations
in the structure. As evidenced by Figure 4 and Figure 5, the cracks near the rose openings and in
the outer walkways are well predicted by the FE solution. Therefore, the FE model of the
Cathedral is deemed to be an accurate representation of SJD.
5 SENSOR OPTIMIZATION
A sufficient number of candidate sensor locations need to be chosen to ensure that the target
modes are well-defined. Accordingly, 205 nodal locations of the FE model are selected on the
vault and additional 576 nodal locations are selected on the rest of the structure (Figure 6). The
optimal sensor locations for triaxial accelerometers are determined, with the subsequent mode
shape matrix formed with 781 candidate sensor locations considering the resultant of the X, Y

48
and Z modal displacements. If triaxial sensors are unavailable at the time of the test, then uniaxial
sensors can be revolved three times at each location to obtain measurements in all three
directions. Similarly, to identify modes in only one or two directions, the mode shape matrix can
be modified to include only the modal displacements in those respective directions.
Figure 6: (a) The accessible locations on the structure highlighted; (b) the candidate sensor
locations shown as dots.
Eleven of the first twenty analytical modes are observed to be local, where the motion is
focused on a single structural member (typically the piers). Therefore, nine of the first 20 modes
are identified as „target‟ global modes (Figure 7). These nine global modes form the initial mode
shape matrix with the 781 candidate degrees of freedom. To assure equal participation from all
nine modes, the mode shapes are normalized between 0 and 1. The degrees of freedom are then
iteratively reduced from 781 down to the predefined number of sensor locations (in our case, 80)

49
by eliminating one location in succession according to their contributions to the independence of
the mode shape matrix.
Figure 7: Nine target mode shapes desired to be extracted during the in-situ modal analysis.
The percentage loss in information as the sensor locations are eliminated can be calculated as
the determinant of the Fisher information matrix. As shown in Figure 8, the number of required
sensors is increasing with the number of modes to be identified. Also note that the Fisher
information matrix determinant is sensitive not only to the number of target modes but also to the
number of candidate locations. Therefore, the actual value of % loss of information given in
Figure 8 is irrelevant and must be treated as a relative measure.

50
Figure 8: Fisher information matrix determinant updated with sensors eliminated iteratively.
Figure 9 shows the EIV of the eliminated sensors with respect to the iteratively updated mode
shape matrix, i.e. the mode shape matrix with only the remaining candidate locations. To identify
nine modes with each sensor having an EIV of more than 0.1, it is possible to eliminate 701
sensors and use only 80 sensors. As indicated in Figure 9, the number of candidate locations and
number of target modes dictates the information content of the mode shape matrix.
Figure 9: Effective independence values of the sensors with respect to the iteratively updated
mode shape matrix; (inset) zoomed in to 80 optimal sensors.

51
For this study, a total of 80 optimal sensor locations for triaxial sensors are sought for the
entire bay. Figure 10a and 10b show the optimal locations computed by the EIM before and after
applying the DBC. Without the minimum distance specified, the EIM picks closely spaced
sensors at locations that yield an incomplete visual representation of the mode shapes. However,
in Figure 10b, each of the 80 triaxial sensors is placed at least three meters apart in all directions.
The sensors are thoroughly distributed on the structure, which is ideal for visualizing the target
modes of interest. Note that the sensor locations computed without the DBC contain more
information. Therefore, one must accommodate for the tradeoff between mode independence and
visual observability, depending upon the application.
Figure 10: Optimal sensor locations for triaxial sensors on the full bay (a) without DBC, (b) with
DBC of 3 meters.

52
6 DISCUSSIONS
The choice of sensor locations on a functioning monumental structure is governed by many
factors (e.g. accessibility, maintaining the aesthetics), in which some of the actual optimal
locations are eliminated by default. Therefore, the problem becomes that of selecting the optimal
locations out of the feasible candidate locations. In this selection, several important factors must
be properly evaluated, such as the threshold value used for the distance based criteria and the
robustness of the findings to the uncertainty in model predictions. In the end of this section,
inferences regarding the optimal regions for sensor placement in Gothic style structures are made.
6.1 SENSITIVITY TO MINIMUM DISTANCE CRITERIA
While the DBC may eliminate sensors that are mathematically more optimal (Figure 10), the
DBC supplies visual observability, which is particularly useful while comparing the analytical
and experimental mode shapes. Figure 11 shows the higher rate of information loss as the
threshold distance between sensors is increased. Note the exception where DBC=0.5m yields
more optimal solutions between 45-80 sensors compared to DBC=0.0m. This can be explained by
the inherent sub-optimality due to the iterative nature of EIM.
Figure 11: Behavior of the Fisher information matrix determinant for different DBC.

53
6.2 ROBUSTNESS TO MODELING ERROR
The model used in this study is correlated with experimental measurements as well as with on
site inspections. However, slight uncertainties remain in the model predictions. Therefore, it is of
value to ensure that such uncertainty does not interfere with the main findings obtained through
EIM.
To demonstrate the robustness of the method, assuming a 5% error in the model parameters,
six FE models are generated: one reference model with material properties given in Table 2 and
the other five, each with a 5% reduction in the elastic modulus of one of the five materials given
in Table 2. First, the optimal locations for the six models are plotted without employing a DBC
(Figure 12). As seen, the sensor locations are all localized in a few regions on the model, while
sensors in some regions are consistently eliminated by the EIM for all five cases. This
observation shows that if one considers the regions within the structure and not individual
candidate DOFs, the EIM selections are consistent and are robust to errors in model parameters.

54
Figure 12: Optimal sensor locations after 5% reduction in the Elastic modulus of each of five
materials without a DBC.
The EIM is more sensitive to modeling errors in the presence of a threshold distance between
sensors as it is without one. Figure 13 shows the sensor configurations for various DBC from 0m
up to 3m. As the distance is increased, the robustness of the EIM diminishes. In an effort to
achieve a compromise between the retention of information about the mode shapes, the visual
observability of the mode shapes and the robustness of the method to change in input parameters,
a DBC of 1.5m is deemed suitable.

55
Figure 13: The optimal sensor locations for the 6 models with DBC of (a) 0m (or no DBC); (b)
1m; (c) 1.5m; (d) 2m; (e) 2.5m; (f) 3m.
To reduce the variability of sensor locations due to changes in material properties, the error
theory is applied wherein the sensors that cause the net information matrix to remain positive
definite are retained. Figure 14 shows the sensor locations on the six models generated with
varying material properties where a DBC of 1.5m is applied to each. There is more than one
sensor that is retained by the EIM at every iteration after applying the error theory. Hence, there
maybe a few sensors in the final configuration that are spaced less than 1.5m apart.

56
6.3 OPTIMAL SENSOR LOCATIONS FOR GOTHIC CHURCHES
In Figure 14, the optimal sensor locations are consistently concentrated around (i) ribs on the
vaults, (ii) vault webbing around the crown, (iii) top of the nave walls, (iv) buttresses above the
vaults and (v) outer edges of the buttresses at level of the first crosswalk.
Figure 14: Optimal sensor locations in the six FE models using a DBC of 1.5m and applying the
error theory.
While testing large scale Gothic style churches, placing the sensors at the abovementioned
locations are most advantageous from the viewpoint of system identification. The mode shapes
derived from these locations ensure maximum independence of the mode shape matrix
considering the nine global modes discussed before. Although demonstrated using 80 sensor
locations, if the user possesses a fewer number of sensors, it will be most valuable to place them
at these general regions. For applications where visualization of the mode shapes is of more

57
importance, the DBC can be increased by acknowledging the fact that the linear independence of
the mode shapes is sacrificed in the process.
7 CONCLUSIONS
In this paper, the application of an existing analytical procedure, the Effective Independence
Method, is discussed and demonstrated to maximize the information gained during in-situ modal
analysis of a Gothic style masonry Cathedral. Herein, this existing established method is modified
by the addition of a distance based criteria, which assures that the sensors are placed with
sufficient distance from each other to better explore the structure. To reduce the effects of
modeling error on the sensor placement, the error theory is applied that acts as a constraint on the
elimination of critical sensors that are important for the identification of the real modes.
Ultimately, through the application of the modified EIM, recommendations are made for selected
regions for sensor placement to expedite the process of and reduce the resources necessary for the
full-scale modal testing of Gothic Cathedrals, such as the Cathedral of St. John the Divine, the
subject of this study.
In this study, a vibration test on the easily accessible vaulted section of SJD is first performed
using previously recommended sensor locations (Atamturktur et al. 2009). A partial FE model is
constructed and calibrated against the experimentally-obtained mode shapes and natural
frequencies. At this phase, the boundary conditions mimicking the structural components
excluded from the model are adjusted and the material properties are fine-tuned. Next, this partial
model is extended to a full bay model by adding the missing components such as the aisles,
buttresses, piers and walls. This full FE model is tested against the visual observations during the
site survey. The high tensile stress regions from a static analysis under self-weight are compared

58
against visually-observed crack locations in the structure. As a result of the satisfactory
agreement, the model is accepted as a useful tool for determining the optimal sensor locations.
The possible candidate sensor locations are determined from a site reconnaissance survey.
The mode shape matrix is generated with all of the candidate locations from the FE model and the
target modes are chosen. Finally, the candidate locations are reduced to a required number of
sensor locations using the EIM modified with the DBC. While the DBC causes a loss in
information about the mode shape vectors, it distributes the sensors so that the final optimal set of
sensors are not clustered and thus results in better visualization of the mode shapes.
The robustness of the method to uncertainties in FE model parameters is also studied and it is
seen that the optimal locations chosen by the EIM localize in specific regions within the geometry
even when the material properties are varied. However, the robustness of the method is
compromised in the presence of too high a distance criterion, which for SJD is found to be equal
or higher than 2m.
Although demonstrated on the Cathedral of St. John the Divine, a historic masonry structure,
the concepts presented herein are applicable to many structural systems. The variable introduced
by the DBC of the modified EIM, the minimum distance between sensors, requires a measure of
engineering judgment that, of course, varies with the objective of the test campaign.

59
ACKNOWLEDGMENTS
This work is performed under the auspices of the PTT Grants program of National Center for
Preservation Technology and Training (NCPTT) of Department of Interior: the Grant Agreement
Number MT-2210-10-NC-01. Many thanks to Dr. Daniel C. Kammer (Professor of University of
Wisconsin- Madison) for his valuable comments on the methodology employed in the paper. We
also wish to thank Godfrey Kimball of Clemson University for his editorial assistance. We also
thank Andrew Phifer, a Creative Inquiry student, for his meticulous and thorough search of the
archival document of SJD.
REFERENCES
Adamson, J., (1917), Letter to James Grant dated January 25th 1917, Saint John the Divine
Cathedral archives.
ANSYS (2005). “Ansys Elements Reference.” ANSYS v 12.0, Swanson Analysis System, U.S.
Antonacci, E., Beolchini, G., Di Fabio, F., and Gattulli, V., (2001), "Retrofitting Effects on the
Dynamic Behavior of S. Maria di Collemaggio", Tenth International Conference on
Computational Methods and Experimental Measurements, Alicante, Spain.
Armstrong, D., Sibbald, A., Fairfield, C., and Forde, M., (1995), "Modal Analysis for Masonry
Arch Bridge Spandrel Wall Separation Identification", NDT E International, Vol. 28, No. 6, pp.
377-386.

60
Atamturktur, S. and Boothby, T., (2007), “Finite Element Modeling of Guastavino Domes”,
Bulletin of Association for Preservation Technology, Vol. 28, No. 4, pp. 21- 29.
Atamturktur, S., Pavic, A., Reynolds, P. and Boothby, T., (2009), “Full-Scale Modal Testing of
Vaulted Gothic Churches: Lessons Learned”, Journal of Experimental Techniques, Vol. 33, No.
4, pp. 65-74.
Atamturktur, S. and Laman, J., (2010), "Calibration of Finite Element Models of Masonry
Structures: A literature Review”, Journal of Structural Design of Tall and Special Buildings, doi:
10.1002/tal.577.
Atamturktur, S., Fanning, P., and Boothby, T., (2010), “Experimental and Operational Modal
Testing of A Vaulted Masonry Cathedral”, ICE - Engineering and Computational Mechanics,
Volume 163, Issue 3, pp. 213 –223, ISSN: 1755-0777, E-ISSN: 1755-0785.
Atamturktur, S., and Boothby, T., (2010), “Calibration of Finite Element Models of Masonry
Vaults”, Journal of Masonry Society, Vol. 28, No. 2, pp. 77-93.
Atamturktur, S. and Sevim, B., (accepted 2011, in print), “Seismic Performance Assessment of
Masonry Tile Domes through Non-linear Finite Element Analysis”, ASCE Journal of
Performance of Constructed Facilities.
Atamturktur, S. and Laman, J. A., (2011), “Finite Element Model Correlation and Calibration of
Historic Masonry Monuments: Review”, The Structural Design of Tall and Special Buildings,
20: n/a. doi: 10.1002/tal.577

61
Bayraktar, A., Sevim, B., Altunişik, A. C., and Türker, T., (2009), “Analytical and Operational
Modal Analyses of Turkish Style Reinforced Concrete Minarets for Structural Identification.”
Experimental Techniques, Vol. 33 No. 2, pp. 65-75.
Bhatia, R., “Positive definite matrices, Princeton Series in Applied Mathematics”, Princeton
University Press, Princeton, NJ, 2007.
Boothby, T. E., Atamturkur, H. S., and Hanagan, L. M., (2006), "Modal Analysis Methods for
Validation of Vaulted Stone Masonry Models", Proceedings of the 2006 Architectural
Engineering National Conference; Omaha, Nebraska, USA, doi:10.1061/40798(190)66
De Sortis, A., Antonacci, E., and Vestroni, F., (2005), “Dynamic Identification Of A Masonry
Building Using Forced Vibration Tests.” Engineering Structures, 27(2), 155-165.
De Stefano, A., (2007), “Structural Identification and Health Monitoring on the Historical
Architectural Heritage”, Key Engineering Materials, Vol. 347, pp. 37-54.
Ellis, B., (1998), "Non-Destructive Dynamic Testing of Stone Pinnacles on the Palace of
Westminster", Proceedings of the Institution of Civil Engineers. Structures and Buildings, Vol.
128, No. 3, pp. 300-307.
Erdogmus, E., (2004), “Structural Appraisal of the Florentine Gothic Construction System”, PhD
Thesis, The Pennsylvania State University, State College, PA.
Erdogmus, E., Boothby, T.E., and Smith, E.B., (2007), “Structural Appraisal of the Florentine
Gothic Construction System”, Journal of Architectural Engineering, Vol. 13, pp. 9-17.

62
Erdogmus, E., (2008), “Timbrel Domes Of Guastavino: Nondestructive Assessments on a Half-
Scale Model”, International Journal of Architectural Heritage, Vol. 2, No. 4, pp. 330-352.
Ewins, D. J., (2000), “Modal Testing: Theory, Practice and Application”, Research Studies Press,
Ltd., Hertfordshire.
Farrar, C.R., and Worden, K., (2007), “An Introduction to Structural Health Monitoring”,
Philosophical Transactions of the Royal Society A: Mathematical, Physical and Engineering
Sciences, Vol. 365, No. 1851, pp.303-315.
Gentile, C., and Saisi, A., (2007), "Ambient Vibration Testing of Historic Masonry Towers for
Structural Identification and Damage Assessment", Construction and Building Materials, Vol. 21,
No. 6, pp. 1311-1321.
Gere, J. and Timoshenko S., (1997), “Mechanics of Materials 4th ed.”, PWS Publishing Co.,
Boston.
Glassburn, R. S., (1994), "Evaluation of Sensor Placement Algorithms for On-orbit Identification
of Space Platforms", PhD Thesis, Department of Mechanical Engineering, University of
Kentucky, USA.
Hall, E.H., (1920), “A Guide to the Cathedral Church of St. John the Divine in the City of New
York”, The Laymen‟s Club of The Cathedral Church of St. John the Divine, New York.
Hemez, F. M., and Farhat, C., (1994), "An Energy Based Optimum Sensor Placement Criterion
and its Application to the Structural Damage Detection", 12th International Modal Analysis
Conference (IMAC), Honolulu, HI, pp.1568-1575.

63
Heo, G., Wang, M., and Satpathi, D., (1997), "Optimal Transducer Placement for Health
Monitoring of Long Span Bridge", Soil Dynamics and Earthquake Engineering, Vol. 16(7-8),
495-502.
Kammer, D. C., (1991), "Sensor Placement for On-orbit Modal Identification and Correlation of
Large Space Structures", Journal of Guidance, Control and Dynamics, Vol. 14, pp. 251-259.
Kammer, D. C., (1992), "Effect of model error on sensor placement for on-orbit modal
identification of large space structures", Journal of Guidance, Control, and Dynamics, Vol. 15,
pp. 334-341.
Kammer, D. C., (1996), "Optimal Sensor Placement for Modal Identification Using System-
Realization Methods”, Journal of Guidance, Control, and Dynamics, Vol. 19, No. 3, 729-731.
Mark, R., and Hutchinson, P., (1986), "On the Structure of the Roman Pantheon", The Art
Bulletin, Vol. 68, No. 1, pp.24-34.
Meo, M., and Zumpano, G., (2005), "On the Optimal Sensor Placement Techniques for a Bridge
Structure", Engineering Structures, Vol. 27, No. 10, pp. 1488-1497.
Özen, G.Ö., (2006), “Comparison of Elastic and Inelastic Behavior of Historic Masonry
Structures at Low Load Levels”, Master’s thesis, Middle East Technical University, Ankara,
Turkey.
Ramos, L. F., Lourenço, P. B., and Costa, A. C., (2005), "Operational Modal Analysis for
Damage Detection of a Masonry Construction.", 1st International Operational Modal Analysis
Conference, Copenhagen, Denmark, pp.495-502.

64
Ramos, L.F., De Roeck, G., Lourenço, P.B., and Campos-Costa, A., (2010), “Damage
Identification on Arched Masonry Structures using Ambient and Random Impact Vibrations”,
Engineering Structures, Vol. 32, No. 1, pp. 146-162.
Ricart-Nouel, A., (1991), "Report on the Structure of the Cathedral of Santo
Domingo", Structural Repair and Maintenance of Historical Buildings II, Vol. 1, pp. 37-52.
Rossell, J., (1995), “Rafael Guastavino I Moreno Inventiveness in 19th Century Architecture”,
Guastavino C., Col-legi „Arquitectes de Catalunya, Barcelona.
Saliklis, E., Kurtz, S., and Furnbach, S., (2003), “Finite Element Modeling of Guastavino Tiled
Arches”, Proceedings of the Eighth International Conference on Structural Studies, Repairs and
Maintenance of Heritage Architecture, Halkidiki, Greece, pp. 257-266.
Theodossopoulos, D., (2004), “Structural Scheme of the Cathedral of Burgos”, Proceedings of
the 4th International Conference Structure Analysis of Historical Constructions, Padua, Italy, pp.
10–13.
Turek, M., Ventura, C., and Placencia, P., (2002), "Dynamic Characteristics of a 17th Century
Church in Quito", Proceedings of the International Society of Optical Engineering, pp. 1259-
1264.
Udwadia, F. E., (1994), "Methodology for Optimum Sensor Locations for Parameter
Identification in Dynamic Systems", Journal of Engineering Mechanics, Vol. 102, pp. 368–390.
URL-1 http://www.dur.ac.uk/~des0www4/cal/dams/geol/mod.htm <accessed 6/30/2011>.

65
Wickersham, G. W., and Cathedral Church of St. John the Divine. New York, NY., (1998), “The
Cathedral Church of Saint John the Divine: A House of Prayer for All Nations”, Cathedral
Church of Saint John the Divine.
Zonta, D., (2000), "Structural Damage Detection and Localization by Using Vibrational
Measurements", PhD thesis, University of Bologna, DISTART. Bologna, 2000.

66
CONCLUSIONS
The two manuscripts presented herein to address two of the major problems associated with
deploying SHM on historic masonry structures.
The first study deals with the selection and assimilation of optimal response features for
damage detection using an FE model of an arch as well as a scaled laboratory model. Features are
found to show varying damage sensitivities based on the damage severity as well as location. The
noise sensitivity of the structure is also shown to increase with the increase in the level of
damage. There is not one particular feature that is robust to the type, location and severity of
damage and to the inherent noise. By normalizing the damage indicating features to make them
unitless quantities, one can assimilate a number of features to get a better damage indicator that
reduces the uncertainties caused due to extraneous noise and the non-linear sensitivities of the
features to the damage severity.
In the second study, guidelines for the optimal sensor placement on historic masonry
monuments is presented using a modified version of the Effective Independence method. A
distance based criteria is enforced that allows the sensors to better explore the structural geometry
in order to allow visualization of mode shapes, an important aspect from the testing engineers
standpoint. The method uses numerical FE models of the Cathedral of St. John the Divine which
is developed in two stages. First, a substructure of the building is modeled and calibrated to the
experimental results and then, the entire model of one of the nave bays is created and validated
with the on-site inspection of existing cracks. Following the application of a modified Effective
independence method, optimal sensor locations are suggested, which are applicable to many
Gothic style Cathedral built, which poses typical structural configurations.

67
Although this thesis is focused on historic structures, professionals involved in testing any
structural form can follow the methodologies presented for an efficient deployment of SHM.