Structural Health Monitoring in Composite Materials using ... · Frequency Response Methods. ......
22
Active Material and Structures Laboratory Technology Laboratory for Advanced Composites Department of Aeronautics and Astronautics Massachusetts Institute of Technology Cambridge, MA 02139 AMSL Seth S. Kessler S. Mark Spearing Mauro J. Atalla Carlos E. S. Cesnik Constantinos Soutis Structural Health Monitoring in Composite Materials using Frequency Response Methods
Transcript of Structural Health Monitoring in Composite Materials using ... · Frequency Response Methods. ......

Active Material and Structures LaboratoryTechnology Laboratory for Advanced Composites
Department of Aeronautics and AstronauticsMassachusetts Institute of Technology
Cambridge, MA 02139
AMSL
Seth S. Kessler
S. Mark Spearing
Mauro J. Atalla
Carlos E. S. Cesnik
Constantinos Soutis
Structural Health Monitoring in Composite Materials using
Frequency Response Methods

SPIE01-3/7/01 2
Structural Health Monitoring• Definition: SHM denotes a system with the ability to detect
and interpret adverse “changes” in a structure in order to improve reliability and reduce life-cycle costs.
• Can be implemented many ways– active/passive– post-operation/in-situ
• Reduces inspection and maintenance expenses and increases the reliability of damage detection and failure prediction– currently 27% of aircraft life cycle cost is spent in inspections– avoid tear-down of built up structures for required inspections– much of the airline and military fleet are aging aircrafts, fatigue
and corrosion become a problem

SPIE01-3/7/01 3
Overall Research Goals• Status quo of SHM research
– several projects investigating particular methods on ideal coupons– investigators are often over-sold on their own detection method– little presented on limitations of methods or pertinence to SHM
• Proposed research– investigate potential sensing methods and combinations– report on strengths and limitations of methods– implementation potential for a real structure (conformability, size, etc.)– show progression of detection reliability through building block
• Focus on composite materials — high pay-off area– easy to adhere or embed, can tailor material to suit needs– practical for new programs, can help to relax fears of “BVID”

SPIE01-3/7/01 4
Approach
• Review literature for candidate damage detection methods• Build analytical models
– determine theoretical sensitivity of method– address sensor placement– assist in design of experiments
• Experimental verification– test simple specimens with various damage, work up through
building block stages to structural element level– assess feasibility of implementing method in a SHM system
• System architecture– sensor integration– test samples with realistic sensors– test method on representative structures

SPIE01-3/7/01 5
Frequency Response Methods
• Literature review– among the most common health monitoring techniques– simple, flexible and inexpensive to implement (cost, weight, power)– global in nature, can scale easily– lacks ability to detect small damage and requires large data storage– actuation between 10-20 kHz is optimal for structural response,
however often impractical to collect data over 2 kHz
• Valdes and Soutis (Imperial) used piezo-ceramic patches to detect delamination in rectangular composite coupons– frequency sweeps up to 15 kHz used to induce dynamic response– linear reduction in natural frequency as delamination area increased– not model-dependent

SPIE01-3/7/01 6
Changes in Frequency Response
• Natural frequencies for beams:
– stiffness reduction decreases ?– density/mass reduction increases ?– boundary conditions most directly affect ?
• Mode shapes are altered by damage locations– bending modes affected by damage near nodes– torsion modes affected more by asymmetric damage– bending and torsion modes begin to couple
• Response amplitude increases with more damage
????
22 Et
mEI
?? ?

SPIE01-3/7/01 7
FE Modal Analysis
• Clamped-free rectangular slender plate
• Modeled and processed in I-DEAS– 10x2” quasi-isotropic laminate (ABD matrices calculated in Matlab)– 2000 0.2” square shell elements– solved for all modes 0-20 kHz– mode shapes and transfer functions inspected in post-processor
• Several models representing various damage types– delamination — 2 layers of half laminate elements in damage region– fatigue cracks — 20% reduction in E of region (Tong et al., 1997)– fiber fracture — 10% reduction in E of region (Whitney, 1999)– hole — physically modeled holes in various locations

SPIE01-3/7/01 8
Simulated Damage Modes
Control Specimen
Matrix Crack Specimen
DelaminationSpecimen
Core Drilled Specimen
2”
10”

SPIE01-3/7/01 9
FEA Mode Shapes
First four mode shapes of control specimen plotted in I-DEAS post-processor
First bending Second bending
First torsion Third bending

SPIE01-3/7/01 10
Transfer Function ResponsePredicted Low Frequency Range
Frequency response plot demonstrates shift in frequencies due to delamination

SPIE01-3/7/01 11
Transfer Function ResponsePredicted High Frequency Range
Shifted peaks are difficult to match with control model at high frequencies

SPIE01-3/7/01 12
Experimental Approach
• AS4/3501-6 quasi-isotropic [90/?45/0]s laminates• Introduced representative damage to composite specimens
– delamination — slice utility knife in side of sample, or teflon strip– transverse ply cracks — 4-pt fatigue on center of specimen – fiber fracture — 4-pt bend until audible damage – stress concentration — drilled hole through specimen– impact — hammer struck against steel plate in center of sample
• X-radiography used to verify damage
hole delamination
transverse ply cracks

SPIE01-3/7/01 13
X-Ray Damage Verification
Control Specimen
Matrix Crack Specimen
DelaminationSpecimen
Core Drilled Specimen
2”
10”

SPIE01-3/7/01 14
Experimental Methods• Scanning laser vibrometer tests
– 3 samples of each type tested– clamp boundary condition simulated by a vice
tightened with a torque wrench– 2 piezoceramics at base driven out of phase
with 8V sine sweep signal to excite resonance– velocity response measured at mesh grid
points with laser interferometer– plotted response averaged across grid
• Impedance analyzer tests– identical specimen and set-up– one piezoceramic actuates, other senses– potential for implementation in SHM system– lacks mode shape information– good correlation with vibrometer results
9”
2”

SPIE01-3/7/01 15
Experimental Mode Shapes
First bending Second bending
First torsion Third bending
Mode shapes of control specimen from vibrometer data matches FEA results

SPIE01-3/7/01 16
Averaged Velocity ResponseExperimental Low Frequency Range
Clearly identifiable shift in frequencies due to delamination

SPIE01-3/7/01 17
Averaged Velocity ResponseExperimental Low Frequency Range
All damage caused a small reduction in frequencies, various modes affected differently

SPIE01-3/7/01 18
Frequency Comparison
432428451453453461Experiment
472466465474473476FEAMode 6: 2nd Torsion
423413428423423423Experiment
422413412426425428FEAMode 5: 4th Bending
214209215216217218Experiment
216213211217217218FEAMode 4: 3rd Bending
137146137147148157Experiment
154150149156155157FEAMode 3: 1st Torsion
76.375.078.176.578.178.1Experiment
76.373.775.577.577.277.8FEAMode 2: 2nd Bending
12.512.512.512.512.512.5Experiment
12.412.112.112.512.412.5FEAMode 1:1st Bending
FractureCrackDelamImpactHoleControl(All Hz)Shape

SPIE01-3/7/01 19
Frequency Comparison
8.5%8.2%3.0%4.4%4.2%3.2%Experiment
FEAMode 6: 2nd Torsion
0.2%0.0%3.9%0.7%0.5%1.2%Experiment
FEAMode 5: 4th Bending
0.9%1.9%1.9%0.5%0.0%0.0%Experiment
FEAMode 4: 3rd Bending
4.5%2.7%8.1%5.8%4.5%0.0%Experiment
FEAMode 3: 1st Torsion
0.0%1.8%3.4%1.3%1.2%0.4%Experiment
FEAMode 2: 2nd Bending
0.8%3.3%3.3%0.0%0.8%0.0%Experiment
FEAMode 1:1st Bending
FractureCrackDelamImpactHoleControl(All Hz)Shape
Good correlation between FEA and experimental results at frequencies < 500 Hz

SPIE01-3/7/01 20
Frequency Comparison
Experiment
-4.0-10-11-2.0-3.0476FEAMode 6: 2nd Torsion
Experiment
-6.0-15-16-2.0-3.0428FEAMode 5: 4th Bending
Experiment
-2.0-5.0-7.0-1.0-1.0218FEAMode 4: 3rd Bending
Experiment
-3.0-7.0-8.0-1.0-2.0157FEAMode 3: 1st Torsion
Experiment
-1.5-4.1-2.3-0.3-0.677.8FEAMode 2: 2nd Bending
Experiment
-0.1-0.4-0.40.0-0.112.5FEAMode 1:1st Bending
FractureCrackDelamImpactHoleControl(All Hz)Shape
Small differences between control and damaged models at frequencies < 500 Hz

SPIE01-3/7/01 21
Modal Analysis Conclusions• Method shows useful detection sensitivity to damage• Experiments are very sensitive to boundary conditions• Low frequency response shows little change in characteristics• High frequency response not straightforward to interpret
– little information on damage type or location (cracks ? 2” delam)– modes shapes combine, new local modes can appear– altering one variable linearly is not practical for real applications
• Possible strategy for implementation in SHM system– advantages: light, conformal, can be passive, variety of sensors– first line of defense for detecting changes caused by damage,
use of active sensors for more detail– last line of defense for widespread fatigue or aging damage on
global modes; can set limit on modal resonance change
SPIE01-3/7/01 22
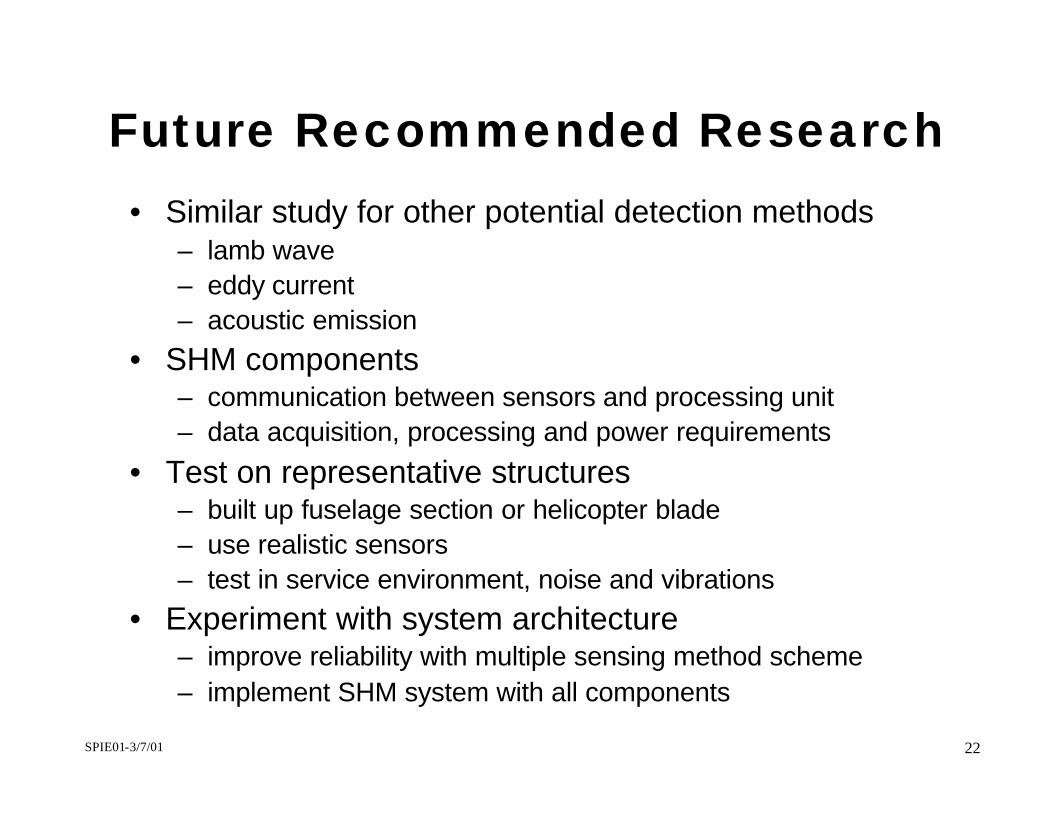
Future Recommended Research• Similar study for other potential detection methods
– lamb wave – eddy current– acoustic emission
• SHM components– communication between sensors and processing unit– data acquisition, processing and power requirements
• Test on representative structures– built up fuselage section or helicopter blade– use realistic sensors– test in service environment, noise and vibrations
• Experiment with system architecture– improve reliability with multiple sensing method scheme– implement SHM system with all components