
Structural Effects of Ammonia Binding to the Mn CaO ...
16
S1 SUPPLEMENTARY INFORMATION FOR Structural Effects of Ammonia Binding to the Mn 4 CaO 5 Cluster of Photosystem II AUTHORS: David A. Marchiori 1 , Paul H. Oyala 1 , Richard J. Debus 2 , Troy A. Stich 1 , and R. David Britt 1,* AFFILIATION: 1. Department of Chemistry, University of California, Davis, Davis CA 95616 2. Department of Biochemistry, University of California, Riverside, Riverside CA 92521 E-MAIL: [email protected] TABLE OF CONTENTS: Figure S1. X-band CW EPR of WT*, D61A, and spinach with and without ammonia Figure S2. X-band 3-pulse ESEEM of spinach with and without 15 NH 3 Figure S3. Q-band 1 H Davies ENDOR and simulations from QM/MM models and XFEL structure. Figure S4. X-band CW of the S 2 state with and without ammonia and simulations Figure S5. Pseudomodulated Q-band 1 H Davies ENDOR with and without ammonia Table S1. A dip 1 H HFI Values (MHz) Calculated Using Mulitpole Point-Dipole Approximation Figure S6. X-band 3-pulse ESEEM of the untreated S 2 -state with DFT and QM/MM based simulations Figure S7. DFT Model from Lohmiller et al. depicting waters used in 3-pulse ESEEM simulations Figure S8. X-band 3-Pulse ESEEM simulations of the “Carousel” model of Askerka et al. using Aiso values of ± 10 MHz
Transcript of Structural Effects of Ammonia Binding to the Mn CaO ...

S1
SUPPLEMENTARY INFORMATION FOR
Structural Effects of Ammonia Binding to the Mn4CaO5 Cluster of
Photosystem II
AUTHORS: David A. Marchiori1, Paul H. Oyala1, Richard J. Debus2, Troy A. Stich1, and R.
David Britt1,*
AFFILIATION:
1. Department of Chemistry, University of California, Davis, Davis CA 95616
2. Department of Biochemistry, University of California, Riverside, Riverside CA 92521
E-MAIL: [email protected]
TABLE OF CONTENTS:
Figure S1. X-band CW EPR of WT*, D61A, and spinach with and without ammonia
Figure S2. X-band 3-pulse ESEEM of spinach with and without 15NH3
Figure S3. Q-band 1H Davies ENDOR and simulations from QM/MM models and XFEL structure.
Figure S4. X-band CW of the S2 state with and without ammonia and simulations
Figure S5. Pseudomodulated Q-band 1H Davies ENDOR with and without ammonia
Table S1. Adip 1H HFI Values (MHz) Calculated Using Mulitpole Point-Dipole Approximation
Figure S6. X-band 3-pulse ESEEM of the untreated S2-state with DFT and QM/MM based simulations
Figure S7. DFT Model from Lohmiller et al. depicting waters used in 3-pulse ESEEM simulations
Figure S8. X-band 3-Pulse ESEEM simulations of the “Carousel” model of Askerka et al. using Aiso values of ± 10 MHz

S2
Figure S9. X-band three-pulse ESEEM of the natural abundance 14N-ammonia-bound S2-state in the D1-D61A mutant, WT*, and BBY membranes prepared from spinach
Table S2. 14N HFI and NQI Parameters for NH3 Bound to the OEC in the S2 State
S3
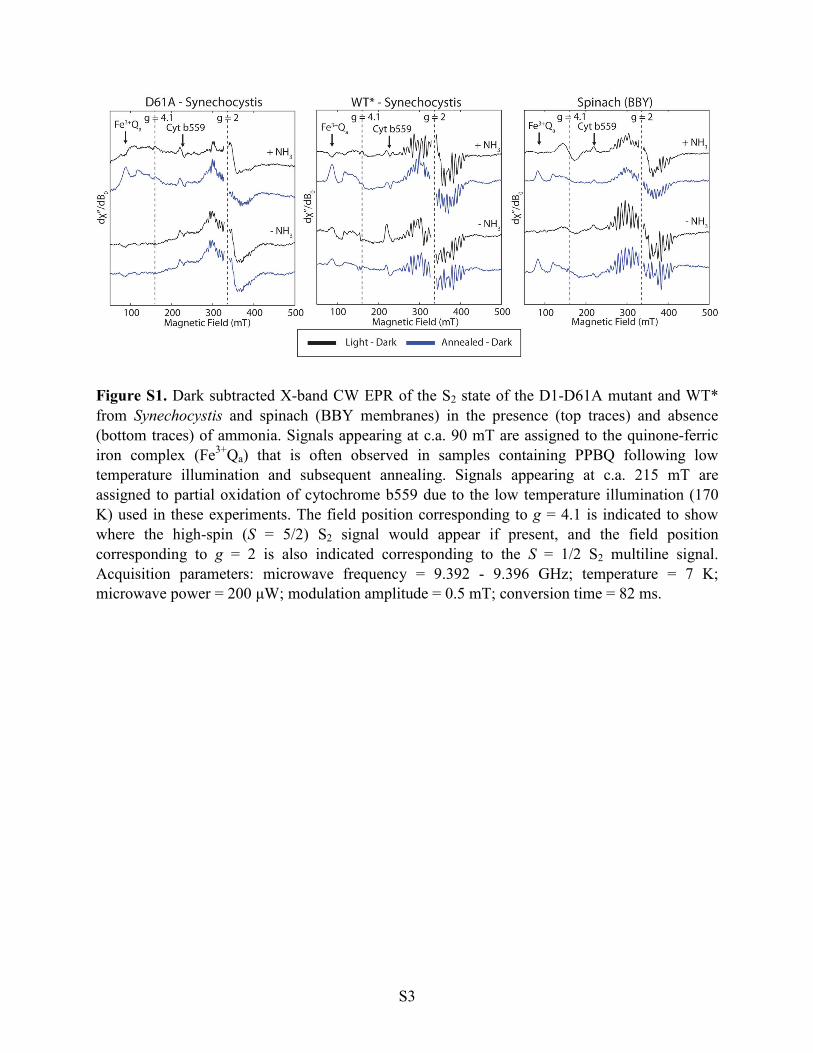
Figure S1. Dark subtracted X-band CW EPR of the S2 state of the D1-D61A mutant and WT* from Synechocystis and spinach (BBY membranes) in the presence (top traces) and absence (bottom traces) of ammonia. Signals appearing at c.a. 90 mT are assigned to the quinone-ferric iron complex (Fe3+Qa) that is often observed in samples containing PPBQ following low temperature illumination and subsequent annealing. Signals appearing at c.a. 215 mT are assigned to partial oxidation of cytochrome b559 due to the low temperature illumination (170 K) used in these experiments. The field position corresponding to g = 4.1 is indicated to show where the high-spin (S = 5/2) S2 signal would appear if present, and the field position corresponding to g = 2 is also indicated corresponding to the S = 1/2 S2 multiline signal. Acquisition parameters: microwave frequency = 9.392 - 9.396 GHz; temperature = 7 K; microwave power = 200 µW; modulation amplitude = 0.5 mT; conversion time = 82 ms.

S4
Figure S2. X-band 3-pulse ESEEM of the 15N-ammonia-bound S2-state (blue) and untreated S2-state (red) in BBY membranes prepared from spinach in protiated solvent. Acquisition parameters: microwave frequency = 9.336 GHz; magnetic field = 336.8 mT; temperature = 4.5 K; π/2 MW pulse length = 12 ns; Tinit = 40 ns; τ = 208 ns; rep. time = 5 ms.

S5
The net dipolar contribution of each proton listed in Table S1 was calculated from relevant DFT, QM/MM, and X-Ray structures. Each of the four Mn····1H dipolar terms are scaled by the respective spin-projection factors reported in Lohmiller et al.,1 transformed into a common reference frame, and summed to yield the net dipolar contribution. Simulations were constructed utilizing the salt and saffron routines from the EasySpin toolbox2-3 for 1H ENDOR and 2H ESEEM respectively. The 2H HFI was computed by scaling the 1H HFI by the ratio of the gyromagnetic ratios (i.e. γ2H/γ1H ≈ 0.154). Simulations included nuclear quadrupole parameters (η = 0.1 and e2Qq = 0.22 MHz) for each deuterium nucleus based on previously reported values.4-5 An isotropic HFI of 2 MHz was included for ligands bound to Mn4A, based on previously reported values.6 A range of isotropic HFI for O5 (± 10 MHz, the width on the +NH3 ENDOR envelope) are shown in Figure S8.
Figure S3. Q-band 1H Davies ENDOR of the S2 state in absence (left and middle) and presence (right) of ammonia. Left: simulation parameters utilizing coordinates from Shen et al.7 Middle: simulation parameters utilizing coordinates from Askerka et al.8 Right: simulation paramters utilizing coordinates from Askerka et al.9

S6
Figure S4. X-band CW of the S2 state in the presence (top traces) and absence of ammonia (bottom traces) after annealing at 250 K. Experimental dark-subtracted traces are shown in black, while simulations using the parameters found in Table 2 are shown in red. Acquisition parameters: microwave frequency = 9.39 GHz; temperature = 7 K; MW power = 200 µW; mod. amp. = 5 G; conv. time = 82 ms.

S7
Figure S5. Pseudomodulated Q-band 1H Davies ENDOR of the S2 state in spinach. Black: in the absence of ammonia. Blue: in presence of ammonia after annealing at 250K.
-6 -4 -2 0 2 4 6
νRF - ν(
1H) (MHz)
ENDOR response
+ NH3
- NH3

S8
Table S1. Adip 1H HFI Values (MHz) calculated using multipole point-dipole approximation
based on structures from experiment, DFT, and QM/MM. Blue: exchangeable protons. Black: non exchangeable protons.

S9

S10
Figure S6. X-band 3-pulse ESEEM of the untreated S2-state (black) with DFT and QM/MM based simulations (colored).

S11
Figure S7. Model from Lohmiller et al. depicting waters within ~5 Å of the OEC.

S12

S13
Figure S8. X-band 3-Pulse ESEEM simulations of the “Carousel” model of Askerka et al. using Aiso values of ± 10 MHz. 1H Aiso values shown in figure captions are multiplied by gyromagnetic ratios for 2H and 1H (i.e. γ2H/γ1H ≈ 0.154) to yield the resultant 3-Pulse ESEEM simulations.

S14
The magnetic parameters of the ammonia nitrogen bound to the OEC (Table S2) were determined by simulation of the corresponding X-band ESEEM spectra (Figure S9). In our re-evaluation of the coupling constants determined for ammonia bound to spinach PSII, we achieved a better fit of the data by decreasing the electric field asymmetry parameter η from 0.5910 to 0.402 and by adding significant rhombicity to the 14N hyperfine anisotropy (cf. Aaniso = [−0.20, −0.20, +0.40] MHz determined previously10 to Aaniso = [−0.37, +0.44, −0.07] MHz from the present work). This change brings the value for η more in line with those determined for ammonia-treated PSII from T. elongatus (η = 0.47)11 and Synechocystis (η = 0.40)12, indicating that the ammonia nitrogen nucleus experiences a similar electrostatic environment in PSII from all three organisms. In particular, the 14N ESEEM spectra for NH3 bound to the S2 state in PSII from spinach were indistinguishable from those obtained for WT* PSII from Synechocystis (see Figure S9 and corresponding simulation parameters in Table S2).
As we reported previously,12 mutation of D1-Asp61 to alanine in Synechocystis collapses the electric field asymmetry parameter (η = 0.042) as one would expect for a C3v-symmetric terminal ammonia ligand. Thus we concluded that the large asymmetry observed for native PSII preparations results from a strong hydrogen bond between the carboxylate of Asp61 and one of the ammonia protons. As the X-ray structures of PSII from Thermosynechococcus vulcanus show Asp61 as forming a hydrogen bond with W1 bound to Mn4A (Figure 1A),7 we concluded that ammonia must be binding in place of W1. Given the similar 14N-ammonia HFI and NQI parameters (Table S2), the interaction between NH3, Mn4A, and Asp61 in the ammonia-bound S2 state is likely identical in PSII from all three organisms.

S15
Figure S9. X-band three-pulse ESEEM of the natural abundance 14N-ammonia-bound S2-state in the D1-D61A mutant (left-hand panels), WT* (center panels) and BBY membranes prepared from spinach (right-hand panels). For each, the top panel shows the time-domain data after subtraction of a biexponential decay function, and the bottom panel displays the Fourier transform of each time trace using cross-term averaging. Black traces represent the experimental data, while red traces represent the simulated spectrum using the simulation parameters in Table 3. Acquisition parameters: microwave frequency = 9.319 GHz (D1-D61A), 9.329 GHz (WT*), 9.313 GHz (Spinach); magnetic field = 335.5 mT (D1-D61A), 336.4 mT (WT*), 336.0 mT (Spinach); temperature = 4.5 K; π/2 MW pulse length = 12 ns; repetition time = 5 ms.
Table S2. 14N HFI and NQI Parameters for NH3 Bound to the OEC in the S2 State. Species Aiso
(MHz) Ax,y,z (MHz) e
2qQ/ħ
(MHz) η A and P Euler
angles (α,β,γ)° Ref.
Spinach 2.33 [1.96 2.76 2.26] 1.616 0.402 (5, 98 110) This work Spinach 2.29 [2.09 2.09 2.69] 1.61 0.59 (0, 0, 0) 10 WT* Synechocystis
2.33 [1.96 2.76 2.26] 1.616 0.402 (5, 98 110) 12
T. elongatus 2.36 [2.77 2.62 1.69] 1.52 0.47 Not reported
11
D61A Synechocystis
2.36 [1.98 2.78 2.31] 1.536 0.042 (13, 51, 148) 12

S16
References
1. Lohmiller, T.; Krewald, V.; Navarro, M. P.; Retegan, M.; Rapatskiy, L.; Nowaczyk, M. M.; Boussac, A.; Neese, F.; Lubitz, W.; Pantazis, D. A. et al, Structure, ligands and substrate coordination of the oxygen-evolving complex of photosystem II in the S2 state: a combined EPR and DFT study. Phys. Chem. Chem. Phys. 2014, 16, 11877-11892. 2. Stoll, S.; Schweiger, A., EasySpin, a comprehensive software package for spectral simulation and analysis in EPR. J. Magn. Reson. 2006, 178, 42-55. 3. Stoll, S.; Britt, R. D., General and efficient simulation of pulse EPR spectra. Phys. Chem.
Chem. Phys. 2009, 11, 6614 - 6625. 4. Randall, D. W.; Gelasco, A.; Caudle, M. T.; Pecoraro, V. L.; Britt, R. D., ESE-ENDOR and ESEEM Characterization of Water and Methanol Ligation to a Dinuclear Mn(III)Mn(IV) Complex. J. Am. Chem. Soc. 1997, 119, 4481-4491. 5. Force, D. A.; Randall, D. W.; Lorigan, G. A.; Clemens, K. L.; Britt, R. D., ESEEM Studies of Alcohol Binding to the Manganese Cluster of the Oxygen Evolving Complex of Photosystem II. J. Am. Chem. Soc. 1998, 120, 13321-13333. 6. Aznar, C. P.; Britt, R. D., Simulations of the 1H electron spin echo-electron nuclear double resonance and 2H electron spin echo envelope modulation spectra of exchangeable hydrogen nuclei coupled to the S2-state photosystem II manganese cluster. Philos. Trans. R. Soc.
London, Ser. B 2002, 357, 1359-1366. 7. Suga, M.; Akita, F.; Hirata, K.; Ueno, G.; Murakami, H.; Nakajima, Y.; Shimizu, T.; Yamashita, K.; Yamamoto, M.; Ago, H. et al, Native structure of photosystem II at 1.95 angstrom resolution viewed by femtosecond X-ray pulses. Nature 2015, 517, 99-103. 8. Askerka, M.; Wang, J.; Brudvig, G. W.; Batista, V. S., Structural Changes in the Oxygen-Evolving Complex of Photosystem II Induced by the S-1 to S-2 Transition: A Combined XRD and QM/MM Study. Biochemistry 2014, 53, 6860-6862. 9. Askerka, M.; Vinyard, D. J.; Brudvig, G. W.; Batista, V. S., NH3 Binding to the S-2 State of the O-2-Evolving Complex of Photosystem II: Analogue to H2O Binding during the S-2 -> S-3 Transition. Biochemistry 2015, 54, 5783-5786. 10. Britt, R. D.; Zimmermann, J. L.; Sauer, K.; Klein, M. P., Ammonia binds to the catalytic manganese of the oxygen-evolving complex of photosystem II. Evidence by electron spin-echo envelope modulation spectroscopy. J. Am. Chem. Soc. 1989, 111, 3522-3532. 11. Perez Navarro, M.; Ames, W. M.; Nilsson, H.; Lohmiller, T.; Pantazis, D. A.; Rapatskiy, L.; Nowaczyk, M. M.; Neese, F.; Boussac, A.; Messinger, J. et al, Ammonia binding to the oxygen-evolving complex of photosystem II identifies the solvent-exchangeable oxygen bridge (mu-oxo) of the manganese tetramer. Proc. Natl. Acad. Sci. U.S.A. 2013, 110, 15561-15566. 12. Oyala, P. H.; Stich, T. A.; Debus, R. J.; Britt, R. D., Ammonia Binds to the Dangler Manganese of the Photosystem II Oxygen-Evolving Complex. J. Am. Chem. Soc. 2015, 137, 8829-8837.


![Review Article: Immobilized Molecules Using Biomaterials ... · Cao L, 2005 [5]. 1.4.2. Covalent Binding . This method of immobilization involves formation of a covalent bond between](https://static.fdocuments.in/doc/165x107/5c024fdd09d3f2fa038de969/review-article-immobilized-molecules-using-biomaterials-cao-l-2005-5.jpg)
