Structural Developments in the Financial Systems of OECD ... · The opinions expressed and...
50
– © * * The main text of this paper was prepared by John K. Thompson, Consultant and former Counsellor in the OECD Directorate for Financial and Enterprise Affairs, with statistical assistance by Ting Yang, Consultant, and editorial input by Gert Wehinger, Economist, both in the Financial Affairs Division of the Directorate for Financial and Enterprise Affairs. The paper is a revised version of a background note prepared for a Policy Dialogue on Financial Markets that the OECD Committee on Financial Markets held with financial policymakers from Brazil, China, India, and Indonesia (Enhanced Engagement countries). This Policy Dialogue was sponsored by the Government of Japan whose grant for this project is gratefully acknowledged. The paper has benefitted from comments by participants of the Policy Dialogue and by OECD staff. All remaining errors are those of the author. This work is published on the responsibility of the Secretary-General of the OECD. The opinions expressed and arguments employed herein do not necessarily reflect the official views of the Organisation or of the governments of its member countries.
Transcript of Structural Developments in the Financial Systems of OECD ... · The opinions expressed and...

– ©
*
* The main text of this paper was prepared by John K. Thompson, Consultant and former Counsellor in the OECD
Directorate for Financial and Enterprise Affairs, with statistical assistance by Ting Yang, Consultant, and
editorial input by Gert Wehinger, Economist, both in the Financial Affairs Division of the Directorate for
Financial and Enterprise Affairs. The paper is a revised version of a background note prepared for a Policy
Dialogue on Financial Markets that the OECD Committee on Financial Markets held with financial
policymakers from Brazil, China, India, and Indonesia (Enhanced Engagement countries). This Policy
Dialogue was sponsored by the Government of Japan whose grant for this project is gratefully
acknowledged. The paper has benefitted from comments by participants of the Policy Dialogue and by
OECD staff. All remaining errors are those of the author. This work is published on the responsibility of
the Secretary-General of the OECD. The opinions expressed and arguments employed herein do not
necessarily reflect the official views of the Organisation or of the governments of its member countries.

– ©
I. Background
Policy dialogue
with OECD
Enhanced
Engagement (EE5)
countries has
taken on a new
urgency due to the
world financial
crisis
Under a programme of Enhanced Engagement, the OECD has been pursuing
policy dialogue on a broad range of issues with a group of five key non-Member
countries, Brazil, China, India, Indonesia, and South Africa, hereafter the EE5.
Interest in pursuing such policy dialogue has taken on a new urgency due to the
world financial crisis of the past two years, which has vastly increased the
importance of EE5 countries in world finance. With the loss of capital in major
financial institutions since 2007, the weight of institutions from outside the
OECD has grown as a share of world banking assets, while banks from non-
OECD countries have become major participants in global financial markets.
Moreover, the share of EE5 countries in capitalisation of equity markets has
risen dramatically. As the crisis has continued, realisation has grown that the co-
operation between OECD and non-OECD countries is essential not only for the
management of the crisis but also for the design of a post-crisis financial
architecture.
This note
highlights some
features of EE5
financial systems
In the context of Enhanced Engagement, the OECD Committee on Financial
Markets (CMF) has held a Policy Dialogue with financial policy makers from
the EE5 countries in October 2009. This article is based on a paper prepared for
that meeting.
II. Current financial market developments and crisis-related issues
The most severe
financial crisis in
generations has led
policymakers to
provide
unprecedented fiscal
and monetary
stimulus
As a result of the sharp drops in asset prices and the illiquidity in major
components of the world financial system since 2007, a substantial part of the
accumulated wealth of OECD countries has been lost during the financial and
economic crisis. Many of the world‟s largest financial institutions became
insolvent and/or required expensive official rescues. The authorities in OECD
countries have provided an unprecedented fiscal and monetary stimulus to prevent
further contraction of income. Indeed, the shocks of the past two years are so
severe that some analysts and policy makers have begun to question many aspects
of the model of finance that had gained currency among OECD countries over the
past few decades.
EE5 countries have
weathered the crisis
better than most
OECD countries
Thus far the EE5 countries have weathered the crisis far better than most OECD
countries. Most EE5 countries experienced a slowing of growth, and Brazil and
South Africa are expected to see GDP fall in 2009, but the real economy has
proven more resilient than those of OECD countries and growth is expected to
recover more rapidly than in the OECD as a whole (Figure 1). Equity markets have
fared much better than those of OECD countries in the past three years (Figure 2).
Moreover, credit expansion has been maintained much better in EE5 countries
than in OECD countries (Figure 3). Bond prices in EE5 countries initially fell
sharply in the wake of the crisis, but the subsequent narrowing of credit spreads
underline an increased confidence by investors in the ,medium term prospects of
these countries (Figure 4).
Common interests
between OECD and
EE5 countries
The crisis has highlighted the common interests between OECD and EE5 countries
in preserving an open and fair environment for trade, investment and finance.
Mechanisms for international co-operation have been tested during the past three
years and the results have generally been positive. By agreeing on the need for

– ©
concerted fiscal and monetary action and by resisting protectionist pressures,
major countries have so far averted a retreat from an open trade and financial
system that would have aggravated the downward spiral.
Need to co-ordinate
policy responses
among a broad group
of countries
Recognition has grown of the need to co-ordinate policy responses among a broad
group of countries and to engage a wide range of countries in the decision making
process. Thus the G-20 that includes key OECD countries, the EE5, as well as
other countries,1 has assumed a leading role in making sure that adequate resources
are available for countries experiencing external financing strains and in
enunciating broad principles for reform of the financial architecture.
Figure 1. The macroeconomic situation in EE5 countries and the OECD
Selected variables, including forecasts
-4%
1%
6%
11%
Brazil China India Indonesia South Africa OECD
Real GDP growth
2006 2007 2008 2009 2010 2011
-3%
-1%
1%
3%
5%
7%
9%
11%
Brazil China India Indonesia South Africa OECD
Inflation rate ( CPI )
2006 2007 2008 2009 2010 2011
-11%
-9%
-7%
-5%
-3%
-1%
1%
3%
Brazil China India Indonesia South Africa OECD
Fiscal balance / GDP
2006 2007 2008 2009 2010 2011
-7%
-2%
3%
8%
Brazil China India Indonesia South Africa OECD
Current account balance /GDP
2006 2007 2008 2009 2010 2011
Source: OECD Economic Outlook, vol. 2009/2, no. 86, November 2009.
EE5 countries have a
relatively lower
financial
intermediation and
have taken a much
more guarded
approach to financial
liberalisation and
modernisation
To some degree, the relatively high resiliency of EE5 economies may reflect the
fact that their financial intermediation is relatively lower as compared to the one of
OECD countries, and that catch-up effects generate a relatively higher GDP
growth. At the same time it appears true that the crisis erupted in the most
sophisticated components of the financial system and the EE5 countries have taken
a much more guarded approach to financial liberalisation and modernisation than
the OECD countries. Banks in EE5 countries have continued to concentrate in
traditional deposit taking and lending and became involved in capital markets to a
much lesser extent than OECD countries. Domestic institutions in the EE5 had
used fewer financial innovations such as structured products, derivatives and
securitisation and engaged in less OTC activity. Moreover, the EE5 have had
much lower levels of consumer and housing indebtedness than OECD countries.

– ©
Figure 2. Selected equity market developments
Global Asia
0
50
100
150
200
Jan
-07
Mar
-07
May
-07
Jul-
07
Sep
-07
No
v-0
7
Jan
-08
Mar
-08
May
-08
Jul-
08
Sep
-08
No
v-0
8
Jan
-09
Mar
-09
May
-09
Jul-
09
Sep
-09
No
v-0
9
US Euro area Japan
Emerging Markets Latin America Asia ex. Japan
0
50
100
150
200
Jan
-07
Mar
-07
May
-07
Jul-
07
Sep
-07
No
v-0
7
Jan
-08
Mar
-08
May
-08
Jul-
08
Sep
-08
No
v-0
8
Jan
-09
Mar
-09
May
-09
Jul-
09
Sep
-09
No
v-0
9
Emerging Markets Asia ex. Japan China
India Indonesia
Latin America Africa
0
50
100
150
200
Jan
-07
Mar
-07
May
-07
Jul-
07
Sep
-07
No
v-0
7
Jan
-08
Mar
-08
May
-08
Jul-
08
Sep
-08
No
v-0
8
Jan
-09
Mar
-09
May
-09
Jul-
09
Sep
-09
No
v-0
9
Emerging Markets Latin America Brazil
0
50
100
150
200Ja
n-0
7
Mar
-07
May
-07
Jul-
07
Sep
-07
No
v-0
7
Jan
-08
Mar
-08
May
-08
Jul-
08
Sep
-08
No
v-0
8
Jan
-09
Mar
-09
May
-09
Jul-
09
Sep
-09
No
v-0
9
Emerging Markets South Africa
Note: Datastream total market indices (Jan 2007=100), all in US dollar terms,
Source: Thomson Financial Datastream.
Figure 3. Domestic Credit: Claims On Private Sector
Indices (Jan-07=100), in US dollar terms
A. In domestic currency terms B. In US dollar terms
100
110
120
130
140
150
160
170
180
Ja
n-0
7
Fe
b-0
7
Ma
r-0
7
Ap
r-0
7
Ma
y-0
7
Ju
n-0
7
Ju
l-0
7
Au
g-0
7
Se
p-0
7
Oct-
07
No
v-0
7
De
c-0
7
Ja
n-0
8
Fe
b-0
8
Ma
r-0
8
Ap
r-0
8
Ma
y-0
8
Ju
n-0
8
Ju
l-0
8
Au
g-0
8
Se
p-0
8
Oct-
08
No
v-0
8
De
c-0
8
Ja
n-0
9
Fe
b-0
9
Ma
r-0
9
Ap
r-0
9
Ma
y-0
9
Ju
n-0
9
Ju
l-0
9
Au
g-0
9
Se
p-0
9
Oct-
09
No
v-0
9
De
c-0
9
Ind
ex (Ja
n-0
7=
10
0)
Brazil
China
India
Indonesia
South Africa
G7
80
100
120
140
160
180
200
Ja
n-0
7
Fe
b-0
7
Ma
r-0
7
Ap
r-0
7
Ma
y-0
7
Ju
n-0
7
Ju
l-0
7
Au
g-0
7
Se
p-0
7
Oct-
07
No
v-0
7
De
c-0
7
Ja
n-0
8
Fe
b-0
8
Ma
r-0
8
Ap
r-0
8
Ma
y-0
8
Ju
n-0
8
Ju
l-0
8
Au
g-0
8
Se
p-0
8
Oct-
08
No
v-0
8
De
c-0
8
Ja
n-0
9
Fe
b-0
9
Ma
r-0
9
Ap
r-0
9
Ma
y-0
9
Ju
n-0
9
Ju
l-0
9
Au
g-0
9
Se
p-0
9
Oct-
09
No
v-0
9
De
c-0
9
Ind
ex (Ja
n-0
7=
10
0)
Brazil
China
India
Indonesia
South Africa
G7
Note: G7 includes data from the United States, Japan, Germany, France, Italy, the United Kingdom and Canada, in USD terms.
Source: IMF International Financial Statistics; Thomson Financial Datastream; and OECD.

– ©
Figure 4. Selected emerging market bond spreads
Global Asia
0
200
400
600
800
1000
1200
1400
1600
1800
2000
Jan
-94
Oct
-94
Jul-
95
Ap
r-9
6
Jan
-97
Oct
-97
Jul-
98
Ap
r-9
9
Jan
-00
Oct
-00
Jul-
01
Ap
r-0
2
Jan
-03
Oct
-03
Jul-
04
Ap
r-0
5
Jan
-06
Oct
-06
Jul-
07
Ap
r-0
8
Jan
-09
Oct
-09
Composite Latin America Asia Africa
0
200
400
600
800
1000
1200
1400
1600
1800
2000
Jan
-94
Oct
-94
Jul-
95
Ap
r-9
6
Jan
-97
Oct
-97
Jul-
98
Ap
r-9
9
Jan
-00
Oct
-00
Jul-
01
Ap
r-0
2
Jan
-03
Oct
-03
Jul-
04
Ap
r-0
5
Jan
-06
Oct
-06
Jul-
07
Ap
r-0
8
Jan
-09
Oct
-09
Composite Asia China Indonesia
Latin America Africa
0
200
400
600
800
1000
1200
1400
1600
1800
2000
Jan
-94
Oct
-94
Jul-
95
Ap
r-9
6
Jan
-97
Oct
-97
Jul-
98
Ap
r-9
9
Jan
-00
Oct
-00
Jul-
01
Ap
r-0
2
Jan
-03
Oct
-03
Jul-
04
Ap
r-0
5
Jan
-06
Oct
-06
Jul-
07
Ap
r-0
8
Jan
-09
Oct
-09
Composite Latin America Brazil
0
200
400
600
800
1000
1200
1400
1600
1800
2000Ja
n-9
4
Oct
-94
Jul-
95
Ap
r-9
6
Jan
-97
Oct
-97
Jul-
98
Ap
r-9
9
Jan
-00
Oct
-00
Jul-
01
Ap
r-0
2
Jan
-03
Oct
-03
Jul-
04
Ap
r-0
5
Jan
-06
Oct
-06
Jul-
07
Ap
r-0
8
Jan
-09
Oct
-09
Composite Africa South Africa
Note: JPM EMBI Global - blended spreads.
Source: Thomson Financial Datastream.
III. Basic characteristics of the financial systems of EE5 countries
1. Overview
Large differences
in financial
structures of EE5
countries against
OECD but also
within their peer
group
While striking differences are found among the EE5 Countries, this group of
countries shares some distinctive characteristics. This section examines key
indicators and compares the EE5 countries to OECD Members. It is recognised
that comparison to the average of OECD countries may give a misleading
impression of the relative position of EE5 countries. Thus in cases where other
comparisons are relevant and where the data are available, the EE5 countries are
measured against (a) the G-7 Countries (b) OECD Accession Countries and
(c) low income OECD Countries (for definitions of these groups see footnote to
Figure 5.) The financial systems of the EE5 countries will be analysed using
indicators covering six sets of criteria: (1) financial system depth and patterns of
intermediation, (2) patterns of asset holding, (3) access to financial services,
(4) internationalisation of finance, (5) stability and prudential soundness, and
(6) institutional and regulatory structure.2

– ©
Major features and
trends in the
financial systems
Some of the major features and trends in the financial systems of the EE5
countries are:
The financial systems of EE5 countries have been developing rapidly but
are, broadly speaking, at earlier stages of development as compared to
OECD countries on average, reflected in lower financial asset/GDP
ratios.
Financial intermediation in EE5 countries tends to take the form of bank
lending rather than issues of securities in capital markets.
The institutional investor sector is far less developed in the EE5
countries, except in South Africa and to a lesser degree Brazil.
The corporate bond market in EE5 countries is much less developed than
in OECD countries, but the equity markets of most EE5 countries are
proportionately as large as those of OECD countries.
Except in South Africa, state-owned banks account for rather large
shares of total bank assets
Foreign presence in the banking market is small in China and India
Following years in which banks often had poor balance sheet quality,
banking has been transformed with improved supervision, higher rates of
profitability, better asset quality and stronger capital ratios.
While most EE5 countries have developed sophisticated instruments
such as futures and options, they have been cautious about authorising
new products such as OTC derivatives and structured products.
2. Market depth and patterns of intermediation
Financial systems
of the EE5
countries tend to
be not as deep as
those of OECD
Members
Figure 5 shows market depth and the relative size of major components of the
financial system in the EE5 and OECD countries. Most indicators show that the
financial systems of the EE5 tend to be not as deep as those of OECD Members.
For example, total financial assets (bank assets + capital market assets) represent
a smaller share of GDP in the EE5 than in the OECD countries, but the financial
systems of the EE5 countries have been growing rapidly. The equity markets of
most EE5 countries are already on a par with those of OECD countries (at least
in terms of the size of markets). By most measures, South Africa‟s financial
system is as deep as those of OECD countries.
EE5 countries can
be characterised as
more „bank-
dominated‟ than
OECD countries
In general, the assets of the banking systems of the EE5 account for lower shares
of GDP than those of the OECD countries. Nevertheless, financial
intermediation in the EE5 countries can be characterised as more “bank-
dominated” than OECD countries inasmuch as the predominant share of
financial intermediation still occurs through on-balance sheet bank lending.
Corporate debt markets are less developed and represent a smaller share of GDP
than in OECD countries. OECD countries have been experiencing a process of
disintermediation under which corporations have been relying less on bank
borrowing and obtain external funding by issuing securities that are sold directly
to investors. Similarly, markets in securitised assets, mortgage-backed securities
(MBS) and asset-backed securities (ABS) in EE5 countries remain at an
incipient stage.

– ©
Figure 5. Financial intermediation in OECD and EE5 countries
Selected variables, in per cent of GDP
(a) Deposit money bank assets (b) Stock market capitalisation
0%
20%
40%
60%
80%
100%
120%
140%
160%
Brazil China India Indonesia South Africa
G7 Accession countries
Low income OECD
countries
OECD average
2000 2005 2007
0%
50%
100%
150%
200%
250%
300%
Brazil China India Indonesia South Africa
G7 Accession countries
Low income OECD
countries
OECD average
2000 2005 2007
(c) Private bond market capitalisation (d) Public bond market capitalisation
0%
10%
20%
30%
40%
50%
60%
70%
80%
Brazil China India Indonesia South Africa
G7 Low income OECD
countries
OECD average
2000 2005 2007
0%
10%
20%
30%
40%
50%
60%
70%
80%
Brazil China India Indonesia South Africa
G7 Low income OECD
countries
OECD average
2000 2005 2007
Notes: Country groups show GDP-weighted averages of the respective variable. G7 countries are Canada, France, Germany, Italy, Japan, the United Kingdom and the United States. Accession countries (in accession to the OECD) are Chile, Estonia, Israel, Russia, and Slovenia. Low income OECD countries are those with a real GDP per capita of less than 15 000 USD in 2007 and comprise Mexico, Turkey, the Czech Republic, the Slovak Republic, Poland and Hungary. OECD averages are also GDP-weighted and are calculated over all 30 OECD member countries, except in Panel c where they do not include Luxembourg, New Zealand, Poland, the Slovak Republic, and Turkey (2001-2005); and Panel d where they do not include Luxembourg.
Sources: World Bank, Financial Development and Structure Database; People’s Bank of China; and OECD.
Bond markets in
EE5 countries are
relatively smaller,
as fiscal positions
are stronger
In addition to the continued strong dominance of banks in corporate finance in
EE5, the relatively low level of fixed income market development also reflects
the stronger fiscal positions of the EE5 countries and consequently lower levels
of government borrowing. Thus, in all EE5 countries except South Africa, public
debt-to-GDP ratios are lower than in the average of OECD countries.
Equity markets of
EE5 compare
favourably with
those of OECD
countries
The situation is rather different with respect to equity finance, where the markets
of EE5 countries compare favourably with those of OECD countries. Despite a
growing development of OECD equity markets over the past few decades, the
capitalisation equity markets of EE5 countries had been growing more rapidly
than those in OECD countries for several years. Moreover, in the current crisis
the sharp correction of equity markets in OECD countries stands in contrast to
the more resilient performance of in the EE5. In South Africa, where the equity
market was already well developed, it has now advanced to the point that that
market is comparatively larger than in any OECD country.3 Brazil, China and
India have all made significant strides in promoting the development of equity
markets and their markets now rank among the largest in the world in absolute
size. Indonesia has also made significant gains, but still lags behind other EE5
countries.

– ©
Figure 6. Patterns of holding of financial assets
Assets of institutional investors in 2005, in per cent of GDP
59
.7
52
.2
50
.7
16
2.6
16.0 2
8.0
4.0
48
.0
3.4
2.6 8.
3 14
.3
5.8
5.3
1.0 1
2.1
2.3
1.1 5.0 8.
4
57
.5
19.2
78.0
15
4.7
0
50
100
150
Pe
nsi
on
fun
ds
Mu
tual
fu
nd
s
Insu
ran
ce c
om
pan
ies
Tota
l in
st.in
v.
Pe
nsi
on
fun
ds
Mu
tual
fu
nd
s
Insu
ran
ce c
om
pan
ies
Tota
l in
st.in
v.
Pe
nsi
on
fun
ds
Mu
tual
fu
nd
s
Insu
ran
ce c
om
pan
ies
Tota
l in
st.in
v.
Pe
nsi
on
fun
ds
Mu
tual
fu
nd
s
Insu
ran
ce c
om
pan
ies
Tota
l in
st.in
v.
Pe
nsi
on
fun
ds
Mu
tual
fu
nd
s
Insu
ran
ce c
om
pan
ies
Tota
l in
st.in
v.
Pe
nsi
on
fun
ds
Mu
tual
fu
nd
s
Insu
ran
ce c
om
pan
ies
Tota
l in
st.in
v.
OECD Brazil China India Indonesia South Africa
Notes: OECD averages are GDP-weighted and comprise data from Australia, Austria, Belgium, Canada, Denmark, Finland, France, Germany, Greece, Japan, Luxembourg, the Netherlands, Norway, Spain, Turkey, the United Kingdom and the United States; these data are comparable across countries and in aggregate represent more than 90% of institutional investors‘ activity within all OECD countries.
Sources: OECD Database on Institutional Investors assets; Inter-American Development Bank; Asian Development Bank; and World Bank (2006).
Institutional
investment is far
less developed in
the EE5 countries,
except in South
Africa and, to a
lesser degree,
Brazil
One set of indicators that is closely related to the pattern on financial
intermediation is the relatively simple pattern of holding of financial assets in
EE5. As Figure 6 shows, although bank deposits represent a lower share of GDP
in the EE5 than in OECD, bank deposits are still the primary means by which the
public holds financial assets. By contrast, one of the most striking features of the
financial systems of the OECD countries has been the emergence of institutional
investors, i.e. pension funds, insurance and collective investment schemes or
(CIS), as the main form of wealth holding in OECD countries and as the major
investors in securities. Among EE5 countries, only South Africa has a pattern of
asset holding that is similar to those of OECD countries. In some countries some
categories of institutional investors are comparatively well developed. Thus in
Brazil CIS are well developed while pension funds have accumulated a moderate
amount of assets. On balance, however, institutional investment is not well
advanced in the EE5 at this time.
With pension and
other reforms, the
pattern of asset
holding in EE5
countries will
change drastically
This situation is likely to change significantly as legal and regulatory
frameworks are reformed and new funded pension schemes are introduced. In
fact, major reforms are under consideration in several countries. Thus in 2007,
India implemented a shift in the retirement scheme for civil servants to a new
system of defined contribution accounts. An extension of this scheme to the
general population is under active consideration. China and Indonesia are also
considering major reforms. If these reforms are implemented on a substantial
scale, the pattern of asset holding in EE5 countries will change drastically, a
development with major implications for world financial markets.
– ©
Diversification of
wealth holding
away from bank
deposits will foster
competition and
financial
innovation
The present paucity of institutional investors in the EE5 is one of the
explanations for the persistence of bank domination of finance, since there is a
dearth of “natural buyers” for fixed income securities. The relative backwardness
of institutional investment also means that one of the main pressures for
financial innovation, i.e. competition among financial intermediaries to develop
new products to satisfy the needs of investors, has been less pronounced in the
EE5.
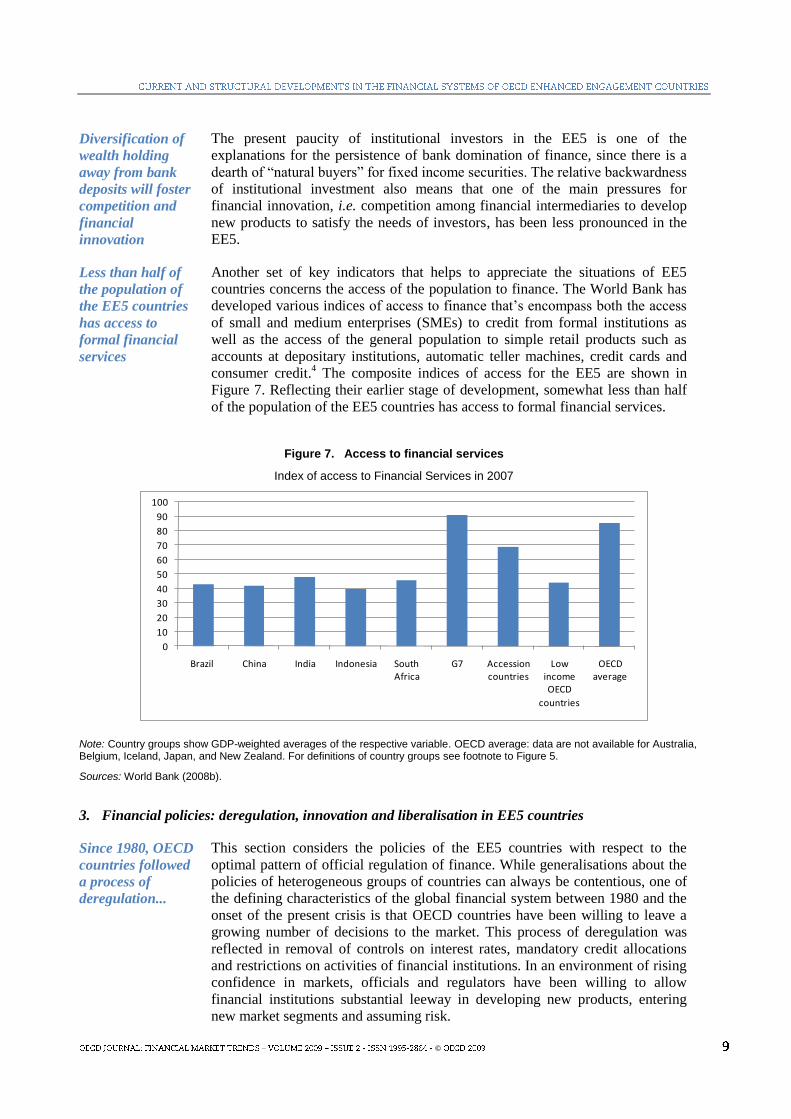
Less than half of
the population of
the EE5 countries
has access to
formal financial
services
Another set of key indicators that helps to appreciate the situations of EE5
countries concerns the access of the population to finance. The World Bank has
developed various indices of access to finance that‟s encompass both the access
of small and medium enterprises (SMEs) to credit from formal institutions as
well as the access of the general population to simple retail products such as
accounts at depositary institutions, automatic teller machines, credit cards and
consumer credit.4 The composite indices of access for the EE5 are shown in
Figure 7. Reflecting their earlier stage of development, somewhat less than half
of the population of the EE5 countries has access to formal financial services.
Figure 7. Access to financial services
Index of access to Financial Services in 2007
0
10
20
30
40
50
60
70
80
90
100
Brazil China India Indonesia South Africa
G7 Accession countries
Low income OECD
countries
OECD average
Note: Country groups show GDP-weighted averages of the respective variable. OECD average: data are not available for Australia, Belgium, Iceland, Japan, and New Zealand. For definitions of country groups see footnote to Figure 5.
Sources: World Bank (2008b).
3. Financial policies: deregulation, innovation and liberalisation in EE5 countries
Since 1980, OECD
countries followed
a process of
deregulation...
This section considers the policies of the EE5 countries with respect to the
optimal pattern of official regulation of finance. While generalisations about the
policies of heterogeneous groups of countries can always be contentious, one of
the defining characteristics of the global financial system between 1980 and the
onset of the present crisis is that OECD countries have been willing to leave a
growing number of decisions to the market. This process of deregulation was
reflected in removal of controls on interest rates, mandatory credit allocations
and restrictions on activities of financial institutions. In an environment of rising
confidence in markets, officials and regulators have been willing to allow
financial institutions substantial leeway in developing new products, entering
new market segments and assuming risk.

– ©
...and inter-
nationalisation
In the past few decades, a rising share of financial operations has taken place
against the background of a growing internationalisation of markets. It was
accepted that foreign financial institutions should be allowed to become
established in domestic financial markets and should be accorded national
treatment. The capability of corporate entities and financial institutions to move
operations into offshore markets persuaded regulators and legislators to look
favourably on requests by private institutions to engage in new kinds of
activities.
...contrasting the
developments in
EE5 countries
The evolution in the thinking of the EE5 countries presents interesting contrasts
with that of OECD countries. If one were to look back a few decades, most EE5
countries rejected many of the basic presumptions that underlay the
liberalisation, deregulation and internationalisation that was occurring in OECD
countries. The initial motivations for rejecting the free market model included
ideological scepticism about the operations of the capitalist system and
suspicions that the international market operated to the advantage of powerful
high income countries. Furthermore, many of these countries wished to pursue
active industrial policies inside closed economies. Finance was often seen as a
sector in which the state should maintain control and where foreign participation
should be carefully circumscribed, if not excluded altogether.
Some deregulation
and market
opening took place
in EE5 countries
While the EE5 countries have not embraced the free market model to the same
extent as the OECD countries, there has been an unmistakable movement toward
greater reliance on market mechanisms. Virtually every EE5 has experienced at
least one financial crisis in the past two decades that has necessitated large
public outlays and set back economic and social progress. The EE5 countries
concluded that these crises can be attributed in part to excessive government
intervention that left financial markets rigid, vulnerable and unable to contribute
to efficient allocation of real resources. Moreover the EE5 countries are aware
that financial modernisation has brought considerable benefits, such as increased
access by SMEs to financing, increased access by the general public to
affordable housing finance and improved possibilities for the general public to
invest.
As incomes rise and the burden of providing retirement income shifts from
families and governments to individuals, more sophisticated forms of
institutional investment and more flexible capital markets will be needed. Thus,
virtually all EE5 countries have deregulated their financial systems to a
significant degree and permitted the introduction of some innovative financial
instruments. All have opened their markets to a higher degree of foreign
participation.
On balance, the EE5 countries are likely persevere in their cautious and gradual
pattern of modernisation and liberalisation.
Crises led EE5
countries to take a
more cautious
approach to
deregulation and
liberalisation
At the same time, one of the lessons that EE5 countries have drawn from the
crises of the past few decades is that international financial markets can be
unpredictable and destabilising and that individual countries are well advised to
take measures to insulate themselves from their potential adverse impact. For
example, many observers concluded that among the major causes of the Asian
crisis of 1997 were weaknesses, distortions and structural rigidities in the
banking and corporate sectors of Asian countries and that part of the solution
was to align practices in Asian countries with global standards. Asian countries

– ©
essentially accepted this proposition but most also concluded that the crisis had
exposed the risks of excess vulnerabilities to destabilising trends in the global
financial system. As a result, most Asian counties have made it a point to build
up their international reserves to the point that their vulnerability to instability in
the world financial system is lessened significantly. They are also more likely to
consider seriously the risks of easing controls on international capital flows or in
allowing financial institutions to experiment with new instruments or techniques.
4. Institutional structures
The degree of
government
ownership of
financial
institutions
remains
considerably
higher in EE5 than
in OECD countries
Financial structures in almost all EE5 countries differ noticeably from those of
OECD countries; the exception would be South Africa where structures are
closer to those in OECD than to other EE5 countries. As can be seen in Figure 8,
the degree of government ownership of financial institutions remains
considerably higher than in OECD countries. In most EE5 countries the state
retains a strong hand in setting interest rates, allocating credit and otherwise
guiding economic activity. Many EE5 countries believe that the presence of a
large state owned banking sector with some official guidance over credit
allocation helps the authorities in reaching industrial policy goals and in
reaching underserved regions and communities. Some EE5 countries believe that
the presence of state owned-banks attenuated the impact of the crisis on the
domestic financial system during the present crisis. Foreign controlled
institutions are also less prominent than in OECD countries. Furthermore,
financial intermediation is considerably less international as can be seen from the
relatively low share of foreign-affiliated banks in the domestic banking system
and the low volume of cross border bank lending and bond issues in EE5
countries (see Figure 9). At the same time EE5 countries have been reasonably
flexible and have been trying to introduce elements of market competition even
when banks remain under government ownership. In most EE5 countries, many
public banks have been “corporatised” and often now accept private investors,
including foreign investors, as minority shareholders.
Figure 8. Bank ownership
The fraction of the banking systems loans are in banks that are:
0
10
20
30
40
50
60
70
80
Brazil China India Indonesia South Africa
50% or more government owned as of year-end 2005
50% or more foreign owned as of year-end 2005
Sources: World Bank, Financial Development and Structure Database.

– ©
Figure 9. Internationalisation of EE5 financial markets
(a) Loans from non resident banks outstanding / GDP (b) International debt issues /GDP
0%
5%
10%
15%
20%
25%
30%
35%
40%
Brazil China India Indonesia South Africa
G7 Accession countries
Low income OECD
countries
OECD average
2000 2005 2007
0%
5%
10%
15%
20%
25%
30%
35%
40%
45%
50%
Brazil China India Indonesia South Africa
G7 Accession countries
Low income OECD
countries
OECD average
2000 2005 2007
Note: Country groups show GDP-weighted averages of the respective variable. For definitions of country groups see footnote to Figure 5.
Source: World Bank, Financial Development and Structure Database; People’s Bank of China; and OECD.
The diverse
institutional
frameworks in
OECD countries
are converging
The institutional framework in which financial activity should be undertaken has
often been an issue among OECD counties as well as non- members. In the past,
some OECD countries such as Canada, Japan and the United States imposed
strict prohibitions on banks‟ capital markets activities, while most European
countries, such as Germany, operated under a “universal banking” system. At
present significant convergence is occurring within OECD countries where the
dominant model is to allow banks to engage in a wide range of securities
business but to operate through separate subsidiaries for each line of activity, and
to build “firewalls” to minimise conflicts of interest and the risks of contagion.
In more recent years, some OECD countries have experienced the growth of
“financial conglomerates” which in addition to banking and capital markets
activity engage in insurance and other financial services.
EE5 are more
cautious than
OECD countries
regarding the
formation of
complex financial
groups
The EE5 countries are generally more cautious than OECD countries regarding
the formation of complex financial groups (see Table 1). China and Indonesia
have restrictions on banks‟ securities and insurance business. The other EE5
countries have a system that is similar to that to that of OECD countries, with
banks allowed engaging in securities and insurance, but with requirements for
such business to be conducted through separate subsidiaries, with requirements
for additional prudential safeguards. China and South Africa do not have formal
deposit insurance schemes, but the introduction of deposit insurance is under
consideration in both countries.
Table 1. Deposit Insurance in EE5 Countries
Is there an explicit deposit insurance protection
system?
Brazil Yes
China No
India Yes
Indonesia Yes
South Africa No
Source: World Bank, Bank Regulation and Supervision Database.

– ©
5. Improved balance sheet quality and risk management
EE5 countries
have made their
financial systems
more resilient
One area in which the EE5 countries have made considerable strides is in their
determination to make their financial systems more prudentially sound. In the
past, many EE5 countries had effectively reduced the role of banks to that of
supporting national industrial policies (in the extreme case of pre-1980 China the
banking system was merely a passive appendage of the central planning
mechanism). As a result, the prudential soundness of domestic financial
institutions often was not an especially large consideration for policy makers and
several EE5 countries experienced systemic crises in their financial systems.
Usually, these crises have forced governments to expend large sums on bank
rehabilitation. Furthermore, the turbulence in international markets has
persuaded most EE5 countries that the improvement of domestic supervisory
practices should be a high priority. Once again, the supervisory practices of
South Africa were closer to those of OECD countries than to other EE5
countries.
EE5 banks are
now to observe
more stringent
standards of risk
management than
in the past
Awareness has grown of the need to require financial institutions, particularly
banks, to observe more stringent standards of risk management and to improve
prudential ratios. The capability of bank supervision has improved markedly and
the political authorities now give much greater weight to considerations of
systemic stability. Bank governance paradigms have been shifted so that bank
management are expected to produce adequate earnings and to enforce credit
discipline. These efforts are now reflected in higher profitability and
significantly improved balance sheet quality in the EE5 counties, such as
declining ratios of nonperforming loans (NPLs) to total loans and higher capital
adequacy ratios (see Figures 10 and 11).
Figure 10. Profitability of banks
(a) Net Interest Margin (b) Bank ROA
0%
2%
4%
6%
8%
10%
12%
14%
16%
Brazil China India Indonesia South Africa
G7 Accession countries
Low income OECD
countries
OECD average
2000 2005 2007
-2%
-1%
0%
1%
2%
3%
4%
Brazil China India Indonesia South Africa
G7 Accession countries
Low income OECD
countries
OECD average
2000 2005 2007
Note: Country groups show GDP-weighted averages of the respective variable. For definitions of country groups see footnote to Figure 5.
Sources: World Bank, Financial Development and Structure Database; People’s Bank of China; and OECD.

– ©
Figure 11. Key prudential ratios
(a) Bank non-performing loans / total loans (b) Bank provisions / non-performing loans
0%
5%
10%
15%
20%
25%
Brazil China India Indonesia South Africa
G7 Accession countries
Low income OECD
countries
OECD average
2003 2005 2008
0%
20%
40%
60%
80%
100%
120%
140%
160%
180%
Brazil China India Indonesia South Africa
G7 Accession countries
Low income OECD
countries
OECD average
2003 2005 2008
(c) Capital adequacy (bank regulatory capital / risk-weighted assets)
(d) Bank capital / total assets
-10%
-5%
0%
5%
10%
15%
20%
25%
Brazil China India Indonesia South Africa
G7 Accession countries
Low income OECD
countries
OECD average
2003 2005 2008
0%
2%
4%
6%
8%
10%
12%
14%
16%
Brazil China India Indonesia South Africa
G7 Accession countries
Low income OECD
countries
OECD average
2003 2005 2007
Note: Country groups show GDP-weighted averages of the respective variable. For definitions of country groups see footnote to Figure 5.
Sources: IMF (2008).
6. Financial supervision and systemic stability
In OECD
countries, there
has been a trend
toward supervision
by a single entity
There is still a substantial divergence of opinion among OECD countries
concerning the optimal institutional structure for financial supervision and on the
role of the central bank in financial supervision. Most OECD countries that have
engaged in systemic reassessments of their institutional structures have opted to
consolidate responsibility for supervision of financial activity (banking,
securities and insurance) inside a single entity. The trend toward consolidation
reflects two basic considerations: (i) private institutions now offer all of these
activities within complex groups; and (ii) due to financial innovation, many
products have been developed that do not fit into the traditional categories of
financial activity. In order to prevent contagion, ensure a level playing field and
discourage regulatory arbitrage there has been a trend toward supervision by a
single entity.
...but despite this
trend most OECD
countries still have
separate
supervisors
Despite this trend, most OECD countries still have separate supervisors for each
of these activities. The main argument for separation of these activities is that
banking, securities and insurance business are fundamentally different and
therefore require different supervisors. In most such cases the central bank
retains the responsibility for the supervision of banks as well as a general
responsibility for systemic stability. In these cases, communication and co-

– ©
operation among supervisors rather than a unified supervisory institution is seen
as the best response to changes in institutions and products. Finally, it should be
mentioned that the Netherlands and Australia have settled on a “twin peaks”
model where there are two supervisors with a mandate for the oversight of all
institutions, one with responsibility for prudential issues and the other for
“conduct of business” oversight. Most countries, both OECD Members and non-
Members, are likely to consider further their institutional structure for financial
supervision in the light of their experiences during the post 2007 financial crisis.
No EE5 country
has adopted the
unified financial
supervisor model
As Table 2 shows, the situation is somewhat simpler among EE5 countries. No
country has adopted the unified financial supervisor model, each having separate
supervisors for banking, securities and insurance. Indonesia, however, is
seriously considering adoption of the unified supervisor. In all EE5 countries
except China, the central bank is responsible for banking supervision. In China,
there is a specialised China Banking Regulatory Commission that is separate
from the central bank.
Table 2. Institutional structure of financial supervision
Body/agency that supervises banks
Brazil Central Bank
China China Banking Regulatory Commission
India Central Bank
Indonesia Central Bank
South Africa Central Bank
Source: World Bank, Bank Regulation and Supervision Database.
7. A New Financial Landscape Emerging?
EE5 countries are
gaining importance
in world financial
markets
As already visible in the leading role of the G-20, the events of the past three
years will in all probability enhance the role of EE5 countries in the global
allocation of capital and in global decision-making. Non-traditional financial
players, with the EE5 countries in the lead, were already gaining importance
in world financial markets as a result of their high rates of growth and their
rising shares of world trade and investment. Meanwhile, global payments
imbalances have been leading to the accumulation of investible assets in
certain non-OECD countries. The events of the past three years should
accelerate this trend.
Financial powers are
shifting to new
“power brokers”
Some recent analyses have predicted the emergence of “new power brokers”
consisting of central banks and sovereign wealth funds from Asian countries
and oil exporters as well as hedge funds and private equity funds.5 Since the
report was published in 2007, the 2009 update shows the prospects for the
latter two categories of investors have dimmed on balance but the position of
sovereign wealth funds and central banks from non-OECD countries has
become larger. In addition, the relative weight of financial institutions has
shifted dramatically among geographic regions in the last three years. At this
time the three largest banks in the world measured by capitalisation are

– ©
domiciled in the Peoples‟ Republic of China. More generally, institutions
outside OECD countries are likely to become bigger players in financial
markets. The emergence of large asset holdings, rising shares of world equity
and bond markets and the emergence of powerful financial institutions in new
regions of the world are likely to influence the contours of the world financial
system in years to come.
IV. Brazil
Overview Development of the Brazilian financial system has been heavily influenced by
the period of inflation, indexation and directed credit that began in the 1960s.
The Real plan of 1994 included disinflation as well as reform and partial
deregulation of the financial system. A major transformation occurred in patterns
of bank ownership with private and foreign banks gaining market share.
However, official banks still account for about 45% of bank assets. Banking
supervisors have been very cautious in authorising new financial instruments,
especially for banks, and enforce rigorous prudential standards. Due to resolute
restructuring programs and tightened supervision banks are profitable and well
capitalised. The country has a thriving equity market, and the bond market is
deeper than in any other EE5 country.
1. Banking
A long period of
high inflation,
indexing and
directed credit had
expanded and
distorted the
banking system…
From the late 1950s through the mid-1990s the economy experienced high
inflation, indexing and directed credit. In this environment the banking system
expanded considerably but also became rather distorted. Inflation enabled
Brazilian banks to collect easy revenues by paying a negative or low real interest
rate on the excess of demand deposits over reserve requirements. Real interest
rates were often negative, meaning that for those borrowers able to obtain loans,
the risk of default was low. Some analysts estimate that about half of Brazilian
bank revenues were attributable to the ability to exploit the distortions of
inflation.
…with public
sector banks
becoming more
important…
Brazil has evolved a distinctive blend of public and private bank ownership.
Public sector banks, which had existed for many decades, expanded more rapidly
than private banks during the period of high inflation. On the eve of the “Real”
economic stabilisation programme in December 1993, government banks were
responsible for over 55% of lending and private institutions for about 45%.
Almost all longer term lending came from government banks.
…also in financing
government
projects…
In spite of their importance in the financial system, government banks had been
in constant conflict between maintaining their financial viability and their social
and political goals. In many cases, states were able to use the state banks as a
means of supporting employment in state entities and/or financing state-favoured
infrastructure projects.
…but surviving,
however, on
public support
Despite recurrent crises from the 1970s through the 1990s, official banks
survived due to substantial volume of low-cost financing from the public sector,
inflation-driven earnings on float, periodic central bank restructuring efforts, and
regulatory forbearance regarding their loans and investment portfolios.
Disinflation led to
a sharp decline in
The Real Plan of July 1994 was a clear success in reducing inflation, which fell
from four digits in 1988-93 to low single digits by the late 1990s. With the

– ©
banks‟ prudential
strength…
removal of their ability to profit from the inflationary environment, Brazilian
banks experienced a sharp decline in prudential strength.
…and soaring
NPLs…
When the central bank tightened money and credit conditions in the second half
of 1994, NPLs began to soar. Past due loans rose from 6% of total loans in 1994
to 16% in 1996. With the imminent insolvency of some big private banks, a
bailout mechanism was put in place in November 1995.
…but a major
bank restructuring
and privatisations
transformed the
banking sector…
At that point the authorities launched a major bank restructuring that would
eventually lead to a transformation of ownership structures and a realignment of
banking practice. A large number of public banks were privatised with foreign
interests eligible to participate in the equity of the privatised entity. With the
reform, private domestic banks managed to keep their share of total banking
assets while foreign controlled banks increased their share from 5% at the time
of the Real Plan to 25% at present. The share of banks owned by Brazilian states
declined sharply but the share of federally owned banks declined only
marginally.
..and enhanced
competition
The reforms in ownership introduced in the late 1990s led to heightened
competition between various categories of banks. Due to exits and consolidation,
the number of commercial banks has been declining since the Real plan. By
most measures the degree of concentration in banking remained rather low in
this period, but concentration increased significantly in 2008 as a result of major
mergers. At the end of the year, the top five banks in total accounted for 75% of
assets.
Credit to the
private sector
contracted and its
growth remained
sluggish
After the introduction of the Real Plan, credit to the private sector contracted and
credit growth remained sluggish for several years after 2000. In fact, the
loan/deposit ratio and the ratio of domestic credit (and especially credit to the
private sector) to GDP are still very low compared to other countries. Securities
and credit to state entities constitute a comparatively large share of bank
portfolios. Moreover, the central bank has maintained high reserve requirements
on bank deposits, often receiving criticism for stalling credit expansion and
growth.
Lending rates and
net interest
margins are very
high by
international
comparison
One of the striking features of banking in Brazil is that rates charged to
borrowers and net interest margin are much higher than in other EE5 countries
and in other Latin American countries. Official and academic analysts have been
seeking to explain the persistence of high credit spreads in the face of partial
deregulation and increased competition, but no definitive explanation has been
given. For example, it was suggested that poor information flows and difficulties
of clients switching banks may be part of the explanation.6 Costs and expense
ratios appear to be in line with those in other countries. By other measures of
profitability (e.g. ROA and ROE), Brazilian banks appear to be only slightly
more profitable than other EE5 countries.
A distinctive mix of
financial policies
has enabled the
country to weather
the post-2007
financial crisis
reasonably well
The Brazilian authorities believe that their distinctive mix of financial policies
has enabled the country to weather the post-2007 financial crisis reasonably
well. State-owned banks maintained a strong pace of credit growth, offsetting the
slowdown in private-sector bank loans. Given high reserve requirements, the
Central Bank was able to provide a stimulus by cutting its reserve requirements.
The Central Bank also slashed local interest rates by 500 basis points to their
lowest level in several decades and made credit lines directly available to the
corporate sector.

– ©
Brazil has been
making a
determined effort
to enforce sound
supervisory
practices
Due to earlier banking and balance of payments crises, Brazil has been making a
determined effort to enforce sound supervisory practices. The central bank,
which is responsible for banking supervision, has been very proactive in assuring
that banks observe cautious risk management practices. The Minimum Capital
Ratio has been set at 11%, rather than the 8% suggested in the Basel Accord. In
fact, Brazilian banks maintain risk-weighted CARs of about 17%. Brazil also has
tough regulation limiting the inclusion of hybrid securities and subordinated debt
in capital.
Limits and
requirements are
comprehensive…
All limits and requirements are applied in consolidated terms and are meant to
capture off-balance sheet exposures. Banks face strict transparency requirements
with respect to their operations involving OTC derivatives and other exotic
instruments. Over-the-counter derivatives that have a supervised entity as
counterparty have to be registered and monitored. Banks must perform
sensitivity analyses of these instruments and must satisfy the central bank that
risk is accurately assessed and provisioning is adequate.
…and forward
looking, with
careful evaluation
of financial
innovations and
risk monitoring
Banks‟ loan classification practices must be forward looking, measuring not only
delinquency but the risk of eventual delay in payment. Reserves must cover all
debt payments past due 60 days. The central bank does not use credit rating
agencies' evaluation of assets but adheres to its own rules regarding asset
classification. The central bank conducts stress tests on each bank and issues
ratings for the banks. The central bank also has the authority to monitor
operations of investment firms that could have an impact on systemic liquidity.
NPLs have been
reduced steadily
Due to strict supervisory norms NPLs have been reduced steadily since the
banking crises of the 1990s, even though these ratios are still somewhat above
the level of other EE5 countries. At the same time, banks‟ provisions against
NPLs are almost twice the levels of NPLs.
2. Institutional investors
Institutional
investors‟ assets
represent a fairly
large share of GDP
One of the underpinnings of the capital markets is a broad community of
institutional investors. Institutional investors‟ assets represent a larger share of
GDP in Brazil than in any other EE5 country except South Africa. As a result of
pension reform, pension funds assets have been rising since the early 1990s and
were equivalent to 16% of GDP at the end of 2005. Brazilian pension funds hold
lower shares of their portfolios in government bonds than in most emerging
markets and are major investors in equity. The CIS sector is very well
developed, with assets equal to some 28% of GDP. By contrast, the assets of
insurance companies represent only some 4% of GDP (2005 figures for all).
3. Capital markets
Brazil has the
largest bond
market as a share
of GDP among
EE5 countries
Although the Brazilian bond market is smaller than that of most OECD
countries, Brazil has the largest bond market as a share of GDP among EE5
countries and also the largest in Latin America. The market is dominated by
government bonds. The Brazilian federal public debt market is one of the most
liquid and sophisticated among emerging markets, with a wide range of debt
instruments (fixed-rate, floating-rate and inflation-indexed bonds).

– ©
The indexed
market is well
developed, and the
securities
settlement system
well advanced
During the period of prolonged high inflation, a market in indexed instruments
developed. The market experienced periods of expansion and contraction, often
related to changes in the government‟s policy on indexation. In 1979 the central
bank initiated the SELIC settlement and custody system leading to a completely
paperless treasury securities market that, with continued upgrading, is still in
operation today.7
The Treasury
market is modern
and liquid
By the early 1990‟s, all the main treasury debt instruments currently available
had been introduced and it began to take on many of the characteristics of a
modern liquid market.8 All Treasury instruments can be used as collateral in repo
transactions with the Central Bank. The Treasury has established a regular
auction calendar. Currently, there are 12 primary dealers and 10 secondary
(specialist) dealers. Federal bonds can be traded over the counter by telephone or
electronically through screens. All transactions are registered with SELIC. Most
bonds are linked to the overnight SELIC interest rate but the central government
started to increase the issues of non-indexed fixed interest rate bonds in 2005.
Issues of state government debt have contracted after some local government
bonds defaulted.
Dollar-linked and
floating-rate
securities have
declined, with fixed
rate securities
rising and maturity
lengthening
As the market has matured, issuance of dollar-linked bonds has declined
drastically. At the same time, the National Treasury initiated a process of gradual
replacement of floating-rate for fixed rate securities, and their volume has been
rising significantly since 2003. There also has been a gradual extension of the
maturity structure of government debt in local currency. This has been achieved
in part through a shift from short-term to fixed rate bonds and through a
lengthening of the maturity of fixed rate bonds. Average maturities of debt have
also been rising, as reflected by its 20-year global bond issues. The average
maturity of new central government debt in Brazil stood at 56 months at the end
of 2006.
Global bonds in
local currency
have been issued
increasingly
during the past few
years
During the last few years, Brazilian public and corporate entities have been
issuing global bonds (i.e. bonds simultaneously issued to domestic and
international investors) denominated in local currency, an innovation pioneered
by the Inter-American Development Bank. In September 2005, the Brazilian
government issued BRL 3.4 billion (USD1.5 billion) of global bonds with a
maturity of 10 years and a 12.5% coupon. The issue was oversubscribed several
times and the distribution was purchased by investors from Europe and the
United States. The issue contributed to extend the maturity of the yield curve for
real-denominated fixed rate government debt, which had hitherto been limited to
seven years in the domestic market. In May 2007, Brazil issued 20-year real-
denominated global bonds, securing the lowest-ever yield for real-denominated
debt securities. These securities have long maturities, they are not indexed to
inflation and offer a fixed interest rate. Both inflation and exchange rate risk are
thus transferred to investors. While denominated in Brazilian currency, both
interest and principal are settled in US dollars, freeing investors from any risks
associated with exchange controls. Brazilian global bonds fall under the laws of
the state of New York, enhancing their attractiveness to international investors.
Private bond
market activity
remains at a lower
level
The development of the private bond markets paralleled that of the public bond
market, but activity remains at a much lower level. A law passed in 1965
enabled the indexing of private bonds to inflation. In 1976 several structural
reforms were implemented. The Securities Commission (CVM) was created as

– ©
the agency responsible for capital markets regulation and several types of bonds
were authorised including bonds with or without collateral, subordinated bonds,
bonds with warrants and those in foreign currency etc. Although much of the
infrastructure of a corporate bond market was put in place, due to the
attractiveness and availability of subsidised financing as well as taxation issues,
bond market finance was not an attractive source of finance for the corporate
sector. After the Real plan in 1994, the Brazilian corporate bond market entered
its current phase. In 2003 the CVM issued new rules that further facilitated
corporate bond issuance while a simplified standard bond indenture and tax law
changes to improve liquidity in the secondary market are being discussed.
More private
global bonds are
being issued in
local currency
Initially, most private sector bonds were issued in foreign currency. However, at
the end of 2004, a few Brazilian private financial institutions began issuing
external debt denominated in the local currency. In 2005, more major financial
institutions issued global bonds in local currency. Besides private financial
institutions, a few corporations, such as an electricity company (Eletropaulo) and
a telecommunications company (Telemar) have also issued foreign bond in local
currency.
Securitisation,
activity began to
take off after 2002,
mainly in ABS,
much less in MBS
Securitisation has made substantial progress in. Two special kinds of
investments instrument are used for MBS and ABS.9 Following reforms in the
legal and regulatory framework for securitisation, activity began to take off after
2002. The volume of issuance rose from less than USD 1 billion equivalent in
2001 to more than USD 6 billion equivalent in 2006. Activity has centred mainly
on the ABS sector, where securitisation has included a wide variety of collateral,
such as leases and corporate receivables as well as more traditional assets such
as credit cards and auto loans. The MBS sector has not been very dynamic, with
securitisation of residential mortgages accounting for only about 2% of the total.
The Brazilian
equities market is
well developed
Brazil has an equities market that is huge by most measures, although smaller
proportionally than those of China, India and South Africa. On 8 May 2008, the
São Paulo Stock Exchange (Bovespa) and the Brazilian Mercantile and Futures
Exchange (BM&F) merged, creating the new BM&F Bovespa, the main
platform for equities trading10
. Bovespa operates under the supervision of the
CVM.11
Since the 1960s, it has constantly evolved with the help of technology
such as the introduction of computer-based systems, mobile phones and the
internet. As a result of a 2008 stock swap, Chicago's CME Group owns an
approximately 5% stake in BM&F Bovespa, and in turn, BM&F Bovespa owns a
1.7% stake in CME Group. Among its broad range of trading products, the new
exchange offers equities, bonds, indices, interest rates and commodities as well
as foreign exchange futures and spot contracts. The BM&F Bovespa is linked to
all Brazilian stock exchanges, including Rio de Janeiro's BVRJ which trades in
government bonds and currencies. Individual investors and institutions (pension
funds and CIS) each account for about 20% of trading and foreign investors
account for some 35%. A special board for smaller and newer companies was
recently formed.
Macroeconomic
stabilisation
brought a wave of
IPOs
The amount of listed equity stagnated for a prolonged period as the IPO‟s market
was not attractive or available during the volatile macroeconomic situation and
unstable interest rate environment of the inflationary period. Few companies
chose the stock market to raise new capital. With the improvement of the
macroeconomic scenario, increased global liquidity and reduction of interest
rates as well as structural reforms in the market itself, a wave of IPOs has been

– ©
occurring. Between 2004 and June 2008 there were 110 IPOs which raised USD
88.5 billion, compared to market capitalisation of USD 592 billion equivalents in
2008.
V. China
Overview With a very high savings rate, China has one of the largest pools of assets in the
world. The banking system is undergoing a profound change as a result of
reforms that have transformed ownership of the four large state-owned banks
through corporatisation, ownership diversification and public listing.
Competition between state-owned banks and other banks has helped improve
efficiency. Activities that hardly existed a decade ago, notably housing finance
and consumer credit, are growing very rapidly. Banks have made considerable
progress increasing profitability and improving balance sheet quality. Bank„s
risk management and prudential ratios have improved substantially over the past
five years and banks are offering a much wider variety products and services
than they have in the past
Chinese equity markets are among the largest and most heavily traded in the
world. The lack of strong institutional investors, dominance of listings by state-
owned enterprises and small presence of foreign investors make the Chinese
market unique. With very large banks and capital markets, China will be one of
the world‟s largest financial markets in coming years.
1. Banking
Authorities have
put in place a
strategy to improve
the banking
system, but
unresolved issues
remain
Since the 1990s, the banks have been undergoing a rapid evolution from their
traditional role of allocating credit in accordance with government directives.
Competition within the banking sector has increased. The authorities have put in
place a coherent and comprehensive strategy for further improvement of the
banking system. However, further efforts will be needed before banks can
adequately serve the needs of the increasingly important private businesses and
the rural economy. A number of unresolved issues, notably the status of the
state-owned commercial banks and the scope for private ownership in the
banking system will also need to be addressed.
State-owned
Commercial Banks
(SOCBs) largely
dominate the three
other segments of
the commercial
banking system
The commercial banking system consists of the four segments (1) four large
State-owned Commercial Banks (SOCBs), (2) the twelve nationwide Joint-Stock
Banks (JSBs), (3) city commercial banks (CCBs) and (4) credit co-operatives.
The share of the four SOCBs in total assets has been declining in recent years
and now amounts to slightly more than half of total bank assets, with the share of
all three other categories of banks rising. One distinguishing feature of China‟s
banking landscape is pervasive state ownership and control. The SOCBs are
majority-owned by the central government and, with some very few exceptions,
JSBs and CCBs are majority-owned or controlled by local governments and/or
SOEs. There are an extremely small number of purely private banks, and the
market share of foreign banks is still quite small.
On balance the Chinese authorities believe that a continuing large government
presence in the banking system has enhanced stability.

– ©
Nearly all bank
credit went to state-
owned enterprises
Reflecting the country‟s history as a centrally planned economy, banks
traditionally had little autonomy in credit decisions and nearly all bank credit
went to state-owned enterprises (SOEs). In addition to the central government,
local governments have traditionally exercised considerable influence over the
lending policies of banks in their areas.
The banking
system has
changed
considerably and
lending standards
have improved
As the country had progressively sought to introduce elements of the market
economy, China‟s banking system has changed considerably since the 1990s,
with the pace of change accelerating after 2004. Since 1996, with the creation of
the three policy banks and subsequent abolition of the credit plan, commercial
banks have in principle been free to make loans purely on the basis of
commercial criteria and it is generally agreed that lending standards have
improved considerably. The authorities have taken a number of steps to reduce
interference by local governments in operations of bank branches.12
Changing banks to
become more
businesslike has
proven difficult
Despite the government‟s announced policy of requiring banks to act in more
businesslike ways, it has proven difficult to change bank behaviour. Resolving
the problems has been made all the more difficult by the weak condition of the
banks‟ main borrowers, the state-owned enterprises (SOEs) which often
depended upon bank credit for survival and which the authorities hesitated to
close for fear of social unrest.
In 1998-99, a
significant effort to
strengthen
weakened banks‟
balance sheets was
undertaken…
By the late 1990s, much of China‟s banking sector was effectively insolvent. A
very large share of the loans of the SOCBs had become non-performing
(although they were not yet fully recognised as such at that time) and most city
commercial banks, RCCs and joint-stock banks had high NPL ratios. Banks
were inadequately capitalised and had low profitability ratios. In 1998-99, a
significant effort to strengthen SOCB balance sheets was undertaken with the
subsidised sale of a large portion of NPLs to government-owned asset
management companies (AMCs). Bank management was made, at least
theoretically, responsible for any new NPLs.
…however with
mixed results
Despite expenditure on restructuring amounting to about 16% of GDP, the
results were mixed. On the positive side, the financial conditions of the JSBs
improved markedly, and the SOCBs and JSBs implemented a more rigorous loan
classification system. Practices regarding transparency and disclosure, likewise,
showed a marked improvement. However, NPLs remaining in the SOCBs turned
out to exceed those that were carved out in 1999 and by official estimates were
still 18% of total loans at the end of 2003. SOCBs could make very little
headway in reducing the level of NPLs or in preventing new NPLs from
emerging, due to the low level of their own profits and persistent problems in
autonomy in credit allocation. A certain reduction in the ratio of NPLs to total
loans at SOCBs was achieved between 1999 and 2004 but this was mainly due to
increases in loans.13
Reforms in 2004
were based on
upgrading
supervision,
ownership
diversification,
public listing and
expanded foreign
presence
In 2004, the authorities accelerated their effort to align practices in the banking
system with best international practices. In addition to the expenditure of
additional funds to strengthen bank balance sheets, this reform was based upon
an upgrading of supervision, ownership diversification, public listing and
expanded foreign presence. These measures were designed to subject all banks
to higher standards of transparency and disclosure, with more intense scrutiny by
banking counterparties, investment analysts, institutional investors and rating
agencies. The change in ownership and governance practices was aimed at
focusing bank management on profitability and prudential soundness.

– ©
Responsibility for
bank supervision
was transferred to
CBRC
Measures to improve bank supervision were accelerated. Responsibility for bank
supervision was transferred from the central bank to a newly formed agency, the
China Banking Regulatory Commission (CBRC) and a series of laws and
regulations to improve supervision, based on international practices and global
standards, was enacted. In ensuing years, the CSRC imposed a stringent
supervisory regime. Capital requirements were set above the international norm,
with strict rules discouraging the use of tier 2 capital. At present more than 80%
of bank capital is tier 1. The CSRC has also insisted that banks demonstrate an
in-depth knowledge of any new instruments that are introduced.
Special entity
(Huijin) to assume
state‟s ownership
interest in SOCBs
In December 2003 a special entity (Huijin) was set up to assume the state‟s
ownership interest in the SOCBs. The SOCBs were first transformed into joint
stock companies with the state as the sole owner and received cash injections to
increase capital to adequate levels and build reserves against NPLs.
SOCBs were
converted into
corporations and
ownership was
diversified
The first step was to convert SOCBs into corporations. (The JSBs and CCBs had
been legally incorporated since the 1990s.) In 2004, the Bank of China and
China Construction Bank became the first of the SOCB to be transformed into
corporate form, the other two SOCBs were subsequently transformed. The
second step was to diversify the ownership of the banks, with new owners to
include private interests, to be followed at least in the case of the larger banks,
by listing on the stock markets. This second element is regarded as critical to
ensuring that financial institutions remain focused on commercial objectives.
The JSBs and many of the CCBs already have multiple investors, although they
are for the most part still state controlled entities. The SOCBs have become
much less specialised and more competitive with one another and with the JSBs.
Banks have expanded operations in housing finance, consumer finance and asset
management. The CSRC generally requires banks to set up separate subsidiaries
when engaging in activities not strictly related to commercial banking. Banks
may also offer insurance through specialised subsidiaries.
Bank performance
was to be improved
by better
governance
structures and
subjecting
companies to
market discipline
The strategy to improve the performance of banks was to change the ownership
and endow them with governance structures (notably boards of directors and/or
supervisory boards and the shareholder‟s general assembly) that align
management incentives with owner‟s interest; and subject the companies to
market discipline over their performance via a combination of stock market
listing, bond issuance, and monitoring by lenders and shareholders. The
authorities placed great hopes on the introduction of strategic investors,
particularly foreign strategic investors, as a means of further strengthening the
commercial orientation of the institutions as well as bringing in new business
techniques and other expertise.
Many major
international
banks have become
strategic investors
in corporatised
SOCBs
Although the problems of these banks were widely recognised, major
international banks believe that China is likely to be a major player in
international finance and thus it is important to have a presence in the market.
Consequently many major banks have become strategic investors in the
corporatised SOCBs. The SOCBs will select their own management, which will
be accountable for meeting the most commonly used benchmarks for earnings
and balance sheet quality as well as targets for improvement in internal
governance. Public listing and a broad investor base will lead to improved
monitoring to protect shareholder value. The SOCBs as well as JSBs have listed
on both Chinese markets and international markets. These have been among the

– ©
largest IPOs ever launched anywhere. This has enabled them to raise large
volumes of capital and to include institutional investors from around the world
into their capital structures.
Heightened
competition was
permitted between
SOCBs and other
domestic banks,
with JSBs gaining
market share
Heightened competition was permitted between the SOCBs and other kinds of
domestic banks. The JSBs have already been gaining market share in recent
years. To make further gains, the JSBs were able to raise capital by (i) domestic
or international equity; (ii) issues of subordinated debt; and/or (iii) strategic
investments by foreign banks. The CCBs were also opened to strategic
investments by foreign banks. Finally, an expanded foreign presence would be
encouraged partly linked to Chinese WTO membership and partly linked to a
desire to benefit from foreign competition.
Substantial
progress was made
in risk monitoring
and
management…
Substantial progress was made in modernising internal systems for credit
assessment, loan monitoring, and risk management within the SOCBs, JSBs, and
some CCBs. These include the separation of loan origination and assessment; the
introduction of objective criteria and procedures for assessing creditworthiness;
and the adoption of a new loan classification system in line with international
practices. At least in principle, new loans as well as loan extensions are granted
only to borrowers with a good credit record and based on standard
creditworthiness criteria such as cash flow and business prospects. The new
system incorporates forward looking indicators relating to a borrower‟s ability to
repay and requires reassessment in the event of a significant change in those
conditions.
…but political
considerations
continue to play a
role in lending
decisions
Efforts have been made to reduce interference by local governments in lending
decisions by moving the authority to grant large loans to higher levels. However,
the extent to which lending decisions by the banks are driven by commercial
criteria is uncertain. Improvements in lending decision frameworks have been
made but there is evidence indicating that political considerations continue to
play a significant role.
The prudential
quality of banks
has improved, and
reforms help
prepare the
banking system for
its next phase of
modernisation
Overall, efforts to improve the prudential quality of banks have been reflected in
improving ratios. Profitability has improved. Banks‟ ROA are still somewhat
low in comparison to other EE5 countries, but net interest margin and ROE are
in line with other EE5 countries. NPL ratios have declined substantially while
provisions now exceed NPLs. CARs, which had been as low as 4% in 2004, are
now approaching international norms. There is virtually no one who believes
that the measures to date are sufficient to cure the problems of the Chinese
banking system. At the same time the measures taken are bold and leave the
country positioned to move on to the next phase in the modernisation of its
banking system.
2. Institutional investors
The institutional
investor sector is
still rather small in
China…
The institutional investor sector is still rather small in China. The assets of all
institutional investors were equal to only 14% of GDP in 2005, the second
lowest ratio among EE5 after Indonesia. CIS and pension funds accounted for
only about 3% (each) of GDP in 2005. Nevertheless, institutional investors are
becoming significant holders of certain categories of securities. Thus, the China
Securities Regulatory Commission (CSRC) estimates that institutions now own
half of all tradable “A shares.” The assets of insurance companies were slightly
larger, representing over 8% of GDP in 2005.

– ©
…but government
has been seeking to
better promote it
The government has been seeking to promote institutional investors, recognising
that these investors tend to be able to engage in more disciplined and
professional analysis of issuers thereby encouraging a rise in standards of
disclosure and performance while reducing volatility.
The introduction
of a comprehensive
pension reform…
The development of institutional investors is also closely related to another
major policy goal, the introduction of funded pension schemes. At the end of
2007, only a small proportion of the total Chinese labour force (25.6%)
participates in any government pension scheme, fundamentally a pay as you go
(PAYG) system. Moves toward pension reform have been hesitant. Rural
workers have barely any coverage, but urban workers currently participate in a
PAYG public pension scheme. This system is partially backed by a reserve fund
(the National Social Security Fund), with some foreign investments outsourced
and managed by professional asset managers. The government has introduced a
pilot scheme for rural pensions and migrant workers that will eventually raise
coverage, but it has only just started.
…would open
immense
investment
possibilities for
domestic and
foreign asset
managers
In addition, a layer of individual DC accounts has been added to the public
pension system, but these accounts are yet to be properly funded. The assets so
far accumulated are still run by the government, but there is debate as to whether
they should be managed by professional investors in future. The government is
also encouraging the development of private, occupational pensions, known as
Enterprise Annuities, which are still mainly confined to large companies, with
the assets required to be managed by specially licensed institutional investors. If
China actually launches a comprehensive pension reform, it would in the long
run open an immense amount for domestic and foreign asset managers to invest.
3. Capital markets
China has made
impressive strides
in building a
dynamic equity
market in the past
two decades
China has made impressive strides in building a dynamic equity market in the
past two decades. As of today the ratio of market capitalisation to GDP is
comparable to that of OECD countries, even though the market is still backward
in many ways. Chinese residents have very high aggregate savings rates, but still
do not have a wide array of investment options. Small investors hold large
amounts in bank accounts and modest amounts in government bonds, but other
capital market instruments and institutional savings products are not well
developed. As a result stock market investment has captured the interest of the
public. Retail investors have tended to trade on technical factors, rumours and
real or supposed insider information, with the emphasis on short-term trading
profits. Chinese investors trade very frequently by comparison to those in other
markets
Retail investors
have been
dominating the
market, but
investment funds
are gaining share
Retail investors have been dominating the market, but the institutional investor
share of the A-share market‟s tradable shares is now just over 50 per cent. There
has also been a history of investment fund operations operating in a “grey
market”. These funds range from small community-based funds in which funds
are invested by informal networks of friends, work colleagues and relatives to
much larger and more professional operations involving solicitation from the
public.
State-owned
securities
Given the regulations separating banking and securities business in China, the
main intermediaries in the capital market (other than the government debt market

– ©
companies are the
main
intermediaries in
the capital
market…
where banks predominate) are the securities companies. Chinese securities
companies differ considerably from securities companies and investment banks
in the major world markets. All of China‟s securities companies are state-owned,
either directly or through SOEs. Chinese securities companies still depend
heavily on trading commissions as well as income from IPOs for revenue. Given
the pace of technological advance, there is likely to be consolidation in the
Chinese industry as there has been in most countries.
…with little
pressures to
produce high
quality,
independent
research
Given the lack of depth in the investor community, pressures to produce high
quality research have not been strong. The securities companies are widely
suspected of collaborating with investment funds and other market participants
to manipulate stock prices. In-house systems for risk management and
compliance are not well developed. Until recently enforcement of market
conduct rules had been sporadic.
The vast majority
of listed companies
are state-owned
enterprises (SOEs)
The vast majority of listed companies are state-owned enterprises (SOEs). Listed
companies usually belong to SOE groups that select some of their stronger
members for public listing. In practice, the separation between the listed
company and its unlisted affiliates remains incomplete. Given that SOEs have
been able to obtain large sums on capital markets and while requiring only very
limited behavioural changes on the part of listed companies, public listing has
been a very attractive proposition. Chinese companies had extremely high
valuation ratios by global comparison.
Many shares are
non-tradable
Through the middle of 2001, a listed company typically offered only about 25-
30 per cent of its total equity to public investors of all kinds (i.e. employees of
the company or retail or institutional investors).14
The remainder was held by the
state or “legal persons” and were not traded. As a result of these non-tradable
shares, the assertion that equity market capitalisation represents a high share of
GDP must be interpreted with some caution.
Reform in 2005
aimed at
eliminating the
difference between
tradable and non-
tradable shares
In April 2005 the authorities launched a reform aimed at eliminating the
difference between tradable and non-tradable shares while, at the same time
minimising market disturbance due to the huge amount of “new” supply coming
to the market. Appropriate compensation was therefore a core element of the
reform and usually holders of non-tradable shares compensated those of tradable
shares by giving out a portion of their shares at mutually agreed prices. By the
end of 2007, listed companies accounting for 98% of total market capitalisation
had at least started the reform process. During the transition mechanisms were
introduced to compensate owners of non-tradable shares for expected price
declines while formerly non-tradable shares were subject to a “lock-up period”
when they could not be traded. In addition, the authorities imposed a ban on
new IPOs to cushion the expected downward pressure on equity prices that
would result from the expansion of tradable equity.
Stellar rise of
Shanghai and
Shenzhen stock
exchanges, their
combined 2007
market cap being
Asia‟s second-
largest
China operates two stock exchanges, in Shanghai and in Shenzhen. Instruments
traded on both exchanges include shares (A shares and B shares15
), convertible
bonds, warrants, mutual funds, ETFs, corporate and government bonds, and
repos. Aside from B shares, all instruments are only denominated in local
currency. China‟s stock market experienced a first period of strong growth
between the mid- and late 1990s with the Shanghai Composite Index almost
quadrupling within five years. However, over the following five years, the index
lost half of its value. Starting in 2006, China‟s stock markets witnessed a stellar

– ©
rise and the Shanghai Composite Index doubled in both 2006 and 2007. In 2007,
the combined market capitalisation of both exchanges in Shanghai and Shenzhen
became the second-largest in Asia after Japan‟s. Average daily trading volume
reached USD 26 billion, making it one of the most actively traded markets
worldwide. The stock market started to correct in October 2007, market
capitalisation declined from 140% of GDP to around 50% as of end-2008.
Chinese stock
markets rebounded
at record pace in
2009, and IPO
activity has been
strong
In 2009, Chinese stock markets have rebounded strongly, rising over 100% since
the beginning of the year – the strongest performance in the world. The sharp
rises and falls of the stock market have been reflected in IPO activity. Domestic
IPOs were suspended for after the non-tradable shares were phased out in 2005.
Both the amounts raised as well as the number of IPOs rose sharply between
2005 and 2007. By November 2008, they had fallen below their 2005 levels. At
the same time Chinese companies (led by banks) have been making huge
overseas IPOs. In 2009, Chinese IPOs were among the highest in the world and
the combined IPOs of China and Hong Kong, China (most of which are China
related) were almost twice as high as in the United States.
The bond market is
still relatively small
although total
annual issuance
has risen eightfold
since 2000
The bond market is still relatively small although total annual issuance has risen
eightfold since 2000, reaching RMB 8 trillion at end-2007. Bonds issued in 2008
amounted to RMB 6.9 trillion, a decline of 12.7% from the level in 2007, mainly
attributable to a lower issuance of national debt.16
People‟s Bank of China (PBC)
and treasury bonds accounted for about 65% of outstanding at the end of 2008
while financial bonds (i.e. those issued by financial institutions account for about
25%. Policy bank bonds constitute more than 90% of total outstanding financial
bonds while commercial bank bonds make up only roughly 10%. Corporate
bonds (of which those from state-owned enterprises account for more than 70%
of the total) represent only 5% of outstanding bonds. All other categories of
bonds accounted for 3-4% of the total.
The OTC market
accounts for more
than 97% of total
transaction value
The secondary bond market can be divided into two main sections: the OTC
section – which can be further sub-divided into an interbank and the commercial
banks‟ OTC market – and so-called exchange-based trading. The OTC market
accounts for more than 97% of total transaction value, with the overwhelming
majority in interbank activity. In addition, the “bank counter market,” which
targets individual investors, is very small. The varieties of bond instruments
available are very limited, mainly government bonds in the form of certificate
bonds and electronic savings bonds.
Domestic
commercial banks
are the major bond
holders
Domestic commercial banks now hold close to 60% of the total amount
outstanding, but their share has been declining from around 65% in 2006, while
the share of insurance companies, CIS and other institutional investors has risen.
This trend reflects the explicit policy of broadening the investor base and making
the bond market an alternative for institutional investors. Ongoing reform of the
social security system coupled with growing sophistication and awareness on the
part of market participants will help to increase the share of institutional
investors.
4. Internationalisation of the Chinese market
Capital inflows
have increased, but
integration with
As China has liberalised rules for foreign portfolio investment, it has benefited
from rising capital inflows. On average, foreign portfolio investments have
increased by 50% annually over the past 5 years, reflected in the strong desire of

– ©
international
securities markets
is only at an early
stage
foreign investors for exposure in this dynamic market. Despite growth in recent
years, China‟s integration with international securities markets is only in an
embryonic stage. Price differentials of Chinese bonds compared to other debt
securities traded on international markets are one indicator of the relatively low
level of integration.
The international
integration of the
Chinese stock
markets has been
hampered by its
segmentation into
categories of
shares
The international integration of the Chinese stock markets has been hampered by
its segmentation into categories of shares, with different degrees of restrictions
of access for foreign investors.17
Thus, the vast majority of companies are listed
in so-called-A shares, which are listed on the Shanghai and Shenzhen exchanges
and could traditionally only be purchased by domestic investors. Foreign
institutional investors authorised under the Qualified Foreign Institutional
Investor (QFII) scheme are now allowed to buy and sell A-shares. An aggregate
ceiling of US$10 billion that all QFIIs may purchase was imposed in 2002 when
the scheme was introduced. This ceiling was raised to $30 billion at the end of
2007. Each QFII has a limit on the amount of Chinese securities that may be
purchased. At end-2008, 76 foreign financial services providers were licensed as
QFIIs. B-shares – which are denominated in USD or HKD – were originally
designed for foreign investors only, but since March 2001 domestic retail
investors are also allowed to trade them as well. A-shares are by far the most
important instrument in China‟s stock market and, since the early 2000s, the
amount raised via B-shares has been very meagre indeed. Liquidity has been
scarce over the past few years, and rumours of a possible merger of A- and B-
shares also add to lacklustre performance of the latter.
Possibilities for
foreigners to invest
have grown
With the listing of Chinese equities on foreign stock exchanges, possibilities for
foreigners to invest in the markets have grown. On balance, foreign participation
remains narrow but it is likely to expand substantially.
5. China as a global financial player
China is likely to
further increase its
weight in global
financial
markets…
The combination of large and growing markets that are now highly restricted but
are expected to open gradually implies that China is likely to further increase its
weight in global financial markets dramatically. The country has already created
banking giants that are the five largest banks in the world in terms of
capitalisation. China has the world‟s largest pool of savings. At present, the
funds tend to be held in bank deposits or in government bonds of OECD
countries, but as Chinese patterns of holding financial assets and Chinese
investment patterns change, the impact on world finance promises to be
enormous.
…but potential
growth scenarios
differ widely
Potential growth scenarios differ widely depending on the assumptions the
pattern of development. According to sensitivity analysis performed by Deutsche
Bank Research, a continuation of growth rates as observed in the years 2003
through 2008 – even taking account of corrections in the wake of the financial
crisis – suggests a further vigorous expansion that should make China one of the
dominant financial markets in the world by 2018, after the US and the EU.18
The
exact position of China in the global financial system will vary upon growth
rates of income of financial markets and of policies related to opening markets.
However, even in a scenario of modest expansion by the year 2018, China to
would attain market shares of 5%, 16% and 13% in the global bond, equity stock
and banking markets, respectively.

– ©
VI. India
Overview Between independence in the late 1940s and 1990, Indian economic policy
operated under the assumption that the state should maintain a strong hand in
making economic decisions. This policy implied high levels of government
ownership and official direction of activity as well as limitation of foreign
presence in the domestic markets. In the financial sphere, this policy was
reflected in high government ownership of banks, widespread controls on
interest rates, mandatory credit allocations and limits on foreign bank presence.
By 1990, state-owned banks controlled 90% of bank deposits. All banks, public
or private, were required to channel an extremely high proportion of funds to the
government or government targeted sectors. Interest rates were determined
administratively; credit was allocated on the basis of government policy and
approval of the Reserve Bank was required for individual loans above a certain
threshold.
In 1991, partly in response to a balance of payments crisis as well as a systemic
problem of bank solvency, a major reform of the financial system was launched.
Since the early 1990s, the financial sector has become much more diversified.
Competition has increased within the banking sector and also between different
financial sectors. However, even with the reform India has a much higher degree
of government ownership and control than OECD countries and rules restrict
foreign participation.
The Indian equity market ranks among the world‟s largest. The government
bond market is well developed, but the corporate bond market has not yet shown
much dynamism.
1. Banking
Post-1991
deregulation
reform
The post-1991 reform included recapitalisation of public sector banks and
measures to spur greater competition. Fundamental changes included the
elimination of interest rate controls, reductions in reserve and liquidity
requirements and a reduced priority sector lending.
The Reserve Bank
functions include
banking
supervision, but go
well beyond those
of central banks of
other countries
Banking supervision was considerably strengthened in 1994 with the
introduction of a Board of Financial Supervision within the Reserve Bank of
India (RBI). In addition to being the central bank and the banking supervisor, the
RBI's functions go well beyond those of central banks of other countries. For
example, the Reserve Bank has lent directly to the government. It is the owner of
several financial institutions, including State Bank of India (the largest
commercial bank in the country) as well as the National Agricultural Bank and
the National Housing Bank. (A proposal has been made that would transfer the
RBI‟s majority holding in the State Bank of India to the Ministry of Finance.)
The Reserve Bank is responsible for management of government debt. Another
proposal has been made to create a new debt management agency that would be
located in the Ministry of Finance. The RBI continues to be responsible for
foreign exchange controls, for approving independent directors for both public
and private banks, and it is the manager and regulator of the government
securities market. The RBI is the government‟s investment banker, arranging
sales of government debt and the banker for state governments.

– ©
Entry of new and
foreign banks
fostered
competition in the
banking sector, as
did deregulation of
interest rates
Competition was injected into the banking system through two channels. First,
new banks were allowed to enter the market. A dozen private Indian banks were
created, some by the transformation of existing institutions, others started from
scratch. Foreign establishment was also allowed in the market. Second, once
prudential reforms were undertaken, bank interest rates were deregulated. By
2009, controls remained in only four areas – saving deposit accounts, small loans
in priority areas, export credits and non-resident transferable rupee deposits.
Government control over credit allocation was relaxed somewhat.
The system is still
dominated by state-
owned banks…
Commercial banks traditionally provided short-term credit. Since deregulation,
however, many of the larger nationalised commercial banks have begun to target
the medium- to long-term requirements of the corporate sector and the growing
infrastructure debt market. Recently, banks have been targeting the retail sector
as well. The system is still dominated by state-owned banks, which account for
nearly 74 % of deposits and assets, but state banks have accepted private and
foreign investors as minority shareholders. Proposals have been made to further
enhance the efficiency of the banking system by including one to reducing
government ownership of public banks below its current minimum of 51%, but
reduction in that share is currently not contemplated.
… characterised by
their large branch
networks and
broad geographic
coverage
The public-sector banks are characterised by their large branch networks and
broad geographic coverage. At end-March 2008, about 45% of commercial bank
branches were located in rural regions, a further 20% in semi urban areas, and
the rest were mainly in metropolitan areas. Although they are significant in terms
of deposit gathering, rural branches tend to be unprofitable, while urban and
metropolitan branches are profitable. The Indian authorities note that the state
owned banks have fared better than private banks during the post-2007crisis.
Among public-sector banks, the State Bank of India (SBI) group, with over
13,600 branches and 54 overseas offices, is the largest bank in the country.
Competition has
increased with the
opening of the
market
Despite continued domination of public sector banks, the years since
liberalisation have seen the emergence of new private sector banks as well as the
entry of several new foreign banks. Within a decade of its formation a private
bank, the ICICI Bank, has become the second largest bank in India. Competition
has clearly increased with the opening of the market. Concentration is lower in
India than in other emerging economies with the Herfindahl index (a frequently-
used measure of concentration) for advances and assets dropping by over 28%
and about 20% respectively between 1991-1992 and 2000-2001.
Foreign
participation has
risen
The reform has expanded the range of opportunities for foreign banks. A foreign
acquisition of domestic banks is now allowed up to 74% under the „Automatic
Route‟.19
In fact India has been rather liberal in allowing entry of foreign banks.
While India accepted a WTO commitment to permit twelve foreign bank
branches per year, it has actually permitted up to 18. In mid-200932 foreign
banks with 393 branches were operating.
Banks must lend
40% of their total
to priority
sectors…
All banks, whether public or private, are subject to government control over their
lending portfolios. The objective of India‟s priority lending programmes is to
ensure adequate lending to sectors in society or the economy that have a major
impact on large or weaker sections of the population and which are employment
intensive. A large portion of bank lending is targeted to agriculture, which the
authorities believe, fosters financial inclusion and supports rural demand. In
fact, financial inclusion is one of the main goals against which most policy

– ©
measures are measured. The scope of mandatory credit allocation has been
reduced somewhat with the reform, but it is still very large in comparison with
other countries. Banks must lend 40% of their total to priority sectors such as
agriculture, certain small businesses and clients from scheduled castes and tribes.
With reform, banks have been allowed greater leeway in branch rationalisation,
credit delivery recruitment and the creation of posts.
…and keep 25% of
their liabilities in
specific public
sector securities
In addition to priority lending requirements, banks are subject both to a cash
reserve ratio (6.5% of assets since May 2007) and a statutory liquidity ratio
(SLR) that requires 25% of their liabilities to be kept in specified public sector
securities. SLRs were as high as 50% in the early 1990s.
Mandated
allocation of bank
assets are
constraining
Overall, the state mandates the sectoral allocation of 59% of bank assets. In
earlier periods, the statutory liquidity ratio was not a serious burden on banks
inasmuch as public sector banks actually held a higher-than-required proportion
of their assets in targeted assets. As patterns of expansion change this ratio will
be a medium-term constraint on bank portfolios. In January 2007, a new law
empowered the Reserve Bank to lower the SLR below its current level. Some
analysts believe that despite the government‟s role in the credit allocation
process Indian banks have learned to work effectively with these allocation
guidelines and make credit decisions, including those for directed credit
segments, on commercial grounds.
Rules for corporate
governance of
banks are
distinctive
Indian rules concerning the corporate governance of banks are distinctive. The
Bank Regulation Act overrides any provisions made for stock market listing or
by the Companies Act. Specifically, shareholders owning more than 10% of the
equity of a bank have their voting rights capped at 10%. Foreign shareholders
are still limited to 20% ownership of public banks. They can own up to 74% of
private banks but their voting rights remain capped at 10%. Even in the case of
private banks, there is still a limit on the shareholding of any one entity. The
Reserve Bank no longer appoints directors to the boards of public banks but is
responsible for undertaking due diligence process prior to their nomination by
the government. There have been recent amendments to the Banking Companies
(Acquisition and Transfer of Undertakings) Act to improve corporate
governance by increasing the number of full-time directors and shareholder
directors, and a tightening of criteria for the selection of directors.
Deposit insurance
exists since 1962
Deposit insurance has been operational in India since 1962. The Deposit
Insurance and Credit Guarantee Corp. (DICGC), a government-owned corporate
entity, administers deposit insurance in India. DICGC insures deposits of up to
Indian rupees (INR) 100,000 (USD 2,350) per depositor per branch.
Reforms
introduced in 2002
strengthened credit
discipline,
regulatory
standards and
supervision
Before the reform, the lack of credit discipline and credit information as well as
poor protection of credit rights were serious problems. Since 2002, the
authorities have implemented several measures to strengthen the processes for
the resolution of nonperforming assets, for improving flows of information
regarding credit and for streamlining the corporate debt restructuring process.
Measures include (1) the setting up of Debt Recovery Tribunals across the
country, (2) the Securitisation and Reconstruction of Financial Assets and
Enforcement of Security Interest Act of 2002, and (3) registration of asset
reconstruction companies (which engage in the business of resolution of non-
performing loans acquired from banks and financial institutions).

– ©
Regulatory
standards have
moved towards
international best
practices
Regulatory standards have been progressively moved towards international best
practices. Rules governing the recognition of bad loans were substantially
tightened. A forward-looking system of supervision, similar to Prompt
Corrective Action systems in other countries, was introduced under which banks
are required to promptly undertake specified changes to their portfolios and
management when specified trigger points are breached. Banks are also required
to maintain high quality asset and liability and risk management systems to be
used in conjunction with Basel II banking supervisory systems.
Indian banks are
profitable,
adequately
capitalised and are
demonstrating
good capability to
manage risk
Indian banks are profitable, adequately capitalised and are demonstrating good
capability to manage risk. Despite considerable deregulation, net interest income
margin for Indian banks has remained high and stable. The contribution of
treasury income has been falling, pushing banks to focus more on fee income.
The growth in fee income should be helped by the distribution of third-party
products such as CIS, insurance, securities, and commodities. Indian banks have
reasonably high earnings although somewhat lower than the average for EE5
countries. The ROA averages about 100 basis points for domestic banks and
about 200 basis points for foreign banks. ROE for most banks is in the range of
15%. Improvement in credit quality has been evident in the past few years. The
NPL ratio declined from 11.4% in 2001 to 2.3% in 2008.
Capitalisation
remains adequate
as Basel II is being
introduced
The Indian banking system's capitalisation remains adequate. Increases in capital
ratios have been supported by Indian banks' healthy retained earnings as well as
new equity and hybrid capital issuance. From 2003 onwards, a pilot project was
launched to operate a risk-based supervision approach in preparation for the
introduction of the new Basel II risk-based capital framework. Internationally
active banks were required to be compliant with Basel II as of March 2008,
while banks having only domestic operations may delay implementation until
2009 in order to raise the necessary capital.
Coordination of
financial
supervision
In order to deal with issues of systemic risk that transcend the concerns of
individual regulatory bodies, a high level coordination committee on financial
markets has been established. The members of this committee include the RBI,
the Securities and investment Board of India which supervises capital markets
and the Pension Fund Regulatory and Development Authority (PFRDA.)
Need for capital
infusions to
support balance
sheet growth
Indian banks are expected to need capital infusions to support their projected
balance sheet growth and to implement RBI's new capital adequacy framework.
Hybrid capital instruments (Tier I and Upper Tier II) are expected to comprise a
significant proportion of the new capital.
2. Institutional investors
While investment
controls for
institutional
investors inhibit
the development of
dynamic financial
markets, pension
reform could foster
a transformation
Although institutional investors represent a slightly larger share of national
income than in China and Indonesia, controls on the investment of institutional
investors inhibit development of dynamic financial markets. Prior to the reform
institutional investors were mainly government controlled. In fact, the insurance
sector is still dominated by the state-owned Life Insurance Company of India,
which invests most of its assets in public sector liabilities. The largest pension
scheme in the country is part of the government, private pension schemes are
allowed to invest only 5 per cent of their new inflows in shares and 10 per cent
in equity-linked mutual funds. There is a possibility for major changes in this

– ©
situation. Thus in 2007, India implemented a shift in the retirement scheme for
civil servants to a new system of defined contribution accounts. An extension of
this scheme to the general population is under active consideration. If this
pension reform is properly implemented it could pave the way for the
accumulation of assets in private retirement accounts over time with the potential
to transform the country‟s financial system.
Domestic private
CIS have played a
key role in
resource
mobilisation…
Domestic private CIS have played a key role in resource mobilisation.
Previously, only publicly owned CIS were authorised and a public sector fund
manager (Unit Trust of India) held a commanding position. The Unit Trust of
India had to be completely restructured in 2002, for the second time, due to
failure of its investment portfolio to meet the returns that it had promised to
investors. With the deregulation of the capital market, privately owned mutual
fund management companies were allowed into the market. These funds have
been preferred by investors and now have a market share in excess of 90%.
… but mutual
funds‟ penetration
remains limited
Despite a significant growth in the number of schemes and assets under
management of mutual funds in recent years, their level of penetration remains
limited in comparison with other countries. Assets of CIS in amount to less than
5 % of GDP as against 70 per cent in the US and 28 % in Brazil. The share of
equity CIS has increased significantly in recent years, but still account for less
than 25 % of assets. Most of the growth has occurred in money market schemes,
which are used by corporates and large institutional investors for short term
liquidity management. There is considerable potential to develop household
investments in CIS.
3. Capital markets
Equity and
government bond
markets are large
and dynamic, but
private debt
markets are much
less advanced
Before the reform, overregulation discouraged the modernisation of Indian
capital markets. In 1992 a breakthrough was achieved when a new regulatory
authority for capital markets – the Securities and Exchange Board of India
(SEBI) – was established and a substantial degree of deregulation was
undertaken. In the intervening period capital markets have grown considerably
but unevenly. While the equity and government bond components are large and
dynamic, the private debt markets are much less advanced.
The number of
India‟s stock
exchanges has
grown to 23, and
BSE was by far the
largest
The number of India‟s stock exchanges has grown from four at Independence
(1947) to 23 at present. Of these “traditional exchanges” the largest by far was
the Mumbai-based Bombay Stock Exchange (BSE). At one point the BSE
boasted the largest number of listed companies in the world – well over 10,000 –
but a high proportion was illiquid. At present about 4900 companies are listed.
As recently as the early 1980s the ratio of market capitalisation to GDP was only
3%. Until that time, Indian capital markets were a closed club of brokers, with
few primary market offerings and little trade and marginal participation of the
general public. This partly reflected the lack of transparency in Indian businesses
and limited protection afforded to minority shareholders.
The creation of
NSE, competitor to
BSE, in 1994 was a
major turning
point in the
development of the
equity market
One major turning point in the development of the equity market came with the
establishment of the National Stock Exchange (NSE) in 1994, a fully automated
competitor to the Bombay Stock Exchange (BSE.) The NSE was created in
response to the stagnant performance of the existing stock exchanges. Its
founding shareholders were a number of public development banks (including
one that founded the largest new private bank), government financial institutions
and a private bank. The computerised trading system made it easier for investors

– ©
from across the country to trade in a transparent market. The NSE was one of the
first stock exchanges in the world to have a corporate structure, as opposed to a
mutual ownership dominated by intermediaries. It rapidly became the third
largest exchange in the world, measured by the number of transactions. It now
has foreign shareholders (New York Stock Exchange and various banks) up to
the maximum (26%) allowed by foreign direct investment regulations. Since its
inception in 1994, the NSE has challenged the BSE in terms of capitalisation and
surpassed it in turnover. The Bombay Stock Exchange was 10th largest in the
world in terms of capitalisation in 2008. The NSE has a much higher turnover in
equities and derivates than the BSE.
Equity market
infrastructure has
been upgraded
Reforms have also been implemented in equity market infrastructure. In 1995/96
mandatory electronic trading was introduced. The Depositories Act of 1996 gave
a legal basis to electronic reports and paved the way for paperless trading.
Exchange-based derivatives trading began in 2000. The establishment of the
Clearing Corporation of India Ltd. (CCIL) in April 2001 provided for real-time
risk management and the removal of counterparty risk.
Competition
between trading
platforms proved
beneficial to all
participants
Competition between trading platforms proved beneficial to all participants. The
BSE has automated its trading systems considerably. Both exchanges have
attracted a considerable amount of new listings as well as enlarged trading
volume. There has been a strong growth in equity issuance with IPOs averaging
slightly about 1% of GDP annually in recent years.
The ratio of India‟s market capitalisation to GDP (comprising both BSE and
NSE) rose from 30% at the time of the reform in 1992 to over 200% in the year
ending March 2008, before falling to about 100% a year later. These ratios are
high, even compared to the OECD countries.
An integral part of the new architecture was the creation of a centralised
counterparty for transactions, which greatly reduced the incidence of settlement
risk. At the same time, a law passed in 1996 allowed the creation of a new
depository institution for holding all stocks in dematerialised form.
4. Fixed income market
India‟s debt markets are divided into two segments: (a) the government bond
segment is the larger and more active of the two, with issuers comprising the
central government (90% of the total) and state governments. (b) The corporate
bond market with Public Sector Undertakings (PSU), corporates, financial
institutions and banks being the primary players.
a) Government bond market
The government
bond segment is
the dominant
component of the
debt market
The government bond segment is the oldest and largest component of the debt
market. Its size has taken off exponentially over the past decades, with the total
stock of debt outstanding at roughly 35% of GDP, comparable to other large
emerging Asian economies but significantly lower than the OECD average. With
growing demand from institutional investors such as insurance companies and
pension funds, bonds with maturity extending to 30 years are now available.

– ©
While various
reforms have
helped, its driving
growth factor was
the high public
sector borrowing
requirement
The broad outlines of the government bond market began taking form around
1992 as a result of the government‟s broad-based attempts to move away from
reliance on overseas borrowing toward market based systems of domestic debt
management. Reforms included a move toward an auction-based sale of
government securities, appointment of Primary Dealers, and the implementation
of delivery-versus-payment (DVP), mitigating the risks associated with trading
and settlement. In 1997, foreign institutions were permitted to invest in
government securities. Subsequent innovations, such as zero-coupon bonds and
index bonds, have so far received only tepid response from investors. One factor
driving growth of the government debt market has been high fiscal deficits and
the resulting high public sector borrowing requirement. Although the total public
deficit has been declining since 2003, government debt outstanding has averaged
85% of GDP over the past 5 years.
Restrictions on
issuers and
investors have
created a semi-
captive market
Restrictions on issuers and investors have created a semi-captive market for
government paper. Banks are required to invest 25% of their net demand and
time deposits in government bonds or other approved government securities, the
so-called statutory liquidity reserve (SLR). In fact banks and insurance
companies tend to hold an even greater share percentage of government bonds in
their portfolios than prescribed by regulations.
Control of
institutional
investments is
significant
Official regulations governing investment by institutional investors are
significant. Life insurance companies must lend 50% of their assets to the
government and place a further 15% in infrastructure lending. Traditional
pension funds must place 90% of their assets in government securities and postal
savings deposits are invested totally in government securities. Presumably, the
newly created investment accounts will have more flexibility in asset allocation.
b) Corporate bond market
The corporate
bond market
remains at less
than 2% of GDP
In contrast to the government bond market, the corporate bond market remains
very shallow amounting less than 2% of GDP. State-owned Public Sector
Undertakings (PSUs) have persistently exceeded private corporate issuances.
PSUs and private companies can raise debt capital either by private placement or
public issue, with the private placement by far the preferred method. Companies
continue to borrow from banks to meet financing needs. Bank credit accounts for
90% of corporate funding, with state-owned banks supplying 70% of the total.
Documentation
requirements have
resulted in the
almost complete
absence of traded
corporate bonds
Public issues are subject to documentation requirements that have resulted in the
almost complete absence of traded corporate bonds and the domination of the
market by private placements. Private placements, which can be made to a
maximum of 50 “Qualified Institutional Buyers”, require much less
documentation. Given the small number of investors, private debt placements
can more easily be customised in accordance with issuers‟ and investors needs.
For example, a change in market interest rates will lead to a renegotiation of the
coupon rate.
Private placements
mostly at three to
five years maturity
There is a preference to raise funds with maturities between three to five years,
which suggests that companies remain cautious of borrowing over the medium-
term segment, and also reflects investors‟ limited demand for longer tenors.

– ©
Credit rating
agencies CRAs)
are regulated
India was also one of the first countries (in 1999) to register and regulate credit
rating agencies (CRAs) as proposed by IOSCO. CRAs have to comply with
IOSCO‟s code of conduct essentially regarding conflicts of interest.20
Trades are usually
done over the
counter
Trades are usually done over the counter. When brokers intermediate, they are
required to report the transaction to the exchanges. Corporate debt can also be
traded via an electronic order book system, but this has largely been unpopular
in the absence of wide retail interest in such securities. At the same time, the
pension fund system is moving toward a defined contribution mechanism which
should provide impetus to the demand for corporate bonds.
Rules restrict
foreign purchases
of Indian bonds
There are restrictions on foreign purchases of domestic bonds. Foreign
investors are required to register with the SEBI, and that there are quantitative
limits on foreign purchases of private as well as government bonds.
Rules governing
issues by private
companies have
been eased
The SEBI has been working to facilitate the development of the publicly traded
private debt market. In 2008, SEBI substantially rationalised disclosure
requirements for bond issuers, especially for companies already listed in the
equity segment of exchanges which now face minimal additional disclosure
rules. There is no pre-vetting of prospectuses for corporate debt, and only
ratings and terms sheets are required. Such reforms have resulted in a large
number of public bond issues.
In part, tight
regulations in the
domestic markets
spurred Indian
corporates‟
overseas borrowing
Partly due to tight regulations in the domestic markets, Indian corporates have
been stepping up overseas borrowing, spurred by easier and fewer listing
requirements, lower cost of funding and better liquidity in the secondary
markets. The rise in overseas investment in Indian corporate debt coincided with
the improving perception by foreign investors of the quality of Indian
companies. Several Indian companies have issued Rupee-denominated bonds in
Singapore and Hong Kong.
Securitisation is
still in its nascent
stages, but demand
for infrastructure
financing and
future flow
securitisations
could lead to rapid
expansion
The market in asset-backed securities (ABS) and mortgage backed is still in its
nascent stages. India began securitisation in the early1990s. Growth accelerated
after 2000, reaching INR 580 billion (USD 12.5 billion) in fiscal year 2007/08,
but has apparently levelled off. Volumes still tend to be low and asset types
limited. The market is also subject to regulatory, legal, and tax uncertainties.
Auto loans were the first component of the market to show expansion in the
1990s. Since 2000, residential mortgage backed securities (RMBS) have also
contributed to market growth, but still account for less than 1% of total
securitised debt. Growth in credit card securitisation has been limited, partly
because of stamp duty costs, but also because the credit card market in India
remains small. There have also been limited future flow securitisations, such as
toll receipts, and some infrastructure financing. Demand for infrastructure
financing in India is now projected to grow rapidly and securitisation of
receivables from those projects has the potential to expand rapidly.
MBS is a segment
with the potential
to rise quickly
The growth of commercial bank credit for housing, averaging approximately
90% since 2002, suggests that MBS is a segment that has the potential to rise
quickly as soon as the necessary market infrastructure and regulatory
adjustments are enacted.

– ©
VII. Indonesia
Overview The Indonesian financial system is at a relatively early stage of development in
comparison with other EE5 countries. While the banking sector is small as
measured by most indicators such as the ratio bank deposits and bank credit to
GDP, it is by far the dominant component of the financial system. Bank deposits
account for some 80% of all financial assets. The banking system, which was
devastated by the 1997 Asian crisis, is now emerging in a more dynamic and
prudentially sound form that is capable of playing a more active role in
economic development. The non-bank financial institution (NBFI) sector,
including capital markets and institutional investors, is expected to gain in
importance in the future as the public begins to channel savings into institutional
investors and as the capital market gains a larger role in intermediation.
1. Banking sector
The central bank is
also responsible
for banking
supervision
Bank Indonesia, which is both the central bank and the body responsible for
banking supervision, also plays a leading role in addressing systemic stability
and macro prudential issues. Bank Indonesia has been working intensively to
build a financial safety net to prevent recurrences of the kind of problems that
made the post 1997 crisis particularly severe in Indonesia.
The relatively open
domestic banking
system proved
highly vulnerable
during the 1997
Asian crisis
Prior to the 1997 Asian crisis, the banking system was comprised of state-owned
banks as well as private domestic banks. The latter were often linked to family-
owned industrial conglomerates. Policies toward foreign bank establishment
were relatively open and foreign banks gained a significant foothold in the
market. Due to practices such as related party lending and borrowing in dollars
for lending in local currency, the domestic banking system proved highly
vulnerable during the crisis when the evaporation of foreign credit and the sharp
fall in the currency drove many corporate entities and banks into bankruptcy.
The major banks became insolvent and outstanding credit contracted sharply,
aggravating the decline in real income.
Post-crisis bank
recapitalisations
entailed
expenditures of
50% of GDP
The recapitalisation of the banks entailed expenditures of USD 45 billion (about
50% of 1997 GDP) and incapacitated the financial system for much of the
ensuing decade. The restructuring was led by the Indonesia Bank Restructuring
Authority (IBRA) which removed impaired assets from bank balance sheets,
recapitalised banks and attempted to recover value from impaired loans.
Restructuring was
led by a special
entity (IBRA), and
the government
became the
majority owner of
insolvent banks,
sold on to foreign
strategic investors
Working closely with international financial institutions, the authorities, led by
IBRA and Bank Indonesia, engineered a recovery in the banking system. In the
case of banks that had become insolvent, the government became the majority
owner while acquiring large portfolios of non-performing loans (NPLs). In the
phase of rehabilitation, the insolvent banks acquired by the government were
sold, mainly to foreign strategic investors. While investors from Europe, North
America and Australia made sizeable strategic investments, other Asian
countries (e.g. China, Malaysia, Singapore, India and Korea) took even bigger
stakes. The government also sold minority stakes in the major state-owned
banks. With stronger ownership and governance structures, bank managements
are under considerable pressure to adhere to strict norms of internal risk
management and earnings.

– ©
State banks control
some 39% of
assets, and the
system is
moderately
concentrated
There are over 130 national commercial banks in the country, a reduction from
220 at the time of the 1997 crisis. State banks control some 39% of assets.
Although there are many small credit institutions, the system is moderately
concentrated. The four largest banks, of which three are state-owned,21
control
nearly half of total bank assets. There are eight regional development banks
which account for some 11% of loans. There are also thousands of small
regional banks and credit co-operatives.
NPL ratios are
relatively low and
the major banks
are very profitable;
following the
banking reform,
loan growth has
been accelerating
rapidly
NPL ratios had approached 50% at the time of the crisis, but due to sales of
impaired assets and stricter risk management procedures, NPL ratios are now
only about 3.5% of total loans on average, and provisions for NPLs are almost
100% of NPLs. The major banks are very profitable as measured by net interest
margin, ROA and ROE. Following the crisis, lending contracted sharply and
banks portfolios contained heavy weightings of government bonds. The loan to
deposit (LTD) ratio declined to as low as 25%. With the reform of the banking
system loan growth has been accelerating rapidly in the past few years, despite
the global crisis of 2007, and now stands at about 68%. Indonesian banks have
comparatively high net interest margins and return on assets. ROE is somewhat
lower than in other EE5 countries.
The 2004 Banking
Architecture Plan
aimed at
developing a core
of prudentially
sound market-
oriented banks
As the recovery from the 1997 banking crisis gained traction, Bank Indonesia in
2004 unveiled its Banking Architecture Plan, a sweeping strategy aimed at
developing a core of prudentially sound market-oriented banks capable of
providing a broader range of financial services with more competition and
reduced systemic risk. The Plan aims to consolidate the industry into 58 national
banks through mergers and acquisitions over a period of 10-15 years. Bank
Indonesia envisages that banks will be stratified by size into categories such as
international-class banks, national banks and specialised or rural banks.
More consumer
and SME lending
is expected from
banks
As part of the transformation of the banking landscape, banks will be expected to
move from their earlier business model which stressed lending to large corporate
entities (often in affiliated groups) to lending to consumers and SMEs, while
larger corporate entities are expected to rely more heavily on capital markets.
2. Capital markets
The Indonesian
equity market has
relatively advanced
infrastructures...
The Indonesian equity market has relatively advanced physical and technological
infrastructures with an automated stock trading platform as well as custody and
clearing and settlement systems that are in line with international norms. In
2007, the exchanges in Jakarta and Surabaya were merged to form the
Indonesian Stock Exchange. Several derivative products are traded on the
exchange.
...but makes a
relatively small
contribution to
raising capital for
business
The equity market makes a relatively small contribution to raising capital for
business. Total market capitalisation as a share of GDP (41% in 2007) is the
lowest among EE5 countries. The exchange has not attracted a large number of
new listings in recent years. There were 335 companies listed in 2005 compared
to 288 ten years earlier and volumes of IPOs have not been high. The market has
very high rates of concentration, with the ten largest firms accounting for more
than half of market capitalisation. Most listed companies are family-owned
conglomerates in which the inside group maintains control. The “free float” is
generally about 35-40% of the total.

– ©
Trading has been
dominated by
foreigners, which
increases volatility
risk, but domestic
investors become
more active
Domestic institutional investors do not invest heavily in equity and retail
investors have also been largely absent. This can be contrasted with some other
Asian countries with strong equity cultures where the general population invests
heavily in stock markets. As a result, trading has been dominated by foreign
institutions. While the presence of foreign investors is basically positive,
excessive reliance on foreign investors plainly increases the risk of volatility. In
this context, it is a positive sign that domestic investors have been increasing
their activity in recent years.
Bank
recapitalisation
bonds were issued
after the 1997
crisis
Prior to the 1997 Asian crisis, the government had been legally prohibited from
issuing domestic debt, but with the banking crisis a large volume of bank
recapitalisation bonds were issued. The sharp rise in the outstanding stock of
debt enabled the authorities to engage in large scale operations to restructure
banks balance sheets.
Substantial strides
have been made in
modernising the
government bond
sector
Substantial strides have been made in modernising the government bond sector
by issuing paper with longer maturities and by introducing regular issuance
calendars. A system of primary dealers with access to special central bank
facilities has helped add liquidity. Banks are the largest holders of government
debt, but much of the trading is conducted by foreign institutions. Still, trading
remains very thin. The market expansion is constrained by the scarcity of
institutional investors who are normally the natural buyers of longer-term fixed
income assets.
Outside of the
government debt
sector, the fixed
income market is
rather shallow
Outside of the government debt sector, the fixed income market is rather
shallow. Outstanding corporate bonds amount to some 6% of GDP, which is
comparable to other EE5 countries. Domestic institutional investors are the main
holders of corporate bonds. An attempt was made to launch a market in local
government debt in 2001, but few issues have actually taken place.
There is no market
in housing-related
debt, but there are
efforts to build one
There is no market in housing-related debt. Outstanding housing loans amount to
2% of GDP (28% in Malaysia). One institution, Bank Tabungan Negara (BTN),
is mandated to extend credit to middle and low income families. BTN depends
upon deposits and government funds for its operation and its business remains
limited. The government created a specialised institution (Sarana Multigriya
Finansial) to purchase mortgages from banks in order to build a secondary
market in housing related assets.
3. Institutional investors
92% of the labour
force is not covered
by any pension
plan; and
Jamsostek as a
comprehensive
social security
scheme seems not
to be very
efficient...
It is estimated that 92% of the labour force is not covered by any pension plan
and thus depend upon their personal savings or upon their families. At present
there are unfunded pension plans for civilian government employees and for the
armed forces. Both of these schemes represent a growing drain on the public
finances. Private companies are required by law to provide coverage to their
employees through Jamsostek, a scheme that provides pensions as well as health,
accident and life insurance. The employer contributes to funds for all purposes
but the worker contributes only to the retirement portion of Jamsostek.
Jamsostek makes lump sum payments at retirement or upon earlier termination
of employment. Jamsostek has very high administrative expenses, and more than
40% of its assets are in bank deposits.

– ©
...and coverage is
very narrow
Despite the fact that the law mandates coverage for all private sector employees,
only an estimated 21% of formal sector employees are actually covered. Since
most workers are outside the formal sector, coverage is very narrow indeed.
Some employers
voluntarily offer
additional funded
pension plans
In addition to the mandatory plans offered by employers through Jamsostek,
some employers voluntarily offer funded pension plans to their employees
through special plans, which can be defined benefit or defined contribution. One
final category of pensions is Financial Institution Pension Funds (FIPFs) which
are offered by banks and insurance companies. These plans can be purchased by
employers or individuals can provide for their own retirement through voluntary
subscription. Over half of all pension fund assets are in these two categories of
private plans, although the number of individuals covered is much smaller than
in Jamsostek. Private plans also have a better investment record.
The reform of the
pension regime
will take many
years
The reform of the pension regime will take many years of concerted efforts, a
task complicated by the wide number of interests involved. In 2005, BAPEPAM
L&K (see below) produced a “Road Map” for the comprehensive reform of the
pension sector. A number of objectives were set forth, but no rigorous timeframe
was adopted.
The insurance
coverage is very
low...
The insurance coverage of the Indonesian population is very low by international
comparison. In addition to the low level of participation, low net earnings on
investment by insurance companies have meant that the insurance industry has
not generated a pool of long-term savings suitable for purchasing long-term
assets.
...and insurance
companies are not
very profitable
Despite the small market, there are 162 companies offering insurance, many of
the companies being too small to be economically viable. There apparently are a
number of companies that are insolvent, but no action has been taken to close or
consolidate marginal companies.
The CIS industry is
very small but
expanding;
however, valuation
procedures and
disclosure
practices are still
inadequate
The CIS industry is very small in Indonesia, although it has expanded since its
inception in 1995. Even in its current embryonic form, however, the industry has
already experienced substantial problems. With the resolution of the banking
crisis after 2000, the government began to issue special bonds to recapitalise
banks. CIS managers bought heavily for their portfolios. As a result, the assets of
fixed income funds surged from 4.6 trillion RPH in 2001 to 37 trillion one year
later. The domestic CIS industry was ill-equipped to absorb this sharp rise in
inflows. Valuation procedures were inappropriate. Many of the funds were
marketed without adequate explanation of the risks in fixed income investments.
Disclosure practices were inadequate.
Large bond price
corrections led to a
major loss in
confidence in the
CIS industry
The highly publicised surge in investment in 2000-2005 was followed by a
collapse which led to a major loss in confidence in the CIS industry. In 2003 and
again in 2005, price corrections in the bond market induced a panic among
investors which led to a wave of redemptions and widespread allegations that
improper methods of valuations were used. Net liquidations were especially high
during 2005, when assets in fixed income funds fell from 88 trillion RPH at the
end of 2004 to only 14 trillion a year later. It is widely agreed that much
improvement is needed if the industry is to expand its role in finance.

– ©
4. Multi-finance companies
Multi-finance
companies that
engage in a range
of near banking
activities are a
significant
category of NBFIs
One significant category of NBFIs is “multi-finance” companies that engage in a
range of “near banking activities,” such as credit cards, leasing, consumer
finance and factoring. There are about 130 multi-finance companies. Originally
multi-finance companies were engaged in leasing but in 2005 nearly 70% of
their activity was in consumer finance, with leasing accounting for most of the
remainder. Automobile and motorcycle credits and leases, often to low income
segments of the population, are the most common operation. Multi-finance
companies receive a considerable amount of their funds from commercial banks;
the largest multi-finance companies are bank affiliated. It should be noted that
finance companies of this kind have encountered serious problems in a number
of Asian countries such as Thailand and Korea.
5. Islamic finance
The past decade
has witnessed a
sizeable expansion
of Islamic
financial products
The past decade has witnessed a sizeable expansion of Islamic financial
products; i.e. instruments that are structured so as to conform to restrictions in
the Koran, especially concerning the payment of interest. As of August 2007,
only 1.3% of bank assets were in Shariah-compliant products but Bank
Indonesia projected the proportion to grow to 5% by end-2008. In 2008, a
special law on Islamic finance was enacted. There are three pure Shariah banks,
while 24 conventional banks have opened Shariah units. The government
recently issued its first Shariah-compliant bond-like product (sukok) in the
domestic market and further issues are planned. Sukok have also been issued in
foreign currency for placement with foreign investors. Islamic financial products
are also found in the mutual fund and insurance sectors.
6. Institutional arrangements for financial supervision
Bank Indonesia is
responsible for
banking
supervision,
NBFIs are
supervised by
BAPEPAM & LK
As mentioned above, Bank Indonesia is responsible for banking supervision.
NBFIs are supervised by BAPEPAM & LK. This agency was created by
merging BAPEPAM, the existing regulatory authority for capital markets with
bodies responsible for other NBFI. BAPEPAM (Capital Market and Financial
Institution Supervisory Agency), which has a long history as the capital markets
regulator, is undoubtedly the strongest official institution in the NBFI sector.
BAPEPAM, which focuses on market conduct and investor protection issues,
has the basic organisational structure that is common to all capital market
supervisors with departments responsible for intermediary‟s market conduct and
investment management.
In order to deal with issues that do not fall completely within the competence of
one supervisory agency the Financial System Stability Forum (FSSF) was
established on 30 December 200522
) with three levels of co-ordination: 1) at the
ministerial level, 2) the management level, and 3) the operational level. The
institutions represented on the FSSF are which all involve the ministry of
finance, the central bank (Bank Indonesia – BI), the Deposit Insurance
Corporation (DIC)23
and BAPEPAM & LK.
There are plans to
consolidate
supervision in a
In 2003 it was agreed in theory that all financial supervision (i.e. supervision by
Bank Indonesia and BAPEPAM & LK) would be merged into Otoritas Jasa
Keuangan (OJK), a unified financial supervisor. Bank Indonesia would retain

– ©
unified financial
supervisor by 2010
responsibility for systemic stability and monetary policy. The proposed merger
has been postponed several times.
VIII. South Africa
Overview By many measures South Africa has the most sophisticated financial system of
any EE5 country. Institutional investors are well developed, and for the most
part on a par with OECD countries. The banking system is deep compared to
those in other emerging economies. Both banks and capital markets have been
functioning as competitive institutions for extended periods. Local capital
markets, including derivatives markets, are well developed and securitisation is
growing rapidly. Following the end of the Apartheid era in 1994, the financial
system has become increasingly internationalised, with South Africa a major
provider of financial services for other African countries. The country continues
to have a solid record of financial stability and good supervision.
1. Banking system
Foreign banks
have a relatively
strong presence
Currently, there are 38 registered banks in South Africa, consisting of 15
domestically controlled banks, 6 non-resident bank subsidiaries, 15 branches of
foreign banks, and two mutual banks. In addition, 44 foreign banks have
representative offices in South Africa. The acquisition in 2005 of one of the
country‟s four largest banks by a U.K. bank increased foreign presence
substantially. Foreign banks have traditionally been mostly active in corporate
banking but the foreign acquisition of a large domestic bank will surely change
that business model.
Banks are
universal; the
commercial
banking sector has
no government
ownership
The banks are universal, offering a wide range of services to both individual and
corporate customers. Conglomerates have been formed that combine banking,
securities trading, and insurance within single organisations and also have
extensive cross-border operations. Meanwhile, several banks, especially small
local and foreign banks, service niche markets where they hold some
competitive advantage. In contrast to other EE5 countries, the South African
commercial banking sector has no government ownership.
The banking
system is rather
concentrated, as
many small and
medium banks
disappeared as a
consequence of a
crisis in 1999
The banking system has become rather concentrated. The number of medium to
small local banks increased steadily in the 1990s, but in 1999, the a crisis
erupted when Saambou Bank, a medium-sized bank with a strong deposit base
and wide branch network, experienced a liquidity crisis, emanating from
declining balance sheet quality and negative market perceptions. A withdrawal
from both larger and smaller banks ensued. The South African Reserve Bank
entered into consultations with the National Treasury, which ultimately issued a
guarantee to all depositors that the government would fund their withdrawals.
Subsequently, however, many small and medium banks faced liquidity pressures
and were forced to exit or were acquired by larger institutions. Overall, by the
end of March 2003, some 22 banks had exited. At present five major groups
continue to dominate the banking sector, controlling some 85-90% of total
assets.24
Small local banks constitute only 3% of the total banking sector assets,
in comparison to 22% cent in 1994.
Micro-loans are
equivalent to 1% of
GDP
The banking system also includes development and postal banks (which do not
fall under the Banks Act) as well as microfinance institutions, which have had
some success in reaching low income segments of the population. Micro-loans
are equivalent to 1% of GDP.

– ©
“Four-pillar”
policy to maintain
minimum levels of
competition
Noting the rising level of concentration in the banking system in 2004 the
Minister of Finance articulated a “four-pillar” policy that sets the objective under
of having a minimum number of substantial domestically banks (so called
“pillars”) on which the domestic banking industry relies and to discourage the
merger between any of those four banks. The objective of this policy was the
maintenance of minimum levels of competition, in the interests of prudential and
systemic stability. Additionally, any foreign bid to acquire one of the major
banks would be examined in the light of the potential impact on competition and
systemic stability.
Lending to the
household sector
has increased
Banks have increasingly been stressing lending to the household sector in recent
years. A the end of 2008 mortgage loans and instalment debt accounted for about
33 % recent and 11 % of total loans and advances, respectively, while credit card
debt accounted for another 3%. In contrast, loans and overdrafts amount to about
25 % as corporates are increasingly turning to capital markets.
The banks are
profitable and
prudentially sound
The banks are profitable and prudentially sound. As a result of problems in the
smaller and medium-sized banks around the year 2000, profitability measures
showed some decline. In the ensuing years there has been a trend toward
improvement. The net interest margin of banks at over 700 basis points is second
only to Brazil among the EE5. ROA has been improving and in 2008 was
estimated at 270 basis points and ROE at 23%. Credit quality has tended to be
good, with NPL ratios declining from 2.4% in 2003 to 1.1 per cent in 2008.
There are some concentrations on the lending side in households and the
property market as mortgages account for 45 per cent of total private sector
credit. Also, the funding structure shows some concentration in short-term
wholesale deposits.
Banks are well
capitalised and
have improved risk
modelling
following Basel II
In 2002 the official CAR was set at 10% (against the minimum global norm of 8
%). At the end of 2008 South African banks held capital equivalent to 12.5% of
risk weighted assets with a tier 1 ratio of over 10%. The larger banks have
implemented the advanced internal ratings based (IRB) approach under Basel II,
which has led them to develop sophisticated risk monitoring and modelling
capabilities.
A substantial
internationalisa-
tion of banking
activity has
occurred
A substantial internationalisation of banking activity has occurred. Due to the
political isolation of South Africa in the mid-1980s, international banks had
curtailed their operations in the country considerably. With the advent of the
democratically elected government in 1994, however, amendments to the Banks
Act allowed representative offices, subsidiaries and branches of international
banks to be established in South Africa. At the same time most controls on non-
residents‟ lending and investment in South Africa were lifted. At the same time
some controls on residents operations remain. The authorities plan further
liberalisation of rules for residents.
The arrival of
foreign banks
increased
competition and
made domestic
banks more
efficient
Following the opening of South Africa‟s financial system in 1994, international
participation in the local market has expanded considerably. Besides adding
further depth and sophistication to the South African market, these foreign banks
could utilise the highs skill of South African labour force. Consequently, the
arrival of these predominantly resourceful and experienced banks posed
formidable challenges to local banks. Facing intensified competition, South
African banks have become more efficient.

– ©
Domestic banking
groups are rapidly
expanding into the
rest of the
continent...
South Africa‟s large domestic banking groups are rapidly expanding their
banking operations into the rest of the continent. The democratisation of South
Africa coincided with the relaxation of controls in the foreign exchange and
capital markets in neighbouring countries, thus permitting the increased regional
and international participation in local financial systems. Within the broad
framework of liberalisation, factors such as privatisation, the seeking of joint
ventures and technical partnerships with larger firms and the need for assistance
in recapitalisation have provided opportunities for outward investment by South
African banks. These banks have attained dominant market shares in many of the
host countries.
...mostly through
deals with existing
banks in the host
countries
Rather than establishing a de novo presence, South African banks have chosen to
enter other markets by acquisitions of existing banks, purchase of stakes in
privatisation deals of state banks and buy-outs of other international banks. The
trend has been to establish subsidiaries rather than branches. In most countries
the corporate structures of the subsidiaries are simple with no additional
subsidiaries and few affiliate companies. However, in countries with burgeoning
capital markets(e.g. Botswana, Namibia, and Swaziland), corporate structures
are showing signs of increasing complexity, with banks establishing separate
additional subsidiaries for capital markets and money market operations.
Banks operate
mostly in the
wholesale side of
the market
South African banks operate mostly in the wholesale side of the market while
funding has been secured from increased deposit mobilisation in domestic
markets. In addition, the high interest rates on government securities have
provided profitable and low-risk investment opportunities. While there are signs
of a shift towards large branch networks, retail lending is yet to develop and the
credit card market remains largely untapped.
Expansions have
occurred in major
trading partners
These expansions have occurred in South Africa‟s major trading partners, many
of which are in Southern Africa. Most lending is to support South African firms
expanding into the region. While South African banks have rapidly expanded
into the region, financial institutions from other parts of Africa have a very
modest profile in South Africa. There are currently only three African financial
institutions operating in South Africa, of which two are Nigerian banks.
Banking
operations are
sound and
profitable
The banking operations in Africa are basically reported to be sound and
profitable. The operations continue to trade profitably, driven by steady growth
in low cost and stable retail deposits, commercial assets and improved
operational efficiency. The banking subsidiaries are usually also well capitalised
with capital adequacy ratios exceeding the statutory required levels.
2. Institutional investors
Institutional
investors are well
developed, with a
comprehensive
system of funded
pensions
The institutional investor community is rather deep. Virtually all categories of
institutional investors are well developed. According to SARB data, the assets of
pension funds are equal to 57% of GDP and the assets of all institutional
investors equal 155%, a figure exceeded only in a handful of OECD countries.
The country has a well developed system of funded pensions for both public and
private workers.
Insurance and CIS
are also important
The insurance sector has one of the highest penetration ratios in the world. The
CIS sector is fairly advanced, but less so than in Brazil in the OECD countries.

– ©
Regulation of
institutional
investors is
relatively flexible
Regulation of institutional investors is more flexible than in many countries.
Domestic institutions have reasonable freedom in their investment policy and are
among the major investors in the domestic bonds and equity markets. Pension
funds are major investors in equity and in all components of the fixed income
market.
3. Capital market
JSE is not only the
largest exchange
in Africa, but also
one of largest in
the world
The Johannesburg Securities Exchange (JSE), previously the Johannesburg
Stock Exchange was founded in 1887 to raise funds for the fledgling mining
industry. While mining related stocks still are significant, the majority of the
companies listed today are non-mining organisations. JSE Limited is by far the
largest exchange in Africa and one of largest in the world in terms of market
capitalisation.
A number of
initiatives
improved the
exchange‟s
efficient
functioning
A number of initiatives were introduced beginning in the mid 1990s to improve
the efficient functioning of the exchange. The first major change occurred in
November 1995, when the Stock Exchanges Control Act changed the way in
which stocks were traded in South Africa, opening the door to non-South
Africans as intermediaries, and allowing brokers to buy and sell stock for their
own account. The trading system was automated through an electronic clearing
and settlement system in1999. The bond market was separated from the JSE to
the Bond Exchange of South Africa (see next section). In 2001, the JSE merged
with the South African Futures Exchange (SAFEX), thereby becoming the
leader in both equities and futures and options trading in South Africa.
Decline in listings
as companies
moved their
primary listings to
London
Despite technical innovations the number of listed companies on the JSE
declined from 732 in 1990 to 403 in 2004, as a large number of South Africa's
biggest companies moved their primary listings to London to be more attractive
to international investors. This loss caused concern in the South African
securities industry market and resulted in a decline in trading volume on the JSE.
SETS, a London-
based securities
exchange trading
system, allows JSE
securities to be
displayed globally
In 2005 the JSE replaced the existing Johannesburg Equities Trading system
with the Securities Exchange Trading System (SETS), a London-based securities
exchange trading system. SETS is an electronic limit order book trading service
used to trade „blue-chip‟ shares as well as other securities. In addition to
improving accuracy of information, SETS enables the JSE‟s securities to be
displayed on more than 100 000 trader screens worldwide, thus potentially
attracting interest from fund managers and brokers around the globe.
South African
companies can
now issue shares
on JSE and LSE
Through this alignment of the London Stock Exchange (LSE) and the JSE,
South African companies can now issue shares on both exchanges, without
changing residence. In addition to SETS, the Securities Exchange News Service
(SENS) was introduced to issue price-sensitive information to all market-
watchers simultaneously. The trading engine and information dissemination
feed-handler is hosted in London and connected remotely to the JSE. More than
1,500 traders and information users access the system. The JSE also aligned their
equities trading model with that of Europe, and reclassified their instruments in
line with the FTSE Global Classification system. The exchange was
demutualised in July 2005.
Equity prices fared
well during this
The ratio of equity market capitalisation to GDP is one of the highest in the
world. About 20% of total turnover is done by non-residents. Prices have been

– ©
crisis and appear
reasonably valued
sustained comparatively well during the world financial crisis. Despite these
rises, the market appears reasonably valued. According to IMF estimates, the
dividend yield was 4.3%, the price to book value ratio was 3.75 and the P/E ratio
was 17.
AltX for small and
medium sized high
growth companies
The exchange has been developing special products to service specific market
segments. The Alternative Exchange (AltX) is a stock exchange that was
founded as a division of the JSE in order to accommodate small and medium
sized high growth companies.
JSE is planning to
create a pan-
African exchange
The JSE is taking steps to bring the stock exchanges of Africa closer together
and to improve the tradability of stocks in African companies. JSE is planning to
create a pan-African exchange by initially enabling investors to trade in shares
from Ghana, Namibia, Zimbabwe and Zambia. Later it will expand this across
the rest of Africa. In October 2008, the JSE launched the “FTSE/JSE All Africa
40 Index” and the “FTSE/JSE All Africa ex South Africa 30 Index”. The first
index shows the top 40 largest eligible companies listed on qualifying African
stock exchanges (which include South Africa as well as Botswana, Egypt, Ivory
Coast, Kenya, Mauritius, Morocco, Nigeria and Tunisia). The second index
excludes South African companies. In February 2009, the JSE launched its JSE‟s
Africa Board, a regulated trading platform that provides investors access to the
African market. Non-South African companies on the Africa Board retain their
local listing and take a secondary listing on JSE‟s Africa Board. The JSE shares
its trading revenue with the local exchanges. South African stock brokers have
been encouraged to enter into brokerage sharing agreements with brokers on the
rest of the continent.
Bond Exchange of
South Africa
Limited (BESA)
acts both as an
exchange and as a
self-regulatory
organisation; OTC
trades are reported
through the BESA
system, increasing
transparency
The Bond Exchange of South Africa (BESA), which was originally part of the
JSE, was established in 1996 as an independent, mutually owned exchange. In
2007 the BESA was demutualised. The BESA acts both as an exchange and as
the self-regulatory organisation (SRO) for the bond market. Essentially, most of
the trading takes place in the OTC market, but is reported through the BESA
system, which provides increased transparency. BESA brings together: (i) a
trade capture and matching service that is locally developed while using
international best practices, and (ii) comprehensive market data and reports,
which include mark-to-market prices, bond indices, yield curves and market-
turnover statistics, and (iii) a price-discovery system displaying live-for-trading
prices. In June 2009, BESA became a wholly-owned subsidiary of the
Johannesburg Stock Exchange. With this acquisition there was some
consolidation of the derivatives that were traded on the two systems.
The infrastructure
is highly
sophisticated, and
the bond market is
one of the largest
in EMEs…
The market infrastructure is highly sophisticated, with T+3 settlement, a central
clearing counterparty, and guarantee funds. The South African bond market is
one of the largest in proportion to the economy in emerging-market economies.
In December 2008 BESA had listed some 1,102 debt securities, issued by 100
sovereign and corporate borrowers, with a total market capitalisation of ZAR
935 billion. The market is very liquid with trading volume equal to 23 times
capitalisation.
… including a full
range of products
BESA lists over 375 bonds issued by central and local government, public sector
corporations and major companies, and regulates their trading, clearing and
settlement. About 1/3 of trading is by foreigners. Bonds include a full range of
products such as strips, inflation indexed bonds, zero coupon as well as bond
derivatives.

– ©
MBS and ABS
issuance has been
strong since 2001,
also providing an
alternative for
government bonds
Issuance of mortgage backed securities (MBS) and asset-backed securities
(ABS) has been strong since 2001 when changes in the legal infrastructure were
implemented to facilitate development of this product. While changes in the
regulatory environment are partly responsible, decreased supply of government
bonds also left investors base looking for alternatives. As retail assets on bank
balance sheets grew, banks turned to securitisation as another source of funding.
Issuance has been equally divided between residential MBS and ABS
collateralised mostly with vehicle loans and credit card receivables. Securitised
notes found a good market among the country‟s asset managers and pension
funds. At the same time, asset-backed commercial paper has become a funding
vehicle for the corporate sector.
55% of listings are
government bonds
About 55% of listed bonds are central and state government issues with state-
owned companies accounting for another 10%. The shares of corporate bonds,
MBS and ABS, have all been rising in recent years.
4. Financial supervision
The Reserve Bank
supervises the
banks, and
consolidated
supervision is
applied to all
banking groups
The Banking Supervision Department (BSD) in the Reserve Bank (SARB)
supervises the banks. Consolidated supervision is applied to all banking groups,
which must demonstrate that they are adequately capitalised in order to sustain
both their banking and nonbanking operations. The entities subject to
consolidated supervision are the bank controlling company, its subsidiaries, joint
ventures, and companies in which the bank controlling company has subsidiaries
or its subsidiaries has a participation. The BSD conducts both off-site and on-site
supervision, although the latter relies heavily on external auditors. Supervision
initially focused on off-site analysis of statistical information contained in the
statutory returns. However, the approach has been broadened to include a larger
component of on-site supervision. This includes, inter alia, ongoing interaction
and regular prudential meetings with the executive management and risk
managers of banks, annual presentations to banks' boards of directors and
trilateral discussions with the management, including the audit committee, and
the external auditors of banks.
FSB supervises
non-banks
The Financial Services Board (FSB) supervises non-banks, including insurance
companies, pension funds and exchanges.
After certain
reforms in
financial
supervision, the
2008 FSAP drew
positive
conclusions
In 2000, South Africa agreed to have an FSAP in order to review its systems for
financial supervision. The assessment was basically positive but some
recommendations for improvements were made. On the basis of these
recommendations, certain reforms were implemented Another FSAP was
performed in 2008. One major conclusion was that a system of formal deposit
insurance should be introduced. This recommendation is now under
consideration. At that time it was concluded that the financial system was
fundamentally sound, and that the regulatory framework for the financial sector
is modern and efficient.

– ©
NOTES
1 The G-20 was created as a response both to the financial crises of the late 1990s and to a growing recognition that
key emerging-market countries were not adequately included in the core of global economic discussion and
governance. The Group has regained importance in response to the current financial and economic crisis.
The G-20 is made up of the finance ministers and central bank governors of 19 countries: Argentina,
Australia, Brazil, Canada, China, France, Germany, India, Indonesia, Italy, Japan, Mexico, Russia, Saudi
Arabia, South Africa, South Korea, Turkey, United Kingdom, United States of America. See www.G-
20.org.
2 In order to have a comparable set of data, this paper uses data and information provided by the IMF (2008) and the
World Bank (2008a, 2009).
3 In fact, the share of listed equity is higher in Luxembourg than in South Africa, but this is due to the large number of
foreign companies listed in Luxembourg.
4 World Bank (2008b).
5 McKinsey Global Institute (2007, 2009).
6 Salviano (2008).
7 The Sistema Especial de Liquidação e de Custódia - SELIC (Special System for Settlement and Custody) is the
settlement system for most - around 96% - of central government's domestic securities. SELIC is the
resulting of a joint effort of BCB and market participants represented by the National Association of
Financial Market Institutions (Andima). Since then, all of the relevant government securities in Brazil were
dematerialised and kept in custody in SELIC. With the restructuring of the Brazilian payments system in
2002, SELIC was reformed to follow international recommendations for securities settlement systems,
providing from then on immediate, simultaneous and final transfer of securities and, through a direct link
with STR (Central Bank Money Transfers System), bank reserves (genuine DVP-1).
8 In 1987 the government introduced what is now the main instrument for Brazil‟s federal debt, the LFT (Letra
Financeira do Tesouro).
9 For mortgage backed securities (MBS): CRI (certificado de recebíveis imobiliários); and for asset-backed securities
(ABS): FIDC (fundos de investimentos em direitos creditórios - receivables investment funds).
10 Bolsa de Valores, Mercadorias & Futuros de São Paulo.
11 Comissão de Valores Mobiliários.
12 These steps include the reorganisation of the People‟s Bank of China into regional branches in the late 1990s,
which was partly intended to strengthen its control over local branches and the shift of lending authority to
higher level branches by the SOCBs at about the same time.
13 The steps also created some adverse incentives. Banks responded to the tighter individual accountability for bad
loan outcomes by virtually shutting out smaller and medium sized state and non-state SME who were no
longer officially backed by central and local governments. At the same time, the targets for reduction in the
NPL ratio encouraged banks to continue to expand loans rapidly, but toward outlets that were perceived to
be state backed (lending to larger SOEs and state infrastructure projects) or to housing and consumer
credit, where delinquencies were expected to be lower than in business lending.

– ©
14
The remaining about 2/3 of their equity was held as (i) state shares representing the state‟s investment in the
company and theoretically owned by the State Council; the state shares are not tradable. (ii) “Legal person”
shares are held by SOE, institutions, authorised social groups or other entities that have been granted “legal
person” status.
15 Companies incorporated in mainland China can be traded in the mainland A-share markets, quoted in Renminbi,
and currently open only to mainlanders and selected foreign institutional investors, or in the mainland B-
share markets (Shanghai and Shenzhen), quoted in foreign currencies (USD or HKD). In the past, only
foreigners were allowed to trade B shares. Starting from March 2001, mainlanders can trade B shares as
well. However, they must trade with legal foreign currency accounts.
16 Issuance in 2008 has been reported as follows: national debt: RBM 708.5 billion; financial bonds: RMB1.2 trillion;
corporate bonds: RMB 249.3 billion; central bank bills: RMB 4.3 trillion.
17 See also endnote 15.
18 Deutsche Bank Research (2009).
19 Foreign direct investment does not require approval, i.e. it is under the “Automatic Route” of the Reserve Bank of
India, if the investment is in a company engaged in a given sector is less than a specified percentage (74 %
in the case of banking) – and meets specified prudential conditions.
20 The debate of whether and how the rating methodologies of CRAs should be subjected to regulation is still ongoing
at the IOSCO level, but once decided there, India is ready to adopt such policies.
21 Mandiri, Negara and BRI.
22 According to official information, the FSSF “is a venue for coordination, cooperation and information exchange
among the authorities responsible for safeguarding financial system stability in Indonesia. This forum has a
crucial role, particularly in addressing systemic risk that can only be resolved through joint policies and
decisions followed by coordinated, effective actions. […] The key functions of the FSSF are: [i] To discuss
the various issues confronting government stakeholders in the financial system with potential systemic
impact, as informed by the financial institution supervisory authority; [ii] To coordinate and exchange
information for synchronization of laws and regulations concerning the banking system, non-bank financial
institutions and the capital market; [iii] To coordinate the implementation or preparation of specific
initiatives in the financial sector.”
See http://www.bi.go.id/web/en/Perbankan/Stabilitas+Sistem+Keuangan/Forum+SSK/.
23 According to official information, the “the FSSF is divided into three levels: [1] The Steering Forum, which is
responsible for providing general guidance to the Executive Forum on the key FSSF functions. This forum
has 7 members, 3 at the level of Director-General in the Ministry of Finance, 3 members of the BI [Bank
Indonesia] Board of Governors and the Chief Executive Officer of LPS [=DIC - Indonesia Deposit
Insurance Corporation]. [2] The Executive Forum, which carries out the key functions of the FSSF
according to the instructions of the Steering Forum. This forum has 14 members: 6 second-level officials
from the Ministry of Finance, 6 BI Directors and 2 LPS Directors. [3] The Working Team, which supports
the work of the Steering Forum and Executive Forum. Team members are officials appointed from the
Ministry of Finance, BI and LPS by decision of the Steering Forum after nomination by the respective
institutions.” See http://www.bi.go.id/web/en/Perbankan/Stabilitas+Sistem+Keuangan/Forum+SSK/.
24 The Absa group, the Standard Bank group, the FirstRand Bank group, Investec and Nedcor.

– ©
REFERENCES
Deutsche Bank Research (2009), China’s Financial Markets: A Future Global Force?, March 16.
McKinsey Global Institute (2007), The New Power Brokers: How Oil, Asia, Hedge Funds and Private Equity are
Shaping Global Capital Markets, October.
McKinsey Global Institute (2009), The New Power Brokers: How Oil, Asia, Hedge Funds and Private Equity are
Faring in the Financial Crisis, July.
IMF (2008), Global Financial Stability Report. Washington, D.C.
Salviano, Cleofas, jr. (2008), Fostering Competition in the Brazilian Financial Sector (April), presentation at the
Cemla-Banco de México Seminar “Financial Inclusion and Modernization in Latin America”.
World Bank (2006), Unlocking Indonesia's Domestic Financial Resources: The Role of Non Bank Financial
Institutions, December.
World Bank (2008a), Bank Regulation and Supervision Database (updated June 2008), available at
http://econ.worldbank.org/WBSITE/EXTERNAL/EXTDEC/EXTRESEARCH/0,,contentMDK:20345037~
pagePK:64214825~piPK:64214943~theSitePK:469382,00.html.
World Bank (2008b), Finance for All, World Bank Policy Research Report.
World Bank (2009), A New Database on Financial Development and Structure, updated May 2009, available at
http://econ.worldbank.org/WBSITE/EXTERNAL/EXTDEC/EXTRESEARCH/0,,contentMDK:20696167~
pagePK:64214825~piPK:64214943~theSitePK:469382,00.html.