Structural change, growth and innovation: the roles of ..._growth_and... · manufacturing, however,...
40
Structural change, growth and innovation: the roles of medium and low tech industries, 1980-2000 Tore Sandven NIFU-STEP Oslo, Norway [email protected] Keith Smith Centre for Innovation and Governance School of Management University of Tasmania Hobart, Tasmania, Australia Aris Kaloudis NIFU-STEP Oslo, Norway [email protected] Contribution to: H. Kreinsen et al (eds), Low-tech Innovation in the Knowledge Economy Frankfurt: P. Lane. Jan 29 2005
Transcript of Structural change, growth and innovation: the roles of ..._growth_and... · manufacturing, however,...

Structural change, growth and innovation:
the roles of medium and low tech industries, 1980-2000
Tore Sandven NIFU-STEP
Oslo, Norway [email protected]
Keith Smith
Centre for Innovation and Governance School of Management University of Tasmania
Hobart, Tasmania, Australia
Aris Kaloudis NIFU-STEP
Oslo, Norway [email protected]
Contribution to: H. Kreinsen et al (eds), Low-tech Innovation in the Knowledge Economy
Frankfurt: P. Lane.
Jan 29 2005
1
Abstract
It is often argued that high tech industries drive growth processes, and that they are the sources of growth in output, employment and productivity in the knowledge economy. This is a special case of a more general argument that economic growth is characterized by the creation of new and the replacement of old industries. ICT sectors are often treated as the most important examples of this enhanced role of high tech at the present time. This approach implies that low tech industries have declining shares of output for two reasons: their growth is lower (or they are declining absolutely) and they are relocating to low wage economies. That is, they exhibit trade-driven �hollowing out�. If true, these claims would imply that shares of high tech output are rising significantly in growing economies, while low tech shares are falling significantly, and that countries with larger high tech sectors will exhibit higher growth rates. This paper examines such claims. The issues are explored using OECD manufacturing and trade data for the twenty-year period 1980-1999. We show that overall economic structures of OECD economies have changed, particularly reflecting the growth of financial services and social and community services. Within manufacturing, however, structural change has occurred but has been rather small, and does not account for the manufacturing growth that has occurred. We show that there is considerable variation in manufacturing structures across OECD economies, and argue that structural diversity would diminish over time if growth was high-tech driven. This does not occur - comparative structures persist over time, and growth performance across countries is not correlated with shares of high tech in manufacturing. The slowness of structural change means that low tech and medium low tech sectors remain by a wide margin the largest components of manufacturing output and employment in OECD economies. We examine trade patterns for low and medium low tech sectors, and show that changing domestic demand for low tech manufactures has largely been met by changing domestic production. There has been some widening of trade deficits, but this has been small: there is no trade-driven �hollowing out�. We argue that these industries persist because of pervasive innovation within them: they are constantly renewed by technological upgrading, which accounts for their survival.
2
1. Introduction
There is a widepsread view that economic growth, especially in advanced economies,
rests on high technology industries. Such industries are usually defined as high R&D
industries. The argument is that growth is characterized by structural change, with
high tech activities becoming predominant for two reasons. First, it is claimed that
high-tech industries are also high growth industries, so that there will be structural
change as the weight of high tech industries in total output increases. Second, there is
the idea that low tech industries are labour intensive and therefore footloose. In an
internationalized world they will decline in advanced economies as price competition
from low wage economies erodes their competitiveness. Such industries will either
move to developing countries or disappear. This �hollowing out� will also of course
result in a structural shift towards high tech industries. These arguments imply a
conclusion that has strong policy resonance: to maintain real incomes developed
economies must reallocate resources away from low tech industries, instead fostering
high tech activities in which low wage economies do not have competitive
capabilities.
The aim of this chapter is to confront such claims with some basic evidence on
structural change and trade in OECD manufacturing over the long run, and to discuss
the results. We use OECD data on manufacturing, and the OECD�s definitions of
high, medium, and low tech industries, to explore the extent of structural change, and
the role of trade, in a number of economies over a twenty year period. This chapter
has five sections. The first discusses arguments that place high tech industries at the
centre of economic growth, and the hypotheses that can be derived from such
arguments. The second outlines data and definitions. The third overviews the
empirical evidence and assesses the hypotheses. We argue that although there is
evidence of structural change in OECD manufacturing, such change is too small to
support the claims of high-tech approaches to growth - low tech activities are
declining only slowly, and they persist as major sectors of employment and output.
We show that growth is not correlated with the possession of high tech sectors. The
fourth section examines trade, and shows that the evidence does not support the claim
3
that trade is reducing low tech activities. The final section explores alternatives to
high-tech views of growth. We argue that technological upgrading, in the form of
contiinuous incremental product and process innovation, accounts for the growth and
trade performance of medium and low technology industries, and for their continued
major role in advanced economies.
It should be noted that this chapter has the limited ambition of discussing the direct or
first-order impacts of high tech industries on structural change, growth and trade. It is
intended as part of a series of studies that will explore these issues in greater detail
and deeper statistical technique. In particular we do not here address indirect effects:
it is often argued that high tech industries are important because they create new
generic technologies that are widely used across industries, and that therefore drive
productivity growth in other industries. Here we address only issues concerning the
direct impacts of high tech industries, though we offer some critical comments on the
�indirect hypothesis� in the concluding section, particuylarly in relation to the
argument of Pol, Robertson and Carroll in this book.
2. High Tech Industries and Structural Change Theories of Growth
Structural change theories of economic growth tend to rest on some form of product-
cycle view of industry development, in which the relative size of an industry reflects
phases of the product cycle, and in which innovation leads to industry replacement.
So product cycles result in industry life-cycles, resulting in constant structural change.
Kuznets gave a characteristically clear statement of this view:
�(A) sustained high rate of growth depends upon a continuous emergence of
new inventions ands innovations, providing the basis for new industries whose
high rates of growth compensate for the inevitable slowing down in the rate of
invention and innovation, and upon the economic effects of both, which retard
the rates of growth of older industries. A high rate of overall growth in an
economy is thus necessarily accompanied by considerable shifting in relative
importance among industries, as the old decline and the new increase in
relative weight in the nation�s output� (Kuznets 1959: 33)

4
Modern innovation economics has been strongly influenced by a larger-scope version
of this approach, deriving from Joseph Schumpeter, and the ideas presented in his
Business Cycles. That approach in turn drew on a reading of Kondratiev, seeing
economic growth as the outcome of �long waves� of technology-impelled change. The
argument is that growth is cyclical, with a period of about fifty to sixty years, and can
be understood in terms of the impacts of a relatively small array of radical
technological innovations that generate surges of investment, productivity growth,
and organizational change. Perhaps the most sustained analysis in these terms in
recent years has been Freeman and Loucã, whose book is in large part an extended
discussion of growth waves that are argued to be based on the �life cycle of a
technology system� (Freeman and Louçã, 2001: 146). It is worth noting that this
approach to structural change growth theory has achieved a certain take-up in policy
circles. The conclusions of the OECDs �Growth Project� included the claim that
�Information and communication technologies (ICT) are transforming economic
activity, as the steam engine, railways, and electricity have done in the past�, a
formulation fully consonant with Schumpeter and the neo-Schumpeterian approach of
Freeman and Loucã (OECD, 2001: 27).
This OECD formulation leads us to as final point about modern approaches to
structural change. In recent years the focus on high tech industries has been
complemented by a more specific focus on ICT. For example, Fagerberg et al, in a
recent study of European growth, argue that:
� the problems that Europe faces in key areas such as growth, equality and
employment are all related to its failure to take sufficient advantage of
technological advances, particularly the ICT revolution�science-based
industries, particularly those drawing heavily on ICT, have become the main
driver of technological change and economic growth since the 1980s.
(Fagerberg et al, 1999: 235)
These views are widely shared by those who see a �new growth regime� based on ICT
as an instance of �pervasive new technology� forming the basis of new �long waves�
of growth (see for example Bassanini et al, 2000; Boyer, 2004; Amable and Petit,
2003).
5
What kinds of broad hypotheses are implied by structural change concepts of
economic growth? Because the high tech industries are all located within
manufacturing, we focus in this chapter primarily on the manufacturing sector, and
argue that the following broad set of hypotheses are implied by structural change
models of growth:
• The high-tech model requires that in the long run growth of manufacturing
there should not only be a secular rise in the share of high technology
industries in total manufacturing output, but also a positive and significant
correlation between shares of high tech in total output and levels and growth
rates of GDP.
• If the high tech model is correct then long term growth will be accompanied
by a reduction in structural diversity. Specifically, if growth is driven by
changes in the shares of these sectors, then cross-country growth will lead to a
convergence in structure across countries. Across the whole sample of
countries, the rank correlations of the shares of the various sectors, between
the beginning and the end of the period, should be low.
• If ICT is the key high tech industry of the recent past, then �those countries
which have experienced a rapid diffusion of ICT, or which have been involved
in significant production of it, will be ahead of other countries, at least in the
ascending phase of a long-term cycle� (Amable and Petit, 2003: 223).
• As structural change proceeds there should be falling employment in low tech
sectors, both as a result of high tech growth and of trade effects, as low and
medium tech industries move to low wage environments.
• If low tech industries are moving to low wage economies, there should be a
shift in the sources of supply in low tech products, with substantially rising
import shares of low tech industrial products in total domestic demand.
In what follows, we explore the primary evidence related to such claims, and test
them with simple correlations. Our aim here is an overview and discussion of the
relevant data, and a set of simple but robust tests to assess whether the long run
manufacturing evidence can plausibly support the �high tech� structural change views
of economic growth.

6
3. Data and definitions
To operationalise the concepts of high tech and low tech industries, we use the OECD
sector classification as presented in Hatzichronoglou, 1997. The approach rests on a
taxonomy of manufacturing industries developed in the mid-1980s (OECD 1986: 58-
61). The OECD distinguished between industries in terms of R&D intensities, with
those (such as ICT or pharmaceuticals) spending more than 4% of turnover being
classified as high-technology, those spending between 1% and 4% of turnover (such
as vehicles or chemicals) being classified as medium-tech, and those spending less
than 1% (such as textiles or food) as low tech. This approach has since been modified
to divide the �medium technology� group into medium-high and medium-low. A
second change recognises that direct R&D is only one indicator of knowledge
content, and that attention should be paid also to R&D embodied in intermediate and
capital inputs to low tech industries. The current classification is reproduced in Table
1 below.
TABLE 1. OECD classification of manufacturing industries by technological intensity
ISIC 3 classification
High tech Aerospace 35.3 Computers, office machinery 30 Electronics-communications 32 Pharmaceuticals 24.4 Medium high tech Scientific instruments 33 Motor vehicles 34 Electrical machinery 31 Chemicals 24-24.4 Other transport equipment 35.2+4+5 Non-electrical machinery 29 Medium low tech Rubber and plastic products 25 Shipbuilding 35.1 Other manufacturing 36 Non-ferrous metals 27.2 Non-metallic mineral products 26 Fabricated metal products 28 Petroleum refining 23 Ferrous metals 27.1 Low tech Paper, printing 21+22 Textile and clothing 17+18+19 Food, beverages and tobacco 15+16 Wood products 20
7
The classification is based on Hatzichronoglou, 1997 utilizing ISIC Revision 2, but is
here redefined according to ISIC Rev. 3. This required some minor adjustments. For
example, in ISIC 2 Wood products included production of furniture, whereas in ISIC
3 furniture is classified under other manufacturing.
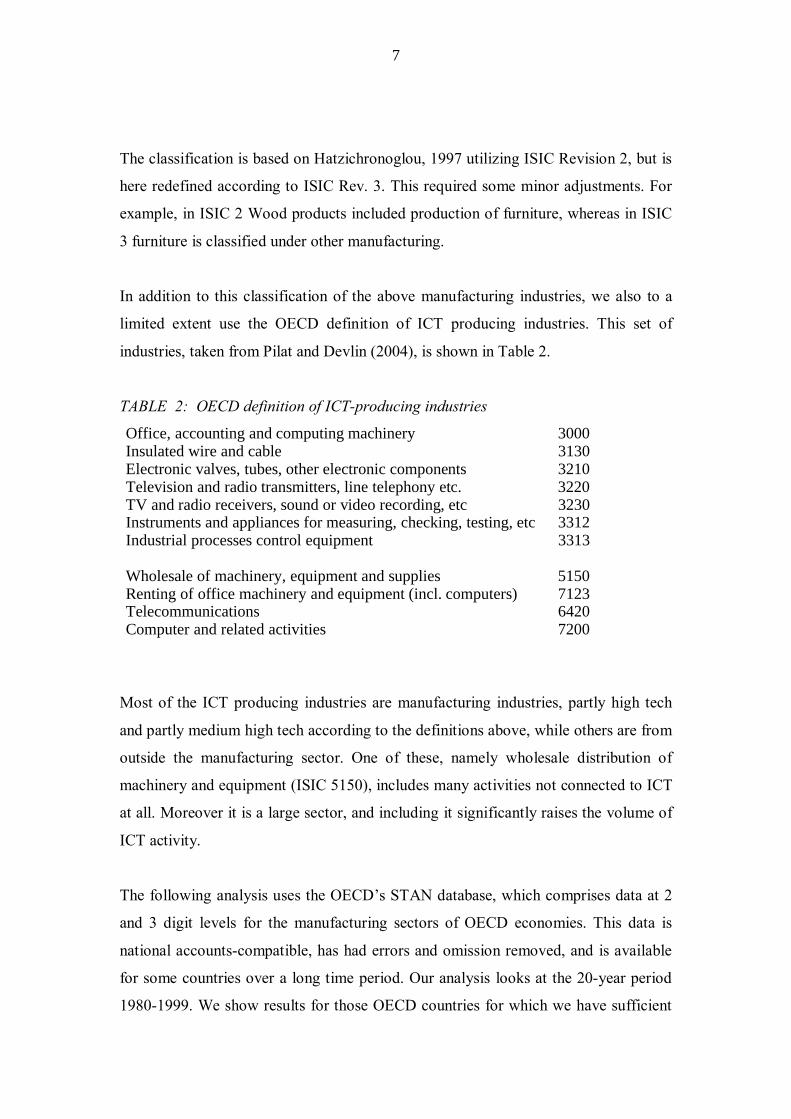
In addition to this classification of the above manufacturing industries, we also to a
limited extent use the OECD definition of ICT producing industries. This set of
industries, taken from Pilat and Devlin (2004), is shown in Table 2.
TABLE 2: OECD definition of ICT-producing industries
Office, accounting and computing machinery 3000 Insulated wire and cable 3130 Electronic valves, tubes, other electronic components 3210 Television and radio transmitters, line telephony etc. 3220 TV and radio receivers, sound or video recording, etc 3230 Instruments and appliances for measuring, checking, testing, etc 3312 Industrial processes control equipment 3313 Wholesale of machinery, equipment and supplies 5150 Renting of office machinery and equipment (incl. computers) 7123 Telecommunications 6420 Computer and related activities 7200
Most of the ICT producing industries are manufacturing industries, partly high tech
and partly medium high tech according to the definitions above, while others are from
outside the manufacturing sector. One of these, namely wholesale distribution of
machinery and equipment (ISIC 5150), includes many activities not connected to ICT
at all. Moreover it is a large sector, and including it significantly raises the volume of
ICT activity.
The following analysis uses the OECD�s STAN database, which comprises data at 2
and 3 digit levels for the manufacturing sectors of OECD economies. This data is
national accounts-compatible, has had errors and omission removed, and is available
for some countries over a long time period. Our analysis looks at the 20-year period
1980-1999. We show results for those OECD countries for which we have sufficient

8
data on value added, employment, production, exports and imports for the whole
period 1980-1999. There are 11 countries for which complete data is available:
Austria, Denmark, Finland, France, Italy, Japan, Norway, Portugal, Spain, Sweden
and USA. The two most important countries which are excluded, on account of
insufficient data, are thus Germany and Great Britain. However where possible we
bring in data from these countries, and others; if necessary we shorten the time period
of the analysis to do so. Value added is in constant 1995 US dollars. Purchasing
power parities have been used to convert national currencies to dollars. The price
deflator for GDP has been used to adjust for changes in price level. Data on GDP
measured in constant 1995 US dollars for the various countries during the period
1980-1999 has been taken from the OECD Statistical Databases on Annual National
Accountss. Three-year moving averages at the beginning and end of the 20 year
period are used to compute growth rates, so most of our long run growth calculations
are for 1981-1998.
4. Structural change across the OECD: output, growth, productivity, employment and trade This section first explores the overall process of structural change in OECD
economies, and then the changing structure of manufacturing value added for the four
technology classes of industries for the period 1980-1999. It then discusses the
persistence of industrial structures across countries, correlations between high tech
industries and growth performance, and trends in productivity and employment.
4.1 The background: overall structural change 1980-99 Before turning to structural change within manufacturing, it is important to note that
the period 1981-1999 also exhibits significant structural change between
manufacturing and other sectors. The basic dimensions of such change are shown in
Table 3, which focuses on employment rather than output because of problems in the
measurement of services output. Table 3 breaks services � a large and heterogeneous
sector - into four major components.
9
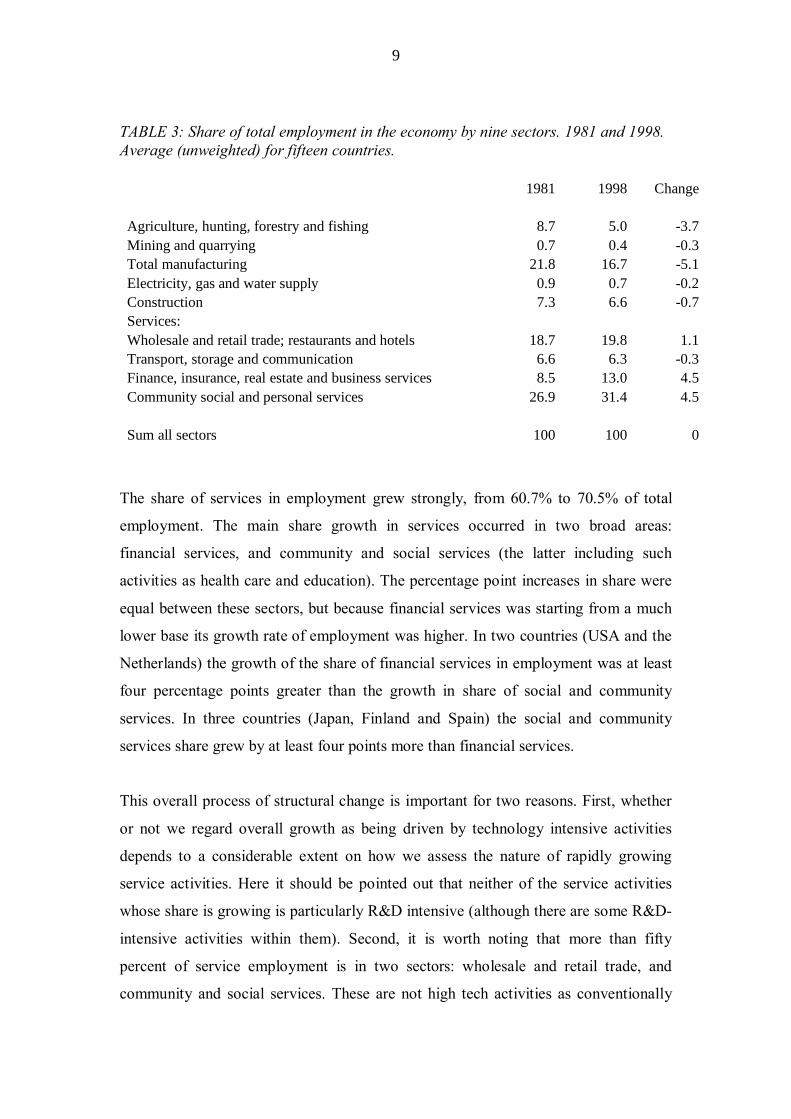
TABLE 3: Share of total employment in the economy by nine sectors. 1981 and 1998. Average (unweighted) for fifteen countries. 1981 1998 Change Agriculture, hunting, forestry and fishing 8.7 5.0 -3.7Mining and quarrying 0.7 0.4 -0.3Total manufacturing 21.8 16.7 -5.1Electricity, gas and water supply 0.9 0.7 -0.2Construction 7.3 6.6 -0.7Services: Wholesale and retail trade; restaurants and hotels 18.7 19.8 1.1Transport, storage and communication 6.6 6.3 -0.3Finance, insurance, real estate and business services 8.5 13.0 4.5Community social and personal services 26.9 31.4 4.5 Sum all sectors 100 100 0
The share of services in employment grew strongly, from 60.7% to 70.5% of total
employment. The main share growth in services occurred in two broad areas:
financial services, and community and social services (the latter including such
activities as health care and education). The percentage point increases in share were
equal between these sectors, but because financial services was starting from a much
lower base its growth rate of employment was higher. In two countries (USA and the
Netherlands) the growth of the share of financial services in employment was at least
four percentage points greater than the growth in share of social and community
services. In three countries (Japan, Finland and Spain) the social and community
services share grew by at least four points more than financial services.
This overall process of structural change is important for two reasons. First, whether
or not we regard overall growth as being driven by technology intensive activities
depends to a considerable extent on how we assess the nature of rapidly growing
service activities. Here it should be pointed out that neither of the service activities
whose share is growing is particularly R&D intensive (although there are some R&D-
intensive activities within them). Second, it is worth noting that more than fifty
percent of service employment is in two sectors: wholesale and retail trade, and
community and social services. These are not high tech activities as conventionally

10
defined. A final point to note here is that growth in technology-intensive activities
within manufacturing may not translate into changes in the shares of such activities in
overall GDP, because the decline in the share of manufacturing in GDP and
employment may outweigh rising shares within manufacturing. This point will be
illustrated in more detail in the sections below.
4.2 Structural change in OECD manufacturing Constant-price manufacturing value added has risen, although with cyclical
fluctuations, across the OECD over the past twenty years in all technology sectors.
Between 1981 and 1998 total value added in manufacturing as a whole for these
eleven countries combined grew by 26.4 per cent, implying a compound annual
growth rate (CAGR) of 1.4 per cent per year.
FIGURE 1. Value added in billion 1995 US dollars, 11 countries combined. 1980-
1999
0
100
200
300
400
500
600
700
800
900
1000
1980 1981 1982 1983 1984 1985 1986 1987 1988 1989 1990 1991 1992 1993 1994 1995 1996 1997 1998 1999
billi
on 1
995
US
dolla
rs
High tech
Medium hightech
Medium lowtech
Low tech
The high tech industries have by far the highest growth: 88.3 per cent (CAGR 3.8 per
cent per year). High growth in high tech in part reflects a much lower starting point
than the medium or low tech categories (the absolute increments to output in high and
medium high tech sectors are roughly the same). The medium high tech category saw
growth about equal to manufacturing as a whole with 28.2 per cent (CAGR 1.5 per
cent per year). The two low tech categories have growth of value added below
11
manufacturing as a whole. Medium low tech has 10.8 per cent growth (CAGR 0.6 per
cent per year), and low tech 20.0 per cent (CAGR 1.1 per cent per year). These
growth rate differentials mean that the high tech industries� share of manufacturing
value added grows steadily during these years, while the shares of the two low tech
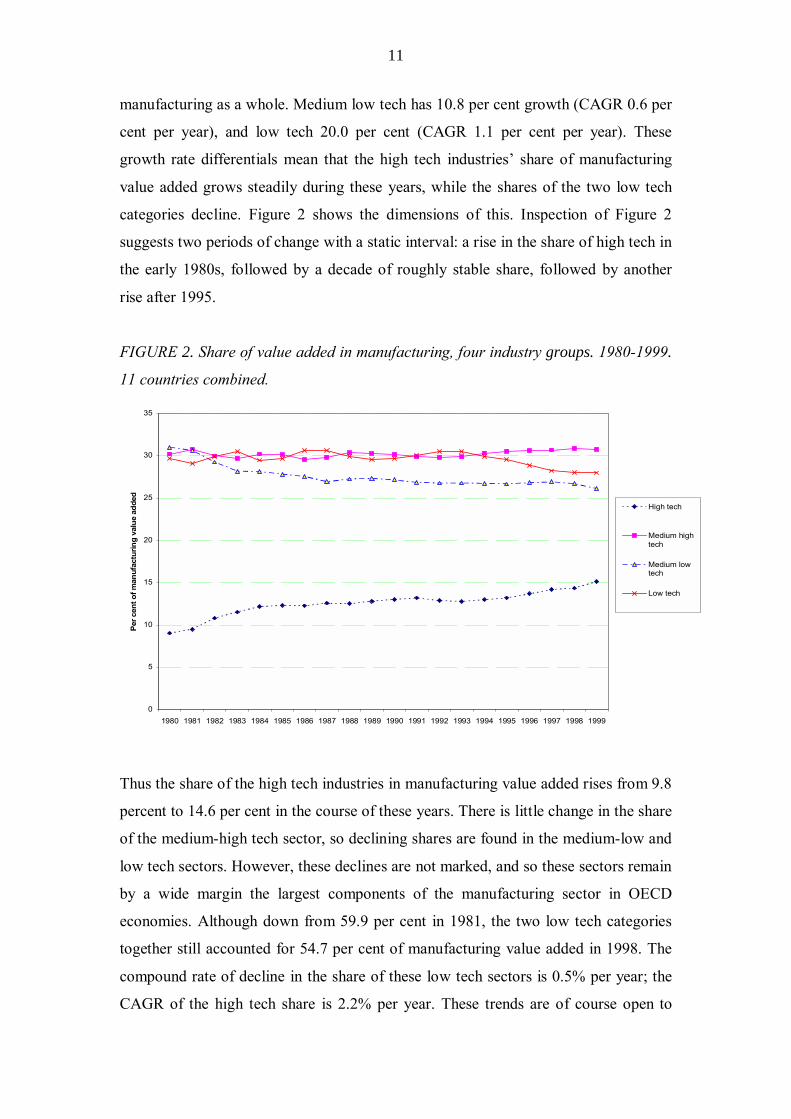
categories decline. Figure 2 shows the dimensions of this. Inspection of Figure 2
suggests two periods of change with a static interval: a rise in the share of high tech in
the early 1980s, followed by a decade of roughly stable share, followed by another
rise after 1995.
FIGURE 2. Share of value added in manufacturing, four industry groups. 1980-1999.
11 countries combined.
0
5
10
15
20
25
30
35
1980 1981 1982 1983 1984 1985 1986 1987 1988 1989 1990 1991 1992 1993 1994 1995 1996 1997 1998 1999
Per c
ent o
f man
ufac
turin
g va
lue
adde
d
High tech
Medium hightech
Medium lowtech
Low tech
Thus the share of the high tech industries in manufacturing value added rises from 9.8
percent to 14.6 per cent in the course of these years. There is little change in the share
of the medium-high tech sector, so declining shares are found in the medium-low and
low tech sectors. However, these declines are not marked, and so these sectors remain
by a wide margin the largest components of the manufacturing sector in OECD
economies. Although down from 59.9 per cent in 1981, the two low tech categories
together still accounted for 54.7 per cent of manufacturing value added in 1998. The
compound rate of decline in the share of these low tech sectors is 0.5% per year; the
CAGR of the high tech share is 2.2% per year. These trends are of course open to
12
interpretation, and the power of compound change over long periods is well known,
but we would argue that over a period of two decades, when economies are allegedly
being reshaped by major high technology changes, these are not substantial structural
shifts.
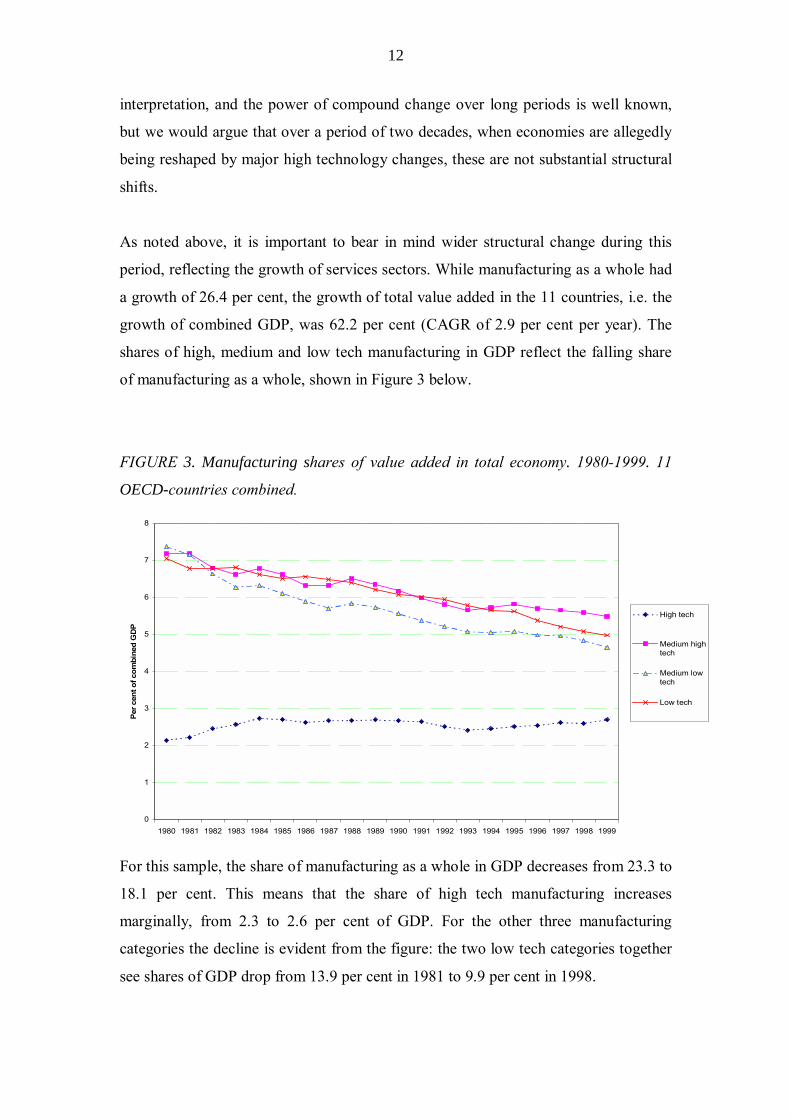
As noted above, it is important to bear in mind wider structural change during this
period, reflecting the growth of services sectors. While manufacturing as a whole had
a growth of 26.4 per cent, the growth of total value added in the 11 countries, i.e. the
growth of combined GDP, was 62.2 per cent (CAGR of 2.9 per cent per year). The
shares of high, medium and low tech manufacturing in GDP reflect the falling share
of manufacturing as a whole, shown in Figure 3 below.
FIGURE 3. Manufacturing shares of value added in total economy. 1980-1999. 11
OECD-countries combined.
0
1
2
3
4
5
6
7
8
1980 1981 1982 1983 1984 1985 1986 1987 1988 1989 1990 1991 1992 1993 1994 1995 1996 1997 1998 1999
Per c
ent o
f com
bine
d G
DP
High tech
Medium hightech
Medium lowtech
Low tech
For this sample, the share of manufacturing as a whole in GDP decreases from 23.3 to
18.1 per cent. This means that the share of high tech manufacturing increases
marginally, from 2.3 to 2.6 per cent of GDP. For the other three manufacturing
categories the decline is evident from the figure: the two low tech categories together
see shares of GDP drop from 13.9 per cent in 1981 to 9.9 per cent in 1998.
13
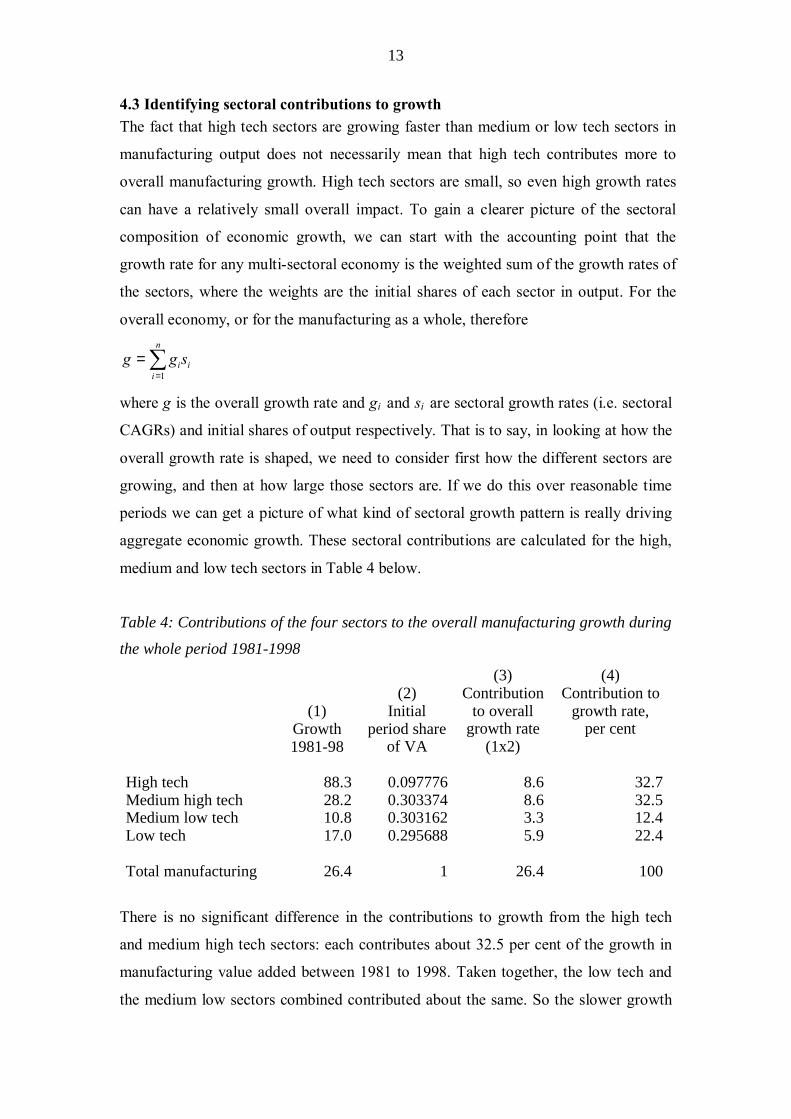
4.3 Identifying sectoral contributions to growth The fact that high tech sectors are growing faster than medium or low tech sectors in
manufacturing output does not necessarily mean that high tech contributes more to
overall manufacturing growth. High tech sectors are small, so even high growth rates
can have a relatively small overall impact. To gain a clearer picture of the sectoral
composition of economic growth, we can start with the accounting point that the
growth rate for any multi-sectoral economy is the weighted sum of the growth rates of
the sectors, where the weights are the initial shares of each sector in output. For the
overall economy, or for the manufacturing as a whole, therefore
∑=
=n
iiisgg
1
where g is the overall growth rate and gi and si are sectoral growth rates (i.e. sectoral
CAGRs) and initial shares of output respectively. That is to say, in looking at how the
overall growth rate is shaped, we need to consider first how the different sectors are
growing, and then at how large those sectors are. If we do this over reasonable time
periods we can get a picture of what kind of sectoral growth pattern is really driving
aggregate economic growth. These sectoral contributions are calculated for the high,
medium and low tech sectors in Table 4 below.
Table 4: Contributions of the four sectors to the overall manufacturing growth during
the whole period 1981-1998
(1) Growth 1981-98
(2) Initial
period share of VA
(3) Contribution
to overall growth rate
(1x2)
(4) Contribution to
growth rate, per cent
High tech 88.3 0.097776 8.6 32.7Medium high tech 28.2 0.303374 8.6 32.5Medium low tech 10.8 0.303162 3.3 12.4Low tech 17.0 0.295688 5.9 22.4 Total manufacturing 26.4 1 26.4 100
There is no significant difference in the contributions to growth from the high tech
and medium high tech sectors: each contributes about 32.5 per cent of the growth in
manufacturing value added between 1981 to 1998. Taken together, the low tech and
the medium low sectors combined contributed about the same. So the slower growth
14
of medium low and low tech sectors was offset by their much larger size, and they
continue to contribute in an important way to manufacturing growth.
4.4 Variation across countries: do sectoral compositions persist? This section looks at variation across countries in the shares of high, medium and low
tech industries in manufacturing value added and GDP, at the beginning and the end
of the period 1980-1999. The key point here is that there is a substantial amount of
structural diversity between countries. The question is, does this diversity persist over
time? If the high tech argument is correct, and growth is driven by the expansion of
high tech sectors, then the distribution of industries should alter over the long run. In
the following we explore whether this happens. Here we are able to add four countries
to the 11 countries considered above, namely Canada, Germany, Greece and United
Kingdom.
Considering the two low tech sectors together, there is quite substantial variation
across the countries in the shares of the shares of these sectors in manufacturing value
added, from about 50 per cent in Germany, USA and Sweden to about 80 and even 85
per cent in Portugal and Greece, as Figure 4 shows.

15
FIGURE 4. Share of low tech and medium low tech industries in total manufacturing.
Value added in 1981 and 1998. 15 OECD countries.
40
45
50
55
60
65
70
75
80
85
90
40 45 50 55 60 65 70 75 80 85 90
Low tech and medium low tech as a share of manufacturing value added, average 1980-82, per cent
Low
tech
and
med
ium
low
tech
as
a sh
are
of m
anuf
actu
ring
valu
e ad
ded,
av
erag
e 19
97-9
9, p
er c
ent
AUT
CAN
DEN
FINFRA
GER
GRE
ITA
JAP
NOR
PRT
SPA
SWE
UK
USA
The decrease in share from 1981 to 1998 which we found for the 11 countries
combined, is found also for the individual countries. All countries lie below the 45
degree line in the figure, although a couple of them only very slightly. However there
is little difference in the relative position of the countries between the two points in
time: the countries which have a high share of low tech industries in 1981 also tend to
have a high share in 1998, and vice versa. Thus, the correlation coefficient (Pearson�s
r) between the shares in 1981 and in 1998 is very high, 0.94. This suggests a high
degree of structural persistence.
In overall GDP the share declines of these sectors are larger. The share of the low tech
industries in GDP is the product of the share of the low tech industries in
manufacturing value added and the share of manufacturing value added in GDP; since
both are falling over the period we expect to see larger share declines.

16
FIGURE 5. Share of low tech and medium low tech manufacturing industries in total
economy. Value added in 1981 and 1998. 15 OECD countries.
6
8
10
12
14
16
18
20
6 8 10 12 14 16 18 20
Low tech and medium low tech value added as a share of GDP, average 1980-82, per cent
Low
tech
and
med
ium
low
tech
val
ue a
dded
as
a sh
are
of G
DP,
ave
rage
199
7-99
, per
cen
t
AUTCAN
DEN
FIN
FRAGER
GRE
ITA
JAP
NOR
PRT
SPA
SWE
UK
USA
The general picture across the countries is that the share of manufacturing in GDP
declines, though less in Sweden and Canada. All countries are here clearly below the
45 degree line. However the correlation coefficient (Pearson�s r) between the shares
in 1981 and in 1998 is 0.83, which is still very high: so as growth proceeds,
comparative structures persist. Turning to high tech industries in Figure 6 we find a
similar picture.
17
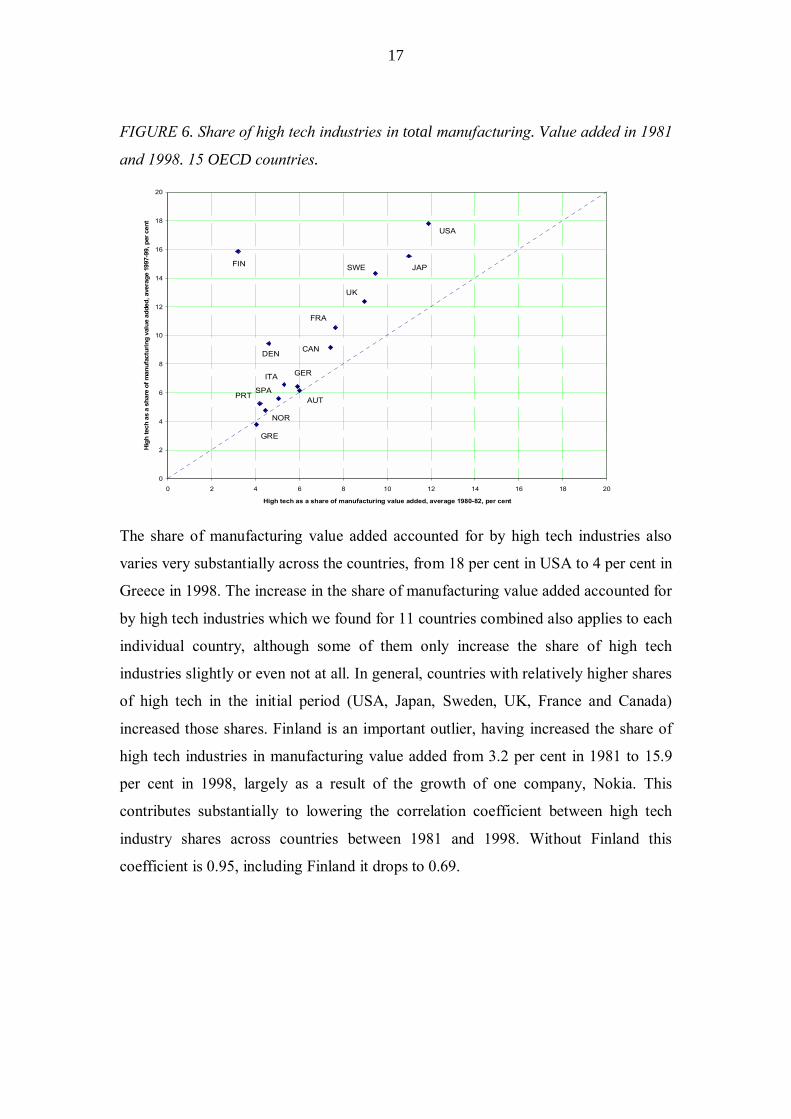
FIGURE 6. Share of high tech industries in total manufacturing. Value added in 1981
and 1998. 15 OECD countries.
0
2
4
6
8
10
12
14
16
18
20
0 2 4 6 8 10 12 14 16 18 20
High tech as a share of manufacturing value added, average 1980-82, per cent
Hig
h te
ch a
s a
shar
e of
man
ufac
turin
g va
lue
adde
d, a
vera
ge 1
997-
99, p
er c
ent
AUT
CANDEN
FIN
FRA
GER
GRE
ITA
JAP
NOR
PRTSPA
SWE
UK
USA
The share of manufacturing value added accounted for by high tech industries also
varies very substantially across the countries, from 18 per cent in USA to 4 per cent in
Greece in 1998. The increase in the share of manufacturing value added accounted for
by high tech industries which we found for 11 countries combined also applies to each
individual country, although some of them only increase the share of high tech
industries slightly or even not at all. In general, countries with relatively higher shares
of high tech in the initial period (USA, Japan, Sweden, UK, France and Canada)
increased those shares. Finland is an important outlier, having increased the share of
high tech industries in manufacturing value added from 3.2 per cent in 1981 to 15.9
per cent in 1998, largely as a result of the growth of one company, Nokia. This
contributes substantially to lowering the correlation coefficient between high tech
industry shares across countries between 1981 and 1998. Without Finland this
coefficient is 0.95, including Finland it drops to 0.69.

18
FIGURE 7. Share of high tech manufacturing industries in total economy. Value
added in 1981 and 1998. 15 OECD countries.
0
0.5
1
1.5
2
2.5
3
3.5
4
4.5
5
0 0.5 1 1.5 2 2.5 3 3.5 4 4.5 5
High tech value added as a share of GDP, average 1980-82, per cent
High
tech
val
ue a
dded
as
a sh
are
of G
DP, a
vera
ge 1
997-
99, p
er c
ent
AUT
CANDEN
FIN
FRA
GER
GRE
ITA
JAP
NOR
PRT
SPA
SWE
UK
USA
The share of high tech manufacturing industries in GDP as a whole also varies
substantially across countries, from 0.4 per cent in Greece to 3.9 per cent in Finland in
1998. For the 11 countries above combined the share of high tech in GDP increased
somewhat between 1981 and 1998. Here six countries lie below the 45 degree line,
with nine above. Again, Finland is the outlier, having increased the share of high tech
manufacturing industries in GDP from 0.9 per cent in 1981 to 3.9 per cent in 1998.
Thus the Pearson�s r correlation coeffficient between the country shares in 1981 and
1998 is 0.90 when we exclude Finland, but drops to 0.59 when Finland is included.
These high correlations between industrial structures at the beginnings and end of the
period suggest that overall growth in the OECD is not accompanied by structural
change � there is no lessening of structural diversity over time.
4.5 Does technological intensity account for economic growth? The preceding sections showed that structural change has been slow and that there are
quite persistent differences across countries in their shares of the different technology
intensity classes of industries - some economies are clearly more �high tech� than
others. Those countries which had a high share of high tech industries relative to other

19
countries in 1981 also tend to have a relatively high share in 1998. However these
points do not mean that the structural change hypothesis is wrong. It could be the case
that despite comparative structural stability, OECD growth is concentrated in those
countries that have high shares of high tech industries. So if the structural change
approach to growth is correct, countries with higher shares of high-tech in output
ought to exhibit higher growth rates within the overall panel of countries. This section
therefore asks whether economies which are characterized by a high share of high
tech industries are also the economies which have the best growth performance.
Conversely, do economies with a high share of low tech industries tend to have a
weak growth performance?
High tech shares can be linked either to the level of income or to its rate of growth.
Looking at levels first, there is indeed a relationship between technological intensity
and the level of income across national economies. Figure 8 below shows the
relationship between the share of manufacturing value added accounted for by high
tech industries in 1997 (or more precisely the average of 1996, 1997 and 1998), along
the x-axis, and the level of GDP per inhabitant in 2001 (more precisely average of
2000, 2001 and 2002), along the y-axis.
FIGURE 8. GDP per capita. Average 2000-2002, 1995 US dollars (y-axis); share of
high tech industries in manufacturing value added. Average 1996-1998 (x-axis).
0
5000
10000
15000
20000
25000
30000
35000
0 2 4 6 8 10 12 14 16 18 20
Share of high tech industries in manufacturing value added, average 1996-98, per cent
GD
P pe
r inh
abita
nt, a
vera
ge 2
000-
2002
, 199
5 U
S do
llars
, pur
chas
ing
pow
er p
ariti
es
AUT
BEL
CAN
CZE
DEN
FINFRAGER
GRE
ITA JAP
NL
NOR
PRT
SPA
SWE
UK
USA

20
The (Pearson�s r) correlation coefficient is here 0.65, significant at the 1 per cent
level. Thus, the higher the share of high tech industries in manufacturing value added,
the higher is GDP per inhabitant. There are of course important questions to raise
about the causal links here. The basic issue is which way the causality runs, since high
tech industries (in particular aerospace, ICT, and pharmaceuticals) have in practice
been created via substantial government support, and have invariably been initiated by
substantial publicly-supported R&D infrastructures (Mowery and Rosenberg, 1989,
and Bruland and Mowery, 2004 provide good overviews of the histories of this).
There may therefore be a pattern of causality that runs from high levels of income, to
government budgetary positions, to the creation of industries � that is, some R&D-
intensive industries may be a consequence of high income, not a cause of it.
Be that as it may, we do not find any such relationship when we compare the high
tech share in manufacturing value added with the rate of growth of GDP per
inhabitant. How do high tech shares, in the early 1990s, relate to growth performance
over the decade of the 90s as a whole? This is illustrated in Figure 9.
FIGURE 9. Annual compound growth rate in GDP per capita. 1991-2001.
Percentages (y-axis); share of high tech industries in manufacturing. Value added.
Average 1991-1995. Percentages (x-axis).
0
0.5
1
1.5
2
2.5
3
3.5
0 2 4 6 8 10 12 14 16 18
Share of high tech industries in manufacturing value added, average 1991-95, per cent
Year
ly g
row
th in
GD
P pe
r inh
abita
nt 1
991-
2001
, per
cen
t
AUT
CAN
DEN
FIN
FRAGER
GRE
ITA
JAP
NL
NOR
PRT
SPA
SWE
UK
USA
21
In fact, the correlation coefficient (Pearson�s r) is negative, �0.28, and moreover is
not statistically significant (p-value 0.29). Considering the same linear relationship
for the whole period 1980-2001 the correlation coefficient (Pearson�s r) is - 0.03 and
not significant. We cannot conclude, therefore, that high tech economies are also the
high growth economies.
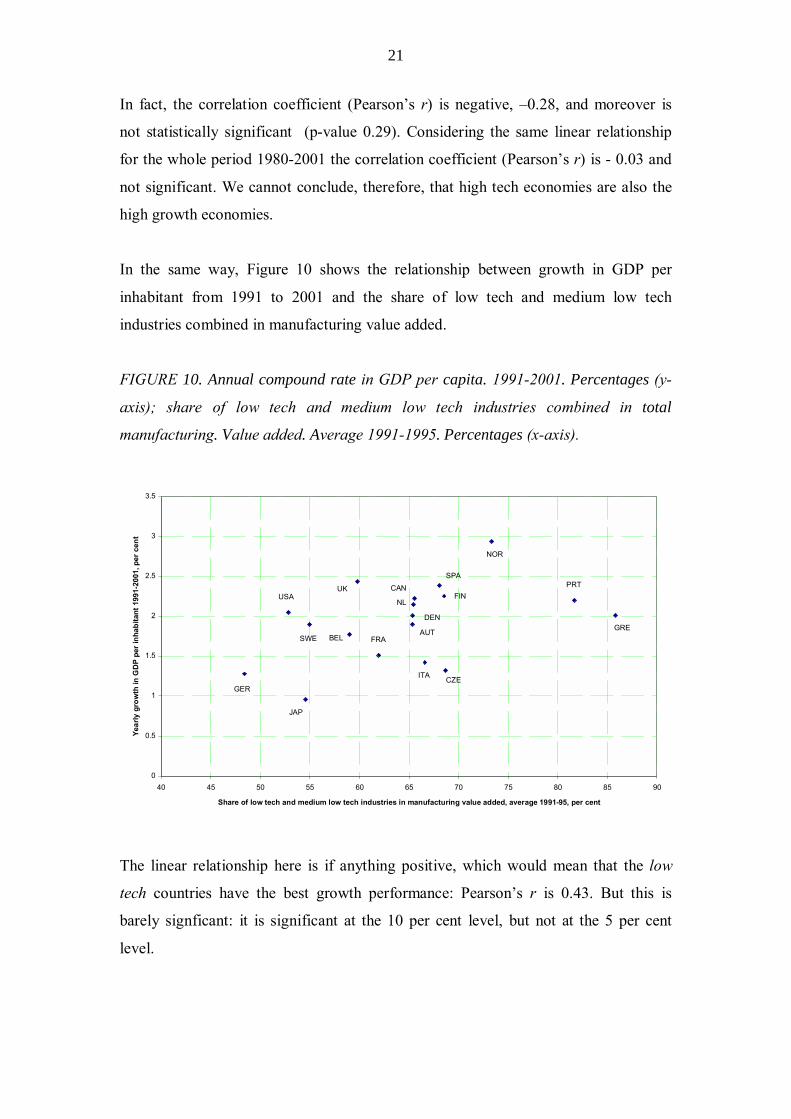
In the same way, Figure 10 shows the relationship between growth in GDP per
inhabitant from 1991 to 2001 and the share of low tech and medium low tech
industries combined in manufacturing value added.
FIGURE 10. Annual compound rate in GDP per capita. 1991-2001. Percentages (y-
axis); share of low tech and medium low tech industries combined in total
manufacturing. Value added. Average 1991-1995. Percentages (x-axis).
0
0.5
1
1.5
2
2.5
3
3.5
40 45 50 55 60 65 70 75 80 85 90
Share of low tech and medium low tech industries in manufacturing value added, average 1991-95, per cent
Year
ly g
row
th in
GD
P pe
r inh
abita
nt 1
991-
2001
, per
cen
t
AUTBEL
CAN
CZE
DEN
FIN
GER
GRE
ITA
FRA
JAP
NL
NOR
PRTSPA
SWE
UKUSA
The linear relationship here is if anything positive, which would mean that the low
tech countries have the best growth performance: Pearson�s r is 0.43. But this is
barely signficant: it is significant at the 10 per cent level, but not at the 5 per cent
level.
22
Looking at the linear relationship between annual compound growth rate of GDP per
capita in a 22 year period (1980-2001) and the shares of low tech and medium low
tech value added combined in total manufacturing (average 1991-1995) we find again
a correlation coefficient +0.08, which is not significant. Thus, the important point
here is the absence of any convincing evidence for a hypothesis that low tech
economies are low growth economies. If anything, there is weak evidence in the data
that low tech economies are higher growth economies than the high tech economies.
We do find a very clear relationship between the share of GDP accounted for by
manufacturing as a whole in the period 1991-1995 and growth in GDP per inhabitant
from 1991 to 2001. The correlation coefficient is here � 0.73, significant at the 0.1 per
cent level. That is, the higher the initial-period share of manufacturing in GDP, the
lower the growth rate of GDP per inhabitant from 1991 to 2001. Thus, if we look at
the relationship between the share of low tech and medium low tech manufacturing
industries combined not only in manufacturing value added but in GDP as a whole in
1991-1995, on the one hand, and growth in GDP per inhabitant from 1991 to 2001, on
the other, we find a slightly negative (r= -0.33) but not significant relationship. This
seems to reflect primarily the manufacturing share and not low tech as such. Thus, if
we in the same way look at the relationship between the share of high tech
manufacturing industries in total GDP and growth in GDP per inhabitant, we find a
more negative (r= -0.48) and a weakly significant relationship (significant at the 10
per cent but not at the 5 per cent level).
This overview suggests something of the complexity of attempting to link industry
technology intensity to income levels and growth rates. The key point to emerge,
however, is that there is no convincing support for structural change growth models
resting on high tech industries.
4.6 Productivity trends, 1981-99
In the following we use a simple measure of productivity, namely value added per
person employed in manufacturing in the 11 OECD countries combined. Again value
added is measured in constant 1995 US dollars.

23
FIGURE 11. Value added per person employed. 11 OECD countries combined. Value
added in constant 1995(thousand) US dollars. 1980-1999.
0
20
40
60
80
100
120
1980 1981 1982 1983 1984 1985 1986 1987 1988 1989 1990 1991 1992 1993 1994 1995 1996 1997 1998 1999
Thou
sand
199
5 U
S do
llars
per
per
son
empl
oyed
High tech
Mediumhigh tech
Medium lowtech
Low tech
Here there is a clear result: the higher the technological intensity, the higher the level
of value added per person employed. However, Figure 12 displays a more
complicated picture.
24
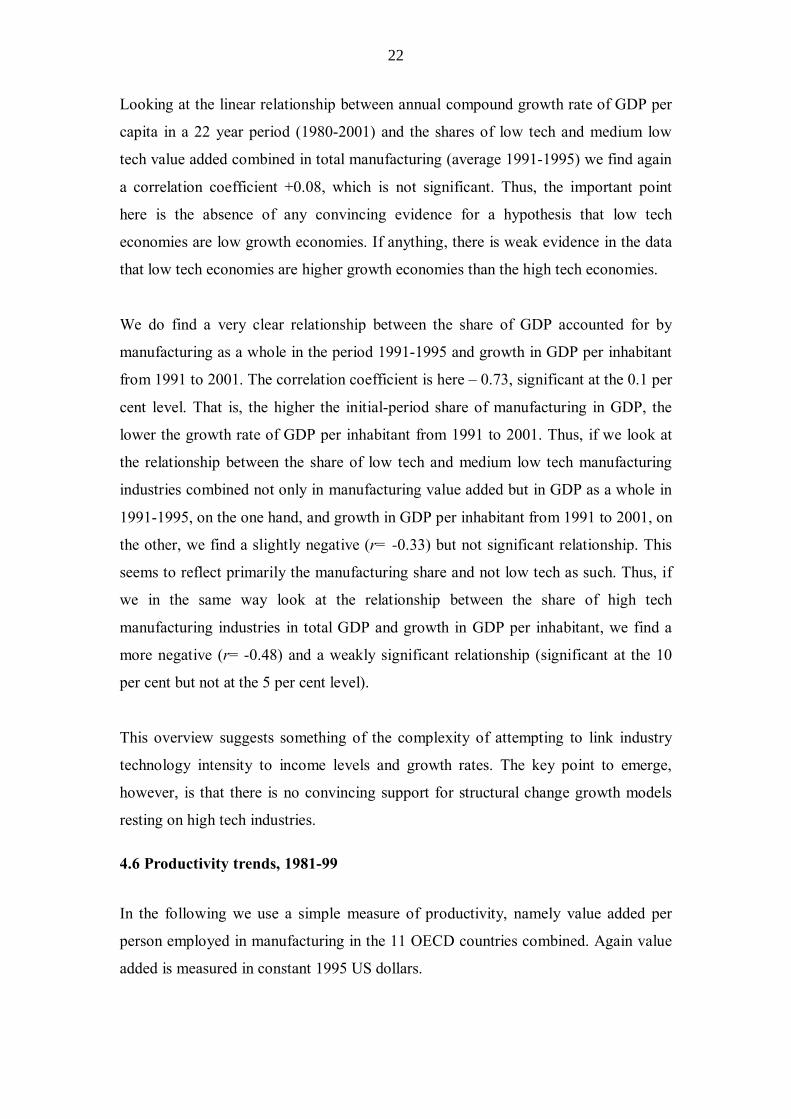
FIGURE 12. Value added per person employed. 11 OECD countries combined. Value
added in constant 1995 US dollars. 1980-1999. 1980=1.
0.8
1
1.2
1.4
1.6
1.8
2
2.2
1980 1981 1982 1983 1984 1985 1986 1987 1988 1989 1990 1991 1992 1993 1994 1995 1996 1997 1998 1999
1995
US
dolla
rs p
er p
erso
n em
ploy
ed, 1
980=
100 High tech
Mediumhigh tech
Mediumlow tech
Low tech
The high tech industries have by far the fastest productivity development measured as
constant 1995 US dollars as indices with 1980 as a benchmark. The medium low tech
industries have the slowest growth. The medium high tech and the low tech industries
lie in between, with almost the same growth rate trend from 1981 to 1998. The high
tech industries have a productivity growth of 3.5 per cent per year, while the medium
low tech industries have a productivity growth of 1.2 per cent per year. The medium
high tech and the low tech industries have a productivity growth of about 1.9 per cent
per year during this period. We turn now to how the growth and productivity trends
affect employment.
4.7 Manufacturing employment 1980-1999
If we compare growth rates in productivity to growth rates in value added, we find
that only for the high tech industries does the positive effect on employment from
growth of production outweigh the negative effect on employment from the growth of
productivity. This is shown in the figure below.

25
FIGURE 13. Number of persons engaged (in million employees). 1980-1998. 11
OECD countries combined.
0
5
10
15
20
25
1980 1981 1982 1983 1984 1985 1986 1987 1988 1989 1990 1991 1992 1993 1994 1995 1996 1997 1998 1999
Mill
ion
empl
oyed
High tech
Mediumhigh tech
Mediumlow tech
Low tech
Figure 13 shows that the high tech industries have growth in employment during the
period, but this growth is very small. The other three categories have decreases in
employment, and the decreases are larger the lower the technological intensity. For
high tech industries we have altogether a growth in employment from 1981 to 1998 of
181,000 persons or 4.2 per cent, from 4.32 million to 4.50 million. The medium high
tech industries have a decline of 850,000 persons or 6.2 per cent, from 13.7 million to
12.9 million. For the medium low tech industries employment decreases by 1.4
million persons or 9.5 per cent, from 14.9 million to 13.5 million employed. Finally,
employment in the low tech industries decreases by 2.5 million persons or 13.1 per
cent, from 19.2 million to 16.7 million. Altogether, employment in manufacturing
decreases by 4.6 million persons or 8.8 per cent in these 11 countries, from 52.2
million to 47.6 million. Once again, however, we face questions about just how
substantial these changes are, since the declines in employment are slow, and the
employment levels are persistent, as Figure 14 below indicates.
26
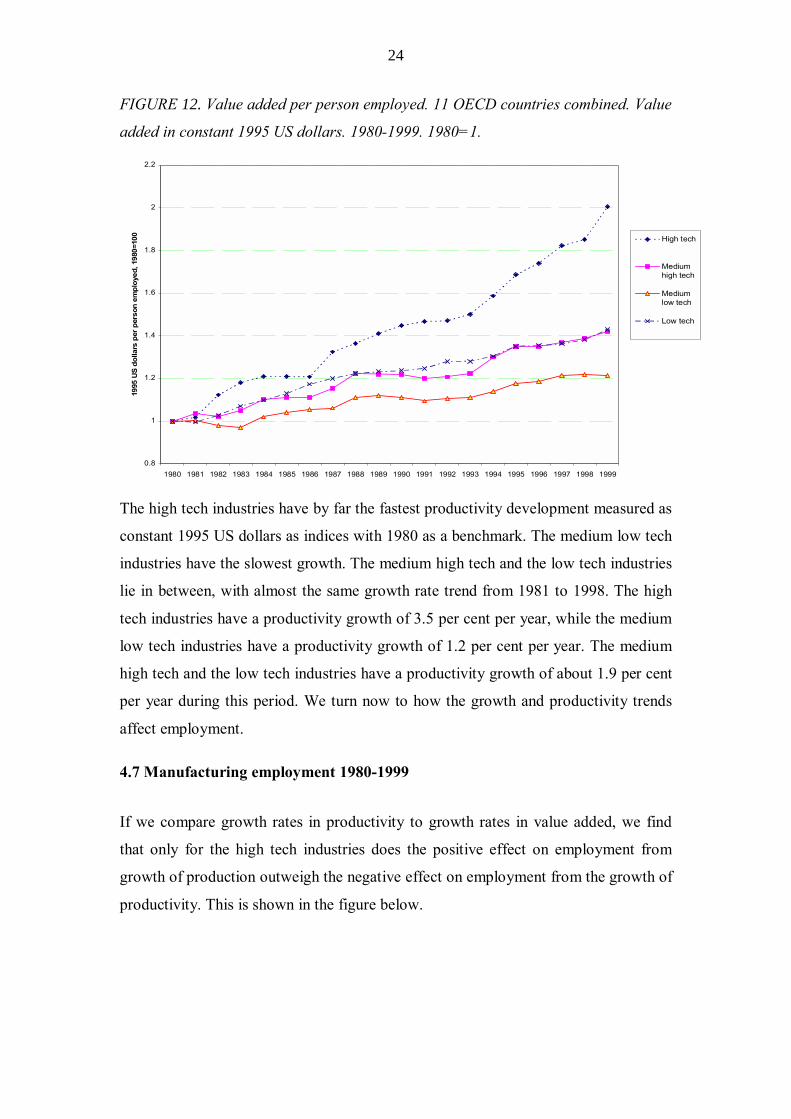
FIGURE 14. Shares of employment in total manufacturing. 1980-1999. 11 OECD
countries combined.
0
5
10
15
20
25
30
35
40
1980 1981 1982 1983 1984 1985 1986 1987 1988 1989 1990 1991 1992 1993 1994 1995 1996 1997 1998 1999
Shar
e of
man
ufac
turin
g em
ploy
men
t, pe
r cen
t
High tech
Mediumhigh tech
Medium lowtech
Low tech
In terms of shares, high tech industries increase their share of employment in
manufacturing from 8.3 per cent in 1981 to 9.5 per cent in 1998. The low tech and
medium low tech industries combined decreased their share of manufacturing
employment from 65.4 per cent in 1981 to 63.5 per cent in 1998. Over a twenty year
period, these are marginal differences in employment shares in manufacturing � so
employment shares persist in such industries in the OECD.
However while employment in manufacturing as a whole decreases by 8.8 per cent
from 1981 to 1998, employment in the whole economy of the 11 countries combined
increased by 50.2 million persons or 20.8 per cent, from 241.5 million to 291.7
million. This means that all four manufacturing categories decreased their share in
total economy employment, as Figure 15 shows:
27
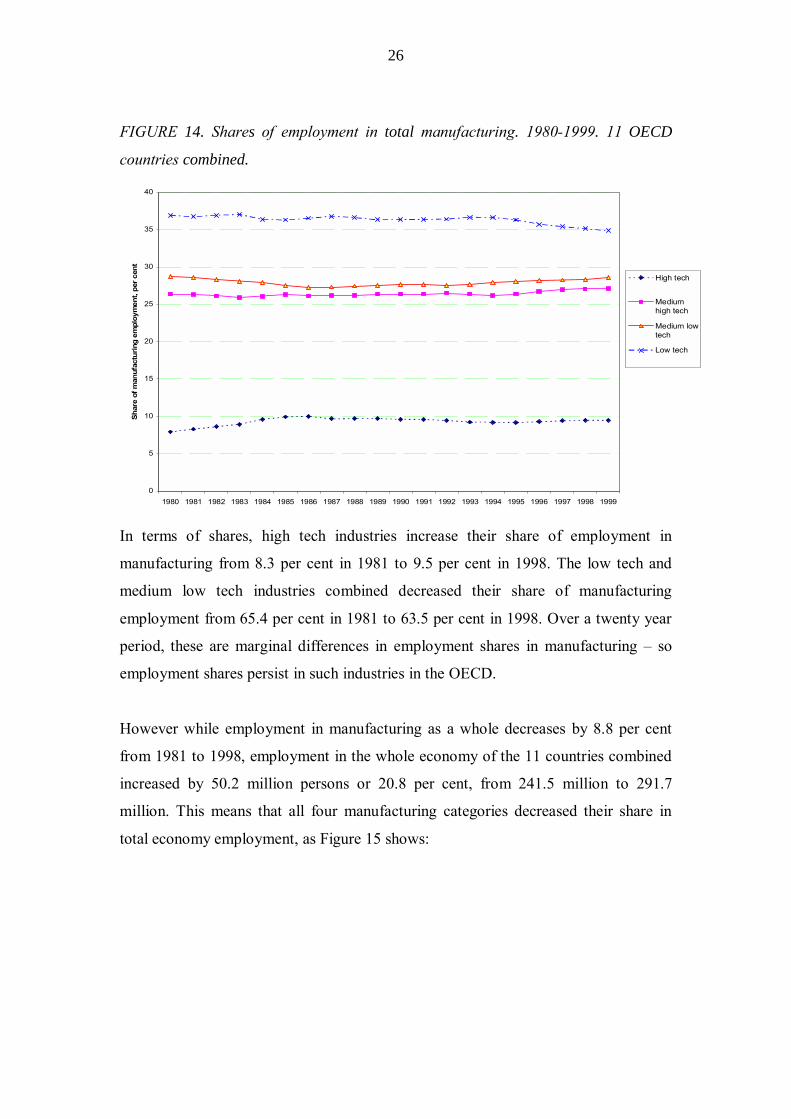
FIGURE 15. Shares of employment in total economy. 1980-1999. 11 OECD
countries.
0
1
2
3
4
5
6
7
8
9
1980 1981 1982 1983 1984 1985 1986 1987 1988 1989 1990 1991 1992 1993 1994 1995 1996 1997 1998 1999
Shar
e of
tota
l eco
nom
y em
ploy
men
t High tech
Mediumhigh tech
Mediumlow tech
Low tech
Manufacturing as a whole exhibits a declining share of employment from 21.6 to 16.3
per cent. The two manufacturing low tech categories together show declining shares
of total employment from 14.1 per cent in 1981 to 10.4 per cent in 1998. The high
tech manufacturing industries� share of total employment goes slightly down from a
quite low level of 1.8 per cent in 1981 to 1.5 per cent in 1998. Taking the growth,
productivity and employment data together, the slower growth of both output and
productivity in medium and low tech sectors means that productivity growth in these
sectors translates into very slowly declining levels of employment; and � in the
context of service sector growth � sharply falling shares of total employment.
However it is important to note that the persistent employment levels in both low tech
and manufacturing as a whole suggest that structural change is not a replacement
process: that is, as service activities grow, they increase their weight in the economy,
but manufacturing is not replaced as an activity.
In the same way as for value added above, the share of the different classes of
manufacturing industries, and the development in these shares over the period in
question, vary across countries. The share of the two low tech categories in
manufacturing employment in 1998 varies from 57 per cent in Sweden to 85 per cent
28
in Portugal. In the 11 countries combined the share falls from 1981 to 1998, just as
with output. This is also the case for most of the individual countries, although in a
couple of countries there is no change or a very slight increase. The correlation
between the shares in 1981 and 1998 is very high, with a Pearson�s r of 0.91. The
shares of the low tech and medium low tech manufacturing industries in total
economy employment also vary. In 1998 the variation in the share of low tech and
medium low tech manufacturing industries in total employment is from 8.1 per cent in
the USA to 17.7 per cent in Portugal. This share dropped in all of the countries from
1981. However the correlation between the shares in 1981 and 1998 is very high, with
a Pearson�s r of 0.96.
In 1998 the share of the high tech industries in manufacturing employment varies
from 2.9 per cent in Portugal to 11.5 per cent in Japan. For the 11 countries combined
we saw that this share increased from 1981 to 1998. For the individual countries,
about half of them exhibit little change during this period, while for the other half this
share increases. Again Finland is an outlier, with an increase from 2.8 per cent to 9.2
per cent. The Pearson�s r correlation between the country shares in 1981 and 1998 is
0.76, but if we exclude Finland it rises to 0.94.
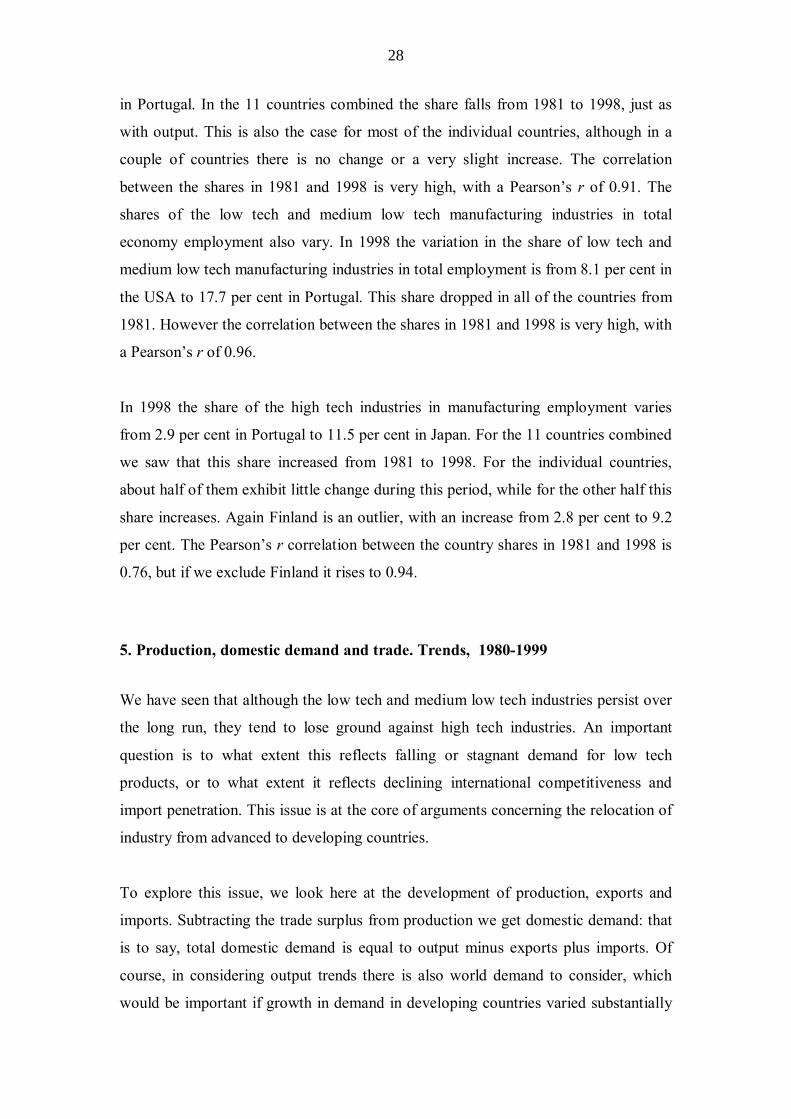
5. Production, domestic demand and trade. Trends, 1980-1999
We have seen that although the low tech and medium low tech industries persist over
the long run, they tend to lose ground against high tech industries. An important
question is to what extent this reflects falling or stagnant demand for low tech
products, or to what extent it reflects declining international competitiveness and
import penetration. This issue is at the core of arguments concerning the relocation of
industry from advanced to developing countries.
To explore this issue, we look here at the development of production, exports and
imports. Subtracting the trade surplus from production we get domestic demand: that
is to say, total domestic demand is equal to output minus exports plus imports. Of
course, in considering output trends there is also world demand to consider, which
would be important if growth in demand in developing countries varied substantially

29
across the technological intensity categories, but we do not have data on this at the
moment. However such issues are not of central concern here. The �hollowing out�
theory of structural change requires that there should be an increasing gap between
domestic demand and domestic production on medium-low and low tech industries,
with rising trade deficits over time in these industries, and substantial import
penetration in the long run.
Looking first at the medium low tech industries, for the OECD group as a whole,
Figure 16 shows that production seems to follow domestic demand quite closely: by
far the largest part of domestic demand is provided by domestic production. Between
1981 and 1998 production declined somewhat, by 9.5 per cent, while domestic
demand declined by 7.9 per cent. Production would have had to decline by only 8.0
per cent if the trade balance was not to worsen. The actual decline of production of
1.5 percentage points more than this thus expresses a widening of the trade balance.
The trade deficit in the medium low tech industries showed a change from 0.3 per
cent of domestic demand in 1981, to 1.9 per cent in 1998. However a change in the
trade balance equivalent to 1.6 percent of consumption over an eighteen year period is
hardly dramatic. Therefore this sector at least shows no signs of significant import
penetration. Both exports and imports grew throughout the period, by 23.6 and 36.6
per cent, respectively. The average of exports and imports as a proportion of domestic
demand thus grew from 11.2 per cent to 15.8 per cent: trade becomes marginally more
important over time, but there is little sign of major relocation or changes in sources
of supply.

30
FIGURE 16. Production, exports, imports and domestic demand in medium low tech
industries 1980-1998, 11 OECD countries combined. Billion 1995 US dollars.
0
500
1000
1500
2000
2500
3000
1980 1981 1982 1983 1984 1985 1986 1987 1988 1989 1990 1991 1992 1993 1994 1995 1996 1997 1998 1999
Bill
ion
1995
US
dolla
rs
Production
Domesticdemand
Exports
Imports
In the low tech industries too, production seems to follow inland demand closely.
Production increases by 11.4 per cent from 1981 to 1998, while inland demand by
14.4 per cent. To cover the growth in demand production would have had to grow by
14.5 per cent. In fact it grows by 3.1 percentage points less than this, with an
equivalent widening of the trade balance.

31
FIGURE 17. Production, exports, imports and domestic demand in low tech
industries 1980-1998, 11 countries combined. Billion 1995 US dollars.
0
500
1000
1500
2000
2500
3000
1980 1981 1982 1983 1984 1985 1986 1987 1988 1989 1990 1991 1992 1993 1994 1995 1996 1997 1998 1999
Bill
ion
1995
US
dolla
rs
Production
Domesticdemand
Exports
Imports
In 1981 the low tech industries had a trade deficit of 1.2 per cent of domestic demand,
which by 1998 had grown to 3.7 per cent. Both exports and imports grew during this
period, exports by 61.3 per cent, imports by 84.7 per cent. The average of exports and
imports as a proportion of domestic demand has grown from 9.5 per cent in 1981 to
14.5 per cent in 1998. The level of trade is thus about the same as in the medium low
tech industries.
In conclusion, the differences in growth rates of production across the four
manufacturing tech classes seem to be closely mirrored by differences in the growth
of domestic demand. There has been a certain widening of the trade balance in the
medium low and low tech sectors, but this is by no means sufficient to explain such
structural change as has occurred, and hence there is no evidence to support the
�hollowing out� hypothesis,
32
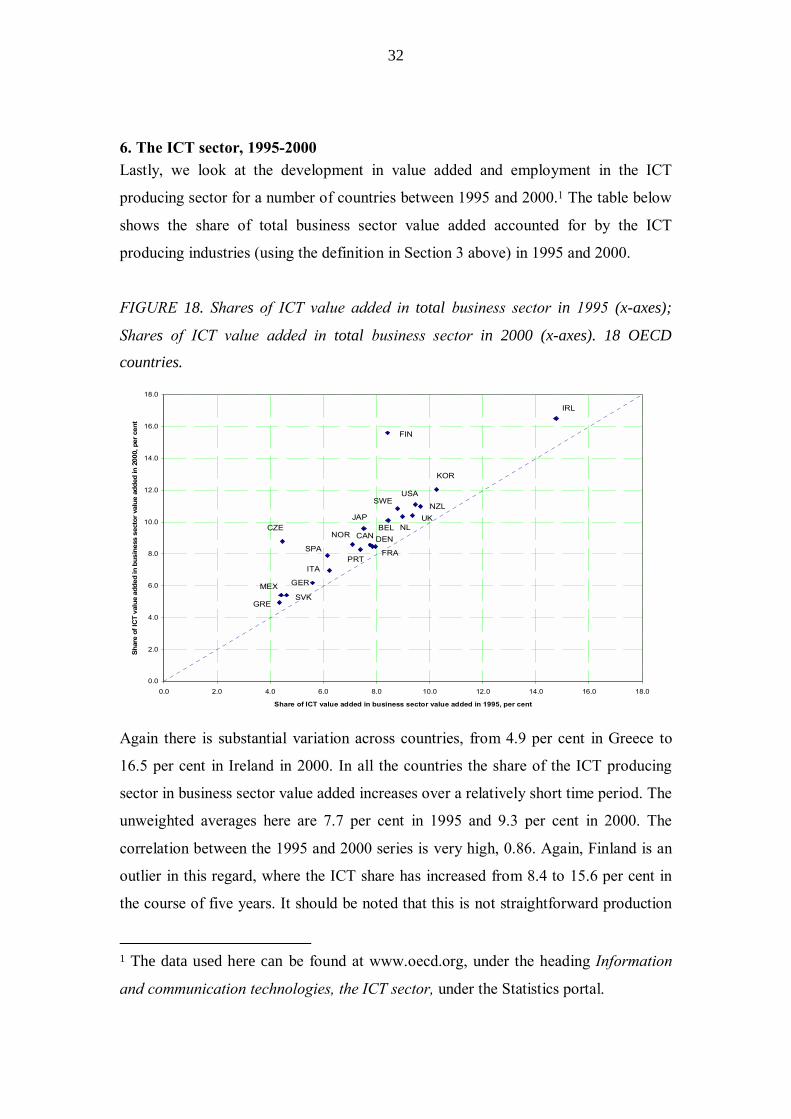
6. The ICT sector, 1995-2000 Lastly, we look at the development in value added and employment in the ICT
producing sector for a number of countries between 1995 and 2000.1 The table below
shows the share of total business sector value added accounted for by the ICT
producing industries (using the definition in Section 3 above) in 1995 and 2000.
FIGURE 18. Shares of ICT value added in total business sector in 1995 (x-axes);
Shares of ICT value added in total business sector in 2000 (x-axes). 18 OECD
countries.
0.0
2.0
4.0
6.0
8.0
10.0
12.0
14.0
16.0
18.0
0.0 2.0 4.0 6.0 8.0 10.0 12.0 14.0 16.0 18.0
Share of ICT value added in business sector value added in 1995, per cent
Shar
e of
ICT
valu
e ad
ded
in b
usin
ess
sect
or v
alue
add
ed in
200
0, p
er c
ent
IRL
FIN
KOR
USA
NZLSWE
UKNL
JAPCZE
NORBEL
CAN DEN
FRAPRT
SPA
ITA
GER
SVKMEX
GRE
Again there is substantial variation across countries, from 4.9 per cent in Greece to
16.5 per cent in Ireland in 2000. In all the countries the share of the ICT producing
sector in business sector value added increases over a relatively short time period. The
unweighted averages here are 7.7 per cent in 1995 and 9.3 per cent in 2000. The
correlation between the 1995 and 2000 series is very high, 0.86. Again, Finland is an
outlier in this regard, where the ICT share has increased from 8.4 to 15.6 per cent in
the course of five years. It should be noted that this is not straightforward production
1 The data used here can be found at www.oecd.org, under the heading Information
and communication technologies, the ICT sector, under the Statistics portal.
33
data. As noted above, it also included wholesale distribution of electrical products,
presumably because this gives some guide to activities that diffuse ICT equipment;
(but this category also includes many non ICT products).
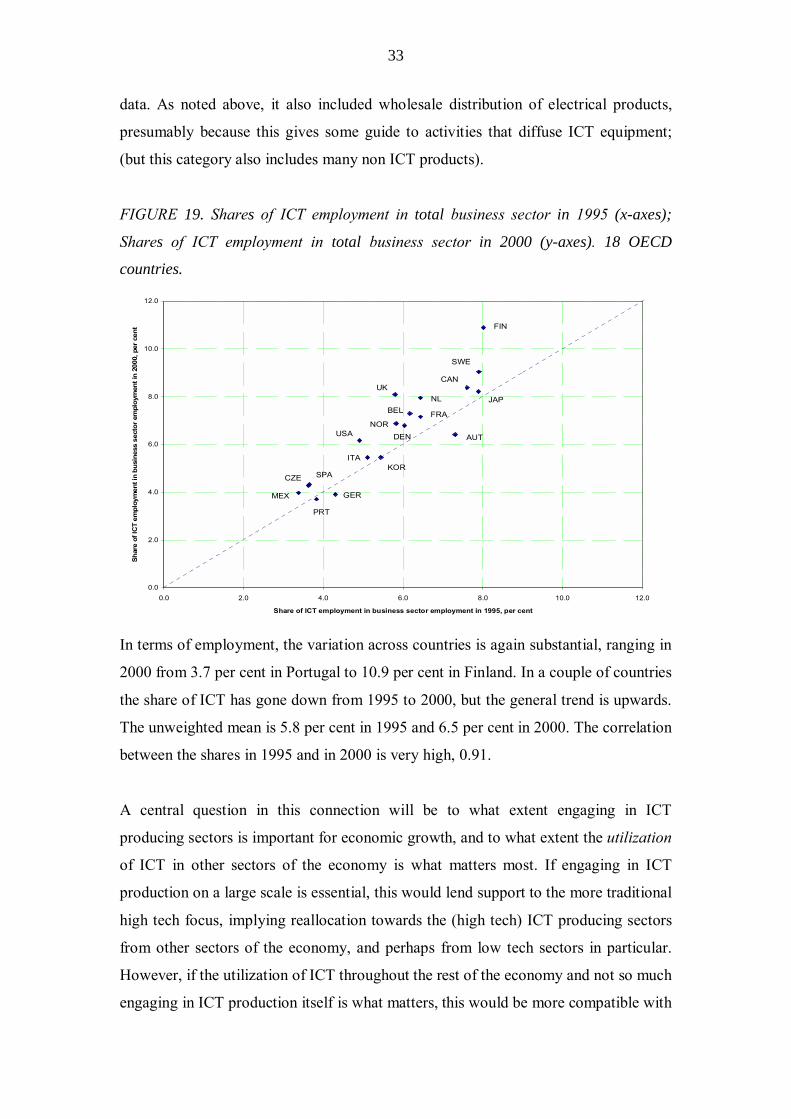
FIGURE 19. Shares of ICT employment in total business sector in 1995 (x-axes);
Shares of ICT employment in total business sector in 2000 (y-axes). 18 OECD
countries.
0.0
2.0
4.0
6.0
8.0
10.0
12.0
0.0 2.0 4.0 6.0 8.0 10.0 12.0
Share of ICT employment in business sector employment in 1995, per cent
Shar
e of
ICT
empl
oym
ent i
n bu
sine
ss s
ecto
r em
ploy
men
t in
2000
, per
cen
t FIN
SWE
CAN
JAPUK
NLBEL FRA
NORDEN AUTUSA
KORITA
CZE SPA
MEX GER
PRT
In terms of employment, the variation across countries is again substantial, ranging in
2000 from 3.7 per cent in Portugal to 10.9 per cent in Finland. In a couple of countries
the share of ICT has gone down from 1995 to 2000, but the general trend is upwards.
The unweighted mean is 5.8 per cent in 1995 and 6.5 per cent in 2000. The correlation
between the shares in 1995 and in 2000 is very high, 0.91.
A central question in this connection will be to what extent engaging in ICT
producing sectors is important for economic growth, and to what extent the utilization
of ICT in other sectors of the economy is what matters most. If engaging in ICT
production on a large scale is essential, this would lend support to the more traditional
high tech focus, implying reallocation towards the (high tech) ICT producing sectors
from other sectors of the economy, and perhaps from low tech sectors in particular.
However, if the utilization of ICT throughout the rest of the economy and not so much
engaging in ICT production itself is what matters, this would be more compatible with
34
continued involvement also in low tech industries, provided these industries are
continuously transformed through the utilization of ICT. According to Boyer,
intensity of ICT utilization seems to be the crucial factor here (Boyer, 2004: 2, 25),
not ICT production. This is also the conclusion reached in an IMF working paper by
Bayoumi and Haacker (2002).
Amable and Petit (2003) also make the point of different countries pursuing different
growth models. They seek to explain differences in macroeconomic performance
across countries using a range of econometric models. Along with variables
expressing institutional and more traditional macroeconomic conditions, they have
two variables on ICT-producing and ICT-using sectors, respectively. The main
conclusion of this empirical work is that the findings are fragile, something which
they attribute to the heterogeneity of growth models across countries. (Amable and
Petit 2003: 222-226).
We find no particular links between ICT and growth. Although we do not report the
results here, we examined the correlation between the same economic growth
variables and a number of indicators of ICT production and ICT use in different
countries. These include share of the ICT sector in business sector value added, share
of ICT sector in business sector employment, investment in ICT as a proportion of
gross fixed capital formation, share of ICT employment in business sector services
employment, ICT expenditures as a proportion to GDP 1999. Some of these variables
are measured both in 1995 and 2000, which means that we also have a measure for
the change in some of these magnitudes. We found at best a weak confirmation of a
positive relationship at the national economy level between the intensity of ICT
production and ICT utilization, on the one hand, and the growth variables, on the
other. Most of the coefficients were weakly positive, but only a few were statistically
significant.
Figure 20 provides an example for the weak relationship between ICT shares of total
business value added and the annual compound growth rate in GDP per per capita.
The figure displays no correlation between these two variables.

35
FIGURE 20. Shares of ICT industries� value added in total business sector (x-axes)
Annual compound growth rate in GDP pr capita. 1991-2001 (y-axes).
0
0.5
1
1.5
2
2.5
3
3.5
4 5 6 7 8 9 10
Share of ICT value added in business sector value added, per cent, 1995
Year
ly g
row
th in
GD
P pe
r inh
abita
nt 1
991-
2001
, per
cen
t
BEL
CAN
CZE
DEN
FIN
FRA
GER
GRE
ITA
JAP
NL NZ
NOR
PRTSPA
SWE
UK
USA
7. Conclusions Advocates of high tech approaches to economic growth have often avoided even the
most cursory reference to quantitative evidence, and so it is important to confront the
claims of high tech approaches with the evidence. In the countries examined here
there has been a clear tendency for the share of low tech industries in manufacturing
to decline during the period 1980-1999, while the share of high tech industries has
increased. This applies to both production (whether value added or gross production)
and employment. However, these changes do not appear to be dramatic. We conclude
that among the OECD countries studied here, structural change within manufacturing
is not a key feature of the growth process. However there has been structural change
at the level of the economy as a whole, with a sustained rise in the share of services
(both public and private). Of course this change does not support the structural change
view of growth, since services tend to be considerably less R&D intensive than
manufacturing.
An important conclusion of this work that there is substantial variation across the
countries when it comes to the shares of output and employment accounted for by
high tech industries - there are quite different sectoral mixes that persist over time. In

36
this context we found no evidence of any simple relationship between technological
intensity of the industrial structure and economic growth at the total economy level.
There is no simple relationship to the effect that the high tech economies are also the
high growth economies. This suggests that different economies can follow different
routes to economic growth. Countries play different roles in an economic system
which is differentiated at the international level, and in which there is a division of
labour among the highly developed economies.
Our analysis suggests that while new sectors emerge within the economy, and some
sectors disappear, this does not account for the processes of growth which actually
occur across the OECD. The growth trajectories of the advanced economies seem to
rest as much on such sectors as engineering, food, wood products, and vehicles and so
on, as they do on such sectors as ICT or biotech. Medium and low tech industries have
persisted over the past decades despite the claims that we are undergoing a kind of
structural revolution. We would hypothesize that they are unlikely to disappear in the
future either. Why is this? Our argument would be that these industries are far more
dynamic and innovative than usually believed. Our view, which is spelled out in other
chapters in this book, is that the persistence of low and medium tech industries derives
from the fact that innovation in advanced economies has two broad but separate
dimensions. On the one hand there are science-based or at least R&D-based
innovations that create new industries or activities by opening up technological and
commercial opportunities. Aerospace, ICT, and pharmaceuticals fall into this category.
On the other hand, there are innovation processes that technologically upgrade existing
industries and activities. Such changes are often ignored because of asymmetric
attention by analysts to arbitrarily selected new technologies. However technological
upgrading in medium and low tech industries is pervasive and can be both incremental
and radical. Incremental change upgrades and endogenously changes industries over
the long run. Radical innovations in medium and low tech activities, such as the
container revolution, or new forms of adhesives, or new materials in textiles and
clothing, can have important growth impacts. We argue that the persistence of low and
medium tech industries suggests the need for much closer attention to the both of these
forms of innovation, and we hypothesize that these industries survive in the OECD
economies because they exemplify such omnipresent forms of innovation and
knowledge creation. This implies that growth is primarily based not on the creation of
37
new sectors but on the internal transformation of sectors which already exist.
Overemphasizing the role of high tech activities high tech ignores this major
dimension of change in advanced economies.
There are those who would agree with the broad views expressed here, but argue that
innovation and growth in medium and low tech industries is nevertheless shaped by
high tech sectors, because high tech sectors supply intermediate and capital inputs that
embody the knowledge intensity of high tech. Without entering these arguments in
detail, we would raise objections resting on the fact that only one high tech sector
really supplies inputs to a wide range of other sectors, and that is ICT. There is no
question that the incorporation of ICT components into medium or low tech products
and processes is a key element of innovation within those sectors at the present time.
However this is only one element of innovation in such sectors, and we would argue
that medium and low tech innovation simply cannot be reduced to the use of ICT.
More significantly, there is a causality issue here as well: medium and low tech
sectors may not be passive recipients of ICT, but via their complex demands for
inputs may actually be the shaping force behind the development of ICT as a
technology and industry. This is the approach taken in Pol, Carroll, and Robertson
(2002), and considerably further developed in their chapter in this book. Their
argument is that there are strong interactions between industries, as well as pervasive
innovation across them, creating backward and forward linkages that should be seen
in an integrated way. In this framework it is the innovative capacity of industries
receiving high tech inputs that shapes both high tech growth and overall growth. We
would argue that only such an approach can explain the growth and trade trends that
have been explored in this chapter. The combined arguments of these chapters
suggest that medium and low tech industries continue to play a key role in the
technological evolution of the advanced economies, a role that will be maintained in
the future.
38
References
Amable, B.; Petit, P. 2003, The diversity of social systems of innovation and production during the 1990s. In: Institutions, Innovation and Growth, ed.J.-P. Touffut, Cheltenham, UK: Edward Elgar. Bassanini, A.; Scarpetta, S.; Visco, I. 2000, Knowledge, technology and economic growth: Recent evidence from OECD countries. Economic Department Working Papers, no. 259, OECD. Bayoumi, T.; Haacker, M. 2002, It�s not what you make,it�s how you use IT: Measuring the welfare benefits of the IT revolution across countries. IMF Working Paper WP/02/117. Boyer, R. 2004, New growth regimes, but still institutional diversity. Socio-Economic Review, vol. 2 (1), 1-32. Bruland, K., and Mowery, D., (2004) �Innovation through time� in J.Fagerberg, D. Mowery and R. Nelson (eds) The Oxford Handbook of Innovation (Oxford: OUP) Fagerberg, J., Guerreri, P., and Verspagen, B., (1999), The Economic Challenge for Europe: adapting to innovation-based growth (Cheltenham: Edward Elgar) Freeman, C. 2001, A hard landing for the �New Economy�? Information technology and the United States national system of innovation. Structiral Change and Economic Dynamics, vol. 12 (2), 115-139. Christopher Freeman and Francisco Loucã: As Time Goes By. From the Industrial Revolutions to the Information Revolution (Oxford: Oxford University Press) 2001 Hatzichronoglou, T. 1997, Revision of the high-technology sector and product classification. STI Working Papers, 1997/2, OECD. Kuznets, S., 1959, Economic Change: Selected essays in business cycles, national income and economic growth (London: Heineman) Mowery, D., and Rosenberg, N., Technology and the Pursuit of Economic Growth (Cambridge: CUP) OECD, 1986, OECD Science and Technology Indicators, No 2: R&D, Innovation and Competitiveness, (OECD:Paris) OECD, 2001, The New Economy. Beyond the Hype. The OECD Growth Project (OECD: Paris)

39
Pilat, D.; Devlin, A. 2004, The diffusion of ICT in OECD economies, in The economic impact of ICT, ed.ECD, Paris: OECD. Pol, E., Carroll, P., and Robertson, P., �A New Typology for Economic Sectors With a View to Policy Implications�. Economics of Innovation and New Technology, Vol 11 No 1, 2002.