Structural Basis of SOSS1 Complex Assembly and · PDF fileCell Reports, Volume 6 Supplemental...
14
Cell Reports, Volume 6 Supplemental Information Structural Basis of SOSS1 Complex Assembly and Recognition of ssDNA Wendan Ren, Hongxia Chen, Qiangzu Sun, Xuhua Tang, Siew Choo Lim, Jun Huang, and Haiwei Song
Transcript of Structural Basis of SOSS1 Complex Assembly and · PDF fileCell Reports, Volume 6 Supplemental...

Cell Reports, Volume 6
Supplemental Information
Structural Basis of SOSS1 Complex
Assembly and Recognition of ssDNA
Wendan Ren, Hongxia Chen, Qiangzu Sun, Xuhua Tang, Siew Choo Lim, Jun Huang, and
Haiwei Song

SUPPLEMENTARY EXPERIMENTAL PROCEDURES
Protein expression and purification
The N-terminal region of SOSSA (residues 1-500; SOSSAN) was cloned into the
pGEX6p-1 vector and the full length SOSSB1 was inserted into the MCS2 of
pACYCDuet-1. The resultant plasmids were co-transformed into E.coli BL21 (DE3)
strain. Proteins were expressed for 12 hr at 18 after induction with 0.1mM IPTG. Cells
were harvested, resuspended in lysis buffer (20mM MES pH6.1, 150mM NaCl, 2mM
DTT), and lysed by sonication. After centrifugation, the clarified cell lysate was
incubated with glutathione-Sepharose 4B beads and GST-SOSSAN/B1 was eluted with
elution buffer (20mM MES pH6.1, 150mM NaCl, 2mM DTT, 20mM reduced
glutathione). The GST tag was removed by PreScissionTM protease (GE healthcare), and
the released SOSSAN/B1 complex was further purified by glutathione-Sepharose 4B,
MonoS and Superdex 200 gel filtration columns uccessively (GE healthcare). The full
length SOSSC was cloned into the pGEX6p-1 vector and expressed as a GST fusion
protein in E.coli BL21 (DE3). SOSSC was purified using glutathione-Sepharose 4B and
MonoS columns using the same approach as described for SOSSAN/B1. Purified SOSSC
and SOSSAN/B1 were mixed at a molar ratio of 1.5:1, incubated on ice for at least 30
min, then the SOSSAN/B1/C complex was separated from SOSSAN/B1 and SOSS-C by
size-exclusion chromatography on a Superdex 200 column. The purified SOSSAN/B1 and
SOSSAN/B1/C complexes were concentrated to 25mg/ml for crystallization. The
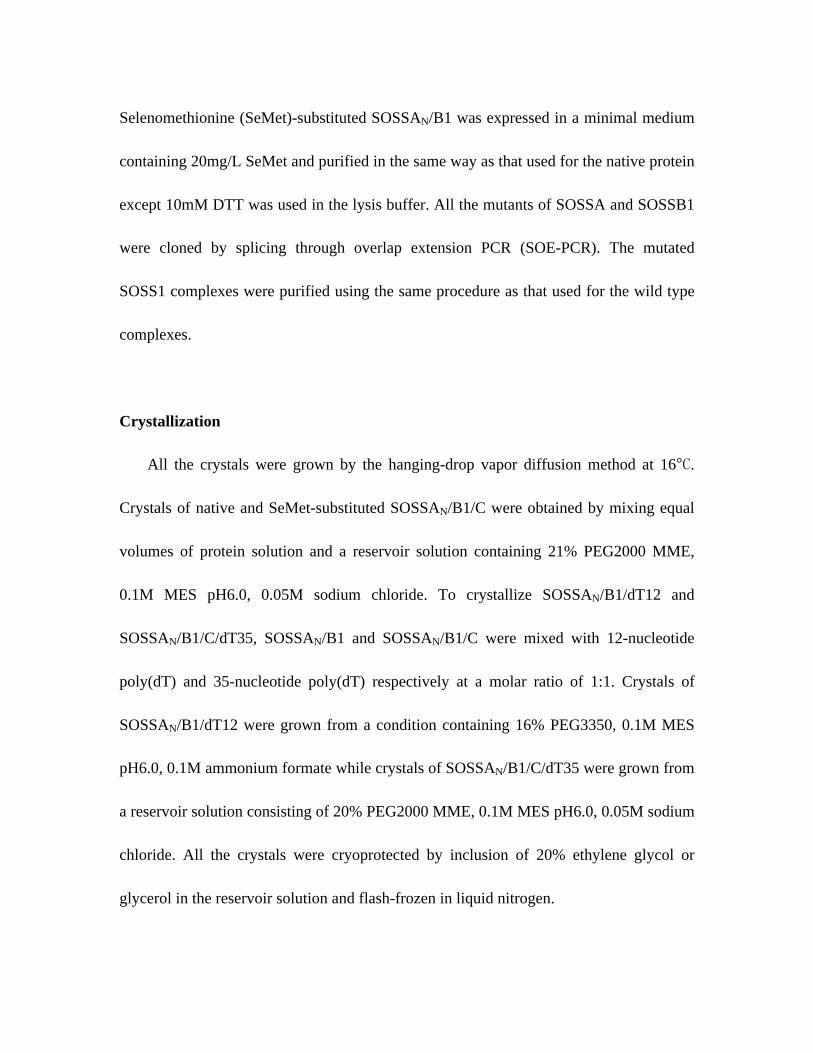
Selenomethionine (SeMet)-substituted SOSSAN/B1 was expressed in a minimal medium
containing 20mg/L SeMet and purified in the same way as that used for the native protein
except 10mM DTT was used in the lysis buffer. All the mutants of SOSSA and SOSSB1
were cloned by splicing through overlap extension PCR (SOE-PCR). The mutated
SOSS1 complexes were purified using the same procedure as that used for the wild type
complexes.
Crystallization
All the crystals were grown by the hanging-drop vapor diffusion method at 16° .
Crystals of native and SeMet-substituted SOSSAN/B1/C were obtained by mixing equal
volumes of protein solution and a reservoir solution containing 21% PEG2000 MME,
0.1M MES pH6.0, 0.05M sodium chloride. To crystallize SOSSAN/B1/dT12 and
SOSSAN/B1/C/dT35, SOSSAN/B1 and SOSSAN/B1/C were mixed with 12-nucleotide
poly(dT) and 35-nucleotide poly(dT) respectively at a molar ratio of 1:1. Crystals of
SOSSAN/B1/dT12 were grown from a condition containing 16% PEG3350, 0.1M MES
pH6.0, 0.1M ammonium formate while crystals of SOSSAN/B1/C/dT35 were grown from
a reservoir solution consisting of 20% PEG2000 MME, 0.1M MES pH6.0, 0.05M sodium
chloride. All the crystals were cryoprotected by inclusion of 20% ethylene glycol or
glycerol in the reservoir solution and flash-frozen in liquid nitrogen.

Electrophoretic mobility shift assay
Native acrylamide electrophoretic mobility shift assay was used to detect the binding
affinity of the SOSS1 complex with a 48-nucleotide poly(dT) (dT48). Wild type
SOSSAN/B1 or their mutants were mixed with SOSSC at a molar ratio of 1:1 and
incubated on ice for at least 60min. Then each of the reconstituted protein complex at
concentrations of 1.8 fmol, 3.6 fmol and 7.2 fmol was incubated with 5 fmol 3’-biotin
labeled dT48 in a buffer (20mM Tris-HCl, pH7.5, 50mM NaCl, 1mM MgCl2, 0.5mM
EDTA, 0.2mM DTT) on ice for 60 min. The reactions were resolved on 5% native gel
with 0.5 TBE buffer and were electrophoretically transferred to Nylon membrane and
crosslinked at 120mJ/cm2 using a UV-light crosslinking instrument equipped with
254nm bulbs. The subsequent blocking, washing and detection were performed according
to the manufacturer’s instructions (Lightshift chemiluminescent EMSA Kit, Pierce).
Isothermal titration calorimetry
ITC measurements were performed at MicroCa VP-ITC (MicroCal Inc.). Protein
samples were dialyzed into a buffer containing 20mM HEPES (pH7.2), 150mM KCl and
1mM MgCl2. For analyzing the binding of dT12 to SOSSB1, SOSSA /B1, and
SOSSA /B1/C, 500μM dT12 were injected into the calorimetric cell containing 50μM
protein. For analyzing the binding of dT48 to SOSSB1, SOSSA /B1, SOSSA /B1/C and

SOSS4m/B1/C, 100μM dT48 were injected into the cell containing 12μM protein.
Titrations were all performed at 25° , initiated with 5μl injection, followed by twenty-
four 10μl injections with 300 seconds equilibration time between injections. The raw data
represented the heat signal (μcal/sec) versus time (minutes) and were analyzed using the
Origin 7.0 program, fitted to a single-site binding model.
Antibodies
Antibody specifically recognizing RAD51 was previously described (Huang et al.,
2009; Wan et al., 2013). Anti-Myc (9E10) and anti-Flag (M2) antibodies were purchased
from Covance and Sigma, respectively. Anti-GAPDH antibody was purchased from
Millipore.
Cell culture and transfection
293T and HeLa Cells were maintained in DMEM supplemented with 10% fetal
bovine serum and 1% penicillin and streptomycin. Cell transfection was performed using
Lipofectamine 2000 (Invitrogen), following the manufacturer’s protocol.
Constructs
The mammalian expression plasmids for SFB- or Myc-tagged SOSSA, SOSSB1 and
SOSSC were previously described (Huang et al., 2009). Site-directed mutagenesis was

performed according to standard procedures to obtain the SOSSA, SOSSB1, or SOSSC
mutants. For transient expression of SOSSA, SOSSB1, SOSSC or their mutants, the
corresponding fragment in the entry vector was transferred into Gateway compatible
destination vector which harbor either an N-terminal triple-epitope tag (S protein tag,
Flag epitope tag and Streptavidin binding peptide tag) or an N-terminal Myc tag. All
clones were sequenced to verify desired mutations.
RNA interference
All siRNAs were synthesized by Dharmacon Inc. The siRNAs were 21 base pairs
and sequences are as follows: SOSSA siRNA: 5’-GAUGAGAGUUGCUAUGACA
dTdT; SOSSB1 siRNA: 5’-CGACGGAGACCUUUGUGAAdTdT; SOSSC siRNA: 5’-
GAACCAGUCUUCAACAAAUdTdT and control siRNA: 5’-UUCAAUAAAUUC
UUGAGGUUU. The siRNA-resistant wild-type and mutant SOSSA constructs were
generated by changing 9 nucleotides in the SOSSA siRNA targeting region (G1569A,
T1572C, G1575A, A1576T, G1577C, T1578A, C1581T, T1584C, and C1587T
substitutions). The siRNA-resistant wild-type and mutant SOSSB1 constructs were
generated by changing 7 nucleotides in the SOSSB1 siRNA targeting region (G6A, G9A,
G12A, C15G, T18C, G21C and G24A substitutions). The siRNA-resistant wild-type and
mutant SOSSC constructs were generated by changing 6 nucleotides in the SOSSC
siRNA targeting region (C99T, G102A, T105A, A108T, A111T, and T114C

substitutions).The siRNA transfection was performed with 100 nM siRNA duplexes
using Lipofectamine RNAiMAX (Invitrogen) following the manufacturer's instruction.
Transfection was repeated twice with an interval of 24 hr to achieve maximal RNAi
effect.
Co-immunoprecipitation and western blotting
For Flag immunoprecipitations, a 0.8-ml aliquot of lysate was incubated with 1 μg of
the Flag monoclonal antibody and 25 μl of a 1:1 slurry of Protein A Sepharose for 2 hr at
4°C. The Sepharose beads were washed three times with NTEN buffer, boiled in 2 X
SDS loading buffer, and resolved on SDS-PAGE. Membranes were blocked in 5% milk
in TBST buffer and then probed with antibodies as indicated.
Cell survival assays
HeLa cells were transfected twice with control siRNA or siRNAs specifically
targeting SOSSA, SOSSB1 or SOSSC. 24 hr after the second transfection, cells (1 X 10³)
were splitted and transferred into 60 mm dishes. Cells were incubated for 24 hr before
they were treated with IR as indicated. The medium was replaced 24 hr later and cells
were then incubated for 14 days. Resulting colonies were fixed and stained with
Coomassie blue.

Lentivirus Packaging and Infection
Tet-On inducible SFB-tagged lentiviral vector and packaging plasmids (pMD2G and
pSPAX2) were kindly provided by Professor Songyang Zhou (Baylor College of
Medicine). SOSS entry constructs were transferred into the Gateway-compatible SFB-
tagged lentiviral vector. Virus supernatant was collected 48 hr after the co-transfection of
lentiviral vectors and packaging plasmids (pMD2G and pSPAX2) into 293T cells. Cells
were infected with viral supernatants with the addition of 8 μg/ml polybrene (Sigma), and
stable pools were selected with medium containing 500 μg/ml G418 (Calbiochem). The
expression of the indicated genes in the stable pools was induced by the addition of 1
μg/ml doxycycline (Sigma) for 24 hr for the experiments presented in this report.
SUPPLEMENTARY REFERENCES
Huang, J., Gong, Z., Ghosal, G., and Chen, J. (2009). SOSS complexes participate in the
maintenance of genomic stability. Mol Cell 35, 384-393.
Wan, L., Han, J., Liu, T., Dong, S., Xie, F., Chen, H., and Huang, J. (2013). Scaffolding
protein SPIDR/KIAA0146 connects the Bloom syndrome helicase with homologous
recombination repair. Proc Natl Acad Sci U S A 110, 10646-10651.

Table S1. Data collection and refinement statistics, related to Experimental
Procedures
Data collection SeMet-SOSSAN/B1/C SOSSAN/B1/C/dT35 SOSSAN/B1/dT12 Wavelength (Å) 0.9798 0.9798 0.9798 Resolution limit (Å) 2.0 2.3 2.3 Space group P3121 P212121 P21212 Cell parameters a/b/c(Å) 116.81/116.81/109.83 115.83/76.65/87.29 98.63/162.52/65.74 / / (°) 90/90/120 90/90/90 90/90/90 Unique reflections (N) 58840 37719 47747 Total Reflections (N) 698927 218092 371636 Mean (I/ ) 9.9 (2.4) 7.8 (2.7) 11.4(2.5) Completeness (%) 100.0 (100.0) 99.8 (99.8) 99.8 (99.8) Rmerge
a 0.174 (0.791) 0.145 (0.629) 0.110 (0.790)
Number of Se sites 15
Refinement Statistics
Data range (Å) 20.0-2.0 20.0-2.3 20.0-2.3
Used Reflections (N) 58732 37578 47624 Protein residues 577 615 580 Protein atoms 4608 4971 4735 Solvent molecules 410 213 159 RNA bases -- 6 9 Rwork
b(%) 17.19 17.99 18.80 Rfree
c (%) 19.53 21.83 22.69 R.m.s deviation Bond length (Å) 0.006 0.005 0.005 Bond angles (°) 0.990 0.928 1.017 Ramchandran plot (% residues)
Allowed 99.6 99.4 99.8 Generously allowed 0.4 0.2 0.0 Disallowed 0.2 0.4 0.2
Values in parentheses indicate the specific values in the highest resolution shell. aRmerge = |Ij-<I>|/ Ij, where Ij is the intensity of an individual reflection, and <I> is the average intensity of that reflection. bRwork = ||Fo| - |Fc||/ |Fc|, where Fo denotes the observed structure factor amplitude, and Fc denotes the structure factor amplitude calculated from the model.cRfree is as for Rwork but calculated with 5.0% of randomly chosen reflections omitted from the refinement.

Figure S1, related to Figure 1. Superposition of SOSSAN with the middle domain of eIF4G and
Paip1. The coloring scheme of N-SOSSAN and C-SOSSAN is as in Figure 1. The middle domain of eIF4G (eIF4Gm) and Paip1 are shown in purple and blue respectively

Figure S2, related to Figure 2. Structure-based sequence alignment of (A) SOSSA, (B) SOSSB1
and (C) SOSSC between different species. The secondary structural elements for these proteins are shown and numbered. The invariant residues and conserved residues are highlighted in red-shaded boxes and yellow-shaded boxes, respectively.

Figure S3, related to Figure 4. The assembly of the SOSS1 complex is necessary for RAD51 focus
formation. Quantification results were the average of three independent experiments and were presented as mean±SEM.
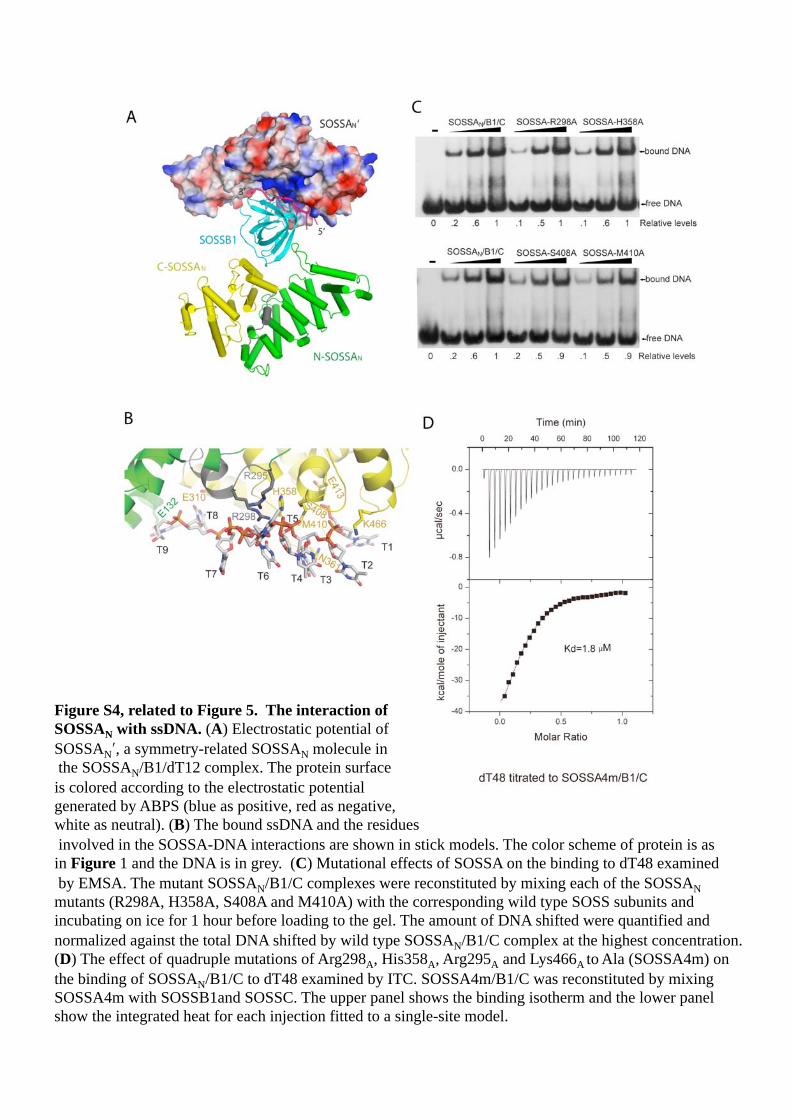
Figure S4, related to Figure 5. The interaction of
SOSSAN with ssDNA. (A) Electrostatic potential of SOSSAN , a symmetry-related SOSSAN molecule in the SOSSAN/B1/dT12 complex. The protein surface is colored according to the electrostatic potential generated by ABPS (blue as positive, red as negative, white as neutral). (B) The bound ssDNA and the residues involved in the SOSSA-DNA interactions are shown in stick models. The color scheme of protein is as in Figure 1 and the DNA is in grey. (C) Mutational effects of SOSSA on the binding to dT48 examined by EMSA. The mutant SOSSAN/B1/C complexes were reconstituted by mixing each of the SOSSAN mutants (R298A, H358A, S408A and M410A) with the corresponding wild type SOSS subunits and incubating on ice for 1 hour before loading to the gel. The amount of DNA shifted were quantified and normalized against the total DNA shifted by wild type SOSSAN/B1/C complex at the highest concentration. (D) The effect of quadruple mutations of Arg298A, His358A, Arg295A and Lys466A to Ala (SOSSA4m) on the binding of SOSSAN/B1/C to dT48 examined by ITC. SOSSA4m/B1/C was reconstituted by mixing SOSSA4m with SOSSB1and SOSSC. The upper panel shows the binding isotherm and the lower panel show the integrated heat for each injection fitted to a single-site model.

Figure S5, related to Figure 5. The binding of SOSSAN/B1, SOSSAN/B1/C and SOSSB1 to dT12
and dT48 examined by ITC. (A) Titrations of dT12 to SOSSAN/B1, SOSSAN/B1/C and SOSSB1. (B) Titrations of dT48 to SOSSAN/B1, SOSSAN/B1/C and SOSSB1. The upper panels show the binding isotherms and the lower panels show the integrated heat for each injection fitted to a single-site model.