STRUCTURAL AND NON-STRUCTURAL BMPS FOR PROTECTING STREAMS · STRUCTURAL AND NON-STRUCTURAL BMPS FOR...
18
1 Horner STRUCTURAL AND NON-STRUCTURAL BMPS FOR PROTECTING STREAMS Richard Horner, Christopher May, Eric Livingston, David Blaha, Mateo Scoggins, Julia Tims, and John Maxted _ Watershed Management Institute 410 White Oak Drive; Crawfordsville, Florida 32327 ABSTRACT Stream ecosystems in three different locations in the United States were found to benefit in a similar fashion from retention of watershed forest and wetland cover and wide, continuous riparian buffers with mature, native vegetation. The findings can help guide comprehensive watershed management and application of these non- structural practices in low-impact urban design. Intensive study of structural best management practices (BMPs) in one location found that, even with a relatively high level of attention, a minority of the developed area is served by these BMPs. Those BMPs installed are capable of mitigating an even smaller share of urban impacts, primarily because of inadequacies in design standards. Even with these shortcomings, though, results showed that structural BMPs help to sustain aquatic biological communities, especially at moderately high urbanization levels, where space limits non-structural options. BACKGROUND Urban Streams and Their Management By the mid-point of the last decade the effects of watershed urbanization on streams around the United States were well documented. They include extensive changes in basin hydrologic regime, channel morphology, and physicochemical water quality associated with modified rainfall-runoff patterns and anthropogenic sources of water pollutants. The cumulative effects of these alterations produce an in-stream habitat considerably different from that in which native fauna evolved. In addition, development pressure has a negative impact on riparian forests and wetlands, which are intimately involved in stream ecosystem functioning. What was missing at that point in time, though, was definition of the linkages tying together landscapes and aquatic habitats and their inhabitants strong enough to support management decision-making that avoids or minimizes resource losses.
Transcript of STRUCTURAL AND NON-STRUCTURAL BMPS FOR PROTECTING STREAMS · STRUCTURAL AND NON-STRUCTURAL BMPS FOR...
1 Horner
STRUCTURAL AND NON-STRUCTURAL BMPS FORPROTECTING STREAMS
Richard Horner, Christopher May, Eric Livingston, David Blaha, Mateo Scoggins,Julia Tims, and John Maxted
_ Watershed Management Institute410 White Oak Drive; Crawfordsville, Florida 32327
ABSTRACT
Stream ecosystems in three different locations in the United States were found tobenefit in a similar fashion from retention of watershed forest and wetland cover andwide, continuous riparian buffers with mature, native vegetation. The findings canhelp guide comprehensive watershed management and application of these non-structural practices in low-impact urban design. Intensive study of structural bestmanagement practices (BMPs) in one location found that, even with a relatively highlevel of attention, a minority of the developed area is served by these BMPs. ThoseBMPs installed are capable of mitigating an even smaller share of urban impacts,primarily because of inadequacies in design standards. Even with theseshortcomings, though, results showed that structural BMPs help to sustain aquaticbiological communities, especially at moderately high urbanization levels, wherespace limits non-structural options.
BACKGROUND
Urban Streams and Their Management
By the mid-point of the last decade the effects of watershed urbanization on streamsaround the United States were well documented. They include extensive changesin basin hydrologic regime, channel morphology, and physicochemical water qualityassociated with modified rainfall-runoff patterns and anthropogenic sources of waterpollutants. The cumulative effects of these alterations produce an in-stream habitatconsiderably different from that in which native fauna evolved. In addition,development pressure has a negative impact on riparian forests and wetlands,which are intimately involved in stream ecosystem functioning.
What was missing at that point in time, though, was definition of the linkages tyingtogether landscapes and aquatic habitats and their inhabitants strong enough tosupport management decision-making that avoids or minimizes resource losses.

2 Horner
Lacking this systematic picture, urban watershed and stormwater managementefforts have not been broadly successful in fulfilling the federal Clean Water Act’sstipulation to protect the biological integrity of the nation’s waters. Effectivemanagement needs well conceived goals of what biological organisms andcommunities are to be sustained and at what levels, and then the foundation forjudging what habitat conditions they need for sustenance and, in turn, watershedattributes consistent and inconsistent with these conditions.
Management has usually centered on attempting to reduce stormwater runoffcontaminants in passive structural BMPs like ponds with permanent pools orextended detention, vegetated drainage courses, infiltration basins, sand filters, andothers. Some locations also focused management attention on amelioration of peakstream flow rate increases following development to reduce erosive shear stressand its damage to stream habitats. However, there has been little tie between theseprescriptions and ecological considerations, or even how well they work to sustainbiological communities that they ostensibly exist to protect. What little study hadbeen done was far too limited to draw firm conclusions, but was not promising.Maxted and Shaver (1997) were not able to distinguish a biological advantageassociated with the presence versus absence of structural BMPs along Delawarestreams. Jones, Via-Norton, and Morgan (1997) concluded that appropriately sitedand designed BMPs provided some mitigation of stormwater impacts on Virginiastream habitats and biota, but that the resulting communities were still greatlyaltered from those in undeveloped reference watersheds.
Toward a More Systematic View of Watersheds, Streams, and Management
With this background of insufficient understanding of relationships among watershedand aquatic ecosystem elements, and the capabilities of prevailing managementstrategies to influence these relationships, the U.S. Environmental ProtectionAgency (USEPA) commissioned the Watershed Management Institute (WMI) toinvestigate stream habitats and biology across gradients of urbanization and BMPapplication in four regions of the nation (Austin, TX; Montgomery County, MD; PugetSound, WA; and Vail, CO). This study followed an earlier effort along similar lines inthe Puget Sound region funded by the Washington Department of Ecology.Together these studies built a database representing more than 220 reaches onlow-order streams in watersheds ranging from no urbanization and relatively littlehuman influence (the reference state, representing “best attainable” conditions) tohighly urban (>60 percent total impervious area, TIA).
Results from the initial Puget Sound research and a portion of the follow-up studyhave been extensively reported. Biological health was assessed according tobenthic index of biotic integrity (B-IBI; Fore, Karr, and Wisseman 1996) and the ratioof young-of-the-year coho salmon (a relatively stress-intolerant fish) to cutthroattrout (a more stress-tolerant species). Both biological measures declined with TIAincrease without exhibiting a threshold of effect; i.e., declines accompanied evensmall levels of urbanization (Horner et al. 1997; May et al. 1997). However, streamreaches with relatively intact, wide riparian zones in wetland or forest coverexhibited higher B-IBI values than reaches equivalent in TIA but with less riparianbuffering. Until TIA exceeded 40 percent, biological decline was more stronglyassociated with hydrologic fluctuation than with chemical water and sediment quality

3 Horner
decreases. Accompanying hydrologic alteration was loss of habitat features, likelarge woody debris and pool cover, and deposition of fine sediments that reducedissolved oxygen in the bed substrata, where salmonid fish deposit their eggs. Theresearch defined stream quality zones in relation to TIA and riparian corridorcondition and identified sets of necessary, although by themselves not sufficient,conditions to maintain a high level of biological functioning or prevent decline to alow level. These findings provide a basis for managing watersheds in relation tobiological goals.
Follow-up Puget Sound investigation turned to the question of BMP effectiveness.This investigation considered the density of structural BMP coverage and, as defacto non-structural BMPs, extent of watershed forest cover and riparian buffering(proportion of upstream corridor with riparian zone in forest or wetland cover at least30 meters wide on each bank). In this comparison, riparian retention exhibitedgreater and more flexible potential than other options to uphold biological integritywhen development increases, with upland forest retention also offering valuablebenefits, especially low in the urbanization gradient (Horner and May 1999).Structural BMPs at the prevailing densities demonstrated less potential than thenon-structural methods assessed to forestall resource decline as urbanization startsand progresses. There was a suggestion in the data, though, that more thoroughcoverage would offer substantive benefits in this situation. Moreover, structuralBMPs were seen to help prevent further resource deterioration in moderately andhighly developed watersheds. Analysis showed that none of the options is withoutlimitations, and widespread landscape preservation must be incorporated to retainthe most biologically productive aquatic resources.
Maxted (1999) gave a preliminary report on the overall results of the WMI studyavailable at that time. Differences in expressions of macroinvertebrate communityintegrity appropriate for the various locations were reconciled by scoring eachrelative to the best attainable measure for the region. The patterns of associationbetween these biological expressions and TIA were similar for the Maryland, Texas,and Washington sites, and also similar to the Delaware watersheds studied earlier(Maxted and Shaver 1997), in that none exhibited a threshold level of urbanizationwhere biological decline began. As the Delaware results had indicated, WMI streamreaches with and without structural BMPs could not be distinguished in biologicalquality. This preliminary analysis points out two instances of general unity amongdiffering ecoregions in landscape-aquatic ecosystem relationships.
Additional Research Needs
Observation in the Puget Sound study area of the role played by riparian and uplandforest retention in maintaining stream ecology suggests that their benefits might befound in other regions having different aquatic ecosystems. If similarity weredemonstrated, the finding would not only serve the pragmatic need for targetingmanagement attention, but would also continue to develop the picture of generalunity among ecoregions. The hypothesis was tested in the Montgomery County,Austin, and Vail study areas using the data collection and analysis methodsdeveloped in the Puget Sound study. The next section of this paper presents anddiscusses the results.

4 Horner
Following up the initial Puget Sound work on the role of structural BMPs inmaintaining stream health, the analysis was supplemented by more detailedevaluation of BMP service levels and added assessment of implementation qualityin several catchments relatively well and poorly served with structural BMPs. A latersection of this paper reports the findings.
COMPARISON OF ECOLOGICAL BENEFITS OF RIPARIAN AND FORESTRETENTION IN FOUR ECOREGIONS
Study Sites and Methods
Table 1 indicates the general levels of coverage of the four regional programs. Theregional programs developed multi-metric invertebrate community indicesappropriate for prevailing ecological attributes but similar in complexity. Vailwatershed configurations differ substantially from the others, because of topographyand other physiographic factors and the development patterns prevalent there.Most Vail area streams originate in National Forest land and flow down steep slopesto form narrow valleys containing almost all development. Overall imperviouscoverage in these watersheds is low relative to other study areas, although the localdegree of impervious ranges up to comparable levels. In further contrast to theother regions, runoff in Vail is mostly generated by snowmelt, and relatively coarsesoils are more infiltrative there. Local municipalities do not use formal structuralBMPs at all and manage mainly with the non-structural strategy of riparian buffermaintenance.
Table 1. Regional Program CharacteristicsCharacteristic Austin Mont. Co. Puget Sound Vaila
Number of stream reaches 45 60 74 50Watershed area range (km2) 0.13-10.5 0.12-6.9 0.65-60.0 0.28-37.3Overall TIA range (%)b 1.5-53.2 4.7-58.0 1.2-60.6 0-3.5Developed range (%)b 0-99.7 2.6-70.2 0-96.9 0-13.9Forest and wetland range (%)b 0.3-100 2.4-43.2 3.1-87.0 86.1-100Number of metrics ininvertebrate community index 9 8 9 9a Range statistics are given for 25 sites with full geographic information systemcoverage.b Overall TIA (total impervious area), developed and forest and wetland ranges arepercentages of the entire watershed. Developed signifies land converted fromnatural or agricultural cover by construction, including lawns and other perviouscovers installed by humans. For Vail, forest and wetland includes mountainmeadows that are an ecological climax condition.
An Index of Riparian Integrity (IRI) was developed in a manner similar to the B-IBIformulation (Fore, Karr, and Wisseman 1996) to express with one number the keyattributes of riparian zones. Scores of 1 to 4, representing poor to excellent ratingsor riparian buffering, were assigned to six attributes according to the criteria in Table2. The six scores were summed and divided by the total possible score (24) andmultiplied by 100 to express the IRI as a percentage of maximum value.
5 Horner
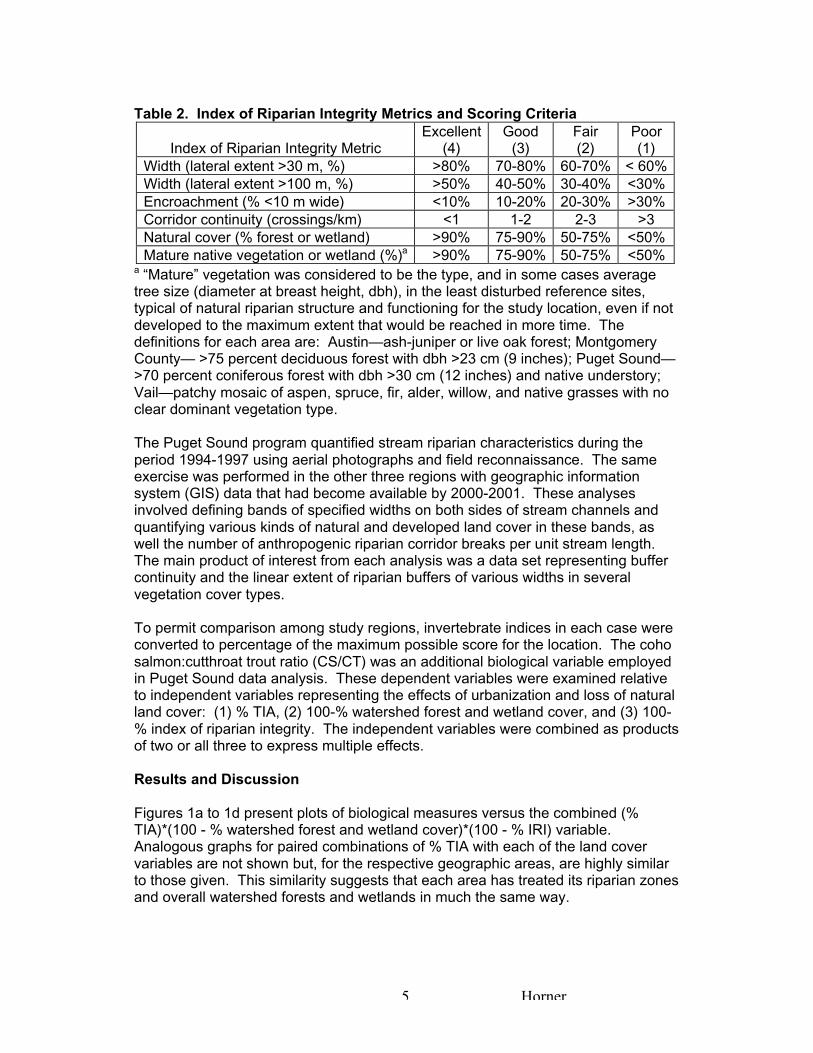
Table 2. Index of Riparian Integrity Metrics and Scoring Criteria
Index of Riparian Integrity MetricExcellent
(4)Good
(3)Fair(2)
Poor(1)
Width (lateral extent >30 m, %) >80% 70-80% 60-70% < 60%Width (lateral extent >100 m, %) >50% 40-50% 30-40% <30%Encroachment (% <10 m wide) <10% 10-20% 20-30% >30%Corridor continuity (crossings/km) <1 1-2 2-3 >3Natural cover (% forest or wetland) >90% 75-90% 50-75% <50%Mature native vegetation or wetland (%)a >90% 75-90% 50-75% <50%
a “Mature” vegetation was considered to be the type, and in some cases averagetree size (diameter at breast height, dbh), in the least disturbed reference sites,typical of natural riparian structure and functioning for the study location, even if notdeveloped to the maximum extent that would be reached in more time. Thedefinitions for each area are: Austin—ash-juniper or live oak forest; MontgomeryCounty— >75 percent deciduous forest with dbh >23 cm (9 inches); Puget Sound—>70 percent coniferous forest with dbh >30 cm (12 inches) and native understory;Vail—patchy mosaic of aspen, spruce, fir, alder, willow, and native grasses with noclear dominant vegetation type.
The Puget Sound program quantified stream riparian characteristics during theperiod 1994-1997 using aerial photographs and field reconnaissance. The sameexercise was performed in the other three regions with geographic informationsystem (GIS) data that had become available by 2000-2001. These analysesinvolved defining bands of specified widths on both sides of stream channels andquantifying various kinds of natural and developed land cover in these bands, aswell the number of anthropogenic riparian corridor breaks per unit stream length.The main product of interest from each analysis was a data set representing buffercontinuity and the linear extent of riparian buffers of various widths in severalvegetation cover types.
To permit comparison among study regions, invertebrate indices in each case wereconverted to percentage of the maximum possible score for the location. The cohosalmon:cutthroat trout ratio (CS/CT) was an additional biological variable employedin Puget Sound data analysis. These dependent variables were examined relativeto independent variables representing the effects of urbanization and loss of naturalland cover: (1) % TIA, (2) 100-% watershed forest and wetland cover, and (3) 100-% index of riparian integrity. The independent variables were combined as productsof two or all three to express multiple effects.
Results and Discussion
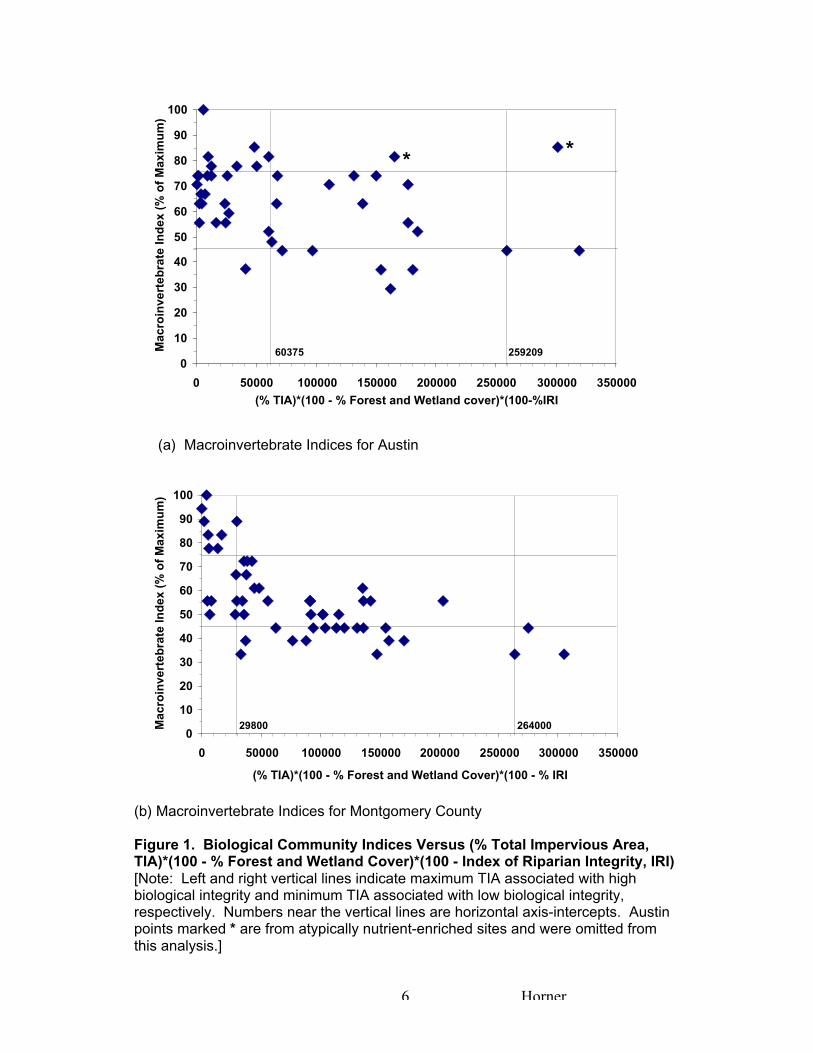
Figures 1a to 1d present plots of biological measures versus the combined (%TIA)*(100 - % watershed forest and wetland cover)*(100 - % IRI) variable.Analogous graphs for paired combinations of % TIA with each of the land covervariables are not shown but, for the respective geographic areas, are highly similarto those given. This similarity suggests that each area has treated its riparian zonesand overall watershed forests and wetlands in much the same way.
6 Horner
(a) Macroinvertebrate Indices for Austin
0
10
20
30
40
50
60
70
80
90
100
0 50000 100000 150000 200000 250000 300000 350000
(% TIA)*(100 - % Forest and Wetland Cover)*(100 - % IRI)
Mac
roin
vert
ebra
te In
dex
(%
of
Max
imu
m)
29800 264000
(b) Macroinvertebrate Indices for Montgomery County
Figure 1. Biological Community Indices Versus (% Total Impervious Area,TIA)*(100 - % Forest and Wetland Cover)*(100 - Index of Riparian Integrity, IRI)[Note: Left and right vertical lines indicate maximum TIA associated with highbiological integrity and minimum TIA associated with low biological integrity,respectively. Numbers near the vertical lines are horizontal axis-intercepts. Austinpoints marked * are from atypically nutrient-enriched sites and were omitted fromthis analysis.]
0
10
20
30
40
50
60
70
80
90
100
0 50000 100000 150000 200000 250000 300000 350000
(% TIA)*(100 - % Forest and Wetland cover)*(100-%IRI)
Mac
roin
vert
ebra
te In
dex
(%
of
Max
imu
m)
25920960375
* *

7 Horner
0
10
20
30
40
50
60
70
80
90
100
0 50000 100000 150000 200000 250000 300000 350000 400000 450000
(% TIA)*(100 - % Forest and Wetland Cover)*(100 - % IRI)
Mac
roin
vert
ebra
te In
dex
(%
of
Max
imu
m)
37500 243000
(c) Macroinvertebrate Indices for Puget Sound
0
1
2
3
4
5
6
0 50000 100000 150000 200000 250000 300000 350000 400000 450000
(% TIA)*(100 - % Forest and Wetland Cover)*(100 - % IRI)
Co
ho
Sal
mo
n:C
utt
hro
at T
rou
t R
atio
(N
o U
nit
)
8630 236000
(d) Coho Salmon:Cutthroat Trout (CS/CT) Ratio for Puget Sound
Figure 1 Continued
Figures 1a to 1c for macroinvertebrates exhibit some quite consistent trends amongregions that are discussed below. Montgomery County and Puget Sound, bothhumid, temperate regions with primarily perennial streams, exhibit quite similarrelationships. Austin’s pattern differs somewhat. It has mostly intermittent streamsand, compared to Montgomery County and Puget Sound, less frequent and higher
8 Horner
intensity rainfall and much higher evaporation. Vail data do not exhibit the generaltrends in Figure 1, or other clear and consistent tendencies, and are not plotted.The differences in macroinvertebrate community responses in the Vail areacompared to other locations, and the lack of clear relationships with urbanization,are likely due mainly to the small proportions of large watersheds that are developedthere, as well as the unique physiography and terrestrial vegetation regime of theregion. Analyses were performed using local measures of the independentvariables, instead of watershed-scale measures, to see if aquatic biology associatesmore with nearby urbanization and natural land cover than overall watershedcharacteristics. These local measures represent land within 100 meters upstreamand on each side of the stream measured from benthic macroinvertebrate samplingsites. Local TIA ranged as high as 26.0%, still substantially under maximumwatershed TIA for other study locations. These analyses were not fruitful indiscerning patterns helpful to understanding functioning of Vail area streams andmanaging them, and further attempts will be made.
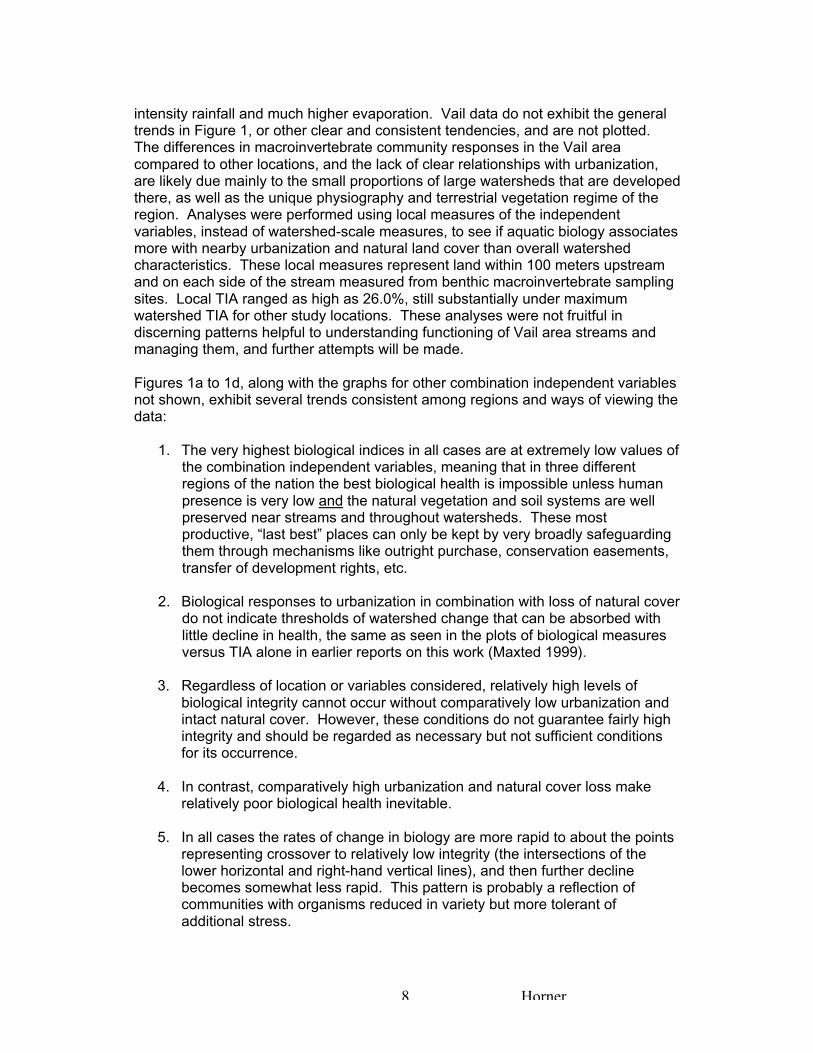
Figures 1a to 1d, along with the graphs for other combination independent variablesnot shown, exhibit several trends consistent among regions and ways of viewing thedata:
1. The very highest biological indices in all cases are at extremely low values ofthe combination independent variables, meaning that in three differentregions of the nation the best biological health is impossible unless humanpresence is very low and the natural vegetation and soil systems are wellpreserved near streams and throughout watersheds. These mostproductive, “last best” places can only be kept by very broadly safeguardingthem through mechanisms like outright purchase, conservation easements,transfer of development rights, etc.
2. Biological responses to urbanization in combination with loss of natural coverdo not indicate thresholds of watershed change that can be absorbed withlittle decline in health, the same as seen in the plots of biological measuresversus TIA alone in earlier reports on this work (Maxted 1999).
3. Regardless of location or variables considered, relatively high levels ofbiological integrity cannot occur without comparatively low urbanization andintact natural cover. However, these conditions do not guarantee fairly highintegrity and should be regarded as necessary but not sufficient conditionsfor its occurrence.
4. In contrast, comparatively high urbanization and natural cover loss makerelatively poor biological health inevitable.
5. In all cases the rates of change in biology are more rapid to about the pointsrepresenting crossover to relatively low integrity (the intersections of thelower horizontal and right-hand vertical lines), and then further declinebecomes somewhat less rapid. This pattern is probably a reflection ofcommunities with organisms reduced in variety but more tolerant ofadditional stress.

9 Horner
6. The points at which landscape condition takes away the opportunity for goodbiological health, or alternatively assures poor health, are similar among thestudy locations but deviate somewhat numerically. While these results mightbe put to general use in managing streams elsewhere, quantitative aspectsshould not be borrowed.
7. Comparing Puget Sound fish and macroinvertebrates, coho salmon exhibitmore rapid rates of decline with landscape stress, lower TIA at which quitehealthy communities can exist, and also lower TIA for poor health.
In viewing these data, a reasonable question is whether or not protecting moreforest and wetland, riparian buffer, or both can confidently be expected to mitigateincreased urbanization. This question has considerable significance for the ultimatesuccess of clustering development within low-impact designs to sustain aquaticecosystems. In beginning to think about this issue, it must first be reiterated that ifthe goal is to maintain an ecological system functioning at or very close to themaximum levels seen, the answer is no. If the goal is to keep some lower but stillgood level of health, or to prevent degradation to a poor condition, the findingssuggest that there is probably some latitude.
In this case the answer to the question can be investigated by using the horizontalaxis-intercepts in Figure 1 as bases for examining combinations of the landscapevariables in relation to biological goals. For example, the left-hand intercept inFigure 1(d) represents the simple algebraic equation, 8630 = (% TIA)*(100 - %watershed forest and wetlands)*(100 - % IRI). That equation can be solved for anyof the three landscape variables, which can then be numerically computed bysubstituting selected values of the other two. If, for example, the biological goal is toprovide necessary conditions for a relatively healthy coho salmon population(CS/CT ≥3.0) with TIA = 10 percent and IRI = 65 percent, an estimate of thenecessary forest and wetland retention is:
-100)%100(*)(%
8630IRITIA -
= )65100(*10
8630100
-- = %75
At least with the present level of understanding and confidence, analyses like thisshould be used in management only with caution and as advisory tools, and not asstrict quantitative determinants. It must be kept in mind that, for high biologicalgoals, the result only indicates the possibility, and not the certainty, of achieving thegoal. Biological response depends on many circumstances not reflected in thissimple analysis, such as where the developed area is relative to the stream anddrainage pathways to it, what type of activity occurs there, and specific qualities ofthe natural landscape units. There are clearly limits to how much forest, wetlands,and riparian buffer can be preserved around development, particularly with thespace constraints at moderate and higher urbanization levels. With all of thesemany factors unaccounted for, these data should be used only with care thatconservatively protects resources.
If these cautions are recognized, though, watershed planners and managers canemploy the findings from this multi-region study as approximate guides. Theauthors’ hope is that their use will reduce instances of decision making without

10 Horner
specific goals and consideration of the most crucial elements that determine theirachievement. Decisions made in this way should reduce simplistic, overly optimisticapproaches that very often lead to resource deterioration. Meanwhile, researchshould continue to represent more locations and to develop models encompassingmore components of complex watershed systems.The best and safest use of the results is probably to analyze how to preventdeterioration to lower biological integrity, or to improve health somewhat, at mediumto high urbanization. For one reason, the stakes are lower in this situation, aslosses have already been sustained and the relatively tolerant organisms remainingare more robust in resisting change than in more pristine areas. Also, the datashow more certainty there than at lower urbanization, where favorable conditionsare only necessary but not sufficient for predicting good health. Table 3 presentssome cases from this part of the urbanization spectrum, computed as demonstratedin the example above. It considers only realistic forest and wetland cover and IRIvalues, as drawn from the regional data sets, which are quite consistent in thequantities of these variables actually present. Results for macroinvertebrates aresimilar between locations. For the most part, staying above what has been definedas poor aquatic health requires holding TIA under about 50 percent at usual levelsof natural cover retention, or 60 percent with aggressive forest protection (about 5percent lower in each case for Puget Sound salmon).
Table 3. Total Impervious Areas (TIA) Predicted to Be Sustainable withSpecific Anti-degradation Goals and Hypothetical Natural Land Cover Cases
Location Goal a Forest and Wetland (%) IRI (%)a TIA (%)Montgomery County Index ≥45% 10 25 39
20 35 5130b 40 63
Puget Sound Index ≥45% 10 25 3620 35 4730b 40 58
CS/CT ≥1.0 10 25 3420 35 4430b 40 55
a Index refers to the macroinvertebrate index for the location as percent of maximumvalue. Cs/CT—coho salmon:cutthroat trout ratio. IRI—index of riparian integrity.b These forest and wetland cases represent an ambitious level of retention relativeto the usual amount existing with fairly high urbanization.
DETAILED PUGET SOUND STRUCTURAL BMP ASSESSMENT
Introduction and Methods
Specific, direct evidence of the effectiveness of stormwater structural BMPs inprotecting aquatic biota and receiving water beneficial uses is extremely sparse. Aspointed out earlier, the few data do not give confidence in a clear biological payofffor the investments being made in these facilities, but are in no way adequate towarrant any solid conclusions in this regard. To add to this minimal informationbase, the Puget Sound component of the USEPA and WMI study conducted anintensive BMP assessment in the watersheds of four of its stream reaches, two inBig Bear Creek and one in its tributary Cottage Lake Creek (King County, WA), plus
11 Horner
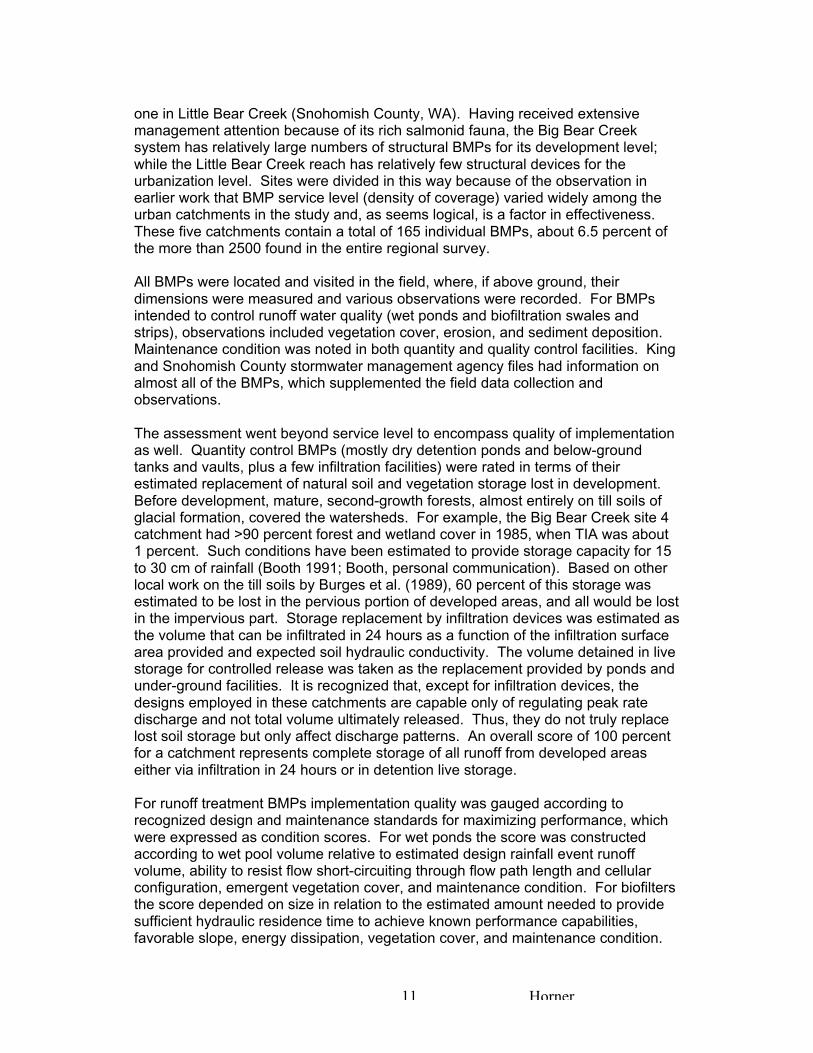
one in Little Bear Creek (Snohomish County, WA). Having received extensivemanagement attention because of its rich salmonid fauna, the Big Bear Creeksystem has relatively large numbers of structural BMPs for its development level;while the Little Bear Creek reach has relatively few structural devices for theurbanization level. Sites were divided in this way because of the observation inearlier work that BMP service level (density of coverage) varied widely among theurban catchments in the study and, as seems logical, is a factor in effectiveness.These five catchments contain a total of 165 individual BMPs, about 6.5 percent ofthe more than 2500 found in the entire regional survey.
All BMPs were located and visited in the field, where, if above ground, theirdimensions were measured and various observations were recorded. For BMPsintended to control runoff water quality (wet ponds and biofiltration swales andstrips), observations included vegetation cover, erosion, and sediment deposition.Maintenance condition was noted in both quantity and quality control facilities. Kingand Snohomish County stormwater management agency files had information onalmost all of the BMPs, which supplemented the field data collection andobservations.
The assessment went beyond service level to encompass quality of implementationas well. Quantity control BMPs (mostly dry detention ponds and below-groundtanks and vaults, plus a few infiltration facilities) were rated in terms of theirestimated replacement of natural soil and vegetation storage lost in development.Before development, mature, second-growth forests, almost entirely on till soils ofglacial formation, covered the watersheds. For example, the Big Bear Creek site 4catchment had >90 percent forest and wetland cover in 1985, when TIA was about1 percent. Such conditions have been estimated to provide storage capacity for 15to 30 cm of rainfall (Booth 1991; Booth, personal communication). Based on otherlocal work on the till soils by Burges et al. (1989), 60 percent of this storage wasestimated to be lost in the pervious portion of developed areas, and all would be lostin the impervious part. Storage replacement by infiltration devices was estimated asthe volume that can be infiltrated in 24 hours as a function of the infiltration surfacearea provided and expected soil hydraulic conductivity. The volume detained in livestorage for controlled release was taken as the replacement provided by ponds andunder-ground facilities. It is recognized that, except for infiltration devices, thedesigns employed in these catchments are capable only of regulating peak ratedischarge and not total volume ultimately released. Thus, they do not truly replacelost soil storage but only affect discharge patterns. An overall score of 100 percentfor a catchment represents complete storage of all runoff from developed areaseither via infiltration in 24 hours or in detention live storage.
For runoff treatment BMPs implementation quality was gauged according torecognized design and maintenance standards for maximizing performance, whichwere expressed as condition scores. For wet ponds the score was constructedaccording to wet pool volume relative to estimated design rainfall event runoffvolume, ability to resist flow short-circuiting through flow path length and cellularconfiguration, emergent vegetation cover, and maintenance condition. For biofiltersthe score depended on size in relation to the estimated amount needed to providesufficient hydraulic residence time to achieve known performance capabilities,favorable slope, energy dissipation, vegetation cover, and maintenance condition.

12 Horner
Scores were proportioned based on the consensus capabilities of the devices toremove two pollutants (total suspended solids and total phosphorus) and theamount of developed area served by each facility. Individual BMP scores were thenadded to compute an overall score for the catchment. A score of 100 percentrepresents interdicting all pollutants expected to be in design storm runoff fromdeveloped catchments, performance that could realistically be achieved structurallyonly by complete runoff infiltration.
Profile of Catchments and BMPs
Table 4 summarizes the characteristics of the catchments and BMPs given detailedattention. Watersheds are as much as two-thirds developed but largely withmedium-density single-family residences, producing TIA in or near the 5 to 10percent range. The Big Bear and Cottage Lake Creek watersheds have thegreatest coverage with structural BMPs among the 38 studied in the regionalproject, yet only about one-sixth to one-third of the developed area even hasquantity control BMPs, the primary management concentration in these salmonidstreams subject to habitat destruction by more frequent elevated flows afterurbanization. The average facility was built before the mid-1980s in the CottageLake Creek watershed, where many are below ground. Those serving Big BearCreek average 5 years younger and tend more to be surface ponds.
The quality control service levels are even lower, especially in the older CottageLake Creek developments (<5 percent of developed area). The much highernumbers in the Big Bear Creek catchments indicate the turn to quality control alongwith quantity control in the heavy development period there around 1990. The wetpond is the most prominent BMP type, somewhat exceeding biofilters in numbers.Most wet ponds perform double service as quantity control ponds with live storagetoo. Many installations are wet pond-biofiltration swale treatment trains, with pondsusually but not always draining into swales. Facilities expressly designed to beinfiltration devices are relatively uncommon in these glacial till catchments.
The Little Bear Creek catchment has less service of developed areas by bothquantity and quality control BMPs compared to the other watersheds. These casesthus provide a contrast in management under comparable urbanization.
Analysis
Table 5 summarizes scoring of implementation quality for the two categories ofBMPs. The analysis shows that <4 percent of soil and vegetation storage lost todevelopment was recovered by BMPs in the Cottage Lake and Big Bear Creekcatchments, and approximately 1 percent in the Little Bear Creek cases. Thesevery low percentages are in strong contrast to the proportions of developed areashaving quantity control BMP storage, which are about an order of magnitudegreater, although still far from complete. This dichotomy signifies inadequatestandards for designing these BMPs, a point discussed further below.
Achieving the full potential of water quality treatment was similarly low. The CottageLake Creek catchment scored near the Big Bear ones despite a much lower service

13 Horner
level because of substantially more infiltration there, a factor also reflected in itsquantity control score.
Table 4. Characteristics of Watersheds in Detailed Structural BMPAssessment
Characteristica Cott-2b BiBe-1b BiBe-4b LiBe-2b
Catchment:Catchment area (km2) 17.5 9.5 29.5 16.9% developed 66.8 44.0 50.0 67.8% impervious 11.1 6.6 8.3 9.9Quantity Control (Qn) BMPs:No. Qn BMPs 56 22 59 17% Qn BMPs below ground 41.1 9.1 32.2 11.8% developed area with Qn BMPs 30.9 24.2 15.9 11.5No. Qn BMPs/km2 developed area 4.8 5.3 4.0 1.5No. Qn BMPs/km2 impervious area 28.8 35.1 24.1 10.2Average age of Qn BMPs (y) 13 8 8 9Quality Control (Ql) BMPs:No. Ql BMPs 11 22 49 5No. infiltration devices 4 3 3 0No. wet ponds 5 11 25 5No. wet ponds that are also Qn BMPs 4 9 24 4No. biofilters (swales, filter strips) 2 8 21 0% developed area with Ql BMPs 4.6 15.4 13.5 3.4No. Ql BMPs/km2 developed area 0.9 5.3 3.3 0.4No. Ql BMPs/km2 impervious area 5.7 35.1 20.0 3.0Average age of Ql BMPs (y) 11 8 7 9Stream Biology:Benthic Index of Biotic Integrity 33 29 33 25Coho Salmon:Cutthroat Trout Ratio 2.9 5.0 3.4 1.7a Average ages are at time of stream ecology work; infiltration devices considered tobe both quantity and quality controls.b Cott-2—Cottage Lake Creek site 2; BiBe-1,4—Big Bear Creek sites 1 (upstream)and 4 (downstream); LiBe-2—Little Bear Creek site 2.
Table 5. Scoring of Quantity and Quality Control BMP ImplementationScore Cott-2a BiBe-1a BiBe-4a LiBe-2a
Quantity control score (%)b 2.0-3.9 1.5-3.0 1.2-2.4 0.8-1.6Quality control score (%) 3.5 3.6 2.5 0.7a See Table 4 note b.b First number in range is score with assumption of maximum natural soil andvegetation storage (30 cm); second is with assumption of minimum natural soil andvegetation storage (15 cm).
This investigation started out to examine if the highest BMP service levels make ademonstrable difference in stream biological integrity. However, the mitigationpotential provided by even these service levels proved to be so small that thisquestion still cannot be conclusively answered. Biological measures are indeed
14 Horner
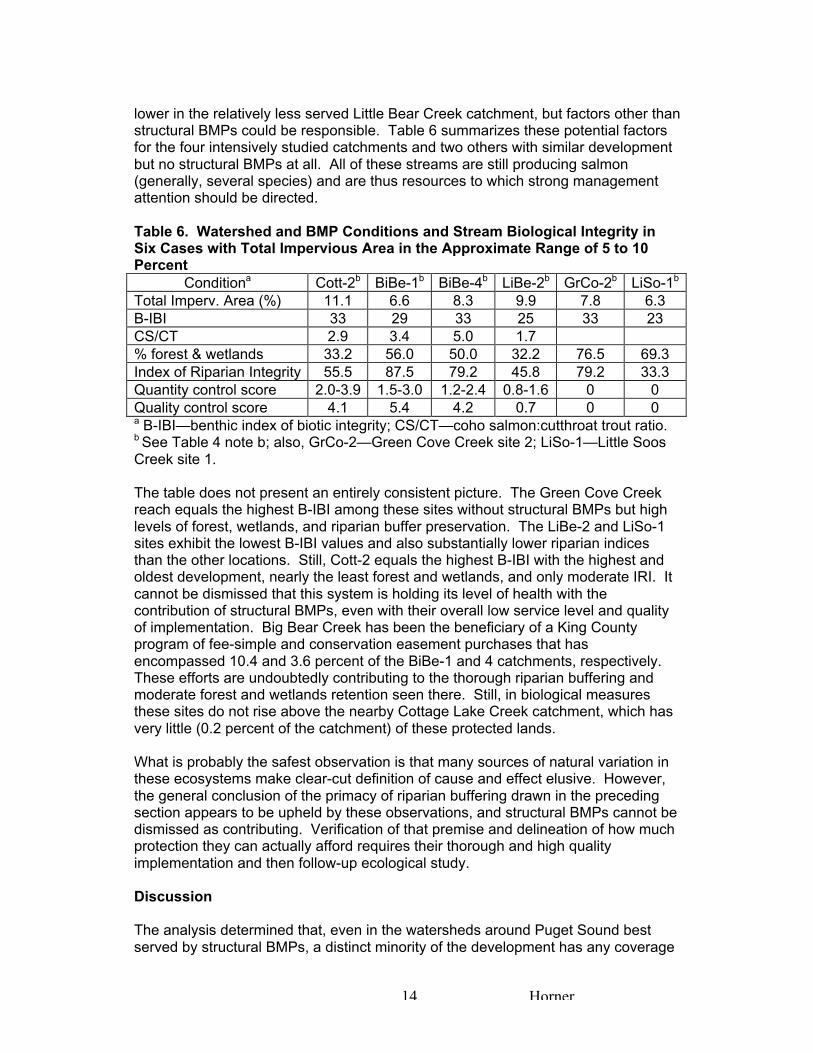
lower in the relatively less served Little Bear Creek catchment, but factors other thanstructural BMPs could be responsible. Table 6 summarizes these potential factorsfor the four intensively studied catchments and two others with similar developmentbut no structural BMPs at all. All of these streams are still producing salmon(generally, several species) and are thus resources to which strong managementattention should be directed.
Table 6. Watershed and BMP Conditions and Stream Biological Integrity inSix Cases with Total Impervious Area in the Approximate Range of 5 to 10Percent
Conditiona Cott-2b BiBe-1b BiBe-4b LiBe-2b GrCo-2b LiSo-1b
Total Imperv. Area (%) 11.1 6.6 8.3 9.9 7.8 6.3B-IBI 33 29 33 25 33 23CS/CT 2.9 3.4 5.0 1.7% forest & wetlands 33.2 56.0 50.0 32.2 76.5 69.3Index of Riparian Integrity 55.5 87.5 79.2 45.8 79.2 33.3Quantity control score 2.0-3.9 1.5-3.0 1.2-2.4 0.8-1.6 0 0Quality control score 4.1 5.4 4.2 0.7 0 0a B-IBI—benthic index of biotic integrity; CS/CT—coho salmon:cutthroat trout ratio.b See Table 4 note b; also, GrCo-2—Green Cove Creek site 2; LiSo-1—Little SoosCreek site 1.
The table does not present an entirely consistent picture. The Green Cove Creekreach equals the highest B-IBI among these sites without structural BMPs but highlevels of forest, wetlands, and riparian buffer preservation. The LiBe-2 and LiSo-1sites exhibit the lowest B-IBI values and also substantially lower riparian indicesthan the other locations. Still, Cott-2 equals the highest B-IBI with the highest andoldest development, nearly the least forest and wetlands, and only moderate IRI. Itcannot be dismissed that this system is holding its level of health with thecontribution of structural BMPs, even with their overall low service level and qualityof implementation. Big Bear Creek has been the beneficiary of a King Countyprogram of fee-simple and conservation easement purchases that hasencompassed 10.4 and 3.6 percent of the BiBe-1 and 4 catchments, respectively.These efforts are undoubtedly contributing to the thorough riparian buffering andmoderate forest and wetlands retention seen there. Still, in biological measuresthese sites do not rise above the nearby Cottage Lake Creek catchment, which hasvery little (0.2 percent of the catchment) of these protected lands.
What is probably the safest observation is that many sources of natural variation inthese ecosystems make clear-cut definition of cause and effect elusive. However,the general conclusion of the primacy of riparian buffering drawn in the precedingsection appears to be upheld by these observations, and structural BMPs cannot bedismissed as contributing. Verification of that premise and delineation of how muchprotection they can actually afford requires their thorough and high qualityimplementation and then follow-up ecological study.
Discussion
The analysis determined that, even in the watersheds around Puget Sound bestserved by structural BMPs, a distinct minority of the development has any coverage

15 Horner
at all. The existing BMPs mitigate very small percentages of the hydrologic andwater quality changes accompanying urbanization. To understand how thissituation came about, it is worth reviewing some history of stormwater managementin King County, which has jurisdiction over the relatively well served watersheds.
Agency records show the first detention ponds appearing in 1975. The first KingCounty stormwater management regulation aimed at protection of aquaticecosystems came in 1979. From the beginning of regulation, exemptions fromcompliance existed for relatively small developments (e.g., no requirement unlessthe development would create at least 5000 ft2 of impervious surface). Manydevelopment projects are single dwellings or small short plats fitting in the exemptedcategory. Exemptions largely explain why much of the developed area has nostructural BMPs.
The 1979 regulation specified peak rate control ponds on the basis of a hydrologicestimation procedure based on the Rational Method. This rather crude procedureproduced very inadequate pond sizes relative to vegetation and soil storage losses.These inadequacies resulted from the tendency of the method to underestimate pre-development discharges, which gave an artificially low target for post-developmentcontrols. Overall, detention ponds designed in this way recovered under 10 percentof the estimated lost vegetation and soil water storage (Booth, personalcommunication). These ponds thus gave very little water quantity control and,without any provisions for runoff treatment, no water quality mitigation.
A new King County regulation based on an improved method for hydrologic analysis(Santa Barbara Unit Hydrograph) took effect in 1990. This regulation alsointroduced water quality control requirements for the first time. Peak rate controlponds designed under it can replace perhaps two or three times as much loststorage as the preceding method (Booth, personal communication), an amount thatstill represents a small minority of the natural storage capacity. However, applicablelaw vests development applications filed before adoption of a new regulation at thestandard prevailing at the time of application. In the rapid urbanization climate in thearea circa 1990, many applications came under the old standard well into the 1990s.As a result, the large majority of the facilities in place when the stream ecologysurveys were performed (1994-1997) were based on the very inadequate 1979design criteria. Continuing deficiencies in design standards largely explain why,even where they are present, the facilities mitigate so little of the impact. Thesedual regulatory inadequacies of widespread exemption and insufficientimplementation standards make inevitable the small beneficial effect of structuralmanagement, even where valued resources get a relatively high level of attention.
Relationship of Structural and Non-structural BMPs
Stormwater and urban water resources management first developed around theconcept of structural BMPs but recently broadened to encompass principles oftengiven names like conservation design and low-impact development. Mostfundamentally, these principles guide where to place development and how to buildit to minimize negative consequences for aquatic ecosystems. There are manyspecific tools to implement them, but they fit generally into the broad categories ofseparating development from water bodies (i.e., retaining riparian buffers); limiting
16 Horner
impervious area in favor of natural vegetation and soil, especially forest cover; andstrategic and opportunistic use of structural BMPs. The Puget Sound databaseoffers some opportunity to examine how these structural and non-structuralstrategies might fit together and what they can accomplish in different urbanizationscenarios.
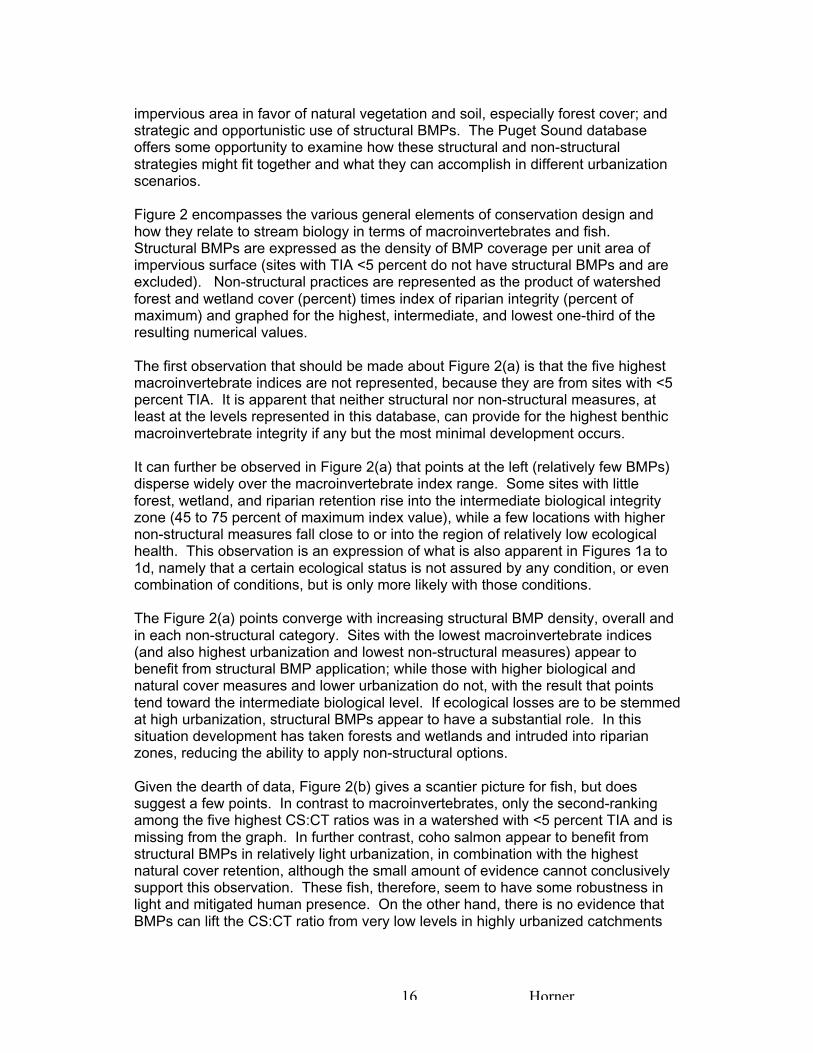
Figure 2 encompasses the various general elements of conservation design andhow they relate to stream biology in terms of macroinvertebrates and fish.Structural BMPs are expressed as the density of BMP coverage per unit area ofimpervious surface (sites with TIA <5 percent do not have structural BMPs and areexcluded). Non-structural practices are represented as the product of watershedforest and wetland cover (percent) times index of riparian integrity (percent ofmaximum) and graphed for the highest, intermediate, and lowest one-third of theresulting numerical values.
The first observation that should be made about Figure 2(a) is that the five highestmacroinvertebrate indices are not represented, because they are from sites with <5percent TIA. It is apparent that neither structural nor non-structural measures, atleast at the levels represented in this database, can provide for the highest benthicmacroinvertebrate integrity if any but the most minimal development occurs.
It can further be observed in Figure 2(a) that points at the left (relatively few BMPs)disperse widely over the macroinvertebrate index range. Some sites with littleforest, wetland, and riparian retention rise into the intermediate biological integrityzone (45 to 75 percent of maximum index value), while a few locations with highernon-structural measures fall close to or into the region of relatively low ecologicalhealth. This observation is an expression of what is also apparent in Figures 1a to1d, namely that a certain ecological status is not assured by any condition, or evencombination of conditions, but is only more likely with those conditions.
The Figure 2(a) points converge with increasing structural BMP density, overall andin each non-structural category. Sites with the lowest macroinvertebrate indices(and also highest urbanization and lowest non-structural measures) appear tobenefit from structural BMP application; while those with higher biological andnatural cover measures and lower urbanization do not, with the result that pointstend toward the intermediate biological level. If ecological losses are to be stemmedat high urbanization, structural BMPs appear to have a substantial role. In thissituation development has taken forests and wetlands and intruded into riparianzones, reducing the ability to apply non-structural options.
Given the dearth of data, Figure 2(b) gives a scantier picture for fish, but doessuggest a few points. In contrast to macroinvertebrates, only the second-rankingamong the five highest CS:CT ratios was in a watershed with <5 percent TIA and ismissing from the graph. In further contrast, coho salmon appear to benefit fromstructural BMPs in relatively light urbanization, in combination with the highestnatural cover retention, although the small amount of evidence cannot conclusivelysupport this observation. These fish, therefore, seem to have some robustness inlight and mitigated human presence. On the other hand, there is no evidence thatBMPs can lift the CS:CT ratio from very low levels in highly urbanized catchments

17 Horner
low in forest, wetlands, and riparian cover, although data are inadequate todisregard this possibility.
0
10
20
30
40
50
60
70
80
90
100
0 10 20 30 40 50 60
Number of Structural BMPs/Impervious km2
Mac
roin
vert
ebra
te In
dex
(%
of
Max
imu
m)
Highest non-structural
Intermediate non-structural
Lowest non-structural
Average TIA @ >75% of maximum = 10.4%
TIA = 6.6%
TIA = 8.3%
TIA = 36.2%
TIA = 26.0%
TIA = 36.6%
TIA = 6.0%
(a) Macroinvertebrates
0
1
2
3
4
5
6
0 10 20 30 40 50 60Number of Structural BMPs/Impervious km2
Co
ho
Sal
mo
n:C
utt
hro
at T
rou
t R
atio
Highest non-structural
Intermediate non-structural
Lowest non-structural
TIA = 6.6%
TIA = 8.3%TIA = 5.7%
(b) Fish
Figure 2. Puget Sound Biological Community Indices Versus Structural BMPDensity with the Highest, Intermediate, and Lowest One-Third of NaturalWatershed and Riparian Cover [Note: Upper and lower horizontal lines representindices considered to define relatively high and low levels of biological integrity,respectively.]
Any conclusions from this analysis must be tempered according to the scope of theunderlying data. Probably the leading factor giving caution is that no instances existof structural BMPs being exceptionally widely applied and designed to mitigate a

18 Horner
large share of the known impacts of urbanization. Therefore, the fullest potential ofthese practices has not been examined, and it is possible that extremely thoroughapplications would demonstrate additional benefits not suggested in these data.
REFERENCES
Booth, D.B. 1991. Urbanization and the natural drainage system—impacts,solutions, and prognoses. The Northwest Environmental Journal 7:93-118.
Booth, D.B., University of Washington, Seattle, WA, personal communication.
Burges, S.J., B.A. Stoker, M.S. Wigmosta, and R.A. Moeller. 1989. HydrologicalInformation and Analyses Required for Mitigating Hydrologic Effects ofUrbanization. University of Washington, Department of Civil Engineering, WaterResources Series Technical Report No. 117.
Fore, L.S., J.R. Karr, and R.W. Wisseman. 1996. Assessing invertebrateresponses to human activities: evaluating alternative approaches. Journal of theNorth American Benthological Society 15(2):212-231.
Horner, R.R., D.B. Booth, A. Azous, and C.W. May. 1997. Watershed determinantsof ecosystem functioning. In L.A. Roesner (ed.), Effects of WatershedDevelopment and Management on Aquatic Ecosystems, American Society ofCivil Engineers, New York, NY, pp. 251-274.
Horner, R.R. and C.W. May. 1999. Regional study supports natural land coverprotection as leading best management practice for maintaining streamecological integrity. Proceedings of the Comprehensive Stormwater and AquaticEcosystem Management Conference, Auckland, New Zealand, February 1999,pp. 233-247.
Jones, R.C., A. Via-Norton, and D.R. Morgan. 1997. Bioassessment of BMPeffectiveness in mitigating stormwater impacts on aquatic biota. In L.A. Roesner(ed.), Effects of Watershed Development and Management on AquaticEcosystems, American Society of Civil Engineers, New York, NY, pp. 402-417.
Maxted, J.R. 1999. The effectiveness of retention basins to protect aquatic life andphysical habitat in three regions of the United States. Proceedings of theComprehensive Stormwater and Aquatic Ecosystem Management Conference,Auckland, New Zealand, February 1999, pp. 215-222.
Maxted, J. and E. Shaver. 1997. The use of retention basins to mitigate stormwaterimpacts on aquatic life. In L.A. Roesner (ed.), Effects of WatershedDevelopment and Management on Aquatic Ecosystems, American Society ofCivil Engineers, New York, NY, pp. 494-512.
May, C.W., R.R. Horner, J.R. Karr, B.W. Mar, and E.B. Welch. 1997. Effects ofurbanization on small streams in the Puget Sound Lowland Ecoregion.Watershed Protection Techniques 2(4):483-494.