Structural and fracture analysis using EMI and FMI image ... · Structural and fracture analysis...
16
Geopersia 4 (2), 2014, PP. 169-184 Structural and fracture analysis using EMI and FMI image Log in the carbonate Asmari reservoir (Oligo-Miocene), SW Iran Ghasem Aghli 1* , Hashem Fardin 2 , Ruhangiz Mohamadian 2 , Ghasem Saedi 2 1. Department Geology, Chamran, University, Ahvaz, Iran 2. National South Iranian Oil Company (NISOC), Studies office, Ahvaz, Iran *Corresponding author, e-mail: [email protected] (received: 23/04/2014 ; accepted: 08/12/2014) Abstract Assessment of the reservoir structure and determination of theinsitu stress direction arenecessary in oil production optimization and field development. Today, the application of reservoir software and Image logsplay a central role in resolving this problem. Electric and ultrasonic imaging tools record vast amounts of high-resolution data within the borehole wall. This enables the geoscientists to describe in detailthe structuralfracture networksvery essential for stratigraphic and structural analysis and improved reservoir characterization. A Six Arm Electrical Borehole Imaging (EMI) tool has recently been developed. This tool represents further advancement in the evolution of electric borehole imaging. The electrode arrays mounted on six independent arms provide excellent pad contact and produce very high resolution images for stratigraphic and structural analysis. Furthermore,the results of this study indicate that EMI is a powerful technique for identifying thedominant porosity and defining the relationship between fractures and permeability. In this study, data from two wells(well No.3 with FMI and well No.6 EMI image log) were utilized. The results of the Velocity Deviation Log and images indicate that the production in the Asmari reservoir of this field is a combination of fractures and rock matrix. Besides, the fractures and porous zones have effectively impacted the reservoir rock properties so that two general patterns of tectonic fractures associated with longitudinal and diagonal wrinklingcan be identified. Longitudinal patterns are the dominant ones and often form the open fractures. They are mainly oriented in the N45-90W direction and are chiefly observed in the upper Asmari zones.Induced fractures and breakouts have been observed in the two wells, indicating a maximum horizontal stress orientation of 65°N in well No.6 and 295°N in well No.3. The stress direction in the western section of this oil field is therefore different from the eastern one and does not follow the general Zagros trend. Keywords: Balarud Fault, Fractures, EMI, FMI Image Logs. Introduction Fractures play a vital role in the production and migration of oil in the Zagros basin, which is a world renowned feature of the Iranian carbonate reservoirs (Roehl, 1985). Several studies have been published on fractures in this region (e.g., McQuillan, 1973, 1974; Gholipour, 1998; Rezaie & Nogole-Sadat, 2004; Ahmadhadi et al., 2007, 2008; Khoshbakht et al., 2009). Based on the works of Ahmadhadi et al., (2007, 2008) the regional fractures in the Asmari Formation are mostly sub- vertical and interpreted to have been initiated before the main Mio-Pliocene folding phase of the sedimentary cover. Hence, the fracturing observed in the Asmari Formation is interpreted as a consequence of the reactivation of the deep basement faults associated with the continental collision of the Arabian plate with Central Iranian plate (Alavi, 2007). The carbonate reservoir fractures are important as they have effectively influenced the reservoir rock properties that deal with porosity and permeability;also, the relationship between the presentday stress field and natural fractures can have significant implications for subsurface fluid flow (Serra, 1989). The presence of fractures -even very fine ones- has a considerable impact on the permeability (Rezaee & Chehrazi, 2005) and knowledge about them and their scattered patterns are helping in determination of the best location for drilling and maximum exploration (Serra & Serra, 2004).Furthermore, it is the knowledge of stress orientations at smaller basin and field scales that is of critical importance for petroleum applications such as wellbore stability and hydraulic fracture stimulation (Bell, 1996; Tingay et al., 2005). In the analysis of fractures on the carbonate reservoirs a large amount of data is used from various sources such as structural data, drilling data, petrophysical logs, cores data, production wells data and dynamic wells data (Tampson, 2000).The best method for fracture analysis is image logs. They cut costs by reducing the coring intervals and perforate zone determination (Schlumberger, 2005).Such tools normally provide the best high-resolution borehole images in the conductive (water-based) muds.
Transcript of Structural and fracture analysis using EMI and FMI image ... · Structural and fracture analysis...
Geopersia 4 (2), 2014, PP. 169-184
Structural and fracture analysis using EMI and FMI image Log in thecarbonate Asmari reservoir (Oligo-Miocene), SW Iran
Ghasem Aghli 1*, Hashem Fardin2, Ruhangiz Mohamadian2, Ghasem Saedi2
1.Department Geology, Chamran, University, Ahvaz, Iran2. National South Iranian Oil Company (NISOC), Studies office, Ahvaz, Iran*Corresponding author, e-mail: [email protected]
(received: 23/04/2014 ; accepted: 08/12/2014)
AbstractAssessment of the reservoir structure and determination of theinsitu stress direction arenecessary in oil production optimization andfield development. Today, the application of reservoir software and Image logsplay a central role in resolving this problem. Electricand ultrasonic imaging tools record vast amounts of high-resolution data within the borehole wall. This enables the geoscientists todescribe in detailthe structuralfracture networksvery essential for stratigraphic and structural analysis and improved reservoircharacterization. A Six Arm Electrical Borehole Imaging (EMI) tool has recently been developed. This tool represents furtheradvancement in the evolution of electric borehole imaging. The electrode arrays mounted on six independent arms provide excellentpad contact and produce very high resolution images for stratigraphic and structural analysis. Furthermore,the results of this studyindicate that EMI is a powerful technique for identifying thedominant porosity and defining the relationship between fractures andpermeability. In this study, data from two wells(well No.3 with FMI and well No.6 EMI image log) were utilized. The results of theVelocity Deviation Log and images indicate that the production in the Asmari reservoir of this field is a combination of fractures androck matrix. Besides, the fractures and porous zones have effectively impacted the reservoir rock properties so that two general patternsof tectonic fractures associated with longitudinal and diagonal wrinklingcan be identified. Longitudinal patterns are the dominant onesand often form the open fractures. They are mainly oriented in the N45-90W direction and are chiefly observed in the upper Asmarizones.Induced fractures and breakouts have been observed in the two wells, indicating a maximum horizontal stress orientation of65°N in well No.6 and 295°N in well No.3. The stress direction in the western section of this oil field is therefore different from theeastern one and does not follow the general Zagros trend.
Keywords: Balarud Fault, Fractures, EMI, FMI Image Logs.
IntroductionFractures play a vital role in the production andmigration of oil in the Zagros basin, which is aworld renowned feature of the Iranian carbonatereservoirs (Roehl, 1985). Several studies have beenpublished on fractures in this region (e.g.,McQuillan, 1973, 1974; Gholipour, 1998; Rezaie &Nogole-Sadat, 2004; Ahmadhadi et al., 2007, 2008;Khoshbakht et al., 2009). Based on the works ofAhmadhadi et al., (2007, 2008) the regionalfractures in the Asmari Formation are mostly sub-vertical and interpreted to have been initiatedbefore the main Mio-Pliocene folding phase of thesedimentary cover. Hence, the fracturing observedin the Asmari Formation is interpreted as aconsequence of the reactivation of the deepbasement faults associated with the continentalcollision of the Arabian plate with Central Iranianplate (Alavi, 2007).
The carbonate reservoir fractures are importantas they have effectively influenced the reservoirrock properties that deal with porosity andpermeability;also, the relationship between the
presentday stress field and natural fractures canhave significant implications for subsurface fluidflow (Serra, 1989). The presence of fractures -evenvery fine ones- has a considerable impact on thepermeability (Rezaee & Chehrazi, 2005) andknowledge about them and their scattered patternsare helping in determination of the best location fordrilling and maximum exploration (Serra & Serra,2004).Furthermore, it is the knowledge of stressorientations at smaller basin and field scales that isof critical importance for petroleum applicationssuch as wellbore stability and hydraulic fracturestimulation (Bell, 1996; Tingay et al., 2005). In theanalysis of fractures on the carbonate reservoirs alarge amount of data is used from various sourcessuch as structural data, drilling data, petrophysicallogs, cores data, production wells data and dynamicwells data (Tampson, 2000).The best method forfracture analysis is image logs. They cut costs byreducing the coring intervals and perforate zonedetermination (Schlumberger, 2005).Such toolsnormally provide the best high-resolution boreholeimages in the conductive (water-based) muds.

170 Aghli et al. Geopersia, 4 (2), 2014
Examples are the Electrical MicroImager (EMI)and Fullbore Formation MicroImager (FMI)(Halliburton, 1996). The drilling-induced fractures,breakouts, and petal-centerline fractures that areassumed to form just ahead of the drill bit willprovide additional constraints on the orientation ofthe minimum horizontal regional stress (Rajabi etal., 2010; XinNie et al., 2013). In betweendetermination of the in situ stress is very importantin the drilling and perforating stages, because anyerror will cause thewellbore wall to collapse.
Geological settingThe area under study is located in the North DezfulEmbayment (SW Iran), which is part of the Zagrosfold-and-thrust belt (McQuarrie, 1974; Alavi, 2007,2004). The Zagros mountain range is a collisionalbelt between the Iranian block (belonging toEurasia) and the Arabian plate, whose convergencecommenced at the beginning of the Late Cretaceousperiod (Ricou, 1974; Berberian & King, 1981) andaccelerated during the Late Miocene and Pliocene(Stocklin, 1968). The convergence is still activetoday, in a NNE–SSW direction (DeMets et al.,2010). The Asmari Formation (Oligo-Miocene) iscomposed of light gray (locally buff to white)shallow-marine Hippurite-bearing limestone(grainstone, pelletal packstone, dark bioclasticwackestone) with intercalations of black fissile
shale and broken by several intraformationaldisconformities (Alavi, 2004). The field understudy is a fault- bend fold that has strictly beeninfluenced by the Balarud shear zone (Sahabi,2010). The existence of the Balarud reverse faultand three strike-slip faults at the southern edge hascaused great difficulty in structural analyses (Fig.1a). Based on seismic mapping, this anticline ismore than 17 km long and 8/7 km wide.Thesouthwest edge of the anticline is more inclinedtowards the edge of the North East along the axis ofthe building it is close to 118 degrees azimuth, inthe southeast- northwest direction. The anticlinesand reverse faults in the shear zone locatedapproximately 1000 m to the south aretrusted.Some areas show an overturned limb (Fig.1b) and the stratigraphic column is shown in Figure1c.
Borehole Imaging Tools and their application inthe geology reservoirsImaging tools can be used in a wide variety ofgeological and drilling environments, providingborehole images of rock, from the karsticcarbonates to soft thinly laminated sand/shalesequences. High resolution and often almostcomplete borehole coverage images are interpretedat an interactive graphic workstation.
Figure 1-a. UGC map the Studied Field and wells location, provided by NISOC (2011)
Balarud Rivers fault
a
Structural and fracture analysis using EMI and FMI image Log in the carbonate … 171
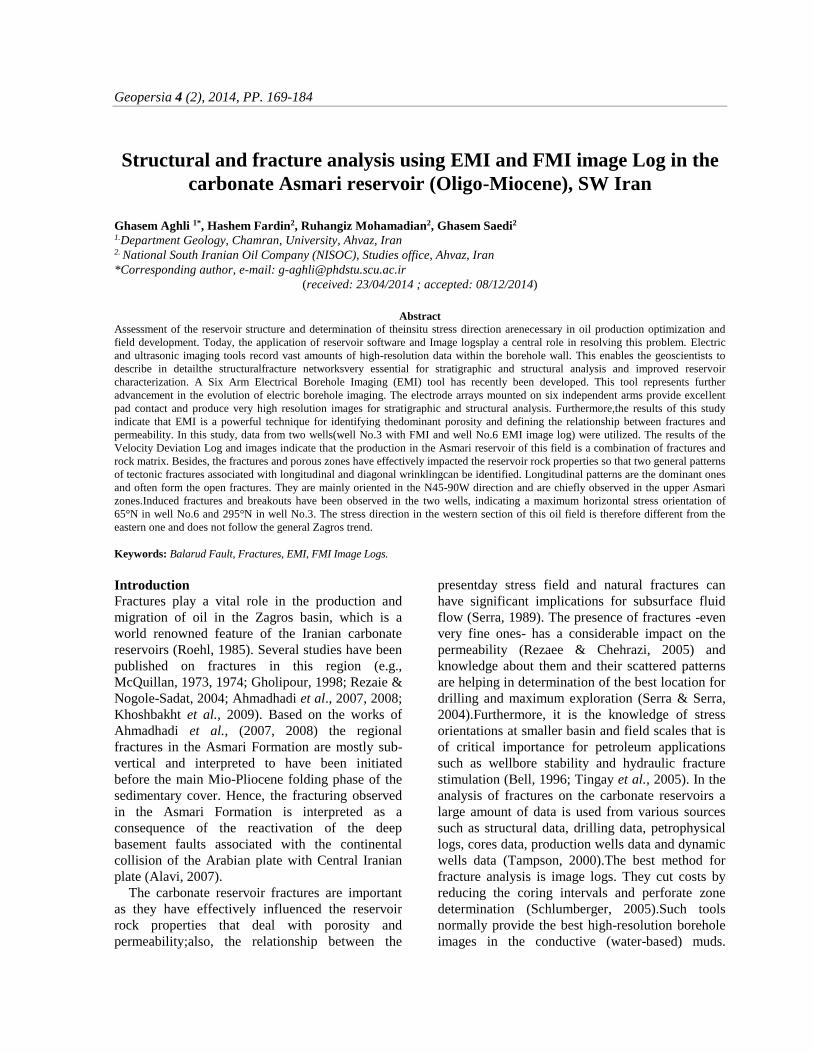
Figure 1-b. Position Balarud Trust belt and Balarud oil fields in Dezful Embayment and cross section of Balarud-Ghalehnar oil fieldsand studied Formations
Figure 1-c. stratigraphic column of the study area (Gachsaran and Aghajary formations are surface outcrops) (Sepehr &Cosegrov,2004)

172 Aghli et al. Geopersia, 4 (2), 2014
When the image is “unrolled” and displayedfrom 0° to 360°, linear features intersecting theborehole appear as sinusoids (Rider, 1996).Assuming that the images are properly oriented tothe geographic north, the peaks and troughs of thesinusoids can be related to the dip and azimuth ofthe associated feature, respectively. Thisconsequently provides fundamental informationregarding the formation encountered that otherpetrophysical logs are unable to provide. Bedding,fracture features, faults, stratigraphic features, andmany other characteristics can often be manually or(semi-) automatically identified and quantified (Ye& Rabiller, 1998).
Besides identifying the fractures and faults,borehole imaging tools are routinely used in thesupport of detailed core analysis for a variety ofother applications such as sequence stratigraphy,facies reconstruction, and diagenetic analysis. Ingeneral, the electrical images appear to be sensitive
to variations in mineralogy, porosity, and fluidcontent that highlight both natural fractures androck fabric. The acoustic image logs reveal asimilar natural fracture population, not the rockfabric, due to their lower resolution. However, dueto their full coverage, the acoustic images canreveal drilling-induced borehole wall tensilefractures, breakouts and petal- centerline fractures(Tingay et al., 2008). The FMI tools have anazimuthal resolution of 192° capable of radialmicro-resistivity measurements (vertical resolution:0.2”, vertical sampling: 0.1”, depth of investigation:30”; (Schlumberger, 1994). TheEMI Electrodearrays are mounted on six independent armsproviding excellent pad contact. This produces veryhigh resolution images for stratigraphic andstructural analysis (Halliburton, 1996). These twotools cannot be used in the oil based mud whereOBMI and UBI are applied (Table 1).
Table1. The comparison between imaging tools (Tokhmchi, 2009)
Manufacturingcompany
Depthinvestigat
ion(mm)
Maxloggingspeed
(m/hour)
Numberof
electrodeson each
flap
Numberof flaps
Boreholecoveragein 8 inch
ResolutionV H
Toolname
Type of mudMethodimaging
SchlumbergerSchlumbergerSchlumbergerHalliburtonBaker Atlas
SchlumbergerBaker Atlas
50 -1550 -15
750750 ------
9 ------
500565
1125584 ------1125 ------
16341225241010
48
------6646
40800100806532
------
55
2005
7.530
------
7.55
3055
30 ------
FMSFMIARIEMI
STAREOBMIEarth
Imager
Conductive
Nonconductive
Electrical
SchlumbergerBaker AtlasHalliburton
------ ------ ------
135 ------360
------ ------ ------
------ ------ ------
100100100
10 ------75
UBICBILCAST
Con & noncon
Sonic
Schlumberger ------ ------ ------ ------ 10 11 BHTVCon & non
conBoreholeteleviewer
Electrical Micro Imager (EMI)The Electrical Micro Imaging (EMI) tool is a newlogging service that provides core-like images ofthe borehole wall by measuring and mapping theformation micro- conductivity with pad-mountedbutton electrodes. The superior 3D and 2D imagesproduced by the EMI are possible as the designuses six independent articulating arms to maintainconsistent pad contact against the borehole wall(Halliburton, 1996). Formation images are achievedusing the 150 pad-mounted sensors distributed at25 per pad, on each of the six pads, resulting in ameasurement (Fig. 2). The current in each button isrecorded as a curve, sampled at 0.1 inch (0.25centimeters), or 120 samples per foot (Fig. 3). The
curves reflect the relative micro-conductivityvariations within the formation. These currentvariations are converted to synthetic color or gray-scaled images. The light colors represent low microconductivity, while the dark colors reflect highmicro- conductivity zones (Serra & Serra, 2004).Centralization above and below the EMI Mandreloptimizes the distribution of the six pads across thecircumference of the borehole, especially in thehorizontal and highly deviated wells. A fullnavigation package, including three orthogonalfluxgate accelerometers and three orthogonalmagnetometers, is included in the EMI tool toprovide accurate information on the tool position,motion, direction, and orientation within the

Structural and fracture analysis using EMI and FMI image Log in the carbonate … 173
borehole. The acceleration in the direction of thetool body axis is used to calculate a speed-corrected image. The tool can be run either in dipmode and /or image mode, and all button resistivitydata are recorded at a maximum logging speed of1800 ft/hr. Inthe dip mode, the tool mimics the SEDand sends only the center button resistivity data upthe hole which enables a maximum recommendedlogging speed of 3600 ft/hr. The electrical tools arethe best tools to record this activity between (FMI)with azimuthal resolution vs 192 and are capable ofradial microresistivity measurements (verticalresolution 0.2”, vertical sampling: 0.1”, depth ofinvestigation: 30”; Schlumberger, Ltd., 1994). TheEMI electrode arrays are mounted on sixindependent arms providing excellent pad contact,resulting in very high resolution images forstratigraphic and structural analysis (Halliburton,1996). Both these tools lack the capacity for use inthe oil based mud and therefore the two toolsOBMI and UBI were constructed.
Figure 2. display of EMI tool Characteristics (Halliburton,1996)
Why use the EMI Service?This tool has features that differentiate it from theother tools. For example one of the important EMIfeatures is the presence of six articulating pads,each mounted on an independent arm, facilitatingimproved electrode-to formation contact. Theindependent arm action indicates that variable padpressure is maintained against the borehole wallduring logging. The Electrical Micro Imaging tool
has scanning electrode arrays on each of its sixindependent arms. Superior imaging is producedthrough consistent pad contact with the boreholewall which provides accurate and sharp images.Another important characteristic of the EMI is thegreat depth of investigation, almost 20 times morethan that of the FMI tool (Table 1). This ability isvital for the study of vuggy reservoirs, particularlyin measuring their density and their connectivity(Aghli, 2013).
Figure 3. the electrical Micro-Imaging tool uses pad-mountedelectrodes to make high-definition resistivity measurements(Serra, & Serra, 2004)
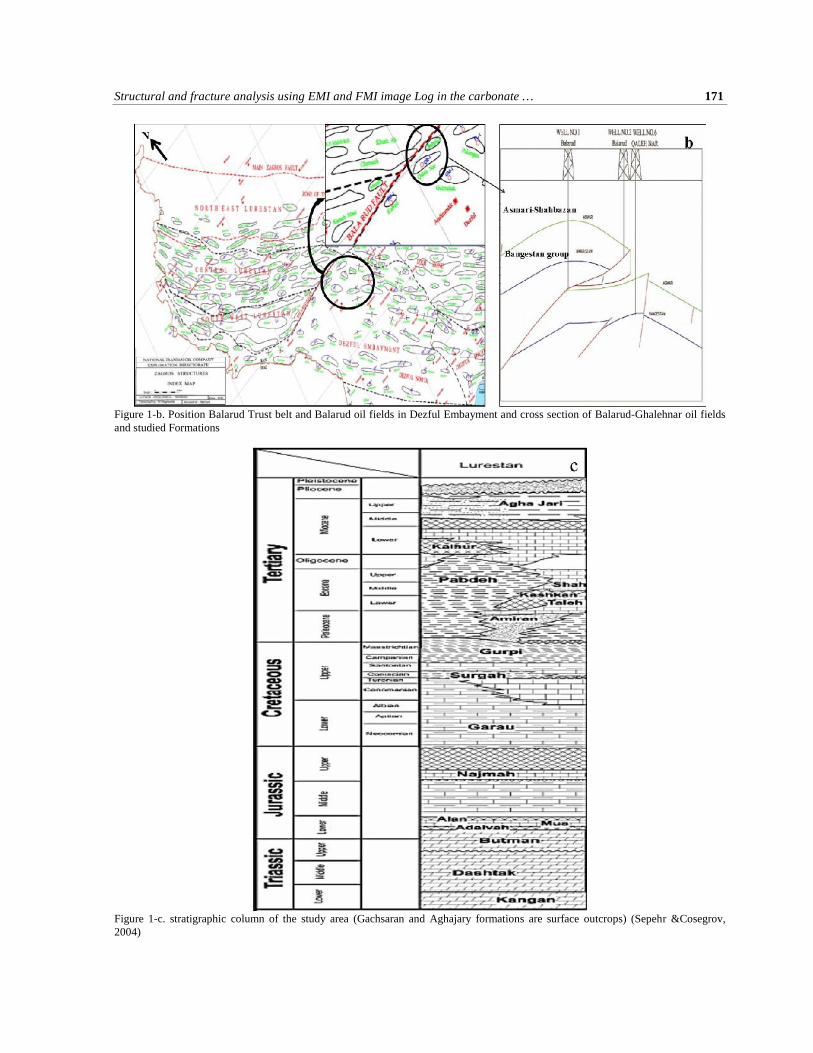
EMI reduces expenditure by reducing the coringintervals and perforate zone determination. Besidesproviding better data to boost production, EMIhelps cut costs by improving the drilling andcompletion efficiencies. In many cases, theconventional coring programs can be reduced oreven eliminated. The well completions in the multi-layered, thinly bedded or fractured reservoirscan beoptimized. Image analysis and enhancementtechniques are available for precise identification offormation reservoir characteristics and include thefollowingfeatures (Fig. 4, Halliburton, 1996): Detailed stratigraphic and sedimentological
analysis Thin bed delineation Potential secondary porosity identification Fracture analysis Quantitative high-resolution resistivity for
174 Aghli et al. Geopersia, 4 (2), 2014
improved net pay estimation Fault mapping
General structural analysis.
Figure 4. Fractures displayed on image log. (A) EMI image log and (B) FMI image log
MethodsImages were produced at the well sites. Detailedpost-acquisition analysis of the image data wasdone with high- performance interview analysissoftware. Image analysis and enhancementtechniques were available to identify precisely thecharacteristics of the formation reservoir (Fig. 4),including detailed stratigraphic andsedimentological analysis, thin bed delineation,potential secondary porosity identification, fractureanalysis and fault mapping (Schlumberger, 2003).
The main purpose of this study was tosystematically study the Asmari reservoir fracturingand bedding, their direction and type, methods toextend the fracture in the reservoir, their generationmechanisms, determination of the in situ stressdirection and determination of the permeabilityzone using the Geoframe 4.5 software.
Results and DiscussionAfter the analysis of the image logs in the two wellsNos. 3 and 6 (Fig. 1), several features such asfractures, beddings, induced fractures, boreholebreakouts and stylolites were identified. Tofacilitate the analysis, software showed the data instereonets, rose diagrams and histograms. Further
on, the results of each well will follow as separatesections, along withthe EMI ability in well No. 6.
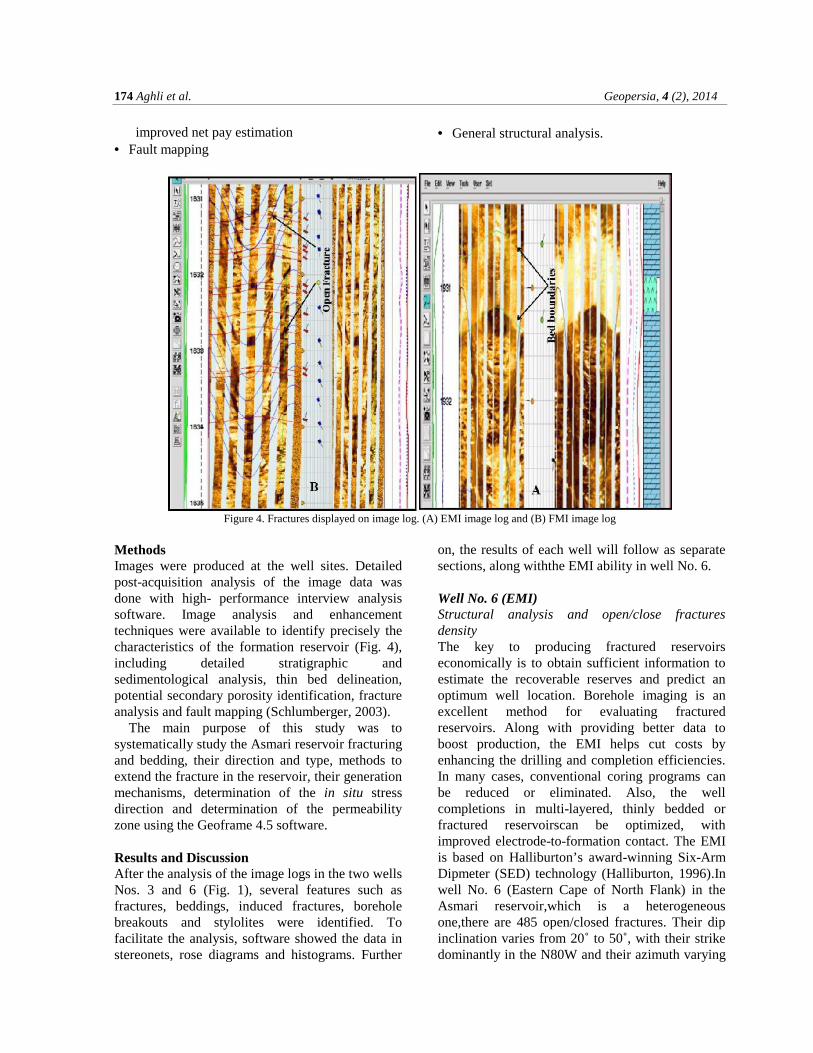
Well No. 6 (EMI)Structural analysis and open/close fracturesdensityThe key to producing fractured reservoirseconomically is to obtain sufficient information toestimate the recoverable reserves and predict anoptimum well location. Borehole imaging is anexcellent method for evaluating fracturedreservoirs. Along with providing better data toboost production, the EMI helps cut costs byenhancing the drilling and completion efficiencies.In many cases, conventional coring programs canbe reduced or eliminated. Also, the wellcompletions in multi-layered, thinly bedded orfractured reservoirscan be optimized, withimproved electrode-to-formation contact. The EMIis based on Halliburton’s award-winning Six-ArmDipmeter (SED) technology (Halliburton, 1996).Inwell No. 6 (Eastern Cape of North Flank) in theAsmari reservoir,which is a heterogeneousone,there are 485 open/closed fractures. Their dipinclination varies from 20˚ to 50˚, with their strikedominantly in the N80W and their azimuth varying
Structural and fracture analysis using EMI and FMI image Log in the carbonate … 175
from 190˚ to 200˚ from the north (Fig. 5). Both lowand high confidence resistive fractures show largescatter in their dip azimuth and strike. In this wellthe fracturesare classified into two groups. One setof fractures shown by (E) have the same as beddingstrike and are classified as the longitudinal set.
Their strikes in this well are N80W. The otherfracture set shown by (F) reveal oblique strikerelative to the bedding strike and are,therefore,considered as oblique fractures. Their strikes areN75E (Fig. 5).
Figure 5. Stereonet rose diagram and histogram of fractures in the well 6 indicated on EMI image log
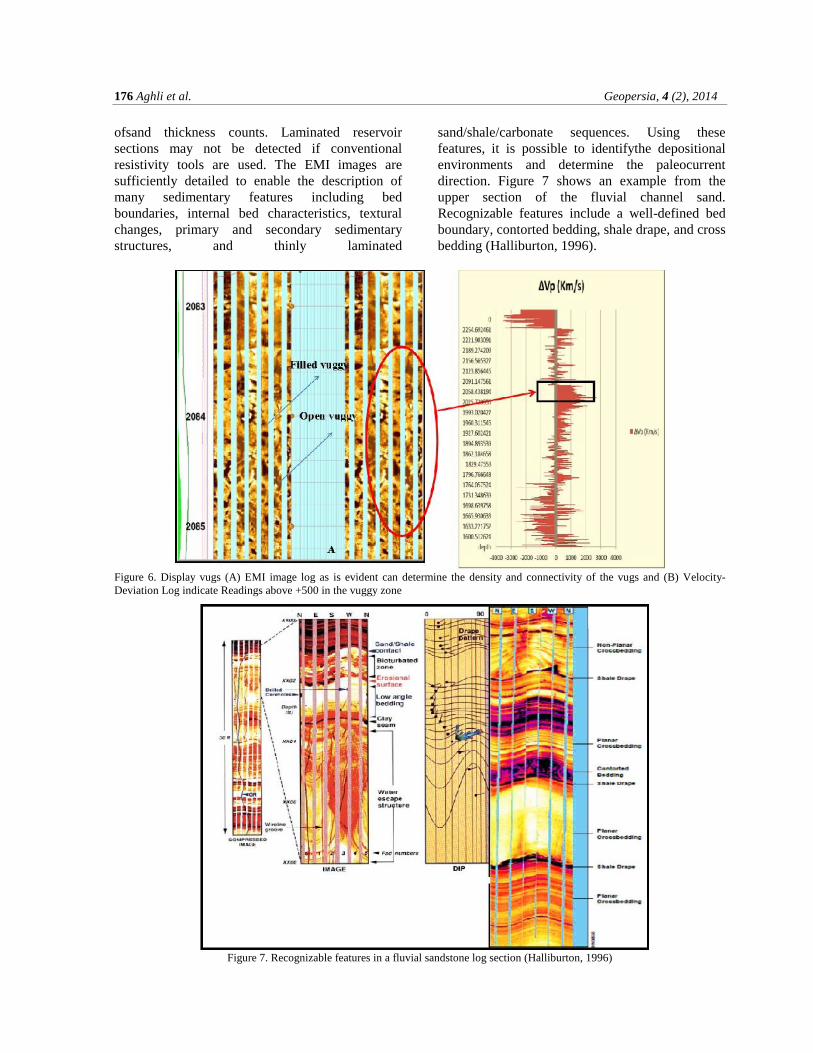
VugsAnother common type of secondary porosity foundin carbonate reservoirs are vugs. Diagenetic innature, vugs are formed when the migratingformation water dissolves the unstable material inthe surroundingrock or by sub aerial exposure ofthe rock. Although difficult to analyze with theconventional logging tools (Serra & Serra, 2004),the EMI is able to image the reservoirs containingthe secondary porosity, enabling the analyst todetermine the density and connectivity of the vugs.Figure 6 compares a vuggy carbonate Velocity-Deviation Log (VDL) and EMI image. In the EMIimage, the filled vugs appear as light coloredobjects ringed by darker colored conductivematerial, while the open (fluid filled) vugs appeardarker than the surrounding matrix and the VDL
logs indicate readings above +500 in the vuggyzoneand <-500 in the fracture zone and between+500 until -500 if the rock matrix has an importantrole in reservoir porosity (Anselmetti, F.S. andEberli G.P., 1999).In this field the production in theAsmari reservoir is a combination of fractures androck matrix (Fig. 6).
Identification and Characterization of SedimentaryFeatures:Evaluating thin-bed formations using a high-resolution resistivity curve will reduce the risk ofmiscalculating the hydrocarbon reserves. The EMIcan image bed thicknesses from a fraction of aninch to several feet. This facilitates easyidentification of the sand/ shale facies in theformation, and permits very accurate calculations
176 Aghli et al. Geopersia, 4 (2), 2014
ofsand thickness counts. Laminated reservoirsections may not be detected if conventionalresistivity tools are used. The EMI images aresufficiently detailed to enable the description ofmany sedimentary features including bedboundaries, internal bed characteristics, texturalchanges, primary and secondary sedimentarystructures, and thinly laminated
sand/shale/carbonate sequences. Using thesefeatures, it is possible to identifythe depositionalenvironments and determine the paleocurrentdirection. Figure 7 shows an example from theupper section of the fluvial channel sand.Recognizable features include a well-defined bedboundary, contorted bedding, shale drape, and crossbedding (Halliburton, 1996).
Figure 6. Display vugs (A) EMI image log as is evident can determine the density and connectivity of the vugs and (B) Velocity-Deviation Log indicate Readings above +500 in the vuggy zone
Figure 7. Recognizable features in a fluvial sandstone log section (Halliburton, 1996)

Structural and fracture analysis using EMI and FMI image Log in the carbonate … 177
Structural Dip description to this well:The accuracy of the structural dip is dependent onthe planarity and sharpness of bed boundaries;therefore,the layer/ bed boundaries were classifiedunder High Confidence and Low Confidencecategories as far as their dips are concerned. Thereare 98 low confidence (LC) beddings and 3 highconfidence (HC) beddings recognized over theentire interval. Both LC and HC beddings wereused to determine the structural dip. However,
significant variations in the bedding dip werepresent which made it difficult to identify the majorstructural dip.
However, the structural dip was deduced to be 8degrees toward N55E and strike N30W. It isnotable that the long distances between this welland the strike-slip faults and Balarud fault, beddingare more regular and their dips are less than that ofthe other wells (Fig. 8)
Figure 8. Stereonet, rose diagram and histogram of bedding in the well 6
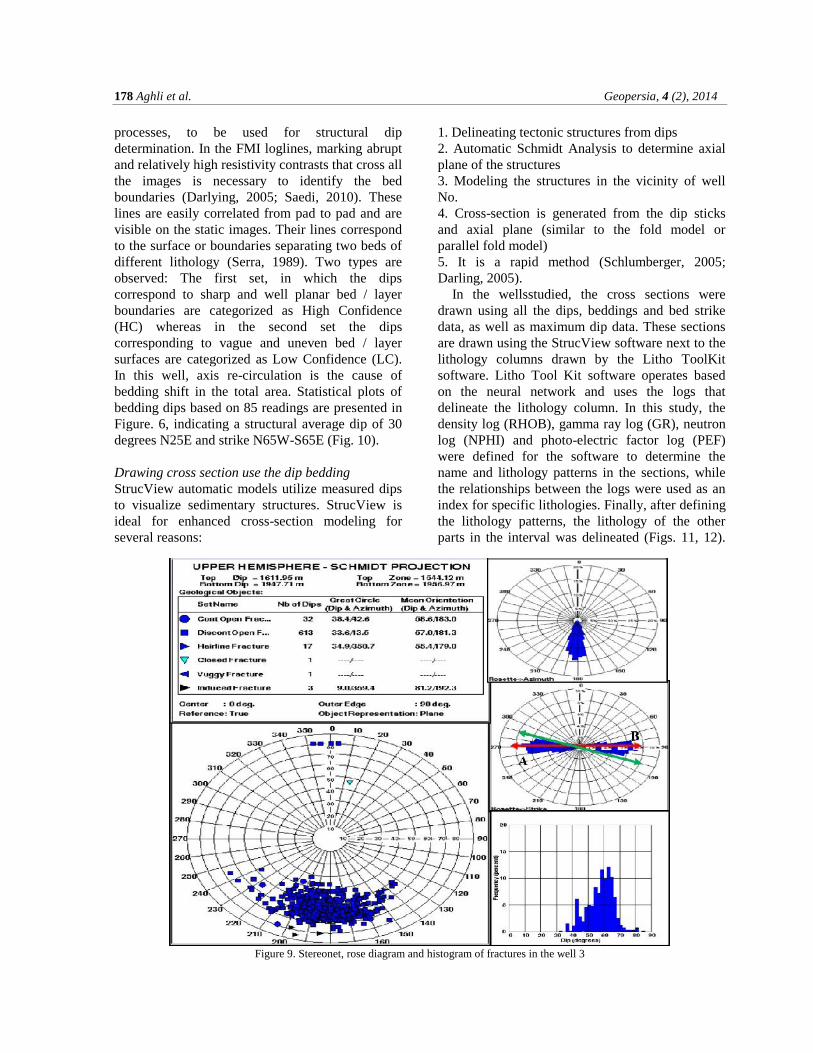
Well No. 3 (FMI)Structural analysis and open/close fracturesdensityIn well No. 3 (Western Cape of North Flank) in theAsmari reservoir,which is a heterogeneousreservoir, 665 open fractures are present. Their dipinclination varied from 30˚ to 80˚, but their strikewas dominantly N-E and their azimuth varied from180˚ to 200˚ from the north (Fig. 9). Both low andhigh confidence resistive fractures showed largescatter in their dip azimuth and strike. In this well,the fracture type can be estimated as fracturesrelated to folding which can be classified under twogroups,based on the relative fracture strike and
bedding strike (oblique and longitudinal sets). Oneset of fractures shown by (A) have the same strikeas the bedding strike; hence the term longitudinalset. Strikes in this set are almost N-W. The otherset of fractures shown by (B) have oblique strikeinto bedding strike; hence, they are consideredoblique fractures. Strikes in this set are N70E (Fig.9). It is notable that the high density fractures inwell No. 3 are related to the axis re-circulation bythe strike-slip fault near it (Aghli, 2013).
Structural Dip descriptionLayer/bed boundaries in carbonate sequences arenot always sharp and planar, due to digenetic
178 Aghli et al. Geopersia, 4 (2), 2014
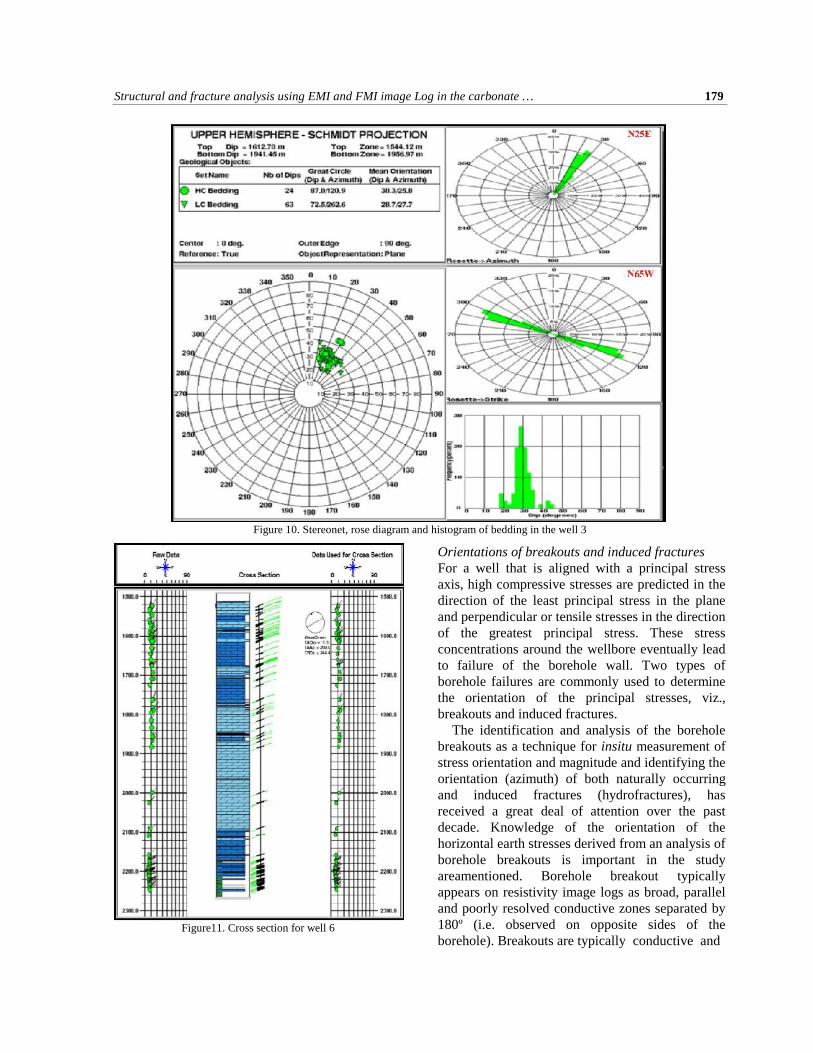
processes, to be used for structural dipdetermination. In the FMI loglines, marking abruptand relatively high resistivity contrasts that cross allthe images is necessary to identify the bedboundaries (Darlying, 2005; Saedi, 2010). Theselines are easily correlated from pad to pad and arevisible on the static images. Their lines correspondto the surface or boundaries separating two beds ofdifferent lithology (Serra, 1989). Two types areobserved: The first set, in which the dipscorrespond to sharp and well planar bed / layerboundaries are categorized as High Confidence(HC) whereas in the second set the dipscorresponding to vague and uneven bed / layersurfaces are categorized as Low Confidence (LC).In this well, axis re-circulation is the cause ofbedding shift in the total area. Statistical plots ofbedding dips based on 85 readings are presented inFigure. 6, indicating a structural average dip of 30degrees N25E and strike N65W-S65E (Fig. 10).
Drawing cross section use the dip beddingStrucView automatic models utilize measured dipsto visualize sedimentary structures. StrucView isideal for enhanced cross-section modeling forseveral reasons:
1. Delineating tectonic structures from dips2. Automatic Schmidt Analysis to determine axialplane of the structures3. Modeling the structures in the vicinity of wellNo.4. Cross-section is generated from the dip sticksand axial plane (similar to the fold model orparallel fold model)5. It is a rapid method (Schlumberger, 2005;Darling, 2005).
In the wellsstudied, the cross sections weredrawn using all the dips, beddings and bed strikedata, as well as maximum dip data. These sectionsare drawn using the StrucView software next to thelithology columns drawn by the Litho ToolKitsoftware. Litho Tool Kit software operates basedon the neural network and uses the logs thatdelineate the lithology column. In this study, thedensity log (RHOB), gamma ray log (GR), neutronlog (NPHI) and photo-electric factor log (PEF)were defined for the software to determine thename and lithology patterns in the sections, whilethe relationships between the logs were used as anindex for specific lithologies. Finally, after definingthe lithology patterns, the lithology of the otherparts in the interval was delineated (Figs. 11, 12).
Figure 9. Stereonet, rose diagram and histogram of fractures in the well 3
Structural and fracture analysis using EMI and FMI image Log in the carbonate … 179
Figure 10. Stereonet, rose diagram and histogram of bedding in the well 3
Figure11. Cross section for well 6
Orientations of breakouts and induced fracturesFor a well that is aligned with a principal stressaxis, high compressive stresses are predicted in thedirection of the least principal stress in the planeand perpendicular or tensile stresses in the directionof the greatest principal stress. These stressconcentrations around the wellbore eventually leadto failure of the borehole wall. Two types ofborehole failures are commonly used to determinethe orientation of the principal stresses, viz.,breakouts and induced fractures.
The identification and analysis of the boreholebreakouts as a technique for insitu measurement ofstress orientation and magnitude and identifying theorientation (azimuth) of both naturally occurringand induced fractures (hydrofractures), hasreceived a great deal of attention over the pastdecade. Knowledge of the orientation of thehorizontal earth stresses derived from an analysis ofborehole breakouts is important in the studyareamentioned. Borehole breakout typicallyappears on resistivity image logs as broad, paralleland poorly resolved conductive zones separated by180º (i.e. observed on opposite sides of theborehole). Breakouts are typically conductive and
180 Aghli et al. Geopersia, 4 (2), 2014
Figure 12. Cross section for well 3
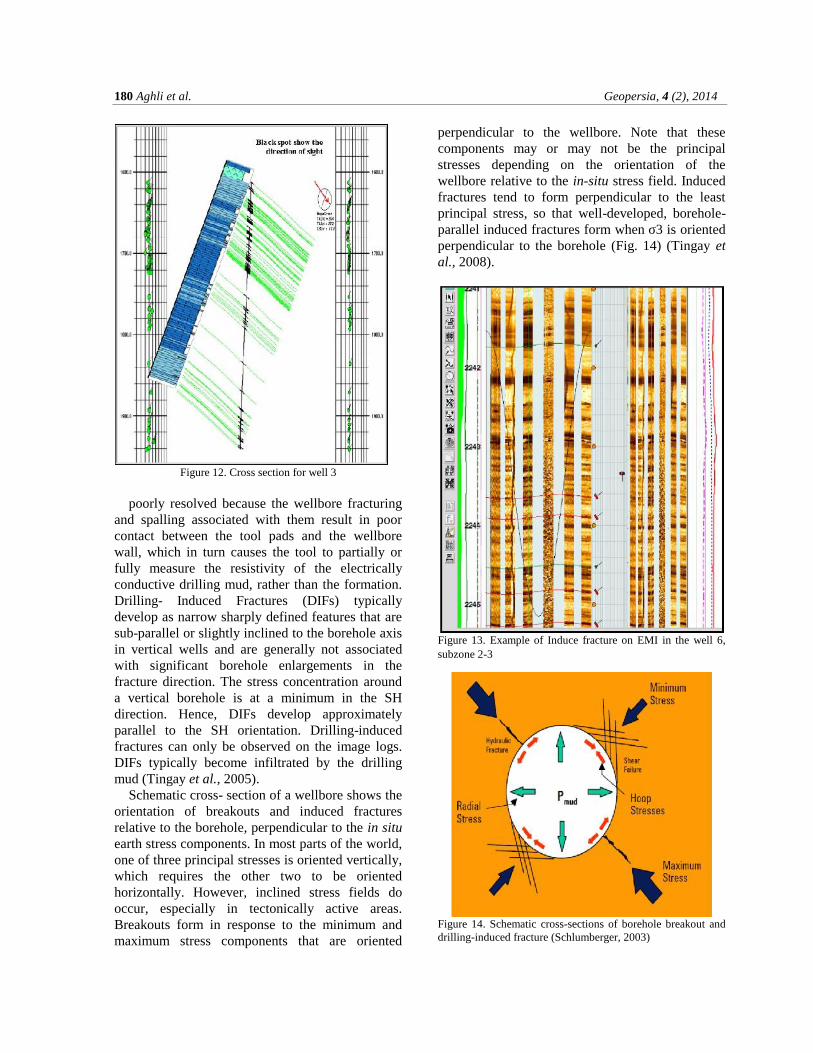
poorly resolved because the wellbore fracturingand spalling associated with them result in poorcontact between the tool pads and the wellborewall, which in turn causes the tool to partially orfully measure the resistivity of the electricallyconductive drilling mud, rather than the formation.Drilling- Induced Fractures (DIFs) typicallydevelop as narrow sharply defined features that aresub-parallel or slightly inclined to the borehole axisin vertical wells and are generally not associatedwith significant borehole enlargements in thefracture direction. The stress concentration arounda vertical borehole is at a minimum in the SHdirection. Hence, DIFs develop approximatelyparallel to the SH orientation. Drilling-inducedfractures can only be observed on the image logs.DIFs typically become infiltrated by the drillingmud (Tingay et al., 2005).
Schematic cross- section of a wellbore shows theorientation of breakouts and induced fracturesrelative to the borehole, perpendicular to the in situearth stress components. In most parts of the world,one of three principal stresses is oriented vertically,which requires the other two to be orientedhorizontally. However, inclined stress fields dooccur, especially in tectonically active areas.Breakouts form in response to the minimum andmaximum stress components that are oriented
perpendicular to the wellbore. Note that thesecomponents may or may not be the principalstresses depending on the orientation of thewellbore relative to the in-situ stress field. Inducedfractures tend to form perpendicular to the leastprincipal stress, so that well-developed, borehole-parallel induced fractures form when σ3 is orientedperpendicular to the borehole (Fig. 14) (Tingay etal., 2008).
Figure 13. Example of Induce fracture on EMI in the well 6,subzone 2-3
Figure 14. Schematic cross-sections of borehole breakout anddrilling-induced fracture (Schlumberger, 2003)

Structural and fracture analysis using EMI and FMI image Log in the carbonate … 181
Hydraulic induced fractures tend to be inclinedto the wellbore when σ3 are inclined to thewellbore, although in this case, they may not beformed perpendicular to σ3. Its trend is anindication of the minimum horizontal. Insitu stress
orientations were determined based on boreholebreakouts identified in well No. 6. The EMI imagesshowed borehole breakout striking on the averageNW-SE (Fig. 15A), which is parallel to theminimum horizontal stress orientation in this area.
Figure15 a. Maximum and minimum main stresses direction in the field around wells (blue arrows indicate max stress and greenarrows indicate min stress) using the induced fractures. Stress directions different from western section. Therefore, western sectiondoes not follow Zagros trend to have Balarud shear zone
Figure 15 b. Maximum horizontal stress orientations in Iran from the World Stress Map database and from the wells analyzed herein.Red circle shows location of studied wells and heavy arrow shows motion of the Arabian plate relative to the Eurasia (Rajabi et al.,2010)

182 Aghli et al. Geopersia, 4 (2), 2014
Any drill induced on this well and well No. 3 inthe maximum horizontal stress direction, therefore,can be inferred to be NW-SE. If they haddeveloped, they would be oriented NE-SW, to beparallel to the maximum horizontal stressorientation. In this oil field, stress direction isdifferent in the Eastern sectioncompared with theWestern one.
Therefore, the western section does not followthe general Zagros Trend (Alavi, 2004, 2007) tohavethe Balarud shear zone (Fig. 15B). Maximumhorizontal stress direction in the eastern section,therefore, can be inferred to be NE-SW by the EMIin well No. 6 and FMI in well No. 2 (Fig. 15). Itshould be noted that the wrong determination of theinsitu stress direction may cause borehole collapseso the perforating process needs to done in thedirection of maximum stress (Mohebbi et al.,2007).
Conclusions1. EMI has special characteristics that differentiateit from other tools. For example, one of theimportant EMI features is that it utilizes sixarticulating pads, each mounted on an independentarm, facilitating improved electrode-to-formationcontact. The superior imaging is produced throughconsistent pad contact with the borehole wall whichprovides accurate, sharp images. Another importantability of the EMI is the great depth ofinvestigation, almost 20 times more than that of theFMI tool. This capability is vital for the study ofthevuggy reservoirsin measuring their density andtheir connectivity. The EMI cuts costs by reducingcoring intervals and accurately determining theperforation zones.2. The wellNo. 3 statistical plots of bedding dipsbased on 85 readings indicated a structural averagedip of 30 degrees N25E and strike of N65W-S65E.In this well, the axis re-circulation is the cause ofthe bedding shift than the total areaand in well No.6 the structural dip is deduced to be 8 degreestoward S60E and strike N30W.As this well is faraway from the strike-slip and Balarud fault,beddings are more regular and their dips are lessthan those observed in other wells.3. Fracture type can be classified as those fracturesrelated to foldings that are based on relativefractures strike and bedding strike.These fracturesare classified into two groups: oblique andlongitudinal sets. In well No. 3, the longitudinal set
has the same strike as the bedding (N80W) and theoblique set strikes are N70E. In this well 665 openfractures are present. Their dip inclination variesfrom 30 to 80˚ and their strike is dominantly N-Ewhile their azimuth varies from 180 to 200˚ fromthe north. In well No. 6 there are 485 open/closedfractures, their dip inclination varies from 30 to 60degrees and their strike are dominantly N80Wwhile their azimuth varies from 190 to 200˚ fromthe north. The longitudinal set strike in this well isN80W and the oblique set strike is N75E.4. In this oil field, borehole breakout and inducedfractures show stress direction very different fromthose of the western section. Therefore, the westernsection does not follow the Zagros trend to includethe Balarud shear zone. In the western section, themaximum horizontal stress direction, therefore, canbe inferred to be N75W-S75E to N15W-S15W byFMI on well No. 3 and EMI in wellNo. 6. In theeastern section the maximum horizontal stressdirection, therefore, can be inferred to be N50E-S50W by the EMI on well No. 6 and FMI on wellNo. 3 (Zagros trend).5. StrucView and Litho Toolkit software results onthe dips and lithology in the different zones had alarge correlation with the petrophysical logs andgraphic well logs results. Dominating the reservoirlithology is limestone, dolomitic limestone andshaly limestone with anhydrite veins. Fractures areconcentrated in the limestone and dolomite zones.6. This oil field is a fault-bendfold that has strictlybeen influenced by the Balarud shear zone. Theexistence of the Balarud reverse fault and threestrike-slip faults at the southern edge has causedgreat difficulty in the structural analyses. Forexample,the high density fractures in well No. 3 arerelated to theAxis Re- circulation bystrike- slipfault nearby.7. Regarding the stresses they are reverse on thewestern section for the presence of the Balarudshear zone. This oil field is a new exploratory oilfield.and the right maximum stressshould beconsidered in the future for drilling as well as thebest method for drilling which is the deviationdrilling for the high density fractures in the Asmarireservoir.
AcknowledgmentThe authors thank the National Iranian South OilCompany (NISOC) for sponsorship, datapreparation and permission to publish the data. The
Structural and fracture analysis using EMI and FMI image Log in the carbonate … 183
authors extend their gratitude to S. Tabatabayiforhis cooperation and also sincerely thank Bahman
Soleimani and Abbas Charchi for their insightfuland constructive reviews.
ReferencesAghli, G., 2013. Fracture analysis of Asmari reservoir in Balarud oil field using the image logs. Mc.S. thesis. Shahid
Chamran University, Ahvaz, Iran, 166 pp.Ahmadhadi, F., Daniel, J., Azzizadeh, M., and Lacombe, O., 2007. Evidence for pre-folding vein development in the
Oligo-Miocene Asmari Formation in the Central Zagros Fold Belt, Iran. Tectonics, 1–22.Alavi, M., 2004. Regional stratigraphy of the Zagros fold-thrust belt of Iran and its proforeland evolution. American
Journal of Science, 304 (1 ): 1- 20.Alavi, M. (2007). Structures of the Zagros fold-thrust belt in Iran. American Journal of Science , 307 (9 ): 1064–1095.Anselmetti, F.S., Eberli G.P.,1999. The Velocity Deviation Log; A Tool to Predict Pore Type Permeability Trends in
Carbonate Drill Holes From Sonics And Porosity or Density Logs, AAPG Bulletin, 83(3): 450-466Bell, J. S. (1996). Petro Geoscience 1. IN SITU STRESSES IN SEDIMENTARY ROCKS (PART 1): MEASUREMENT
TECHNIQUES. Geoscience Canada; 23- 2Berberian, M., King, G.C.P., 1981. Towards a paleogeography and tectonic evolution of Iran, Can. J. Earth Sci. 18: 210–
265.Darling, T., 2005. Well Logging and Formation Evaluation Elsevier Science. 336 p..DeMets, C., Gordon, R.G. Argus, D.F., 2010. Geologically current plate motions. Geophys. J. Int. 181: 1–80.Gholipour, A. M., 1998. Patterns and structural positions of productive fractures in the Asmari Reservoirs, Southwest
Iran. Journal of Canadian Petroleum Technology, 37(1): 44- 50.Halliburton. 1996. Electrical Micro Imaging Service (Sales Kit). 71 pp.Khoshbakht, F., Memarian, H., Mohammadnia, M., 2009. Comparison of Asmari, Pabdeh and Gurpi formation’s
fractures, derived from image log. Journal of Petroleum Science and Engineering, 67(1-2): 65–74.McQuillan, H. (1973). Small-scale fracture density in Asmari formation of southwest Iran and its relation to bed thickness
and structural setting. AAPG Bulletin, 57: 2367–2385.McQuillan, H. 1974. Fracture patterns on Kuh-e Asmari Anticline, Southwest Iran. AAPG Bulletin, 58(2): 236- 246.Mohebbi, A., Haghighi, M., Sahimi, M. 2007. Conventional logs for fracture detection and characterization in one of the
Iranian field. In International Petroleum Technology Conference, 4-6 December, Dubai, U.A.E. Dubai: InternationalPetroleum Technology Conference.
Rajabi, M., Sherkati, S., Bohloli, B., Tingay, M., 2010. Subsurface fracture analysis and determination of in-situ stressdirection using FMI logs: An example from the Santonian carbonates (Ilam Formation) in the Abadan Plain, Iran.Tectonophysics, 492(1-4): 192- 200.
Rezaee, M. R., Chehrazi, A. 2005. Fundamentals of Well Log Interpretation (First Edit., p. 699). Tehran: University ofTehran (in Persian).
Rezaie, A. H., Nogole-Sadat, M. A., 2004. Fracture Modeling in Asmari Reservoir of Rag-e Sefid Oil-Field by usingMultiwell Image Log (FMS/FMI). Iranian International Journal of Science, 5(1): 107–121.
Ricou, L.E., 1974. L'évolution géologique de la région de Neyriz (Zagros iranien) et l'évolution structurale des zagrides,Thèse. Université d'Orsay, France.
Rider, H., 1996. The Geological Interpretation of Well Logs. Gulf Publishing.Roehl, P.O., Choquette, P. W. 1985. Carbonate Petroleum Reservoirs. Springer-Verlag. 622 pp.Saedi, G., 2010. Fracture analysis of Asmari reservoir in Lali oil field using the FMI image log. Mc.S. thesis.Shahid
Chamran University, Ahvaz, Iran. 190 pp.Sahabi, F. 2010. Study of Balarud rivers fault and its roles on the area structural. 6th International Conference on
Seismology and Earthquake Engineering. SEE6/ /IIEES, (In Persian).Sepher, M, Cosgrove, J, 2005. The role of the Kazerun Fault Zone in the formation and deformation of the Zagros Fold–
Thrust Belt, Iran.Tectonics, 24Schlumberger (1994). FMI Fullbore Formation MicroImager. Houston: Schlumberger Educational Services.Schlumberger (2003). Using borehole imagery to reveal key reservoir features. In Reservoir Optimization Conference.
Tehran, Iran.Schlumberger (2005). GeoFrame 4.2, BorView User’s Guide. Schlumberger Ltd.Serra, O. (1989). Formation MicroScanner image interpretation (p. 117). Schlumberger Educational Services.Serra, O., Serra, L., 2004. Well Logging: Data Acquisition and Applications (p. 674). Editions Technip. Retrieved fromStocklin, J., (1968). Structural history and tectonics of Iran: a review. AAPG Bull. 52: 1229- 1258.Tingay, M., Müller, B., Reinecker, J., Heidbach, O., Wenzel, F., & Flecknstein, P., 2005. Understanding tectonic stress in
the oil patch; the World Stress Map Project. Leading Edge, 24(12): 1276- 1282.

184 Aghli et al. Geopersia, 4 (2), 2014
Tingay, M., Reinecker, J., Müller, B., 2008. Borehole breakout and drilling-induced fracture analysis from image logs.World Stress Map Project.
Tokhmechi, B. (2009). Identification and categorization of joints using data fusion approach, emphasizing on AsmariFormation. University of Tehran. 155pp.
Ye, S., Rabiller, P., 1998. Automated fracture detection on high resolution resistivity borehole imagery. In SPE annualtechnical conference and exhibition 777–784 pp.