Structural Analysis of Sails including Composite … Congresso/MECCANICA_STRUT… · Structural...
10
Structural Analysis of Sails including Composite Material Model Benedetto Allotta 1 , Stefano Falomi 1 , Andrea Schneider 1 ,Piercarlo Molta 2 1 Department of Energy Engineering, University of Florence, Italy E-mail: benedetto.allotta@unifi.it, [email protected]fi.it, [email protected]fi.it 2 One Sails, Italy E-mail: [email protected] Keywords: large displacement, sail, composite materials. SUMMARY. The effective design of sails requires a combined activity in which structural and aero- dynamic studies need to be performed. Nowadays, the performances of a sail can be evaluated by CFD calculations, which allow to assess its behavior to different wind conditions. However, the description of a sail as a rigid boundary can lead to unacceptable approximations: its membrane structure is very sensitive, in terms of deformation, to changes in the local pressure on its surfaces due to different flow conditions and different trimming. This leads to the need of aerodynamic and structural combined models. One important concern of a designer is the weight, which has to be as low as possible. Conversely, the sail has to resist to the stresses due to the aerodynamic loads. In addition to the (obvious) issue of strength, a very important feature is sail stiffness: given a certain flow condition, the deformed shape of the sail depends on its stiffness, and vice versa, the local flow will depend on the deformed shape. So a great improvement in sail’s performances can be done if the stiffness is distributed on the sail surface, using as a criterion the deformed shape which the designer wants to obtain for a reference flow condition. In this paper, a combined aerodynamic and structural analysis is performed on the mainsail of a 130-feet fast cruising sloop. It is a simplified analysis, in which the aerodynamic load is calculated from a CFD analysis on a expected deformed of the sail, evaluated by the analysis of photographs during navigation. The aero- dynamic load is applied to a Non-Linear structural model of the sail, which reflects the actual distribution of stiffness of the real sail. The effects of regulations which can be done during navigation (flexural load on the mast, position of the clew angle) on the aerodynamic properties of the profile (distribution of twist and camber) will be shown, as well as the changes in the stresses of carbon fiber yarns. 1 INTRODUCTION The structural analysis of a sail requires an accurate description of the distribution of stiffness on the sail surface, accounting for the properties of all the materials which are part of the sail. Modern sails are usually manufactured as follows: a composite matrix with kevlar fibers is cut with a defined shape, given by aerodynamic criteria; then a web of carbon fibers is distributed on the sail to give it strength and stiffness. The number of fibers has to be limited in order to contain the total weight. A detailed structural model [1], which describes the fibers’ pattern, allows first to understand if the number of fibers is sufficient to give the necessary strength, but also allow to see how the deformed shape depends on number, position, and orienta- tion of fibers. A MatLab™ routine was developed, which given the exact pattern of fibers which will be placed on the sail, output a file which contains a web of cable elements. Then the surface of the sail is reconstructed by triangularization of the nodes defined by the web. These elements (cables and triangles) define a Finite Ele- ment Model in the Nastran™ environment, which is solved by a Non-Linear approach, needed to properly 1
Transcript of Structural Analysis of Sails including Composite … Congresso/MECCANICA_STRUT… · Structural...
Structural Analysis of Sails including Composite Material Model
Benedetto Allotta1, Stefano Falomi1, Andrea Schneider1,Piercarlo Molta2
1Department of Energy Engineering, University of Florence, ItalyE-mail: [email protected], [email protected], [email protected]
2One Sails, ItalyE-mail: [email protected]
Keywords: large displacement, sail, composite materials.
SUMMARY. The effective design of sails requires a combined activity in which structural and aero-dynamic studies need to be performed. Nowadays, the performances of a sail can be evaluated by CFDcalculations, which allow to assess its behavior to different wind conditions. However, the description of asail as a rigid boundary can lead to unacceptable approximations: its membrane structure is very sensitive,in terms of deformation, to changes in the local pressure on its surfaces due to different flow conditions anddifferent trimming. This leads to the need of aerodynamic and structural combined models.One important concern of a designer is the weight, which has to be as low as possible. Conversely, the sailhas to resist to the stresses due to the aerodynamic loads. In addition to the (obvious) issue of strength, avery important feature is sail stiffness: given a certain flow condition, the deformed shape of the sail dependson its stiffness, and vice versa, the local flow will depend on the deformed shape. So a great improvementin sail’s performances can be done if the stiffness is distributed on the sail surface, using as a criterion thedeformed shape which the designer wants to obtain for a reference flow condition.In this paper, a combined aerodynamic and structural analysis is performed on the mainsail of a 130-feet fastcruising sloop. It is a simplified analysis, in which the aerodynamic load is calculated from a CFD analysison a expected deformed of the sail, evaluated by the analysis of photographs during navigation. The aero-dynamic load is applied to a Non-Linear structural model of the sail, which reflects the actual distributionof stiffness of the real sail. The effects of regulations which can be done during navigation (flexural load onthe mast, position of the clew angle) on the aerodynamic properties of the profile (distribution of twist andcamber) will be shown, as well as the changes in the stresses of carbon fiber yarns.
1 INTRODUCTIONThe structural analysis of a sail requires an accurate description of the distribution of stiffness on the
sail surface, accounting for the properties of all the materials which are part of the sail. Modern sails areusually manufactured as follows: a composite matrix with kevlar fibers is cut with a defined shape, given byaerodynamic criteria; then a web of carbon fibers is distributed on the sail to give it strength and stiffness.The number of fibers has to be limited in order to contain the total weight. A detailed structural model [1],which describes the fibers’ pattern, allows first to understand if the number of fibers is sufficient to give thenecessary strength, but also allow to see how the deformed shape depends on number, position, and orienta-tion of fibers.A MatLab™ routine was developed, which given the exact pattern of fibers which will be placed on thesail, output a file which contains a web of cable elements. Then the surface of the sail is reconstructed bytriangularization of the nodes defined by the web. These elements (cables and triangles) define a Finite Ele-ment Model in the Nastran™ environment, which is solved by a Non-Linear approach, needed to properly
1

describe the large displacement and large deformations due to the pressure and trimming loads.
In addition, a routine which can transfer the aerodynamic loads to the structural model was created,allowing the use of different grids in CFD and structural calculations, and allowing to define in each modelthe most efficient mesh (e.g. in a CFD calculation, the grid is usually coarse away from the edges, due to thelower gradients of pressure).The deformed shape of the sail is then postprocessed, in order to analyze all the features of the profile atdifferent heights in terms of maximum camber to chord, distance between maximum camber and the leadingedge of profile (draft), inlet and outlet flow angle, and twist. This allow to assess the aerodynamic propertiesof the sail and then decide to change the pattern of carbon fibers to improve them.
2 THE MILLENNIUM PROCESSThe structural model has been developed in cooperation with One Sails Italy, in order to give an accurate
description of the distribution of stiffness of the sails which are to be manufactured. In particular, theproducts which will be analysed are built using the Millennium process. The Millennium sails have a lowerdenier count (DPI) if compared with those of others sailmakers, but this feature is related to the particularmanufacturing process. In the standard manufacturing process, continous yarns are laid onto the sail surface.Most of sailmakers fix yarns in a certain position by glueing the two sides of the membrane using a resin(which is a mixture of thermosetting epoxide and an hardener) which impregnates the carbon fiber. This willinitially produce a very strong, well bounded sail. Over time, however, the resin shows a brittle behaviour,starting to break down as the sail is hoisted, flapped and then folded after use. So the resin becomes amaterial which adds weight to the sail, without giving stiffness. This means that in time, the weight of thesail remains the same, while stiffness and strength are reduced. Moreover the breaking of the resin leads todelamination, whereby the two sides of the membrane come apart and the sail loses structural strength withnothing to hold the yarns in place. This means that for cruising sails, which are to be used for long periods,it is necessary to use a higher density yarn layout, which provides an higher durability: this means that whenthe sail is new the number of yarns is superabundant, but this density is needed because as the resin breaksdown, a certain amount of yarns will not give no more strength to the structure.The Millennium process removes resine from the membrane production. The outer coating of the Millenniumsail is made from 12 micron Dupont Class A Mylar. On one side of the Mylar, a fine grid of Kevlar is placedand an exclusively developed polymer is applied to hold this grid. The yarns, which are continous rovingsof carbon fibers, are laid uninterrupted on this layer and holded in place until the final bonding stage usinga very light adhesive, which starts to evaporate as the fibers are laid down. The second layer of Mylar withfusion polymer is placed down and then pressure and heat loads are applied in order to fuse the two layers ofpolymer which form a new single layer, which encapsulate but not impregnate the carbon threads, leaving thefibres free to slide against each other. This lead to high strength and durabilty, using a lower yarn density thanthose used by other manufacturers. This manufacturing process lead to a very light sail, assuring a reductionof weight which is about 15-30%, depending on the sail dimensions. The new challenge is to additionallyoptimize the position of the yarns, in order to have the desired stiffness distribution. In particular, yarnshave to distributed in order to have, in a reference wind condition, a certain deformed shape which ensuresthe best aerodynamic behaviour. This can lead also to an additional reduction in weight, removing yarnsanywhere the stiffness is superabundant and there is not a significant reduction in sail’s strength.This means that it is very important to realize a model which reflects the stiffness distribution on the sail.Describing the surface of the sail with 2-D elements, and then defining a composite material for theseelements using a medium value of the density of yarns would not give the accuracy that we want to achieve.So it was decided to realize a structural model which includes 1-D elements. These elements are created
2

using the same drawing which is used by the manufacturing unity to lay the yarns down on the polymer. Ofcourse, in order to have reasonable calculation times, each yarn is not described by a 1D element, but each1D element define a group of 40 aligned yarns.
3 CFD ANALYSISThe CFD calculation is needed to calculate the aerodynamic loads acting on the sail. The pressure
distribution on the sail surface is computed using the HYDRO code, which is an incompressible version ofthe TRAF code [2]. TRAF code is a fully viscous, unsteady, multi-grid, multi-block code developed by theUniversity of Florence, capable of solving 3D flows using non periodic H-type or C-type grids. The temporaldiscretization of the time-dependent equations is achieved using an explicit four-stage Runge-Kutta schemeuntil the steady state solution is reached.Sails and mast are described as a rigid boundary with no-slip condition, and aerodynamic quantities aregiven at inlet (total pressure and flow angles) and outlet (static pressure). These quantities are defined usinga Velocity Prediction Program (VPP) [3].The deformed shape of the sail is described using Bezier Curves, superimposed on the pictures taken duringnavigation on three or more draft stripes (usually at 25, 50 and 75% of the span of the sail) (Fig. 1).The knowledge of these profiles together with the planform and the principal measurement of the rig allow
Figure 1: Principal Parameters used to describe the profile.
to reconstruct the three-dimensional geometry through the use of a simple Fortran program.The output of the CFD is a file in which the differential pressure between pressure side and suction side isgiven for each grid point defined on the sail.
3
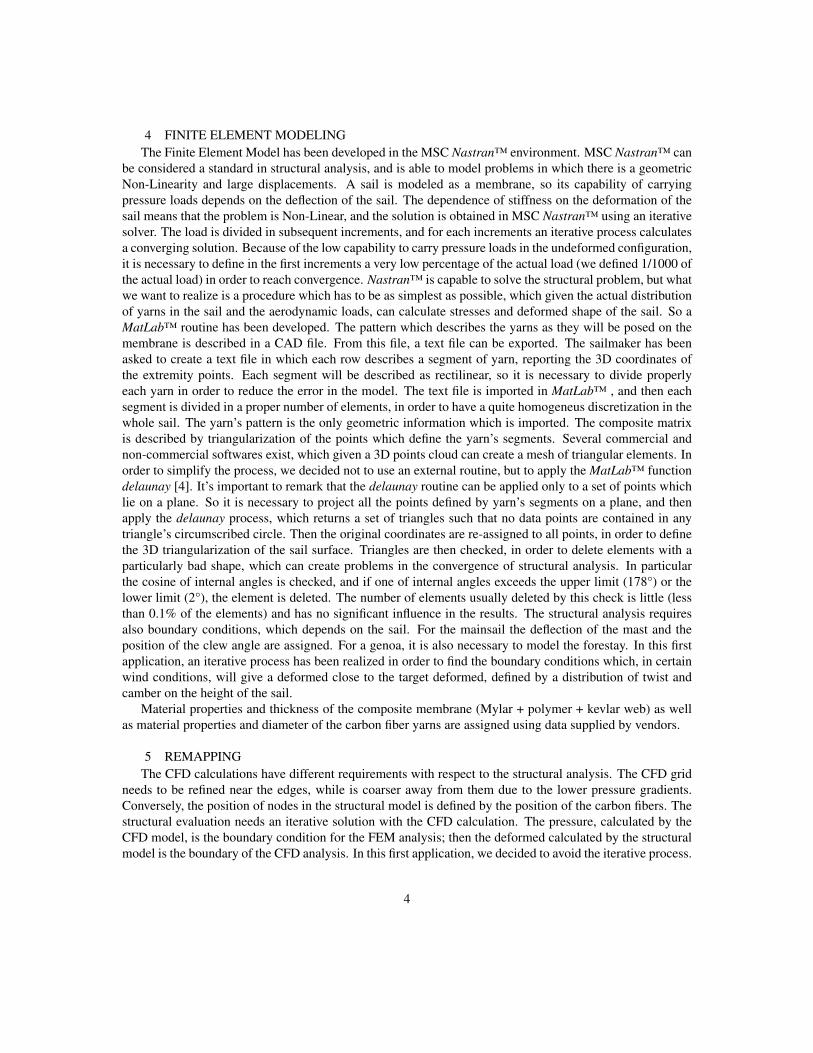
4 FINITE ELEMENT MODELINGThe Finite Element Model has been developed in the MSC Nastran™ environment. MSC Nastran™ can
be considered a standard in structural analysis, and is able to model problems in which there is a geometricNon-Linearity and large displacements. A sail is modeled as a membrane, so its capability of carryingpressure loads depends on the deflection of the sail. The dependence of stiffness on the deformation of thesail means that the problem is Non-Linear, and the solution is obtained in MSC Nastran™ using an iterativesolver. The load is divided in subsequent increments, and for each increments an iterative process calculatesa converging solution. Because of the low capability to carry pressure loads in the undeformed configuration,it is necessary to define in the first increments a very low percentage of the actual load (we defined 1/1000 ofthe actual load) in order to reach convergence. Nastran™ is capable to solve the structural problem, but whatwe want to realize is a procedure which has to be as simplest as possible, which given the actual distributionof yarns in the sail and the aerodynamic loads, can calculate stresses and deformed shape of the sail. So aMatLab™ routine has been developed. The pattern which describes the yarns as they will be posed on themembrane is described in a CAD file. From this file, a text file can be exported. The sailmaker has beenasked to create a text file in which each row describes a segment of yarn, reporting the 3D coordinates ofthe extremity points. Each segment will be described as rectilinear, so it is necessary to divide properlyeach yarn in order to reduce the error in the model. The text file is imported in MatLab™ , and then eachsegment is divided in a proper number of elements, in order to have a quite homogeneus discretization in thewhole sail. The yarn’s pattern is the only geometric information which is imported. The composite matrixis described by triangularization of the points which define the yarn’s segments. Several commercial andnon-commercial softwares exist, which given a 3D points cloud can create a mesh of triangular elements. Inorder to simplify the process, we decided not to use an external routine, but to apply the MatLab™ functiondelaunay [4]. It’s important to remark that the delaunay routine can be applied only to a set of points whichlie on a plane. So it is necessary to project all the points defined by yarn’s segments on a plane, and thenapply the delaunay process, which returns a set of triangles such that no data points are contained in anytriangle’s circumscribed circle. Then the original coordinates are re-assigned to all points, in order to definethe 3D triangularization of the sail surface. Triangles are then checked, in order to delete elements with aparticularly bad shape, which can create problems in the convergence of structural analysis. In particularthe cosine of internal angles is checked, and if one of internal angles exceeds the upper limit (178°) or thelower limit (2°), the element is deleted. The number of elements usually deleted by this check is little (lessthan 0.1% of the elements) and has no significant influence in the results. The structural analysis requiresalso boundary conditions, which depends on the sail. For the mainsail the deflection of the mast and theposition of the clew angle are assigned. For a genoa, it is also necessary to model the forestay. In this firstapplication, an iterative process has been realized in order to find the boundary conditions which, in certainwind conditions, will give a deformed close to the target deformed, defined by a distribution of twist andcamber on the height of the sail.
Material properties and thickness of the composite membrane (Mylar + polymer + kevlar web) as wellas material properties and diameter of the carbon fiber yarns are assigned using data supplied by vendors.
5 REMAPPINGThe CFD calculations have different requirements with respect to the structural analysis. The CFD grid
needs to be refined near the edges, while is coarser away from them due to the lower pressure gradients.Conversely, the position of nodes in the structural model is defined by the position of the carbon fibers. Thestructural evaluation needs an iterative solution with the CFD calculation. The pressure, calculated by theCFD model, is the boundary condition for the FEM analysis; then the deformed calculated by the structuralmodel is the boundary of the CFD analysis. In this first application, we decided to avoid the iterative process.
4

The CFD calculation is done using the target deformed shape of the sail which is obtained by photographsduring navigation (Fig. 1).Then the boundary condition in the structural model, such as the deflection of the mast and the position ofthe clew angle, are defined in order to obtain the target deformation. Using different grids for CFD and FEMmodel require a procedure which given the pressure in the CFD grid, is able to calculate the pressure in theFEM grid. It’s important to stress that the two grids are defined in two different shaped surfaces: the CFDgrid covers the target deformed of the sail, while the FEM grid covers the real surface in which the sail ismanufactured. Moreover they are defined in arbitrary reference systems. In order to realize the post process,the sail is described as a triangular quadratic element (with 6 nodes, defined in the vertices and one on eachedge). The position of these reference nodes is measured in the FEM grid (undeformed shape) and in theCFD grid (deformed shape). Then the position of each point in the FEM grid is transormed in an expecteddeformed point. The transformation is defined in order to remap the 6 reference nodes of the undeformedshape in the 6 reference nodes in the deformed shape. This does not lead to a perfect superposition ofthe transformed FEM shape and the deformed CFD shape, but helps the remapping because reduces thedifference between FEM shape and CFD shape.The remapping is done using the three closest point algorithm. Given the position of a point in the FEMgrid, in which we want to calculate the local pressure, the subroutine finds the three closest points of theCFD grid. Then the angles between the segments which connects the three points are calculated. If thesepoints are nearly lined up, an interpolation in 1D isoparametric elements is done; otherwise an interpolationusing 2D isoparametric elements is used. The module of the cosine of the segments which connects the threenearest points is calculated; if all of them are less than 0.99 (this means that the angle between each pairof segments is more than 8.5 degrees) the three points are not supposed to be lined up ( Fig. 2). The areacoordinates are calculated as follows (Eq. 1):
Figure 2: Example of interpolation for 3 non-aligned closest points.
ξ1 =area(PN2N3)
area(N1, N2, N3)ξ2 =
area(PN1N3)area(N1, N2, N3)
ξ3 =area(PN1N2)
area(N1, N2, N3)(1)
Then the phisical quantity of interest, which is, for our application, the pressure on sail’s surface, iscalculated as in Eq. 2:
Pressure(Q) = ξ1P (N1) + ξ2P (N2) + ξ3P (N3) (2)
5

If the 3 closest points are aligned, a monodimensional interpolation is performed (Fig.3), using La-grange’s interpolating functions of the second order (Eq. 3).
Figure 3: Example of interpolation for 3 aligned closest points.
Pressure(s) = L1(s)P (N1) + L2(s)P (N2) + L3(s)P (N3) Li(s) =k=3∏
k=1,k 6=i
s− sk
si − sk(3)
6 POSTPROCESSING AND RESULTSMSC Nastran™ produces in output a binary file containing all the displacements of nodes and all defor-
mations and tension on the 1D and 2D elements. A session file in MSC Patran™ will convert this file in atext file, containing all the quantities we want to evaluate. In particular, in this first application, the loadsacting on the clew angle, the stresses on the carbon fiber yarns and the position of all points of the sail areextracted. Then a MatLab™ routine will calculate the twist and camber for a certain number of sections ob-tained by intersecting the sail with an horizontal plane at different heights. Figure 4 shows the sail’s profilein unloaded and loaded conditions at three different heights: 25, 50 and 75%. In each section it is possibleto calculate inlet and outlet flow angle, twist and camber to chord.From the following images, it is possible to see how trimming (which means changing the boundary con-ditions of the structural model) affect the deformed shape of the sail. Figure 5 shows that if the flexuraldeflection of the mast is reduced from the nominal maximum deflection of 35 cm to a value of 30 cm, thetwist of the profile will increase on the whole height of the sail, with a maximum variation of the middle,which becomes a null variation at minimum and maximum height. Reducing the tension of the mast willalso increase the maximum camber from the base to almost the 75% of the height; in the higher sections thecamber will moderately reduce 6. By lowering the clew angle the twist will almost remain the same in baseand will reduce with the higher extent on top 7. The camber to chord ratio will also reduce from base to60% height, while will raise in the highest part of the sail 8. Figure 9 shows stress on carbon fiber yarns ifthe clew angle is lowered of 8cm. These yarns have an ultimate load of about 60-70 kg. As we can see, bylowering the clew angle there is a quite extensive region in which stresses will increase, while the load onthe clew angle changes from 3.6 tonnes (Fig. 9 (a)) to 6.4 tonnes (Fig. 9 (b)).
7 CONCLUSIONSThe paper presents a MatLab™ routine which allow to create a structural model of a sail using the CAD
drawing which describes the carbon fiber yarn’s pattern and the results of a CFD analysis. The postprocess-ing routine allow also to calculate all the aerodynamic parameters which allow to assess the performancesof the sail. The authors presented simple tests in which the effects of regulations on the sail are shown, in
6

Figure 4: Sections of the sail at 25, 50 and 75% height
Figure 5: Twist distribution vs Maximum mast deflection.
7

Figure 6: Camber to chord distribution vs Maximum mast deflection.
Figure 7: Twist distribution vs vertical position of the clew angle.
8

Figure 8: Camber to chord distribution vs vertical position of the clew angle.
terms of aerodynamic properties of the profile and stresses on yarns.The tool which has been presented will be adopted to choose the best yarn pattern for a sail, intended as thepattern which will have the desired stiffness distribution (which, in a reference wind condition, will give atarget deformed of the sail) together with appropriate strength and weight.The structural model presented will also be refined, to better represent the features of Millennium sails. Inthe current model the yarns define a web in which yarns cannot move along their axis direction. This issuitable for the standard manufacturing process, in which resin fixes the position of each yarn, while in theMillennium process yarns are free to slide inside their coating.
References[1] Le Maitre, O., Huberson, S. and Souza de Cursi, J.E, “Application of a non-convex model of fabric de-
formations to sail cut analysis”, Journal of Wind Engineering and Industrial Aerodynamics 63 (1996),pp. 77-93
[2] Arnone, A. and Pacciani, R., “Three-Dimensional Viscous Analysis of Centrifugal Impellers Usingthe Incompressible Navier-Stokes Equations”, 1st European Conference on Turbomachinery - FluidDynamic and Thermodynamic Aspects, Erlangen, (1965), pp. 181-195
[3] Schneider, A., Arnone, A., Savelli, M., Ballico, A., Scutellaro, P., “On the use of CFD to assist withsail design”, The 16th Chesapeake Sailing Yacht Symposium, Annapolis, Maryland, (2003), pp. 61-71
[4] Barber, C. B., Dobkin, D.P., and Huhdanpaa, H.T., “The Quickhull Algorithm for Convex Hulls”, ACMTransactions on Mathematical Software, Vol. 22, No. 4, (1996), pp. 469-483
9

(a) Clew angle in design posi-tion.
(b) Clew angle lowered by 8cm. (c) Legend
Figure 9: Stress on carbon fiber yarns.
10