Multidimensional Indexing: Spatial Data Management & High Dimensional Indexing
Upload
nguyenminhCategory
view
217download
0
Structural Analysis of Musical Signals for Indexing, Segmentation and Thumbnailing
Wei Chai
Paper for the Major Area of the PhD General Exam
March 11, 2003
Reviewer: Prof. Barry Vercoe
ABSTRACT A musical piece typically has a repetitive structure. Analysis of this structure will be useful for indexing the digital music repository, segmenting music at transitions, and summarizing the thumbnails of music, all of which can be used in building efficient music retrieval and recommendation systems. This paper presents an algorithm that can automatically analyze the repetitive structure of musical signals. First, the algorithm detects the repetition of each segment of fixed length in a piece using dynamic programming. Second, the algorithm summarizes this repetition information and infers the structure based on heuristic rules. The performance of the approach is evaluated visually using figures for qualitative evaluation, and by two structural similarity measures for quantitative evaluation. The structural analysis result can be used in various ways in addition to the apparent use for indexing. The boundaries of the sections based on the structural analysis result have better consistency with transitions than boundaries produced by random segmentation. We can also employ different strategies based on structural analysis for music thumbnailing. Preliminary results obtained using a corpus of Beatles’ songs demonstrate the promise of these methods. KEYWORDS Music structure, pattern matching, music segmentation, music thumbnailing, music information retrieval, music recommendation.

1. INTRODUCTION A musical piece typically has a repetitive structure. For example, a song may have a structure of ABA, indicating a three-part compositional form in which the second section contrasts with the first section, and the third section is a restatement of the first. Methods for automatically detecting the repetitive structure of a musical piece from acoustical signals is valuable for information retrieval systems; for example, the result can be used for indexing the digital music repository, segmenting music at transitions, and summarizing the thumbnails of music, all of which can be used in building efficient music retrieval and recommendation systems. There has been some recent research on this topic. Dannenberg and Hu [2002] presented a method to automatically detect the repetitive structure of musical signals. The process consists of searching for similar segments in a musical piece, forming clusters of similar segments, and explaining the musical structure in terms of these clusters. Three representations were investigated: monophonic pitch estimation, chroma representation, and polyphonic transcription followed by harmonic analysis. Although the promise of this method was demonstrated in several examples, there was no quantitative evaluation of the method in their paper. Two topics closely related to structural analysis of music have also been investigated. One is music thumbnailing (or music summarization), which aims at finding the most representative part (often assumed to be the most repeated section) of a song. Some research on music thumbnailing deals with symbolic musical data (e.g., MIDI files and scores) [Hsu, 2001]. There have also been studies on thumbnailing of musical signals. Logan and Chu [2000] attempted to use a clustering technique or Hidden Markov Models to find key phrases of songs. Mel Cepstral features were used to characterize each song. The other related topic is music segmentation. Most previous research in this area attempted to segment musical pieces by detecting the locations where a significant change of statistical properties occurs [Aucouturier, 2001]. This method is more appropriate for segmenting different local events rather than segmenting the semantic components of the global structure. Additionally, Foote [1999; 2000] proposed a representation called a similarity matrix for visualizing and analyzing the structure of audio, including symbolic music, acoustic musical signals or more general audio. One attempt using this representation was to locate points of significant change in music (e.g., score analysis) or audio (e.g., speech/music segmentation) [Foote, 2000]. Bartsch and Wakefield [2001] used the similarity matrix and chroma-based features for music thumbnailing. A variation of the similarity matrix was also proposed for music thumbnailing [Peeters, 2002]. One problem with this representation is that time-warping is not explicitly considered and the similarity property employed is often too local for global structural analysis. This paper describes research into automatic identification of the repetitive structure of musical pieces from acoustic signals. Specifically, an algorithm is presented that will output structural information, including both the form (e.g., AABABA) and the boundaries indicating the beginning and the end of each section. It is assumed that no prior knowledge about musical forms or the length of each section is provided, and the restatement of a section may have variations (e.g., different lyrics, tempo, etc.). This assumption requires both robustness and efficiency of the algorithm. Two novel structural similarity measures are proposed in this paper to quantitatively evaluate the performance of the algorithm, in addition to the qualitative evaluation presented by figures. The structural analysis result can be used in various ways. For example, this paper presents a method of finding the hierarchical structure of music based on the one-level structural analysis. The result can also be used for music segmentation, because the experiments show that the boundaries of the sections based on the structural analysis

result have better consistency with transitions than boundaries produced by random segmentation. Using different strategies, we can automatically find music thumbnails for music browsing and recommendation as well. The remainder of this paper is organized as follows. Section 2 illustrates the structural analysis approach and experimental results. Section 3 presents how we can further explore the hierarchical structure of music based on the one-level structural analysis. Section 4 demonstrates how the structural analysis results can be used for music segmentation. Section 5 presents the strategies and experimental results of music thumbnailing. Section 6 gives conclusions and proposes future work. 2. STRUCTURAL ANALYSIS 2.1 Approach
Frame 1 Frame 2 Frame 3 Frame n
Compute the feature vector of each frame
Feature vector 1 Feature vector 2 Feature vector 3 Feature vector n
Segment the musical signal into overlaped frames
Segment the feature vector sequence into overlapped segments
Segment 1 Segment 2 Segment 3 Segment m
Match each segment against the feature vector sequenceusing dynamic programming
Label the repetitive structure
Detect the repetitions of each segment
Merge consecutive segments that have the same repetitiveproperty into sections
Figure 1: Overview of the structural analysis approach.
This section illustrates the structural analysis method, which follows five steps and is also illustrated in Figure 1: 1) Segment the signal into frames and compute the feature of each frame;

2) Segment the feature vector sequence into overlapped segments of fixed length and compute the repetition property of each segment using dynamic programming;
3) Detect the repetitions of each segment by finding the local minimum points in the dynamic programming
result; 4) Merge consecutive segments that have the same repetitive property into sections and generate pairs of similar
sections. 5) Segment and label the repetitive structure. The following five sections explain each step in detail. All the parameter configurations are tuned based on the experimental corpus, which is described in Section 2.2. 2.1.1 Feature Extraction The algorithm first segments the signal into overlapped frames (e.g., 1024-sample window length with 512- sample overlap) and computes the feature of each frame. Three representations are investigated in this paper. The first representation is the pitch representation, which uses autocorrelation [Roads, 1996] to estimate the main frequency component of each frame. Although all the test data in the experiment are polyphonic, it turns out that, for musical signals with a leading instrument or vocal, this feature can still capture much information. The second representation is the frequency representation, i.e., FFT magnitude coefficients. The third representation is the chroma representation, which combines octave-related frequency components to construct a twelve-dimensional feature vector for each frame [Bartsch, 2001][Dannenberg, 2002]. The distance between two pitch features and v is defined as 1v 2
factorionnormalizatvvvvd p
||),( 2121
−= (1)
The distance between two feature vectors (FFT or chroma) 1vv and 2vv is defined as
||||5.05.0),(
21
2121 vv
vvvvd f vv
vvvv •
⋅−= (2)
In both cases, a distance value ranges between 0 and 1. 2.1.2 Pattern Matching After computing the feature vector (one-dimensional vector for the pitch representation and N-dimensional vector for the frequency or chroma representation) for each frame, the algorithm segments the feature vector sequence (n is the number of frames) into overlapped segments of fixed length l (e.g., 200 consecutive vectors with 150 vectors overlap). Since previous research has shown that dynamic programming is effective for music pattern matching [Foote, 2000][Yang, 2001], here dynamic programming is used to match each segment (i.e., ) with the feature vector sequence starting from this segment (i.e.,
jv
]1−
},...,1|{],1[ njvnV j ==
,[ += ljjVsi

],[ njV ). Please note that, in the matching process, only the queries are of fixed-length l, while the targets vary in length depending on j and n. The dynamic programming algorithm will fill in a matrix Mi as shown in Figure 2 based on Equation 3.
≥≥≥
+−−+−+−
=
..)1,(
)1()1(
0]1,1[
]1,[],1[
min],[
woji
ji
cqpMeqpMeqpM
qpM (3)
where e is the insertion or deletion cost, c is the distance between the two corresponding feature vectors, which has been defined in Section 2.1.1. The last row of matrix Mi is defined as function . In addition, the trace-back step of dynamic programming determines the actual alignments (i.e. the locations in V matching the beginning of s
][rdi
],[ nj
i) that result in . The trace-back result is denoted as . ][rd i ][rti
vn...............
V(j+2)
V(j+1)
vj
vj
V(j+1)
...
...
V(j+l-1)
0 0 0 0 ... ... ... ... ... 0
e
2e
...
...
le d ][ri
Figure 2: Dynamic programming matrix Mi.
This step is the most time consuming one in the structural analysis algorithm; its time complexity is O . )( 2n 2.1.3 Repetition Detection This step detects the repetition of each segment. To achieve this, the algorithm detects the local minima in the function for each i, because normally a repetition of segment i will correspond to a local minimum in this function. Figure 3 shows the repetition detection result of one segment in the song Yesterday.
][rdi
The repetitions detected may have add or drop errors, meaning a repetition is falsely detected or missed. For example, in Figure 3, the first, the second, the fourth and the fifth detected local minima correspond to the four restatements of the same melodic segment in the song (“… here to stay …”, “… over me …”, “… hide away …”, “… hide away …”). However, there is an add error occurring at the third detected local minimum. The number of add errors and that of the drop errors are balanced by a predefined parameter h; whenever the local minimum is deeper than height h, the algorithm reports a detection of repetition. Thus, when h increases, there are more drop

errors but fewer add errors, and vise versa. For balancing between these two kinds of errors, the algorithm searches within a range for the best value of h, so that the number of detected repetitions is reasonable (e.g.,
). 2/# ≈nsrepetitiondetected
0 5 00 1000 1500 200 0 250 0 300 00
10
20
30
40
50
60
70
80
r
d i[r]O ne-segm ent repe titio n de tec tion: Yes terda y
Figure 3: One-segment repetition detection result of Yesterday. The local minima indicated by circles correspond to detected repetitions of the segment.
In addition, one more step in the repetition detection to remove add errors is using the criterion that if two consecutive minima are too close (i.e., the matching parts corresponding to the two minima overlap), only the deeper minimum is kept. For each detected minimum for , let ; thus, it is detected that the
segment starting at is repeated at . Please note that by the nature of dynamic programming, the matching
part may not be of length l due to the variations in the repetition.
][ *rd i
v]1,[ −+= ljjVsi ][ ** rtk i=
jv *kj+
2.1.4 Segment Merging The algorithm merges consecutive segments that have the same repetitive property into sections and generates pairs of similar sections in this step. Figure 4 shows the repetition detection result of the song Yesterday after this step. In this figure, a circle or a square at (j, k) corresponds to a repetition detected in the third step. Since typically one musical phrase consists of multiple segments, based on the configurations in previous steps, if one segment in a phrase is repeated by a shift of k, all the segments in this phrase are repeated by shifts roughly equal to k. This phenomenon can be seen from Figure 4, where the squares present horizontal patterns indicating consecutive segments have roughly the same shifts. By detecting these horizontal patterns and discarding other detected repetitions obtained from step the third step, the effects of add/drop errors are further reduced.

The output of this step is a set of merged sections in terms of tuples , indicating that the segment starting at and ending at repeats roughly from to v . Each tuple corresponds to one horizontal pattern in the whole-song repetition detection result. For example, the tuple corresponding to the left-bottom horizontal pattern in Figure 4 is <100, 450, 370>. Since the shifts of repetitions may not be exactly the same for segments in the merged section, the shift of the whole section is the average value.
>< shiftjj ,, 21
shiftj +21jv
2jv shiftjv +1
0 200 400 600 800 1000 1200 1400 1600 18000
200
400
600
800
1000
1200
1400
1600
1800
2000whole-song repetition detection: Yesterday
j
k
Figure 4: Whole-song repetition detection result of Yesterday. A circle or a square at location (j, k) indicates that the segment starting at vj is detected to repeat at vj+k.
2.1.5 Structure Labeling Based on the tuples obtained from the fourth step, the last step of the algorithm segments the whole piece into sections and labels each section according to the repetitive relation. To illustrate how the algorithm works, two idealized examples are shown in Figure 5. In the first example with AABAB form, the tuples obtained from the last step should be {<1, T1, T1>, <T1, 2T1+T2, T1+T2>, <1, T1, 2T1+T2>}. In the second example with ABABB form, the tuples obtained from the last step should be {<2T1+T2, 2T1+2T2, T2>, <1, T1+T2, T1+T2>, < T1, T1+T2, T1+2T2>}. The structure labeling process is as follows: 1) Initialize X to be section symbol “A”. 2) Find the most frequently repeated part by counting how many horizontal patterns (tuples) contain each given
j. The bottom figures in Figure 5 show that the most frequently repeated part is <1, T1> for the first example and <T1, T1+T2> for the second example.
3) For each tuple < containing the most frequently repeated part, label < and
as section X. >shiftjj ,, 21
>shift>21 , jj
++< jshiftj 21 ,

4) Delete the labeled tuples. Let X be the next section symbol, e.g., “B”, “C”, “D”, etc. 5) If there are unlabelled tuples, go to 2).
A A B A B
T
1
T1
+T2
2
T1+T
2
T1 2T1 2T1+T2
A
A
A B
j
k
T1 2T1 2T1+T2
Rep
. cou
nt
j
A B A B
T2
T
1+T2
T1+
2T2
T1 T1+T2 2T1+T2 2T1+2T2
A B
B
B
B
j
k
T1 T1+T2 2T1+T2 2T1+2T2
Rep
. cou
nt
j
Figure 5: Idealized whole-song repetition detection results (left: AABAB form; right: ABABB form). Section A’s are assumed to be of length T1 and Section B’s are assumed to be of length T2. The bottom figures show how many horizontal patterns contain each given j.
In the above structure labeling process, two problems exist. The first is how to solve a conflict, which means a later labeled section may have overlap with previously labeled sections. The rule is the previous labeled sections will always remain intact and the current section will be truncated. Only the longest truncated unoverlapped part, if it is long enough, will be labeled as a new section. The shifted version of the tuple will be truncated accordingly, even if there is no conflict, to resemble the structure of its original version. In the first idealized example, the first loop of the algorithm will process tuple <1, T1, T1> and <1, T1, 2T1+T2> and label the three “A” sections. The second loop will process tuple <T1, 2T1+T2, T1+T2>. Since conflicts occur here, the two “B” sections are generated by truncating the original and the shifted versions of the tuple. The second problem is how to choose the order of processing tuples in each loop. In the first example, the order of processing the two tuples in the first loop will not affect the structure labeling result. However, in the second example, the order of first processing tuple <1, T1+T2, T1+T2> or < T1, T1+T2, T1+2T2> will change the result. If we choose to process tuple <T1, T1+T2, T1+2T2> first, the first and the third “B” sections will be labeled at the beginning. Next when we process tuple <1, T1+T2, T1+T2>, the original version will be truncated to generate the first “A” section. The shifted version will resemble its original version, generating the second “A” section and the second “B” section. In this case, the structure labeling result is exactly “ABABB”. On the other hand, if we choose to process tuple <1, T1+T2, T1+T2> first, the algorithm will label “AB” together as “A*”. When we next process tuple <T1, T1+T2, T1+2T2>, a conflict occurs and no new section is generated. The shifted version will be labeled as section “A*” as well. In this case, the structure labeling result is “AAA” (Figure 6). In this idealized example, processing shorter tuples first is preferred. However, the experiment shows that, due to the noisy data

obtained from the previous steps, this order will result in small fragments in the final structure. Thus, the algorithm now is choosing the order based on the values of shifts (from small to large). This means, for structure like the second example, the output structure may combine “AB” together as one section.
A B A B B
A A A
Figure 6: Different structure labeling results corresponding to different order of processing tuples.
2.2 Experiments and Evaluation This section presents the experimental results and evaluations of the structural analysis approach. 2.2.1 Data Set The experimental corpus consists of the 26 Beatles’ songs in the two CDs The Beatles (1962-1966). All these songs have clear repetitive structures and leading voices. All the data were mixed to 8-bit mono and down-sampled to 11kHz. 2.2.2 Measures of Structural Similarity To qualitatively evaluate the results, figures as shown in Figure 7 are used to compare the structure obtained from the algorithm to the ideal structure obtained by manually labeling the repetition. This paper also proposes two measures of structural similarity to quantitatively evaluate the result. Both of the measures need to be as small as possible, ideally equal to zero.
Figure 7: Comparison of the computed structure using the FFT representation (above) and the ideal structure (below) of Eight Days a Week. Sections in the same color indicate restatements of the section. Sections in the lightest grey correspond to the sections with no repetition.
Measure 1 (structural inaccuracy) is defined as the edit distance between the strings representing different forms. For the example in Figure 7, the distance between the ideal structure AABABA and the computed structure AABAABA is 1, indicating one insertion. Here how the algorithm labels each section is not important as long as the repetitive relation is the same; thus, this ideal structure is deemed as equivalent (0-distance) to structure BBABAB, or structure AACACA. Measure 2 (boundary inaccuracy) is mainly used to evaluate how accurate the boundaries of each section are. It is defined as
srBM /)1( −= (4) where r is the ratio of the length of parts where both structures have the same labeling to the whole length, and s is the number of the repetitive sections in the ideal structure.
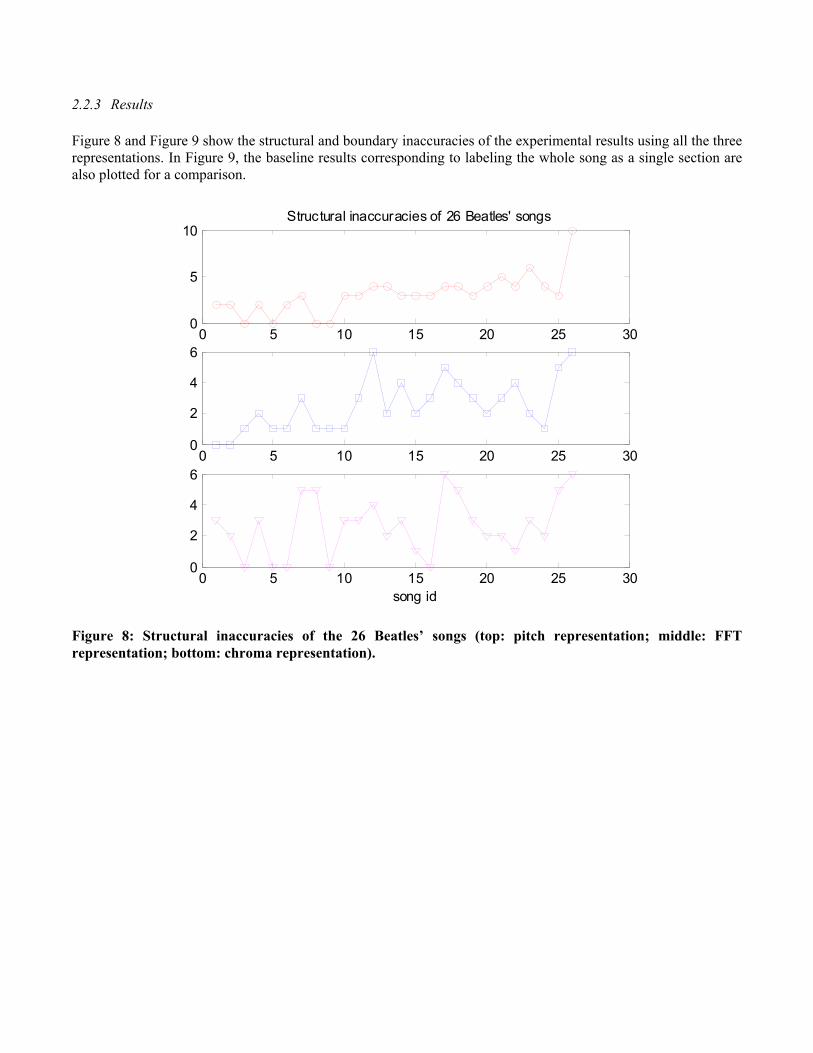
2.2.3 Results
Figure 8 and Figure 9 show the structural and boundary inaccuracies of the experimental results using all the three representations. In Figure 9, the baseline results corresponding to labeling the whole song as a single section are also plotted for a comparison.
0 5 10 15 20 25 300
5
10Structural inaccuracies of 26 Beatles' songs
0 5 10 15 20 25 300
2
4
6
0 5 10 15 20 25 300
2
4
6
song id
Figure 8: Structural inaccuracies of the 26 Beatles’ songs (top: pitch representation; middle: FFT representation; bottom: chroma representation).

0 5 10 15 20 25 300.02
0.04
0.06
0.08
0.1
0.12
0.14
0.16
0.18Boundary inaccuracies of 26 Beatles' Songs (pitch representation)
song id
0 5 10 15 20 25 300
0.02
0.04
0.06
0.08
0.1
0.12
0.14
0.16
0.18Boundary inaccuracies of 26 Beatles' Songs (FFT representation)
song id

0 5 10 15 20 25 300
0.02
0.04
0.06
0.08
0.1
0.12
0.14
0.16
0.18
0.2Boundary inaccuracies of 26 Beatles' Songs (Chroma representation)
song id
Figure 9: Boundary inaccuracies of the 26 Beatles’ songs. The solid lines indicate the computed results (top: pitch representation; middle: FFT representation; bottom: chroma representation). The dotted lines indicate the baseline.
The performance of each song can be easily seen from the above figures. For example, using the pitch representation, the third, fifth and the eighth song have the best performances (the structural inaccuracies are 0 and the boundary inaccuracies are low), which are shown in Figure 10, 11 and 12.
Figure 10: Comparison of the computed structure using the pitch representation (above) and the ideal structure (below) of From me to you.
Figure 11: Comparison of the computed structure using the pitch representation (above) and the ideal structure (below) of I want to hold your hand.

Figure 12: Comparison of the computed structure using the pitch representation (above) and the ideal structure (below) of A hard day’s night.
Using the FFT representation, the first song’s the structural inaccuracy is 0 and its boundary inaccuracy is low. In addition, the sixth, tenth and twenty-fourth song also have good performances, with the structural inaccuracies of one and low boundary inaccuracies. There results are shown in Figure 13, 14, 7 and 15, respectively.
Figure 13: Comparison of the computed structure using the FFT representation (above) and the ideal structure (below) of Love me do.
Figure 14: Comparison of the computed structure using the FFT representation (above) and the ideal structure (below) of All my loving.
Figure 15: Comparison of the computed structure using the FFT representation (above) and the ideal structure (below) of Paperback writer.
Using the chroma representation, the fifth and the sixteenth song have the best performances (the structural inaccuracies are 0 and the boundary inaccuracies are low), which are shown in Figure 16 and 17.
Figure 16: Comparison of the computed structure using the chroma representation (above) and the ideal structure (below) of I want to hold your hand.

Figure 17: Comparison of the computed structure using the FFT representation (above) and the ideal structure (below) of We can work it out.
Not every song in the corpus has good performance. For example, the seventeenth song’s boundary inaccuracies are high for all the three representations. The twenty-sixth song’s structural inaccuracies are high for all the three representations. Figure 18 and 19 show the results of the seventeenth song using the chroma representation and the twenty-sixth song using the pitch representation.
Figure 18: Comparison of the computed structure using the chroma representation (above) and the ideal structure (below) of Day tripper.
Figure 19: Comparison of the computed structure using the pitch representation (above) and the ideal structure (below) of Yellow submarine.
2.3 Discussions The experimental result shows that, by either one of the three representations, the performance of 17 out of 26 songs have structural inaccuracies less than or equal to 2 (Figure 8) and the results of all the songs have boundary inaccuracies better than the baseline (Figure 20). This demonstrates the promise of the method. The result does not show one representation is significantly superior to the other. However, for each song, the result of one representation is often better than the result of the other. This indicates that the representation does play an important role in performance and investigating other feature representations might help improve the accuracy of the algorithm. One can notice that, even for the song with the best performance, the computed boundaries of each section were often slightly shifted from the ideal boundaries. This was mainly caused by the inaccuracy of the approximate pattern matching. To tackle this problem, other musical features (e.g., chord progressions, change in dynamics, etc.) can be used to detect local events so as to locate the boundaries accurately. In fact, this problem suggests that computing only the repetitive relation might not be sufficient for finding the semantic structure. “The position of phrase boundaries in tonal melodies relates to a number of interacting musical factors. The most obvious determinants of musical phrases are the standard chord progressions known as cadence. Other factors include ‘surface features’ such as relatively large interval leaps, change in dynamics, and micropauses (‘grouping preference rules’), and repeated musical patterns in terms of harmony, rhythm and melodic contour.” [Balaban, 1992]

0 5 10 15 20 25 300
0.02
0.04
0.06
0.08
0.1
0.12
0.14
0.16
0.18Boundary inaccuracies of 26 Beatles' Songs (min)
song id
Figure 20: Boundary inaccuracies of the 26 Beatles’ songs. The solid line indicates the best computed result for each song using one of the three representations. The dotted line indicates the baseline.
Figure 18 shows the computed structure attempts to split section “A” in the ideal structure into two sections “AB”. The phenomenon happens in many cases of the corpus. For example, in the result of the thirteenth song Yesterday using the pitch representation, section “B” in the ideal structure splits into three sections “BBC” due to a repetition within the “B” section (Figure 21). The split phenomenon is mainly caused by the internal repetitive structure that is not shown in the ideal structure.
Figure 21: Comparison of the computed structure using the pitch representation (above) and the ideal structure (below) of Yesterday.
It also happens in some cases where several sections in the ideal structure merge into one section. For example, for the fourteenth song using the chroma representation, section A in the computed structure can be seen as the combination of section A and section B in the ideal structure (Figure 22). The merge phenomenon might be caused by three reasons: 1) No clue of repetition for further splitting. Figure 22 shows an example of this case. There is no reason to split one section into two sections “AB” as in the ideal structure only based on the repetition property. 2) Deficiency of structural labeling. Figure 6 shows an example of this case. 3) Parameters in the algorithm are set in such a way that short-phrase repetitions are ignored.

Figure 22: Comparison of the computed structure using the chroma representation (above) and the ideal structure (below) of Help!.
The split/merge phenomena suggest us to further explore the hierarchical structure of music as the output of structural analysis, which is explained in Section 3. 3. ANALYSIS OF HIERARCHICAL STRUCTURE
3.1 Tree-structure Representation The split/merge phenomena shown in Section 2.3 and the theory about music structure all suggest us to consider the hierarchical structures of music; one good representation is the tree-structure. Although, for a given piece of music, we might not have a unique tree representation, it is usually natural to find one tree most appropriate to represent its repetitive property in multiple levels. For example, one tree representation corresponding to song Yesterday is shown in Figure 23. The second level of the tree corresponds to the ideal structure in Section 2. The third level denotes that there are four phrases in Section B, among which the first and the third are identical.
BABA A A
A
C D C D’ C D C D’
Figure 23: Tree representation of the repetitive structure of song Yesterday.
Inferring the hierarchical repetitive structures of music is apparently a more complicated yet interesting topic than the one-level structural analysis problem presented in Section 2. One possible solution is building the tree representation based on the one-level structural analysis result. Specifically, assuming we obtain the structural analysis result using the algorithm described in Section 2 and it corresponds to a particular level in the tree, the task is how to build the whole tree structure similar to Figure 23 based on only this level. The algorithm can be divided into two processes: roll-up process and drill-down process. The roll-up process merges proper sections to build the tree structure up from this level to the top. The drill-down process splits proper sections to build the tree structure down from this level to the bottom.

3.2 Roll-up Process Given the one-level structural analysis result, denoted as a section symbol sequence Y=X1X2X3…XN, where Xi is a section symbol such as “A”, “B”, “C”, etc. Let S be the set of all the section symbols in Y. The roll-up process can be defined as follows: 1) Find substring Ys (|Ys|>1 ) of Y, such that, if all the unoverlapped substring Ys’s in Y are substituted by a new
section symbol Xw, at least one symbol in S will not appear in the new Y.
2) Let S be the set of all the section symbols in the new Y. If |Y|>1, go to 1). This algorithm iteratively merges sections in each loop, which corresponds to a particular level in the tree structure. Please note, however, the algorithm is not guaranteed to give a unique solution. For example, Figure 24 shows two possible solutions corresponding to two different trees, given the initial Y=AACDCD’ACDCD’A for song Yesterday. The first solution (left one) is consistent with the tree structure shown in Figure 23, while the second solution (right one) corresponds to an unnatural tree structure to represent the song. Therefore, the roll-up process can be seen as a search problem; how to build heuristic rules to search for the most natural path for merging sections needs to be explored in the future.
A A C D C D’ A C D C D’ AY=
A A E C D’ A E C D’ A
Y=
A A G A G A
Y=
A A E F A E F A
Y=
A H H AY=
IY=
Ys=CD
Ys=CD’
Ys=EF
Ys=AG
Ys=AHHA
A A C D C D’ A C D C D’ AY=
A E D’ A E D’ A
Y=
Y=
F F A
IY=
Ys=ACDC
Ys=AED’
Ys=FFA
Figure 24: Two possible solutions of the roll-up process for song Yesterday.
3.3 Drill-down Process The drill-down process is even harder than the roll-up process. In the three reasons shown in Section 2.3, the cases caused by the first two reasons may not be solved well without incorporating prior musical knowledge, which is beyond the scope of this paper. A straightforward solution to the cases caused by the third reason is using the one-level structural analysis algorithm again but focusing on each section instead of the whole piece to further split sections to explore the repetitive structure within the sections. To achieve this, parameters in the algorithm need to be tuned to serve the purpose of detecting short-segment repetitions.

4. MUSIC SEGMENTATION
4.1 Precision and Recall This section proposes some measures for evaluating the music segmentation performance. Measure 1 (Precision) is defined as the proportion of detected transitions that are relevant. From a probabilistic point of view, precision is consistent with one minus the probability of false alarm, i.e.,
1-PF = P [t is a relevant transition | t is a detected transition]. Measure 1 (Recall) is defined as the proportion of relevant transitions detected. From a probabilistic point of view, recall is consistent with the probability of detection, i.e.,
PD = P [t is a detected transition | t is a relevant transition].
Figure 25: Concepts of precision and recall.
Figure 25 shows the concepts of precision and recall. B={relevant transitions}, C={detected transitions} and
. Thus, from the above definition, CBA ∩=
CAPrecision = (5)
BARecall = (6)
Figure 26: An example for measuring segmentation performance (top: detected transitions; bottom: relevant transitions).
To compute precision and recall, we need a parameter w: whenever a detected transition t1 is close enough to a relevant transition t2 such that |t1-t2|<w, the transitions are deemed identical (a hit). Obviously, greater w will result in higher precision and recall. In the example shown in Figure 26, the width of shaded area corresponds to 2w. If a

detected transition falls into a shaded area, there is a hit. Thus, the precision in this example is 3/6=0.5; the recall is 3/4=0.75. Given w, higher precision and recall indicates better performance. 4.2 Random Segmentation
Assume we randomly segment a piece into (k+1) parts, i.e., k random detected transitions. Let n be the length of the piece (number of frames in our case) and let m be the number of frames close enough to the relevant transition, i.e., m=2w-1. To compute precision and recall of this strategy, the problem is related to a hypergeometric distribution: choosing k balls from a box of m black balls and (n-m) white balls. Thus,
nm
nmk
kkki
i
=⋅=⋅=⋅== ∑ 1E[i]1P[i]chosen] is B|ballblack a isP[BPrecision
nk
nmk
mmmi =⋅=⋅=⋅== ∑ 1E[i]1P[i]ball]black a isB|chosen is P[BRecall
i
The equations shown that, given n, precision increases by increasing w; recall increases by increasing k. 4.3 Structural Segmentation
10 20 30 40 50 60 70 800
0.1
0.2
0.3
0.4
0.5
0.6
0.7segmentation performance
width threshold (#frames)
prob
abili
ty
Figure 27: Performance of random segmentation and structural segmentation using the pitch representation. The solid line with circle markers indicates recall of structural segmentation. The dash line with asterisk markers indicates precision of structural segmentation. The solid line with triangle markers indicates recall of random segmentation. The dash line with square markers indicates precision of random segmentation.

10 20 30 40 50 60 70 800
0.1
0.2
0.3
0.4
0.5
0.6
0.7segmentation performance
width threshold (#frames)
prob
abili
ty
Figure 28: Performance of random segmentation and structural segmentation using the FFT representation. The solid line with circle markers indicates recall of structural segmentation. The dash line with asterisk markers indicates precision of structural segmentation. The solid line with triangle markers indicates recall of random segmentation. The dash line with square markers indicates precision of random segmentation.
10 20 30 40 50 60 70 800
0.1
0.2
0.3
0.4
0.5
0.6
0.7segmentation performance
width threshold (#frames)
prob
abili
ty
Figure 29: Performance of random segmentation and structural segmentation using the chroma representation. The solid line with circle markers indicates recall of structural segmentation. The dash line with asterisk markers indicates precision of structural segmentation. The solid line with triangle markers indicates recall of random segmentation. The dash line with square markers indicates precision of random segmentation.
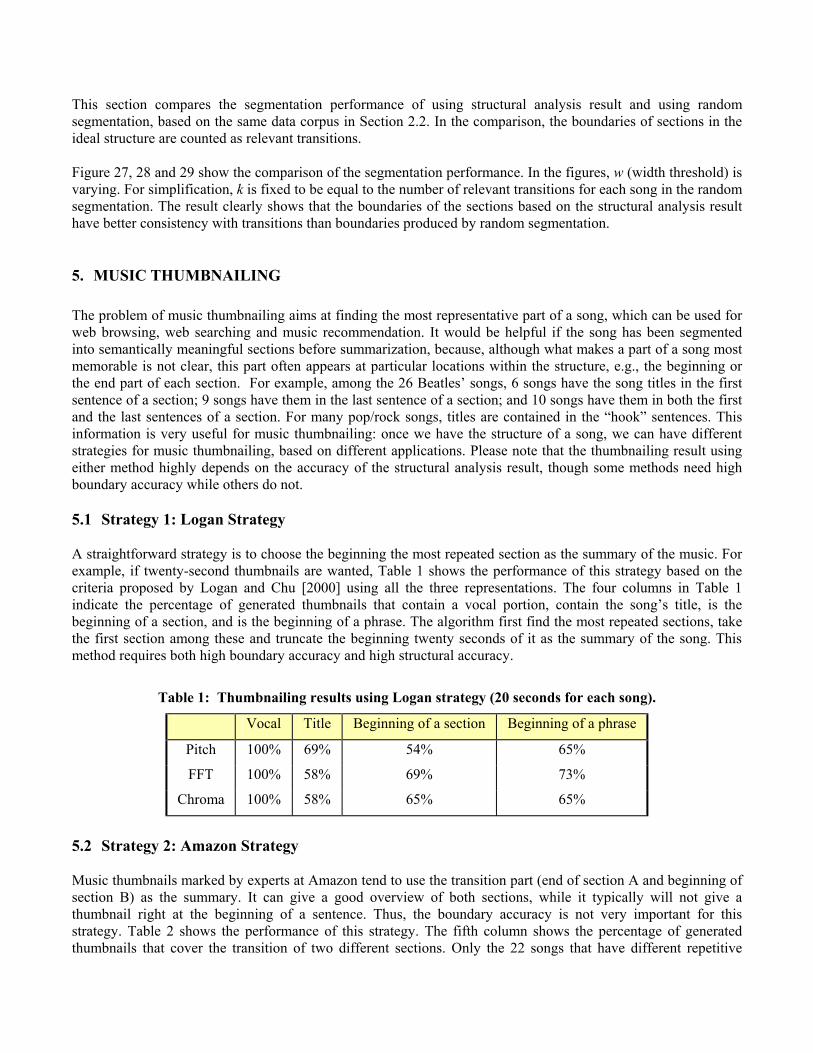
This section compares the segmentation performance of using structural analysis result and using random segmentation, based on the same data corpus in Section 2.2. In the comparison, the boundaries of sections in the ideal structure are counted as relevant transitions. Figure 27, 28 and 29 show the comparison of the segmentation performance. In the figures, w (width threshold) is varying. For simplification, k is fixed to be equal to the number of relevant transitions for each song in the random segmentation. The result clearly shows that the boundaries of the sections based on the structural analysis result have better consistency with transitions than boundaries produced by random segmentation. 5. MUSIC THUMBNAILING The problem of music thumbnailing aims at finding the most representative part of a song, which can be used for web browsing, web searching and music recommendation. It would be helpful if the song has been segmented into semantically meaningful sections before summarization, because, although what makes a part of a song most memorable is not clear, this part often appears at particular locations within the structure, e.g., the beginning or the end part of each section. For example, among the 26 Beatles’ songs, 6 songs have the song titles in the first sentence of a section; 9 songs have them in the last sentence of a section; and 10 songs have them in both the first and the last sentences of a section. For many pop/rock songs, titles are contained in the “hook” sentences. This information is very useful for music thumbnailing: once we have the structure of a song, we can have different strategies for music thumbnailing, based on different applications. Please note that the thumbnailing result using either method highly depends on the accuracy of the structural analysis result, though some methods need high boundary accuracy while others do not. 5.1 Strategy 1: Logan Strategy A straightforward strategy is to choose the beginning the most repeated section as the summary of the music. For example, if twenty-second thumbnails are wanted, Table 1 shows the performance of this strategy based on the criteria proposed by Logan and Chu [2000] using all the three representations. The four columns in Table 1 indicate the percentage of generated thumbnails that contain a vocal portion, contain the song’s title, is the beginning of a section, and is the beginning of a phrase. The algorithm first find the most repeated sections, take the first section among these and truncate the beginning twenty seconds of it as the summary of the song. This method requires both high boundary accuracy and high structural accuracy.
Table 1: Thumbnailing results using Logan strategy (20 seconds for each song).
Vocal Title Beginning of a section Beginning of a phrase
Pitch 100% 69% 54% 65%
FFT 100% 58% 69% 73%
Chroma 100% 58% 65% 65%
5.2 Strategy 2: Amazon Strategy Music thumbnails marked by experts at Amazon tend to use the transition part (end of section A and beginning of section B) as the summary. It can give a good overview of both sections, while it typically will not give a thumbnail right at the beginning of a sentence. Thus, the boundary accuracy is not very important for this strategy. Table 2 shows the performance of this strategy. The fifth column shows the percentage of generated thumbnails that cover the transition of two different sections. Only the 22 songs that have different repetitive

sections in our corpus are counted. It is clearly shown that the percentage of thumbnails starting from the beginning of a section or phrase significantly decreases, while it is more likely to contain titles in the thumbnails, which means thumbnailing using this strategy might capture the “hook” of music better.
Table 2: Thumbnailing results using Amazon strategy (20 seconds for each song).
Vocal Title Beginning of a section Beginning of a phrase Transition
Pitch 100% 77% 27% 42% 64%
FFT 100% 77% 35% 50% 73%
Chroma 100% 77% 27% 38% 68%
5.3 Strategy 3: Hybrid Strategy
We can also combine the above two strategies and choose two segments coming from the beginnings of the most and the second most repeated sections. Each segment is of half the total length limit. This strategy needs even higher accuracy of both structure and boundary. Table 3 shows the performance of this strategy. The first, third and fourth columns are counted using each 10-second summary.
Table 3: Thumbnailing results using Logon strategy (20 seconds for each song).
Vocal Title Beginning of a section Beginning of a phrase
Pitch 96% 77% 36% 48%
FFT 96% 73% 39% 58%
Chroma 96% 73% 40% 49%
6. CONCLUSIONS AND FUTURE WORK This paper presents an algorithm for automatically analyzing the structure of music from acoustic signals. Preliminary results were evaluated both qualitatively and quantitatively, which demonstrate the promise of the proposed method. To improve the accuracy, more representations need to be investigated. One possibility is using the theory of Schenkerian analysis to develop more “musical” features. This will also help generalize the method to other music genres. Inferring the hierarchical repetitive structures of music and identifying the functionality of each section within the structure is a more complicated yet interesting topic. Straightforward methods for roll-up and drill-down are proposed. Music knowledge needs to be incorporated to make the hierarchical structure analysis more efficient. Additionally, we need measures for comparing similarity of hierarchical structures, since using the structural and boundary inaccuracy measures for comparing results on different levels is not reasonable. Methods for automatically tuning the parameters for different scales of repetition need to be developed. The boundaries of the sections based on the structural analysis result have better consistency with transitions than boundaries produced by random segmentation. Although it is not sufficient for music segmentation by itself, it can be fused with other techniques for local transition detection to obtain good segmentation performance.

Three strategies for thumbnailing based on structural analysis are proposed. There can be other variations as well. We should choose appropriate strategies for different applications. For example, the Logan strategy might be good for query-based applications, because it is more likely that the user will query from the beginning of a section or a phrase. The Amazon strategy might be good for music recommendation, since it is more important to contain the “hook” sentence in the summary. The hybrid strategy would be good for long thumbnails. Music segmentation, thumbnailing and structural analysis are three coupled problems. Discovery of effective methods for solving any one of the three problems will benefit the other two. Furthermore, the solution to any of them depends on the study of humans’ perception of music, for example, what makes part of music sounds like a complete phrase and what makes it memorable or distinguishable. Human experiments are always necessary for exploring such questions. REFERENCES J.J. Aucouturier and M. Sandler. “Segmentation of Musical Signals using Hidden Markov Models,” In Proc. AES 110th Convention, May 2001. J.J. Aucouturier and M. Sandler. “Using Long-Term Structure to Retrieve Music: Representation and Matching,” In Proc. International Symposium on Music Information Retrieval, Bloomington, IN, 2001. M. Balaban, K. Ebcioglu, and O. Laske, Understanding Music with AI: Perspectives on Music Cognition, Cambridge: MIT Press; Menlo Park: AAAI Press, 1992. M.A. Bartsch and G.H. Wakefield, “To Catch a Chorus: Using Chroma-based Representations for Audio Thumbnailing,” In Proc. Workshop on Applications of Signal Processing to Audio and Acoustics, 2001. W.P. Birmingham, R.B. Dannenberg, G.H. Wakefield, M. Bartsch, D. Bykowski, D. Mazzoni, C. Meek, M. Mellody, and W. Rand, “MUSART: Music Retrieval via Aural Queries,” In Proc. International Symposium on Music Information Retrieval, Bloomington, IN, 2001. R.B. Dannenberg and N. Hu, “Pattern Discovery Techniques for Music Audio,” In Proc. International Conference on Music Information Retrieval, October 2002. J. Foote, "Visualizing Music and Audio using Self-Similarity," In Proc. ACM Multimedia Conference, Orlando, FL, pp. 77-80, 1999. J. Foote, "Automatic Audio Segmentation using a Measure of Audio Novelty." In Proc. of IEEE International Conference on Multimedia and Expo, vol. I, pp. 452-455, 2000. J. Foote, “ARTHUR: Retrieving Orchestral Music by Long-Term Structure,” In Proc. International Symposium on Music Information Retrieval, October 2000. J.L. Hsu, C.C. Liu, and L.P. Chen, “Discovering Nontrivial Repeating Patterns in Music Data,” IEEE Transactions on Multimedia, Vol. 3, No. 3, pp. 311-325, September 2001. B. Logan and S. Chu, “Music Summarization using Key Phrases,” In Proc. International Conference on Acoustics, Speech and Signal Processing, 2000.

G. Peeters, A. L. Burthe and X. Rodet, “Toward Automatic Music Audio Summary Generation from Signal Analysis,” In Proc. International Conference on Music Information Retrieval, October 2002. C. Roads, The Computer Music Tutorial, MIT Press, 1996. L. Stein, Structure and Style: the Study and Analysis of Musical Forms, Summy-Birchard Music, 1962. C. Yang, “Music Database Retrieval Based on Spectral Similarity,” In Proc. International Symposium on Music Information Retrieval, 2001.