Creating Safer and More Efficient Pharmacies through Evidence ...

Stronger. Safer. Better.
CEO Energy‐Power Conference
More Focus
More Innovation
More Grit

FTSI At A GlanceLarge, Pure-Play Pressure Pumper with unwavering attention to safety and service quality
3 |
ImagineMore
Pure-Play Focus on Frac
~$2.5mm
Maint Capex per Fleet~1/2 peer Average
~$200MM FCF over TTM
19% ROICover TTM
19% FCF Yield over TTM
$195mm reduction in
net debt over TTM
45% FCF Conversion
in 1H19 1.8x next closest peer
50%+ Savings on Consumables
vs. 3rd Parties
Disciplined Capital
Deployment
Proactive, nimble
mGMT Team
Dedicated Customer Model
Large Scale with broad geographic
footprint
Benefits fromInternal Manufacturing
Note: See Appendix for a reconciliations and calculations of FTSI’s TTM Free Cash Flow, TTM Free Cash Flow Yield, 1H19 Free Cash Flow Conversion, TTM ROIC, and Net Debt. TTM as of June 30, 2019.

Best-in-Class Through-Cycle Free Cash FlowFTSI Business Model is Structurally Advantaged to produce superior Free cash flow
4 |
ImagineMore
Note: Free cash flow is defined as cash flow from operations less capital expenditures. 2019E utilizes reported figures for 1H19 and consensus estimates for 2H19. Est. Through‐Cycle calculated by adding the preceding 2017A, 2018A and 2019E figures. Peer group includes FRAC, LBRT, PUMP, RES, SPN and USWS. Data sourced from FactSet. TTM as of June 30, 2019. Consensus estimates as of August 30, 2019. See Appendix for a reconciliations and calculations of FTSI’s Free Cash Flow and Free Cash Flow Yield.
(10%)
(5%)
0%
5%
10%
15%
20%
FTSI Peer B Peer D Peer A Peer E Peer C Peer F(50%)
(25%)
Low Overhead
ZeroEffective Federal
Tax Rate
~$2.5mm
Maintenance Capex per Fleet
50%+Savings on
Consumables
Free Cash Flow TTM Free Cash Flow Yield
($ in millions)
$(400)
$(200)
$-
$200
$400
$600
2017A 2018A 2019E Est. Through-Cycle
FTSI Peer A Peer B Peer C Peer D Peer E Peer F
$-
$200
$400
$600
$800
$1,000
$1,200
$1,400
1Q17 2Q17 3Q17 4Q17 1Q18 2Q18 3Q18 4Q18 1Q19 2Q19
Gross Debt Net Debt
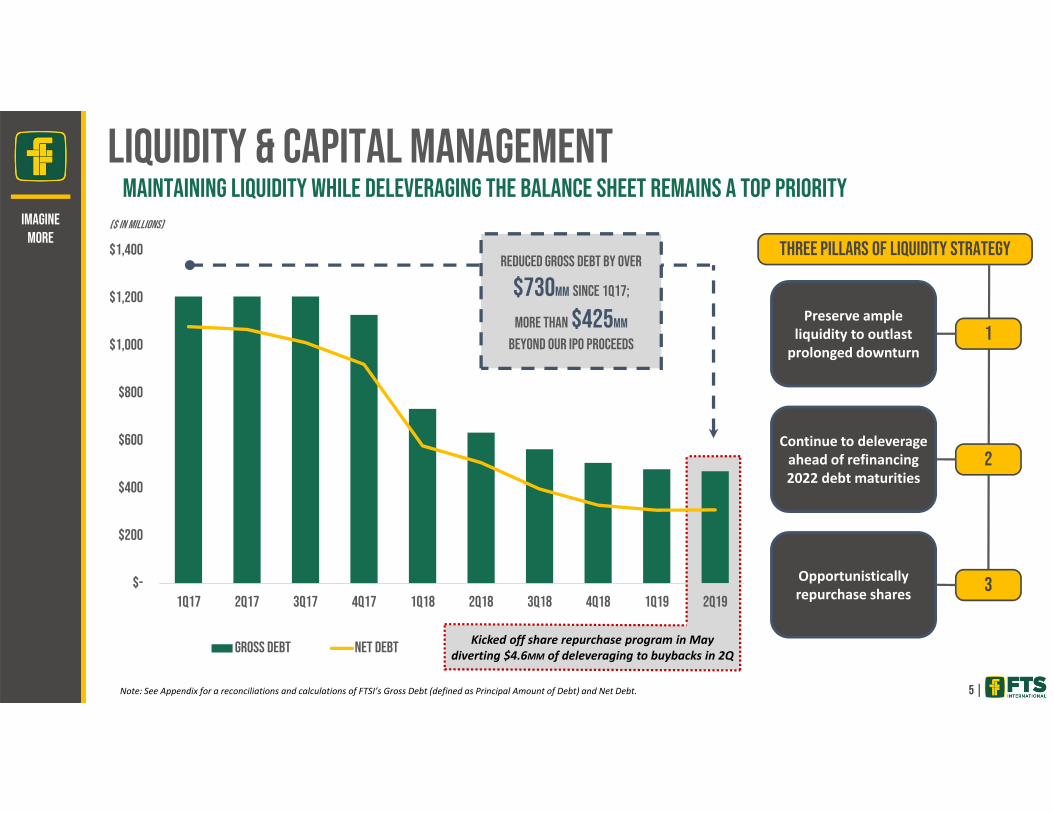
Liquidity & Capital Managementmaintaining liquidity while Deleveraging the Balance Sheet remains A top priority
5 |
ImagineMore
Reduced gross Debt by over
$730mm since 1Q17;
more than $425mm
beyond our IPO proceeds
($ in millions)
Kicked off share repurchase program in May diverting $4.6MM of deleveraging to buybacks in 2Q
Three Pillars of Liquidity Strategy
1
2
Opportunistically repurchase shares 3
Continue to deleverage ahead of refinancing 2022 debt maturities
Preserve ample liquidity to outlast prolonged downturn
Note: See Appendix for a reconciliations and calculations of FTSI’s Gross Debt (defined as Principal Amount of Debt) and Net Debt.
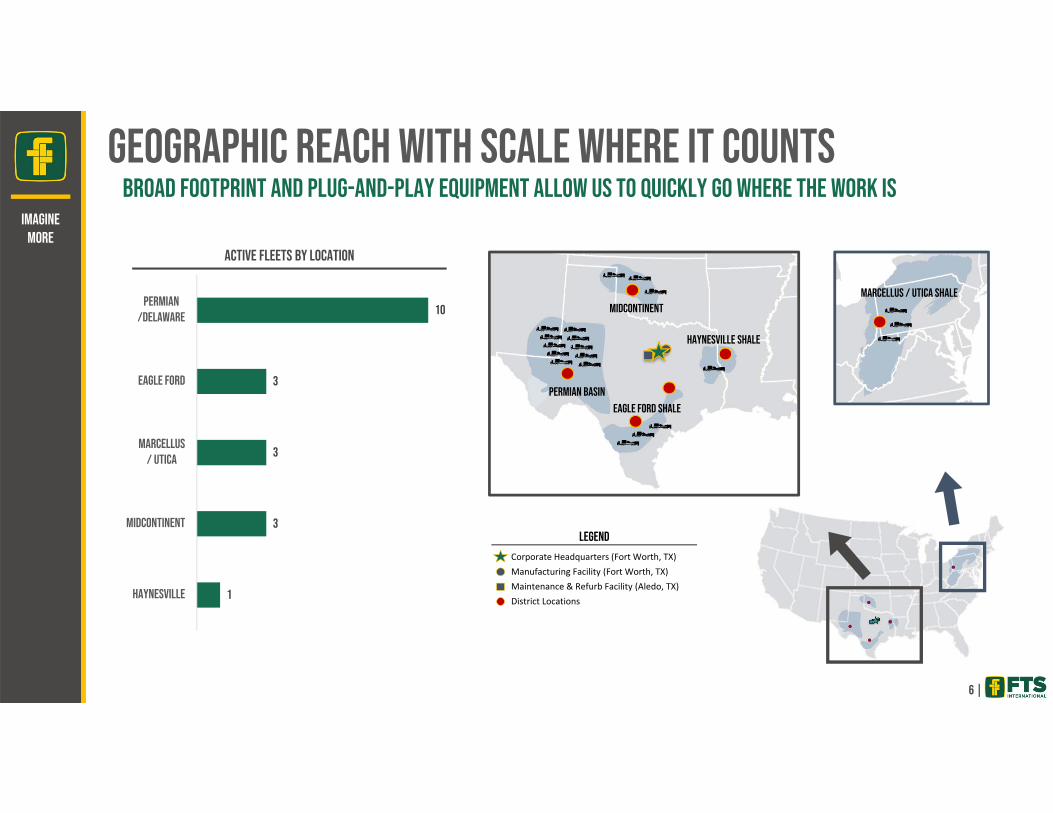
Geographic Reach with Scale where it countsBroad footprint and plug-and-play equipment allow us to quickly go where the work is
6 |
ImagineMore
Corporate Headquarters (Fort Worth, TX)Manufacturing Facility (Fort Worth, TX)Maintenance & Refurb Facility (Aledo, TX)District Locations
Legend
Permian BasinEagle Ford Shale
Haynesville Shale
MidcontinentMarcellus / Utica Shale
1
3
3
3
10
Haynesville
Midcontinent
Marcellus/ Utica
Eagle Ford
Permian/Delaware
Active Fleets by Location

Raising the bar in efficiency & reliability We are relentless in our pursuit of efficiency, and unapologetic for our attention to quality and detail
7 |
ImagineMore
>90% pump
efficiency in 2Q19
35% increase
in fluid end life over past two years
54% reduction
in pump & blender related non‐productive time per fleet since 2Q18
.23 TRIR & .06 LTIRIndustry Leading Safety Scores
“FTSI shows strong business ethics and response from account management team exceeds expectations. FTSI is very thorough with completing pad reviews which some other service companies don't offer or schedule as timely.
“FTSI is dependable and easy to work with. Their operations, field and sales personnel show a level of enthusiasm for a sustainable partnership.”
“FTSI is very proactive in solving operational problems. They keep the train rolling down the tracks with great support of the crews on location from the maintenance shop, operations group, etc.”
682 stages per fleet
in 1H19; run‐rate implies 2019 will be strongest year yet
26% increase
in pumping hours per day since 2Q18
Recent Customer Feedback
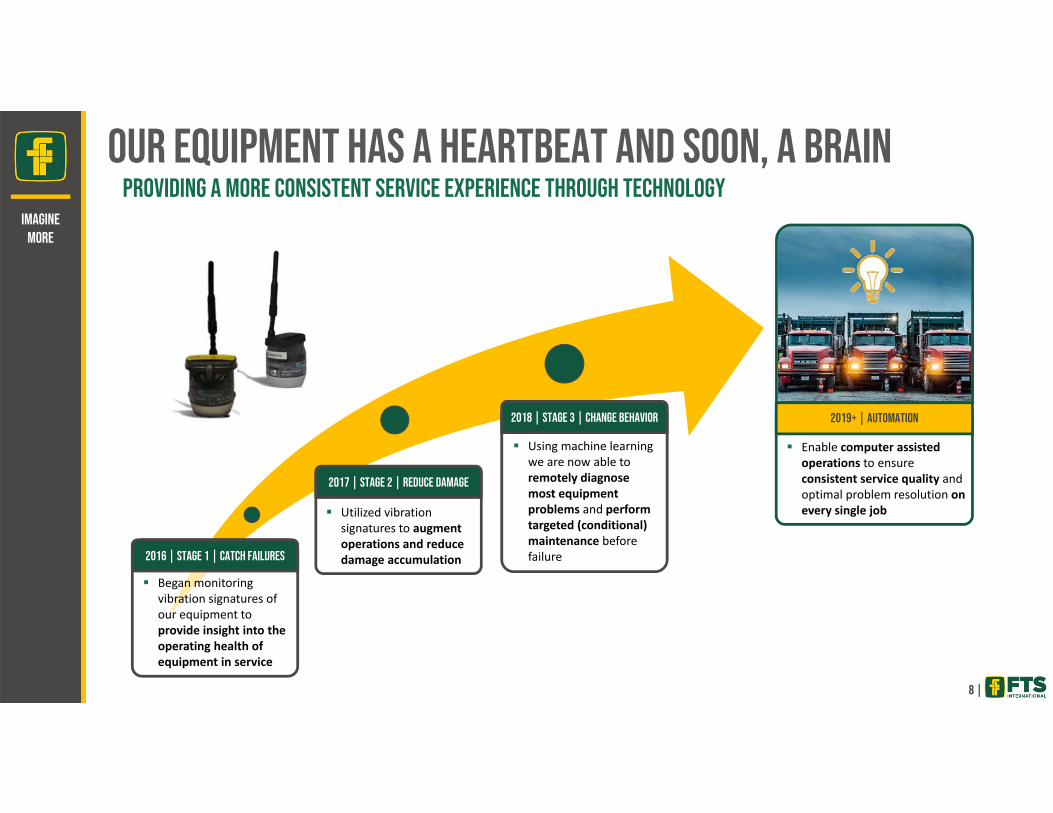
Our equipment has a heartbeat and soon, a brainProviding a more consistent service experience through technology
8 |
ImagineMore
Began monitoring vibration signatures of our equipment to provide insight into the operating health of equipment in service
2016 | Stage 1 | Catch Failures
Utilized vibration signatures to augment operations and reduce damage accumulation
2017 | Stage 2 | Reduce Damage
Using machine learning we are now able to remotely diagnose most equipment problems and perform targeted (conditional) maintenance before failure
2018 | Stage 3 | Change Behavior
Enable computer assisted operations to ensure consistent service quality and optimal problem resolution on every single job
2019+ | Automation

Meeting Demand for Gas burning FleetsOperators showing strong interest in natural gas burning fleets but unwilling to support investment
9 |
ImagineMore
Current economics do not support the capital investment for an electric fleet; however, we are evaluating all options that capture the fuel savings that E&Ps are looking for
Envision upgrading a portion of our fleet to either tier 2 or tier 4 dual fuel
• Tier 4 engines’ expected diesel displacement is ~75%, while the cost to upgrade one of our diesel fleets is expected to be ~$10 million
• Paying ~20% of the cost of an electric fleet to capture ~75% of the expected fuel savings looks to be very attractive option
No plan in place yet, but we believe building out dual fuel capacity could be advantageous to us while the industry transitions to more natural gas burning fleets
If all goes well with tier 4 testing, plan would be to seek how we can lower the expected capital required to upgrade with our internal manufacturing capabilities
CO2Reduced Flaring& Emissions
Reduce FuelCosts
2018 / 2019 Future
Deployed Tier 2 dual fuel fleet in the Permian Basin
with overwhelming success
Achieving average diesel displacement rate of ~50%
on Tier 2 Dual Fuel
Currently testing performance and
diesel displacement of Tier 4 Dual fuel
Shown as example.
CAT Tier 4 Dual Fuel Engine
Appendix
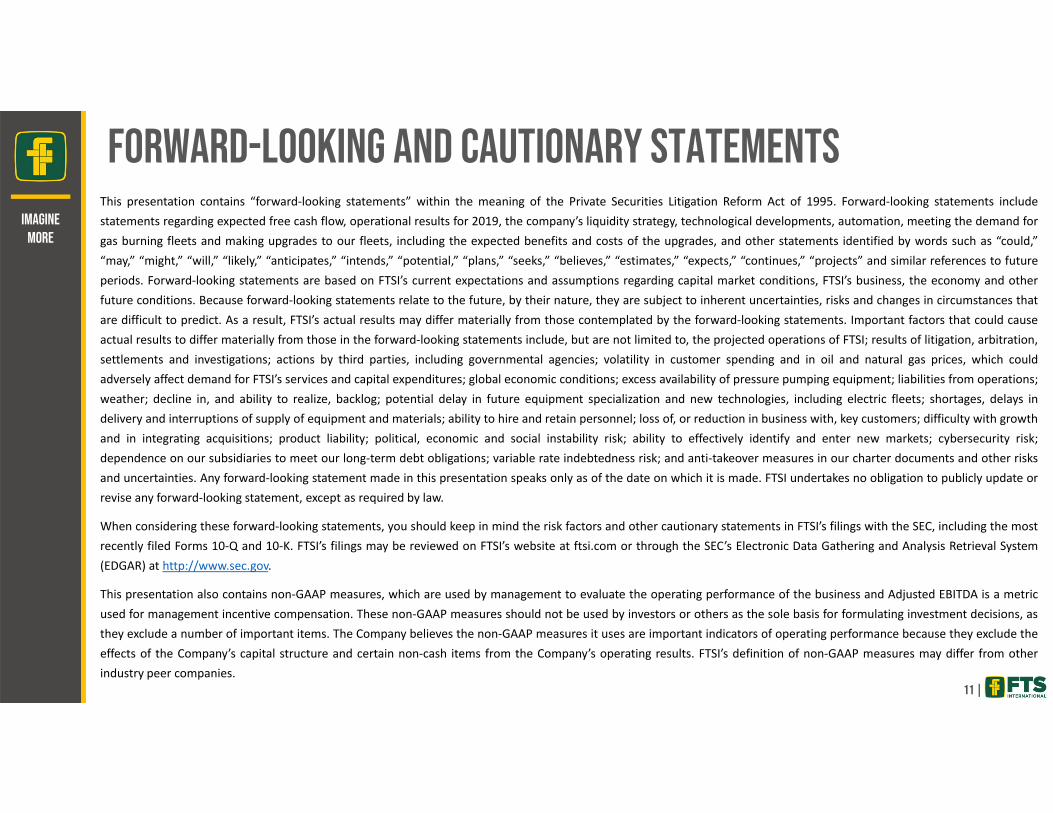
Forward-Looking and Cautionary Statements
11 |
ImagineMore
This presentation contains “forward‐looking statements” within the meaning of the Private Securities Litigation Reform Act of 1995. Forward‐looking statements includestatements regarding expected free cash flow, operational results for 2019, the company’s liquidity strategy, technological developments, automation, meeting the demand forgas burning fleets and making upgrades to our fleets, including the expected benefits and costs of the upgrades, and other statements identified by words such as “could,”“may,” “might,” “will,” “likely,” “anticipates,” “intends,” “potential,” “plans,” “seeks,” “believes,” “estimates,” “expects,” “continues,” “projects” and similar references to futureperiods. Forward‐looking statements are based on FTSI’s current expectations and assumptions regarding capital market conditions, FTSI’s business, the economy and otherfuture conditions. Because forward‐looking statements relate to the future, by their nature, they are subject to inherent uncertainties, risks and changes in circumstances thatare difficult to predict. As a result, FTSI’s actual results may differ materially from those contemplated by the forward‐looking statements. Important factors that could causeactual results to differ materially from those in the forward‐looking statements include, but are not limited to, the projected operations of FTSI; results of litigation, arbitration,settlements and investigations; actions by third parties, including governmental agencies; volatility in customer spending and in oil and natural gas prices, which couldadversely affect demand for FTSI’s services and capital expenditures; global economic conditions; excess availability of pressure pumping equipment; liabilities from operations;weather; decline in, and ability to realize, backlog; potential delay in future equipment specialization and new technologies, including electric fleets; shortages, delays indelivery and interruptions of supply of equipment and materials; ability to hire and retain personnel; loss of, or reduction in business with, key customers; difficulty with growthand in integrating acquisitions; product liability; political, economic and social instability risk; ability to effectively identify and enter new markets; cybersecurity risk;dependence on our subsidiaries to meet our long‐term debt obligations; variable rate indebtedness risk; and anti‐takeover measures in our charter documents and other risksand uncertainties. Any forward‐looking statement made in this presentation speaks only as of the date on which it is made. FTSI undertakes no obligation to publicly update orrevise any forward‐looking statement, except as required by law.
When considering these forward‐looking statements, you should keep in mind the risk factors and other cautionary statements in FTSI’s filings with the SEC, including the mostrecently filed Forms 10‐Q and 10‐K. FTSI’s filings may be reviewed on FTSI’s website at ftsi.com or through the SEC’s Electronic Data Gathering and Analysis Retrieval System(EDGAR) at http://www.sec.gov.
This presentation also contains non‐GAAP measures, which are used by management to evaluate the operating performance of the business and Adjusted EBITDA is a metricused for management incentive compensation. These non‐GAAP measures should not be used by investors or others as the sole basis for formulating investment decisions, asthey exclude a number of important items. The Company believes the non‐GAAP measures it uses are important indicators of operating performance because they exclude theeffects of the Company’s capital structure and certain non‐cash items from the Company’s operating results. FTSI’s definition of non‐GAAP measures may differ from otherindustry peer companies.
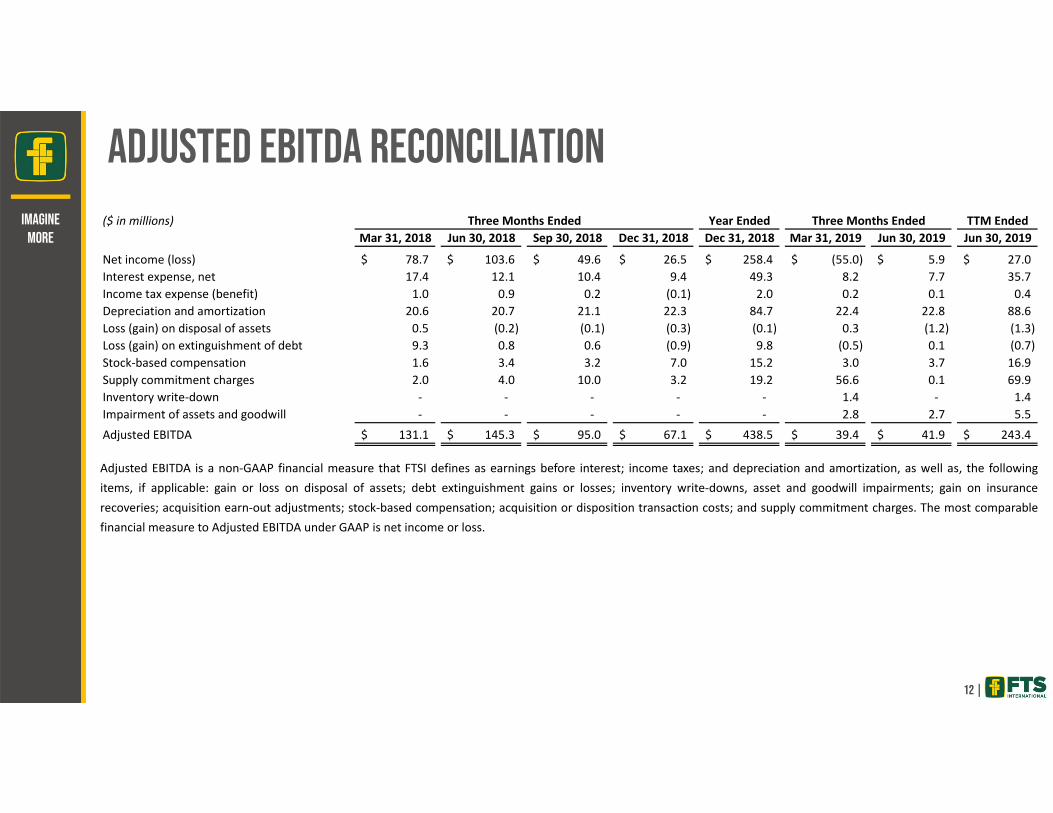
Adjusted EBITDA Reconciliation
12 |
ImagineMore
Adjusted EBITDA is a non‐GAAP financial measure that FTSI defines as earnings before interest; income taxes; and depreciation and amortization, as well as, the followingitems, if applicable: gain or loss on disposal of assets; debt extinguishment gains or losses; inventory write‐downs, asset and goodwill impairments; gain on insurancerecoveries; acquisition earn‐out adjustments; stock‐based compensation; acquisition or disposition transaction costs; and supply commitment charges. The most comparablefinancial measure to Adjusted EBITDA under GAAP is net income or loss.
($ in millions) Three Months Ended Year Ended Three Months Ended TTM EndedMar 31, 2018 Jun 30, 2018 Sep 30, 2018 Dec 31, 2018 Dec 31, 2018 Mar 31, 2019 Jun 30, 2019 Jun 30, 2019
Net income (loss) 78.7$ 103.6$ 49.6$ 26.5$ 258.4$ (55.0)$ 5.9$ 27.0$ Interest expense, net 17.4 12.1 10.4 9.4 49.3 8.2 7.7 35.7 Income tax expense (benefit) 1.0 0.9 0.2 (0.1) 2.0 0.2 0.1 0.4 Depreciation and amortization 20.6 20.7 21.1 22.3 84.7 22.4 22.8 88.6 Loss (gain) on disposal of assets 0.5 (0.2) (0.1) (0.3) (0.1) 0.3 (1.2) (1.3) Loss (gain) on extinguishment of debt 9.3 0.8 0.6 (0.9) 9.8 (0.5) 0.1 (0.7) Stock‐based compensation 1.6 3.4 3.2 7.0 15.2 3.0 3.7 16.9 Supply commitment charges 2.0 4.0 10.0 3.2 19.2 56.6 0.1 69.9 Inventory write‐down ‐ ‐ ‐ ‐ ‐ 1.4 ‐ 1.4 Impairment of assets and goodwill ‐ ‐ ‐ ‐ ‐ 2.8 2.7 5.5 Adjusted EBITDA 131.1$ 145.3$ 95.0$ 67.1$ 438.5$ 39.4$ 41.9$ 243.4$

Free Cash Flow Reconciliation & Yield Calculation
13 |
ImagineMore
(Figures in millions except VWAP and FCF yield) Consensus Estimate for EstimatedYear Ended Three Months Ended Year Ended Three Months Ended TTM Ended Three Months Ended Year Ended Through‐Dec 31, 2017 Mar 31, 2018 Jun 30, 2018 Sep 30, 2018 Dec 31, 2018 Dec 31, 2018 Mar 31, 2019 Jun 30, 2019 Jun 30, 2019 Sep 30, 2019 Dec 31, 2019 Dec 31, 2019 Cycle
Net income (loss) 200.7$ 78.7$ 103.6$ 49.6$ 26.5$ 258.4$ (55.0)$ 5.9$ 27.0$
Add: non cash itemsDepreciation, depletion and amortization 86.6 20.6 20.7 21.1 22.3 84.7 22.4 22.8 88.6 Stock‐based compensation ‐ 1.6 3.4 3.2 7.0 15.2 3.0 3.7 16.9 Amortization of debt discounts and issuance costs 3.9 0.9 0.6 0.5 0.5 2.5 0.5 0.4 1.9 Impairment of assets and goodwill ‐ ‐ ‐ ‐ ‐ ‐ 2.8 2.7 5.5 (Gain) loss on disposal of assets (1.4) 0.5 (0.2) (0.1) (0.3) (0.1) 0.3 (1.2) (1.3) Loss (gain) on extinguishment of debt 1.4 9.3 0.8 0.6 (0.9) 9.8 (0.5) 0.1 (0.7) Gain on insurance recovery (2.9) ‐ ‐ ‐ ‐ ‐ ‐ ‐ ‐ Non‐cash provision for supply commitment charges 1.2 2.0 4.0 10.0 3.2 19.2 56.6 0.1 69.9 Cash paid to settle commitment charges (1.8) ‐ (2.0) (0.1) (3.2) (5.3) ‐ (15.9) (19.2) Inventory write‐down ‐ ‐ ‐ ‐ ‐ ‐ 1.4 ‐ 1.4 Acquisition earn‐out adjustment ‐ ‐ ‐ ‐ ‐ ‐ ‐ ‐ ‐ Other non‐cash items 0.5 0.1 1.0 0.7 (3.4) (1.6) (0.8) 0.8 (2.7)
Net income adjusted for non cash items 288.2 113.7 131.9 85.5 51.7 382.8 30.7 19.4 187.3
Changes in operating assets and liabilities:Accounts receivable (154.9) (32.1) (22.7) 70.8 56.7 72.7 7.7 9.1 144.3 Accounts receivable from related parties (2.9) (34.2) 14.8 15.0 7.4 3.0 ‐ ‐ 22.4 Inventories (20.1) (9.1) (8.2) (6.0) 0.7 (22.6) (1.7) 7.3 0.3 Prepaid expenses and other assets (4.4) (0.3) (0.5) 1.9 1.7 2.8 0.3 (8.9) (5.0) Accounts payable 65.8 26.7 (5.7) (46.2) (16.4) (41.6) (11.3) (1.0) (74.9) Accrued expenses and other liabilities 8.3 9.6 (10.4) 8.1 (19.6) (12.3) 8.2 (12.5) (15.8)
Changes in operating assets and liabilities (108.2) (39.4) (32.7) 43.6 30.5 2.0 3.2 (6.0) 71.3
Net cash provided by (used in) operating activities 180.0 74.3 99.2 129.1 82.2 384.8 33.9 13.4 258.6 37.0 27.0 111.3 676.1 Less: capital expenditures (64.0) (37.8) (28.5) (18.6) (15.6) (100.5) (11.7) (14.8) (60.7) (14.5) (13.5) (54.5) (219.0)
Free cash flow 116.0$ 36.5$ 70.7$ 110.5$ 66.6$ 284.3$ 22.2$ (1.4)$ 197.9$ 22.5$ 13.5$ 56.8$ 457.1$
Common shares outstanding 109.9
TTM volume‐weighted average price for FTSI common stock 9.6 TTM volume‐weighted average market capitalization 1,057.3
Free cash flow yield 18.7%
Free cash flow is a non‐GAAP financial measure that FTSI defines as cash flow from operations less capital expenditures. Free cash flow yield is also a non‐GAAP financialmeasure that FTSI defines as free cash flow divided by the product of the volume‐weighted average price times the common shares outstanding. The most comparablefinancial measure to free cash flow is net cash provided by (used in) operating activities.
Free Cash Flow Conversion & ROIC Calculations
14 |
ImagineMore
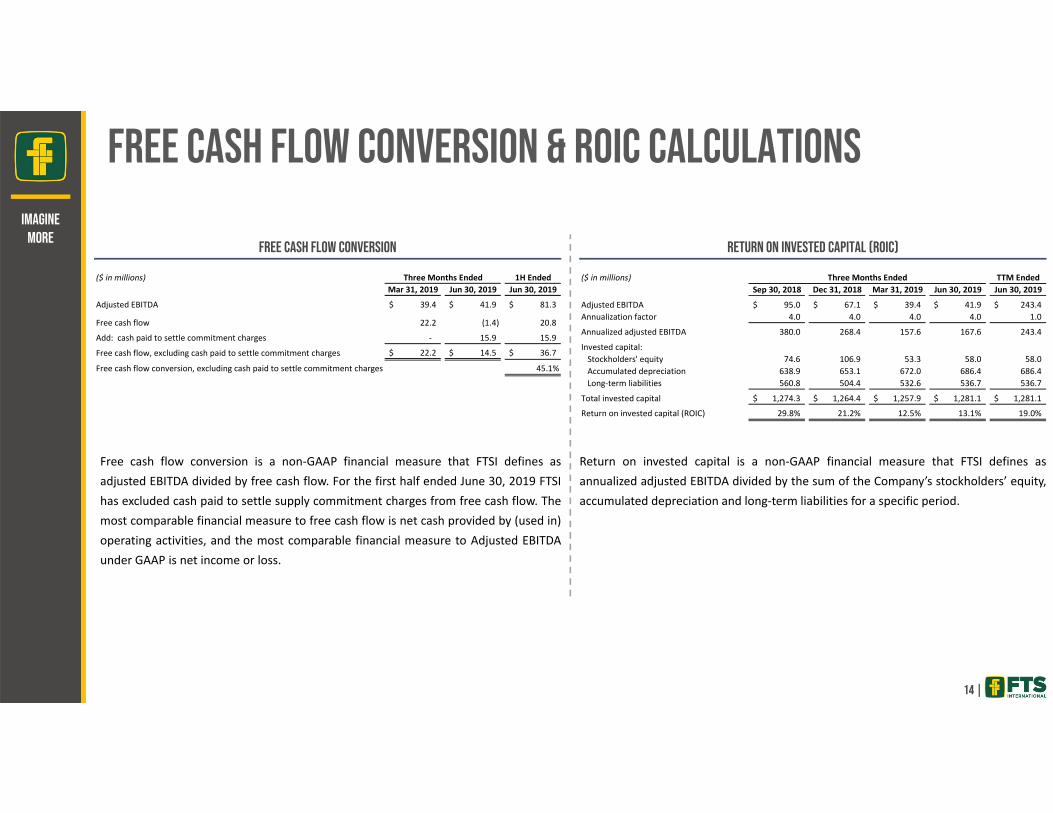
Free cash flow conversion is a non‐GAAP financial measure that FTSI defines asadjusted EBITDA divided by free cash flow. For the first half ended June 30, 2019 FTSIhas excluded cash paid to settle supply commitment charges from free cash flow. Themost comparable financial measure to free cash flow is net cash provided by (used in)operating activities, and the most comparable financial measure to Adjusted EBITDAunder GAAP is net income or loss.
($ in millions) Three Months Ended 1H EndedMar 31, 2019 Jun 30, 2019 Jun 30, 2019
Adjusted EBITDA 39.4$ 41.9$ 81.3$
Free cash flow 22.2 (1.4) 20.8
Add: cash paid to settle commitment charges ‐ 15.9 15.9
Free cash flow, excluding cash paid to settle commitment charges 22.2$ 14.5$ 36.7$
Free cash flow conversion, excluding cash paid to settle commitment charges 45.1%
Return on invested capital is a non‐GAAP financial measure that FTSI defines asannualized adjusted EBITDA divided by the sum of the Company’s stockholders’ equity,accumulated depreciation and long‐term liabilities for a specific period.
($ in millions) Three Months Ended TTM EndedSep 30, 2018 Dec 31, 2018 Mar 31, 2019 Jun 30, 2019 Jun 30, 2019
Adjusted EBITDA 95.0$ 67.1$ 39.4$ 41.9$ 243.4$ Annualization factor 4.0 4.0 4.0 4.0 1.0
Annualized adjusted EBITDA 380.0 268.4 157.6 167.6 243.4
Invested capital:Stockholders' equity 74.6 106.9 53.3 58.0 58.0 Accumulated depreciation 638.9 653.1 672.0 686.4 686.4 Long‐term liabilities 560.8 504.4 532.6 536.7 536.7
Total invested capital 1,274.3$ 1,264.4$ 1,257.9$ 1,281.1$ 1,281.1$
Return on invested capital (ROIC) 29.8% 21.2% 12.5% 13.1% 19.0%
Free Cash Flow Conversion Return on Invested Capital (ROIC)
Net Debt Reconciliation
15 |
ImagineMore
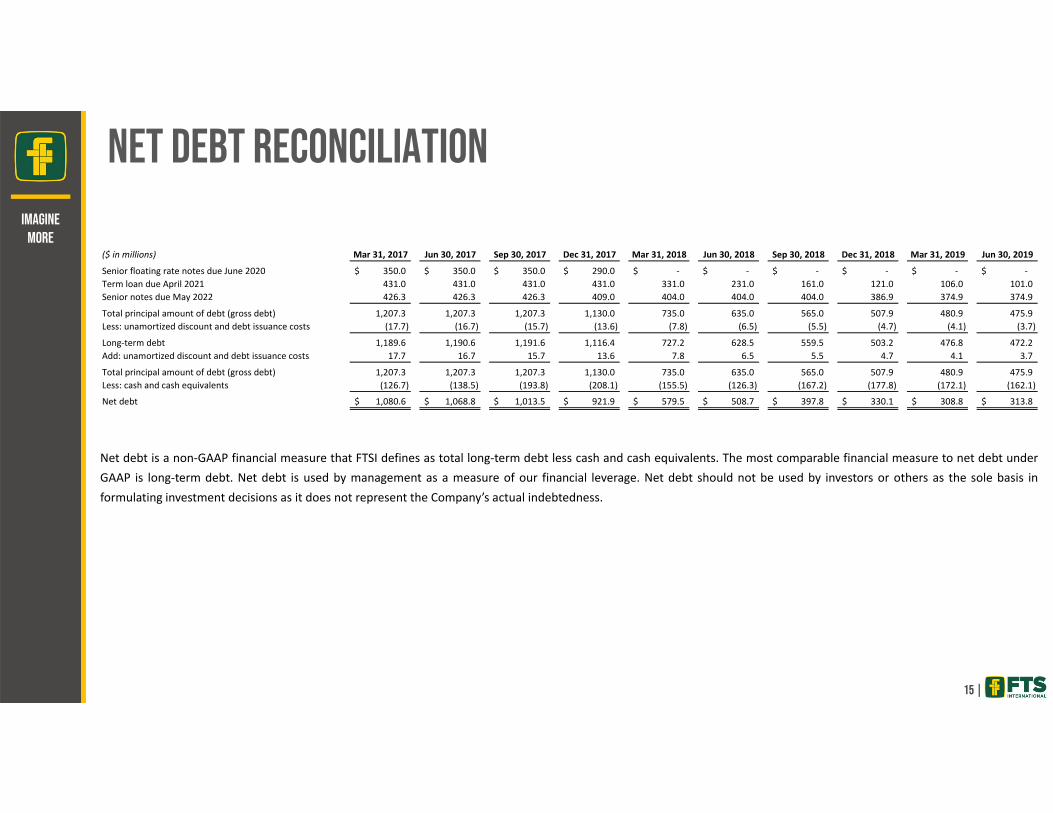
($ in millions) Mar 31, 2017 Jun 30, 2017 Sep 30, 2017 Dec 31, 2017 Mar 31, 2018 Jun 30, 2018 Sep 30, 2018 Dec 31, 2018 Mar 31, 2019 Jun 30, 2019
Senior floating rate notes due June 2020 350.0$ 350.0$ 350.0$ 290.0$ ‐$ ‐$ ‐$ ‐$ ‐$ ‐$ Term loan due April 2021 431.0 431.0 431.0 431.0 331.0 231.0 161.0 121.0 106.0 101.0 Senior notes due May 2022 426.3 426.3 426.3 409.0 404.0 404.0 404.0 386.9 374.9 374.9
Total principal amount of debt (gross debt) 1,207.3 1,207.3 1,207.3 1,130.0 735.0 635.0 565.0 507.9 480.9 475.9 Less: unamortized discount and debt issuance costs (17.7) (16.7) (15.7) (13.6) (7.8) (6.5) (5.5) (4.7) (4.1) (3.7)
Long‐term debt 1,189.6 1,190.6 1,191.6 1,116.4 727.2 628.5 559.5 503.2 476.8 472.2 Add: unamortized discount and debt issuance costs 17.7 16.7 15.7 13.6 7.8 6.5 5.5 4.7 4.1 3.7
Total principal amount of debt (gross debt) 1,207.3 1,207.3 1,207.3 1,130.0 735.0 635.0 565.0 507.9 480.9 475.9 Less: cash and cash equivalents (126.7) (138.5) (193.8) (208.1) (155.5) (126.3) (167.2) (177.8) (172.1) (162.1)
Net debt 1,080.6$ 1,068.8$ 1,013.5$ 921.9$ 579.5$ 508.7$ 397.8$ 330.1$ 308.8$ 313.8$
Net debt is a non‐GAAP financial measure that FTSI defines as total long‐term debt less cash and cash equivalents. The most comparable financial measure to net debt underGAAP is long‐term debt. Net debt is used by management as a measure of our financial leverage. Net debt should not be used by investors or others as the sole basis informulating investment decisions as it does not represent the Company’s actual indebtedness.