Stronger… Greener… Bigger… E.I.D.- Parry (India) Limited · Sugar Based confectionery from...
55
Making Sugar since 1842 E.I.D.- Parry (India) Limited Investor Presentation Dec 2010 Stronger… Greener… Bigger…
Transcript of Stronger… Greener… Bigger… E.I.D.- Parry (India) Limited · Sugar Based confectionery from...
0Making Sugar since 1842 0
E.I.D.- Parry (India) LimitedInvestor Presentation
Dec 2010
Stronger… Greener… Bigger…
Making Sugar since 1842 1
This presentation contains forward-looking statements which may be identified by their use of words like “plans,” “expects,” “will,” “anticipates,” “believes,” “intends,” “projects,”
“estimates” or other words of similar meaning. All statements that address expectations
or projections about the future, including, but not limited to, statements about the strategy for growth, product development, market position, expenditures, and financial results, are forward-looking statements.
Forward-looking statements are based on certain assumptions and expectations of future events. The companies referred to in this presentation cannot guarantee that these assumptions and expectations are accurate or will be realized. The actual results, performance or achievements, could thus differ materially from those projected in any such forward-looking statements. These companies assume no responsibility to publicly amend, modify or revise any forward looking statements, on the basis of any subsequent developments, information or events, or otherwise.
Disclaimer
2Making Sugar since 1842 2
Company Overview
Sugar Business ► World and Indian Sugar Balance► Closer look @ Sugar in South India► EID – Sugar Business
Bio Products Business► Nutraceuticals► Bio Pesticides
Consolidated Financials
Agenda
3Making Sugar since 1842 3
Company Overview
Sugar Business ► World and Indian Sugar Balance► Closer look @ Sugar in South India► EID – Sugar Business
Bio Products Business► Nutraceuticals► Bio Pesticides
Consolidated Financials
Agenda
4Making Sugar since 1842 4
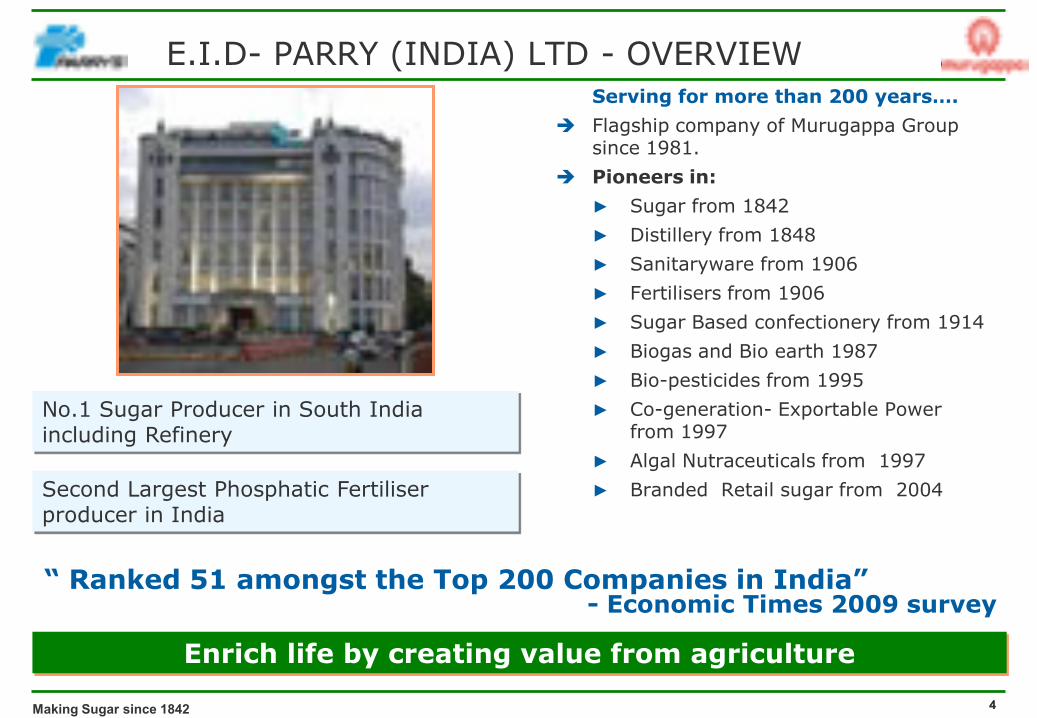
E.I.D- PARRY (INDIA) LTD - OVERVIEWServing for more than 200 years….
Flagship company of Murugappa Group since 1981.
Pioneers in: ► Sugar from 1842► Distillery from 1848► Sanitaryware from 1906► Fertilisers from 1906 ► Sugar Based confectionery from 1914► Biogas and Bio earth 1987► Bio-pesticides from 1995► Co-generation- Exportable Power
from 1997► Algal Nutraceuticals from 1997► Branded Retail sugar from 2004
No.1 Sugar Producer in South India including Refinery
Second Largest Phosphatic Fertiliser producer in India
Enrich life by creating value from agriculture
“ Ranked 51 amongst the Top 200 Companies in India”- Economic Times 2009 survey
5Making Sugar since 1842 5
OVERVIEW
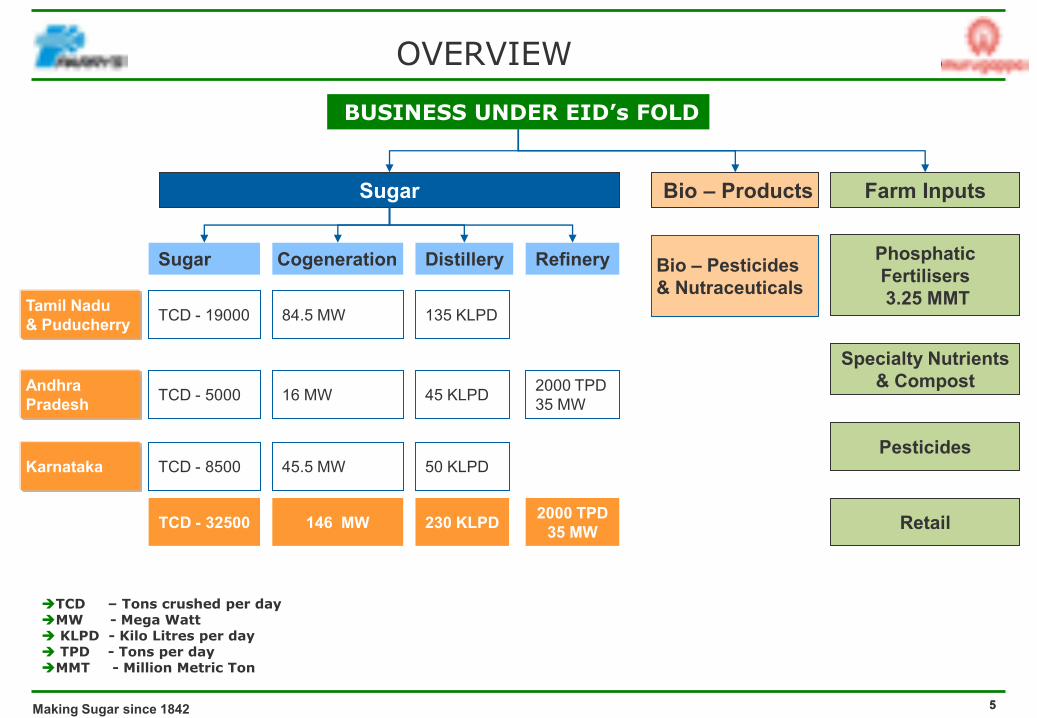
BUSINESS UNDER EID‟s FOLD
Sugar Bio – Products Farm Inputs
Sugar Cogeneration Distillery Refinery
TCD - 19000 84.5 MW 135 KLPD
TCD - 5000 16 MW 45 KLPD 2000 TPD 35 MW
TCD - 8500 45.5 MW 50 KLPD
Tamil Nadu & Puducherry
Andhra Pradesh
Karnataka
TCD - 32500 146 MW 230 KLPD 2000 TPD35 MW
Bio – Pesticides & Nutraceuticals
PhosphaticFertilisers 3.25 MMT
Specialty Nutrients & Compost
Pesticides
Retail
TCD – Tons crushed per dayMW - Mega Watt KLPD - Kilo Litres per day TPD - Tons per dayMMT - Million Metric Ton
6Making Sugar since 1842 6
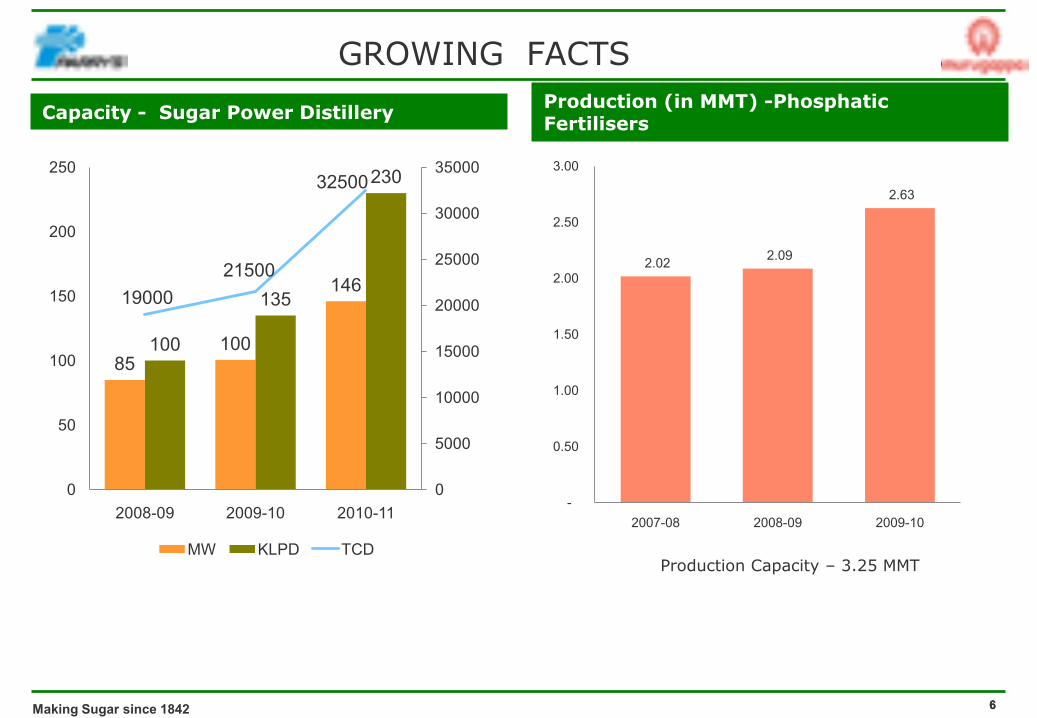
85100
146
100
135
230
1900021500
32500
0
5000
10000
15000
20000
25000
30000
35000
0
50
100
150
200
250
2008-09 2009-10 2010-11
MW KLPD TCD
GROWING FACTS
Capacity - Sugar Power Distillery Production (in MMT) -Phosphatic Fertilisers
Production Capacity – 3.25 MMT
2.02 2.09
2.63
-
0.50
1.00
1.50
2.00
2.50
3.00
2007-08 2008-09 2009-10
7Making Sugar since 1842 7
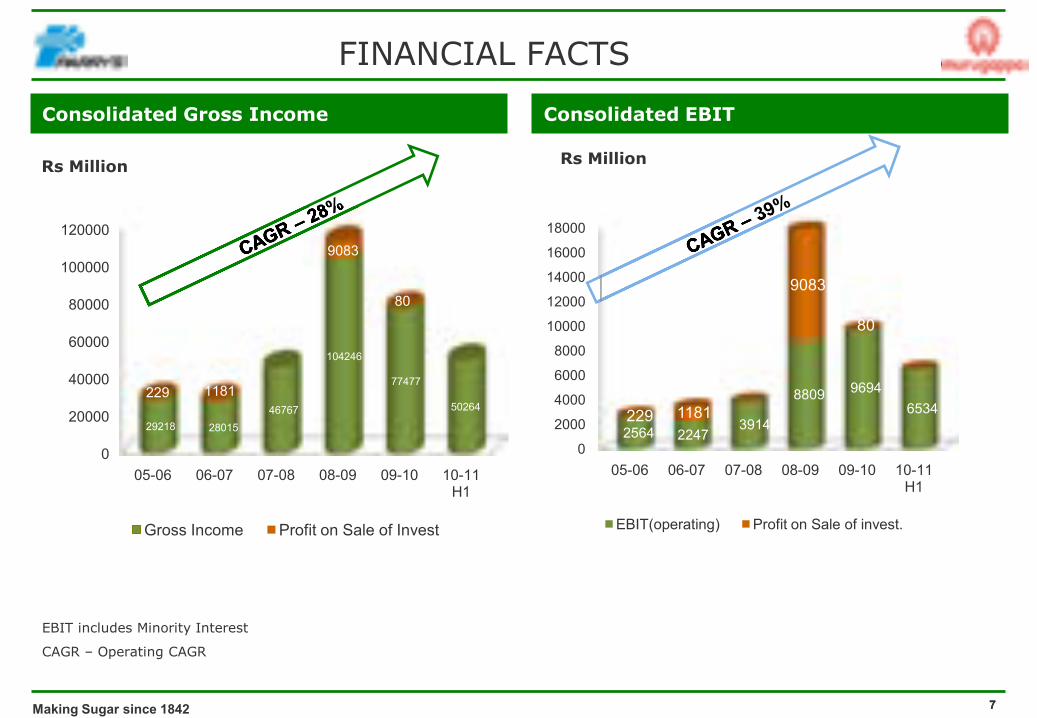
Rs Million
Consolidated Gross Income Consolidated EBIT
FINANCIAL FACTS
EBIT includes Minority Interest
CAGR – Operating CAGR
Rs Million
0
20000
40000
60000
80000
100000
120000
05-06 06-07 07-08 08-09 09-10 10-11 H1
29218 2801546767
104246
77477
50264229 1181
9083
80
Gross Income Profit on Sale of Invest
0
2000
4000
6000
8000
10000
12000
14000
16000
18000
05-06 06-07 07-08 08-09 09-10 10-11 H1
2564 2247 3914
8809 9694 6534 229 1181
9083
80
EBIT(operating) Profit on Sale of invest.
8Making Sugar since 1842 8
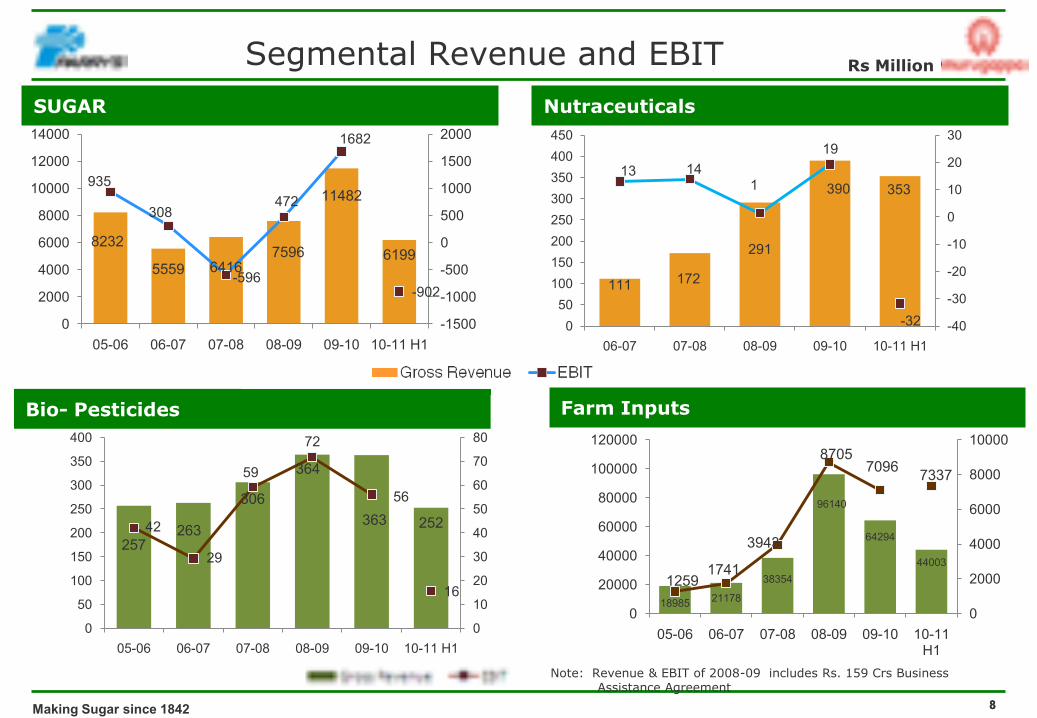
Rs Million
Bio- Pesticides
Segmental Revenue and EBIT
Farm Inputs
Note: Revenue & EBIT of 2008-09 includes Rs. 159 Crs Business Assistance Agreement
18985 21178
38354
96140
64294
44003
12591741
3943
87057096 7337
0
2000
4000
6000
8000
10000
0
20000
40000
60000
80000
100000
120000
05-06 06-07 07-08 08-09 09-10 10-11 H1
SUGAR
8232
5559 64167596
11482
6199
935
308
-596
472
1682
-902
-1500
-1000
-500
0
500
1000
1500
2000
0
2000
4000
6000
8000
10000
12000
14000
05-06 06-07 07-08 08-09 09-10 10-11 H1
257263
306
364
363 25242
29
59
72
56
16
0
10
20
30
40
50
60
70
80
0
50
100
150
200
250
300
350
400
05-06 06-07 07-08 08-09 09-10 10-11 H1
Nutraceuticals
111 172
291
390 35313 14
1
19
-32 -40
-30
-20
-10
0
10
20
30
050
100150200250300350400450
06-07 07-08 08-09 09-10 10-11 H1
9Making Sugar since 1842 9
Company Overview
Sugar Business ► World and Indian Sugar Balance► Closer look @ Sugar in South India► EID – Sugar Business
Bio Products Business► Nutraceuticals► Bio Pesticides
Consolidated Financials
Agenda
10Making Sugar since 1842 10
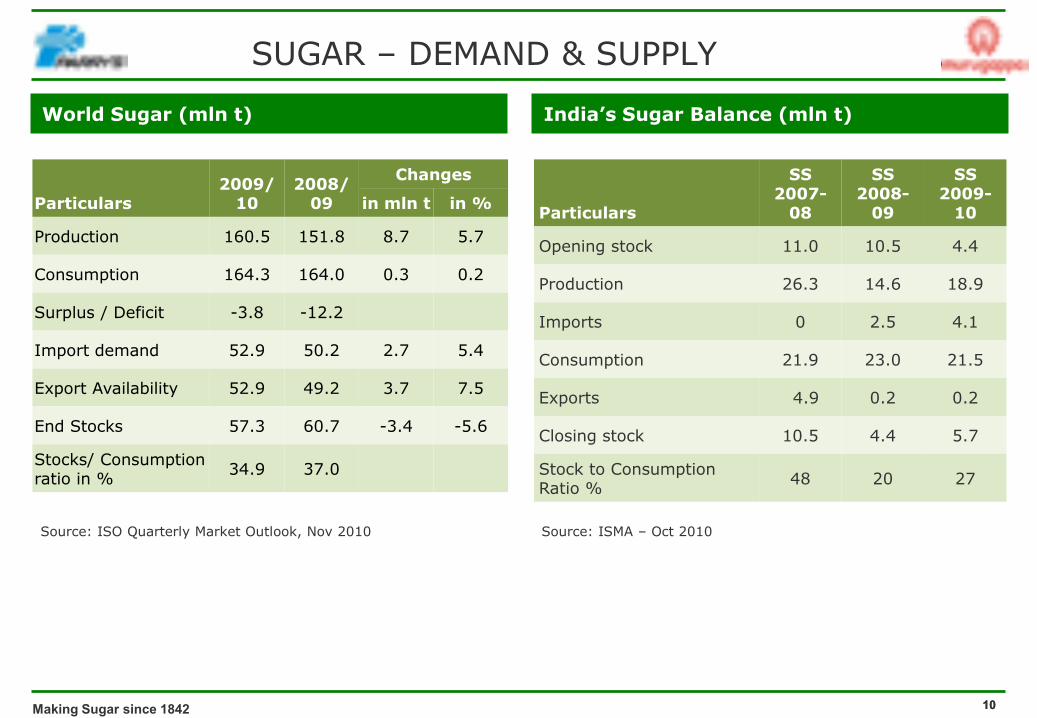
Source: ISO Quarterly Market Outlook, Nov 2010 Source: ISMA – Oct 2010
Particulars
SS 2007-
08
SS 2008-
09
SS 2009-
10
Opening stock 11.0 10.5 4.4
Production 26.3 14.6 18.9
Imports 0 2.5 4.1
Consumption 21.9 23.0 21.5
Exports 4.9 0.2 0.2
Closing stock 10.5 4.4 5.7
Stock to Consumption Ratio % 48 20 27
India‟s Sugar Balance (mln t)World Sugar (mln t)
SUGAR – DEMAND & SUPPLY
Particulars2009/
102008/
09
Changes
in mln t in %
Production 160.5 151.8 8.7 5.7
Consumption 164.3 164.0 0.3 0.2
Surplus / Deficit -3.8 -12.2
Import demand 52.9 50.2 2.7 5.4
Export Availability 52.9 49.2 3.7 7.5
End Stocks 57.3 60.7 -3.4 -5.6
Stocks/ Consumptionratio in % 34.9 37.0
11Making Sugar since 1842 11
Company Overview
Sugar Business ► World and Indian Sugar Balance► Closer look @ Sugar in South India► EID – Sugar Business
Bio Products Business► Nutraceuticals► Bio Pesticides
Consolidated Financials
Agenda
12Making Sugar since 1842 12
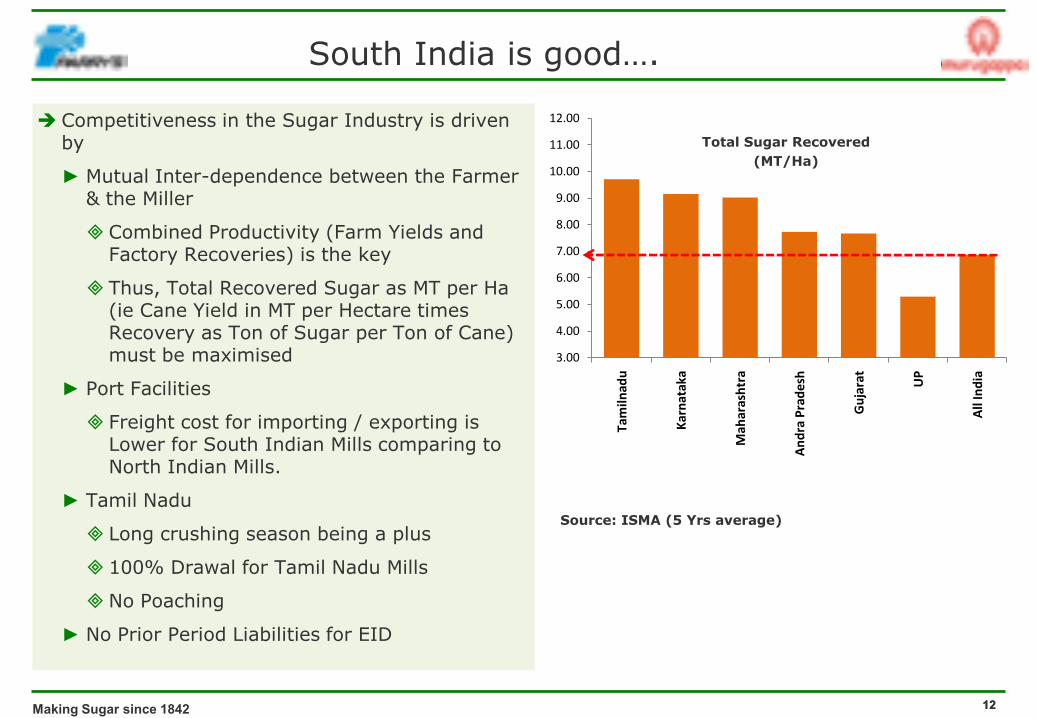
South India is good….
Competitiveness in the Sugar Industry is driven by
► Mutual Inter-dependence between the Farmer & the Miller
Combined Productivity (Farm Yields and Factory Recoveries) is the key
Thus, Total Recovered Sugar as MT per Ha (ie Cane Yield in MT per Hectare times Recovery as Ton of Sugar per Ton of Cane) must be maximised
► Port Facilities
Freight cost for importing / exporting is Lower for South Indian Mills comparing to North Indian Mills.
► Tamil Nadu
Long crushing season being a plus
100% Drawal for Tamil Nadu Mills
No Poaching
► No Prior Period Liabilities for EID
Source: ISMA (5 Yrs average)
Total Sugar Recovered (MT/Ha)
3.00
4.00
5.00
6.00
7.00
8.00
9.00
10.00
11.00
12.00
Tam
ilnad
u
Karn
atak
a
Mah
aras
htra
And
ra P
rade
sh
Guj
arat UP
All
Indi
a
13Making Sugar since 1842 13
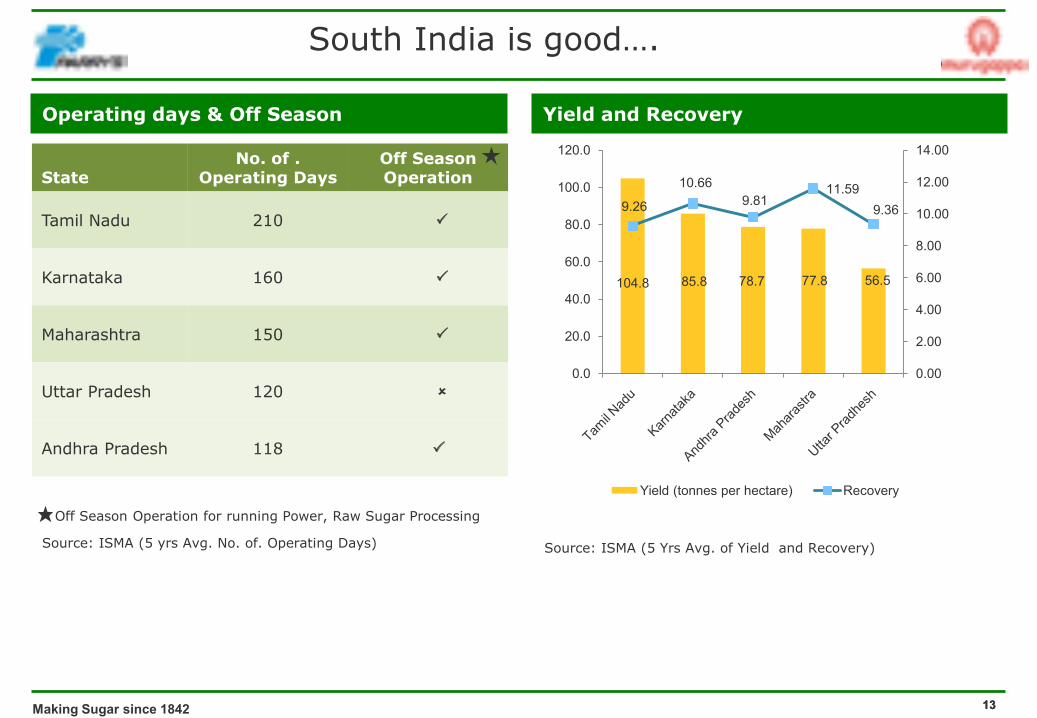
StateNo. of .
Operating DaysOff SeasonOperation
Tamil Nadu 210
Karnataka 160
Maharashtra 150
Uttar Pradesh 120
Andhra Pradesh 118
* Off Season Operation for running Power, Raw Sugar Processing
Source: ISMA (5 yrs Avg. No. of. Operating Days) Source: ISMA (5 Yrs Avg. of Yield and Recovery)
Operating days & Off Season Yield and Recovery
South India is good….
104.8 85.8 78.7 77.8 56.5
9.26
10.669.81
11.599.36
0.00
2.00
4.00
6.00
8.00
10.00
12.00
14.00
0.0
20.0
40.0
60.0
80.0
100.0
120.0
Yield (tonnes per hectare) Recovery
14Making Sugar since 1842 14
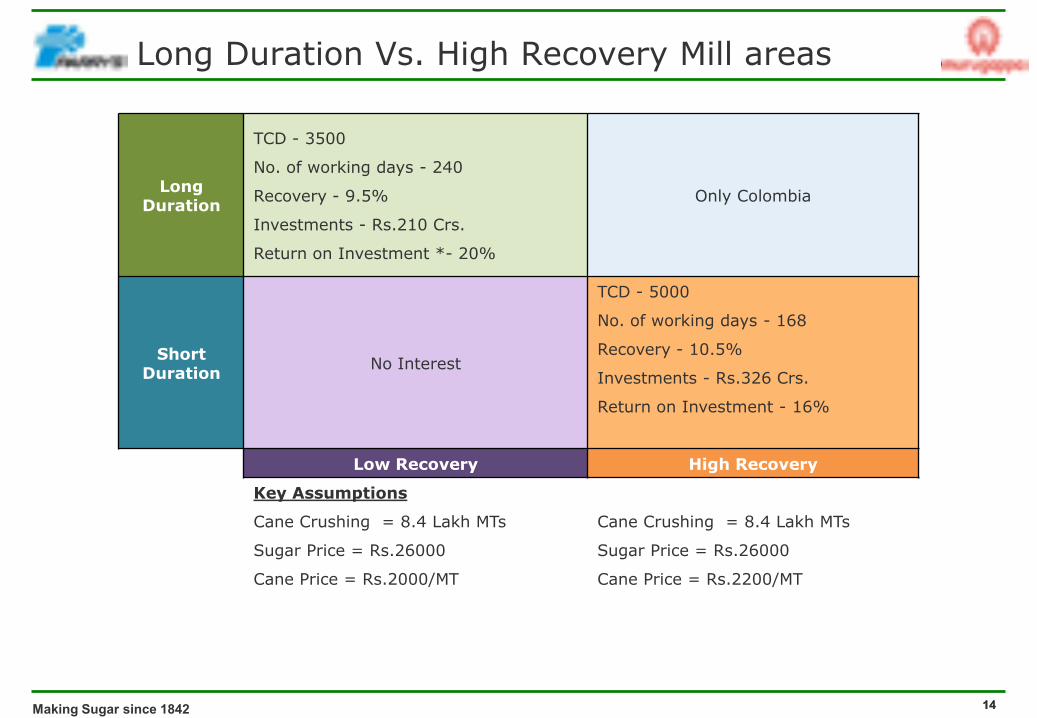
Long Duration Vs. High Recovery Mill areas
Long Duration
TCD - 3500
No. of working days - 240
Recovery - 9.5%
Investments - Rs.210 Crs.
Return on Investment *- 20%
Only Colombia
Short Duration No Interest
TCD - 5000
No. of working days - 168
Recovery - 10.5%
Investments - Rs.326 Crs.
Return on Investment - 16%
Low Recovery High Recovery
Key Assumptions
Cane Crushing = 8.4 Lakh MTs
Sugar Price = Rs.26000
Cane Price = Rs.2000/MT
Cane Crushing = 8.4 Lakh MTs
Sugar Price = Rs.26000
Cane Price = Rs.2200/MT
15Making Sugar since 1842 15
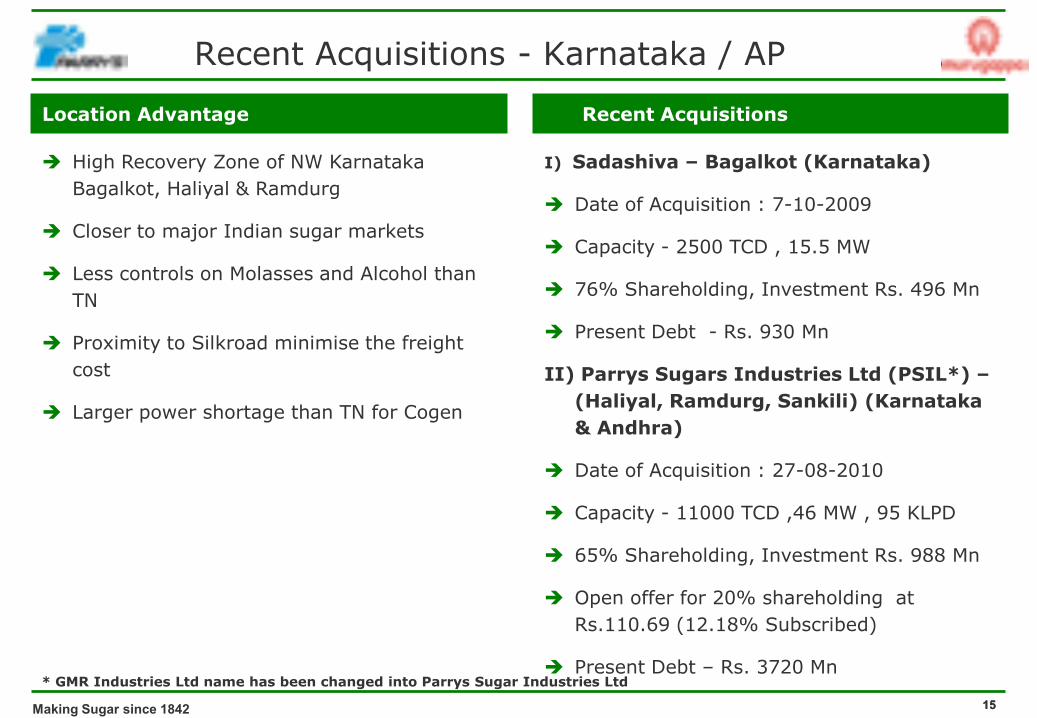
Recent AcquisitionsLocation Advantage
Recent Acquisitions - Karnataka / AP
High Recovery Zone of NW Karnataka Bagalkot, Haliyal & Ramdurg
Closer to major Indian sugar markets
Less controls on Molasses and Alcohol than TN
Proximity to Silkroad minimise the freight cost
Larger power shortage than TN for Cogen
I) Sadashiva – Bagalkot (Karnataka)
Date of Acquisition : 7-10-2009
Capacity - 2500 TCD , 15.5 MW
76% Shareholding, Investment Rs. 496 Mn
Present Debt - Rs. 930 Mn
II) Parrys Sugars Industries Ltd (PSIL*) –(Haliyal, Ramdurg, Sankili) (Karnataka & Andhra)
Date of Acquisition : 27-08-2010
Capacity - 11000 TCD ,46 MW , 95 KLPD
65% Shareholding, Investment Rs. 988 Mn
Open offer for 20% shareholding at Rs.110.69 (12.18% Subscribed)
Present Debt – Rs. 3720 Mn* GMR Industries Ltd name has been changed into Parrys Sugar Industries Ltd
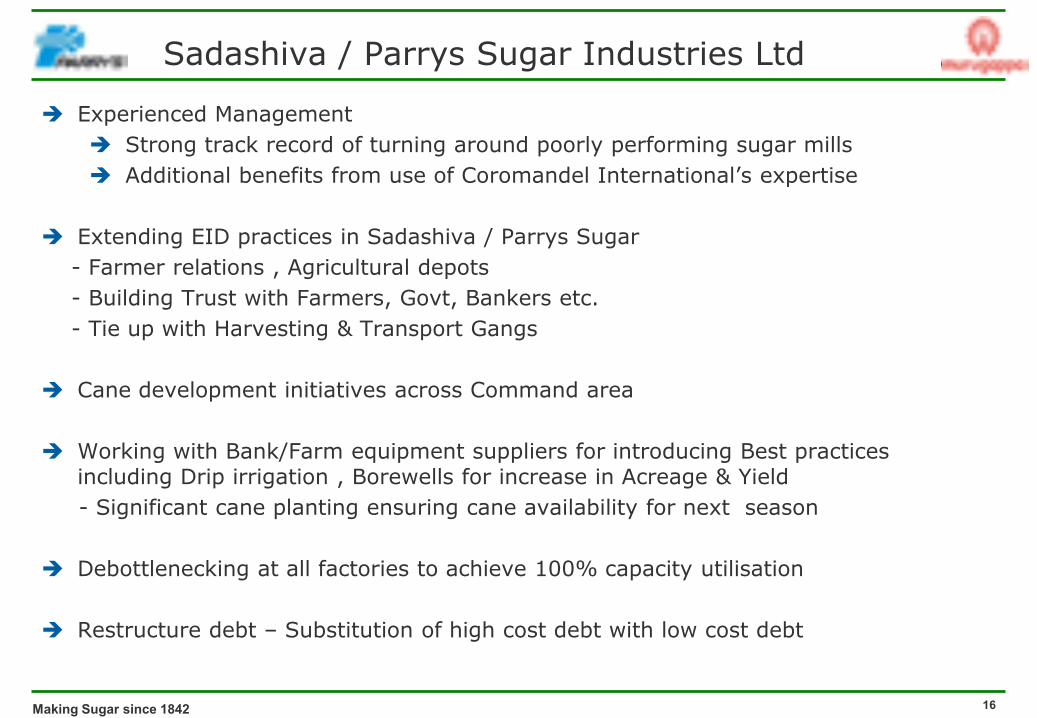
Sadashiva / Parrys Sugar Industries Ltd
Making Sugar since 1842 16
Experienced Management Strong track record of turning around poorly performing sugar mills Additional benefits from use of Coromandel International’s expertise
Extending EID practices in Sadashiva / Parrys Sugar- Farmer relations , Agricultural depots- Building Trust with Farmers, Govt, Bankers etc.- Tie up with Harvesting & Transport Gangs
Cane development initiatives across Command area
Working with Bank/Farm equipment suppliers for introducing Best practices including Drip irrigation , Borewells for increase in Acreage & Yield - Significant cane planting ensuring cane availability for next season
Debottlenecking at all factories to achieve 100% capacity utilisation
Restructure debt – Substitution of high cost debt with low cost debt
17Making Sugar since 1842 17
Agenda
Company Overview
Sugar Business ► World and Indian Sugar Balance► Closer look @ Sugar in South India► EID – Sugar Business
Bio Products Business► Nutraceuticals► Bio Pesticides
Consolidated Financials
18Making Sugar since 1842 18
TiruvallurChennai
Vellore
KanchipuramTiruvannamalai
Dharmapuri
VilupuramSalem
NamakkalErodeNilgiris
Kanyakumari
Tirunelveli Tuticorin
Ramanathapuram
Sivaganga
PudukkottaiDindigul
Madurai
Virudunagar
Teni
Thanjavur Tiruvarur
Cuddalore
Trichirappalli
Perambalur
Karur
Puduchery
Nagappattinum
Krishnagiri
Coimbatore
Bidar
Gulbarga
Bijapur
BagalkotBelgaum
Kappal
Raichur
Bellary
DharwadGadag
Uttar kannad Davengere
Shimoga
Udupi
Tumkur
KolarBangaloreChikmangalur
Hassan
Mandya
Mysore
Koorag
Chamrajnagar
Adllabad
Nizamabad Karimnagar
Chitoor
Khammam
SrikakulamVizianagaram
East Godavari
Warangal Vishakhapatnam
West Godavari
Guntur
MedakSangareddi
NalgondaRangareddi
Mahbubnagar
Ongole
NelloreCuddapah
Kurnool
Anantapur
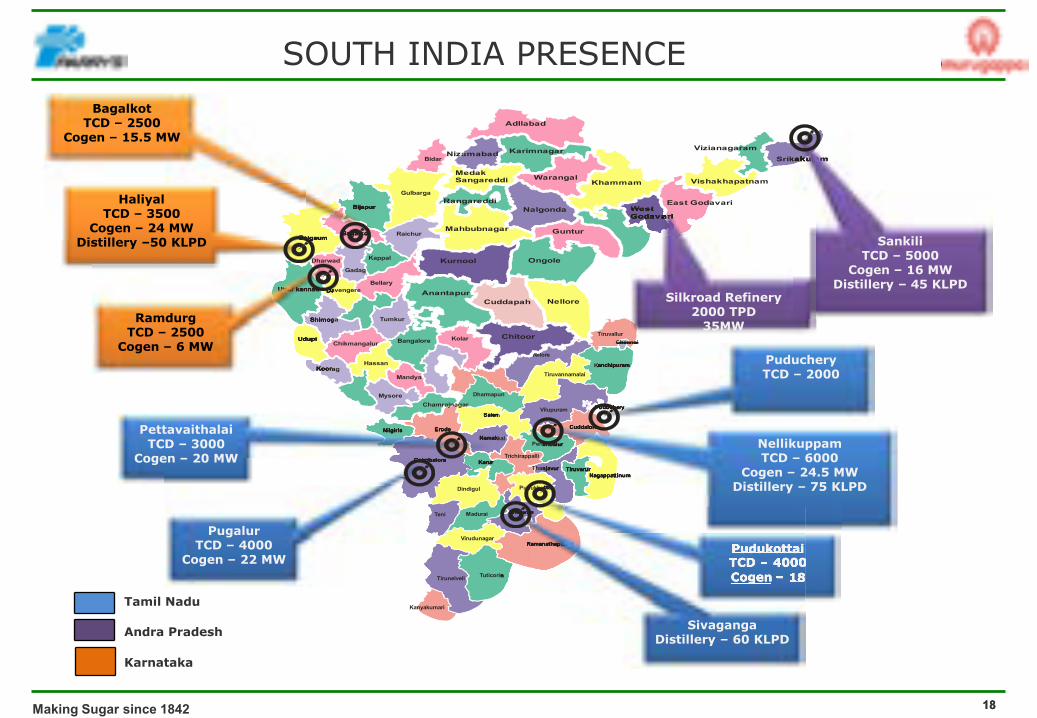
PugalurTCD – 4000
Cogen – 22 MW
Salem
NamakkalErodeNilgiris
KarurKarurCoimbatoreCoimbatoreCoimbatoreCoimbatore
PettavaithalaiTCD – 3000
Cogen – 20 MW
ChennaiChennaiChennaiChennaiChennai
Kanchipuram
PuducheryPuducheryPuduchery
PuducheryTCD – 2000
PudukkottaiPudukkottai
Thanjavur TiruvarurTiruvarurTiruvarurTiruvarur
Cuddalore
Perambalur
NagappattinumNagappattinumNagappattinum
NellikuppamTCD – 6000
Cogen – 24.5 MWDistillery – 75 KLPD
PudukottaiTCD – 4000Cogen – 18Tuticorin
Ramanathapuram
Sivaganga
Ramanathapuram
Sivaganga
PudukottaiTCD – 4000Cogen – 18
SivagangaDistillery – 60 KLPD
Uttar kannad DavengereDavengere
Shimoga
Udupi
KooragKooragKoorag
RamdurgTCD – 2500
Cogen – 6 MW
Bijapur
BagalkotBelgaum
BagalkotTCD – 2500
Cogen – 15.5 MW
BelgaumBelgaum
HaliyalTCD – 3500
Cogen – 24 MWDistillery –50 KLPD
SrikakulamSrikakulamSrikakulam
SankiliTCD – 5000
Cogen – 16 MWDistillery – 45 KLPD
West GodavariGodavariGodavariGodavariGodavari
Silkroad Refinery2000 TPD
35MW
Tamil Nadu
Andra Pradesh
Karnataka
SOUTH INDIA PRESENCE
19Making Sugar since 1842 19
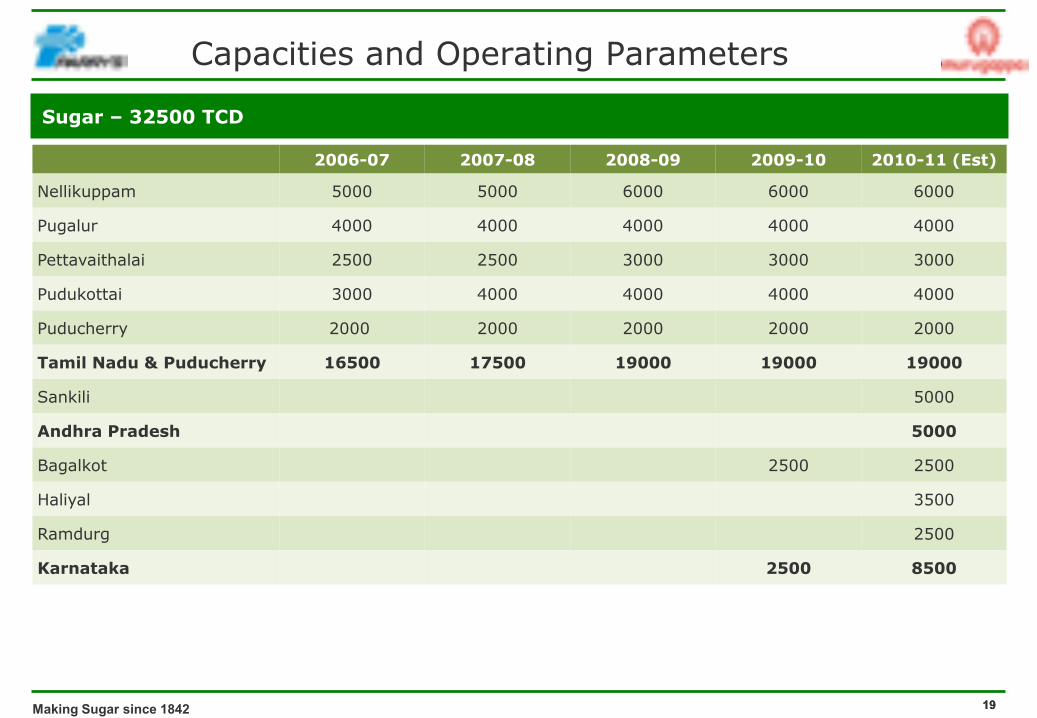
Sugar – 32500 TCD
2006-07 2007-08 2008-09 2009-10 2010-11 (Est)
Nellikuppam 5000 5000 6000 6000 6000
Pugalur 4000 4000 4000 4000 4000
Pettavaithalai 2500 2500 3000 3000 3000
Pudukottai 3000 4000 4000 4000 4000
Puducherry 2000 2000 2000 2000 2000
Tamil Nadu & Puducherry 16500 17500 19000 19000 19000
Sankili 5000
Andhra Pradesh 5000
Bagalkot 2500 2500
Haliyal 3500
Ramdurg 2500
Karnataka 2500 8500
Capacities and Operating Parameters
20Making Sugar since 1842 20
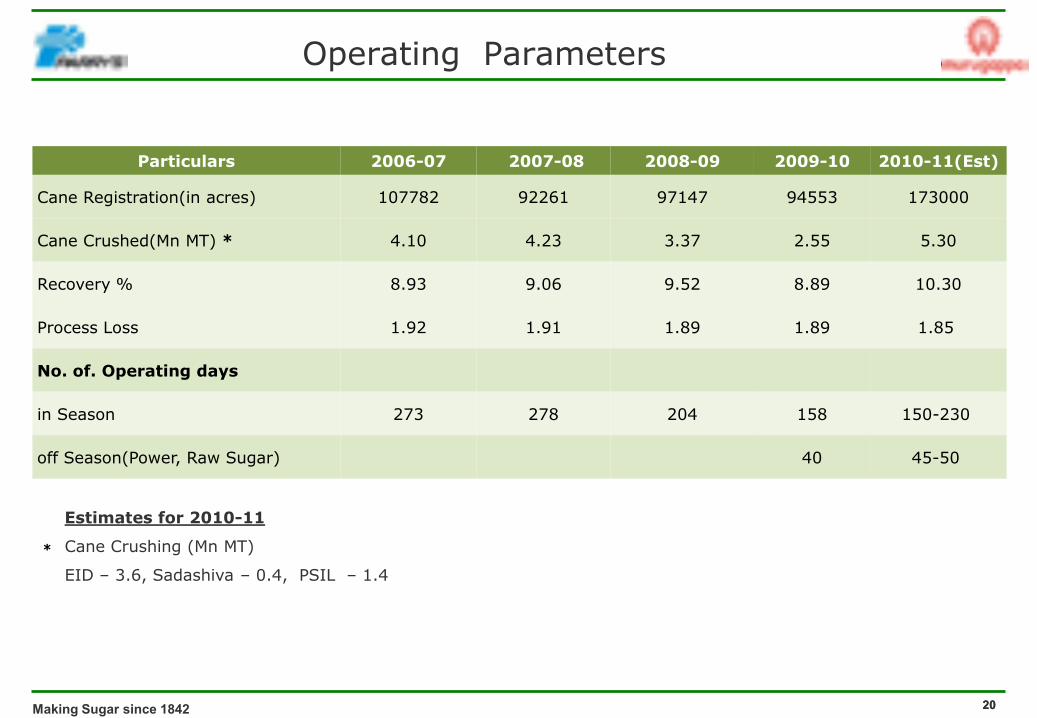
Particulars 2006-07 2007-08 2008-09 2009-10 2010-11(Est)
Cane Registration(in acres) 107782 92261 97147 94553 173000
Cane Crushed(Mn MT) * 4.10 4.23 3.37 2.55 5.30
Recovery % 8.93 9.06 9.52 8.89 10.30
Process Loss 1.92 1.91 1.89 1.89 1.85
No. of. Operating days
in Season 273 278 204 158 150-230
off Season(Power, Raw Sugar) 40 45-50
Estimates for 2010-11
Cane Crushing (Mn MT)
EID – 3.6, Sadashiva – 0.4, PSIL – 1.4
Operating Parameters
*
21Making Sugar since 1842 21
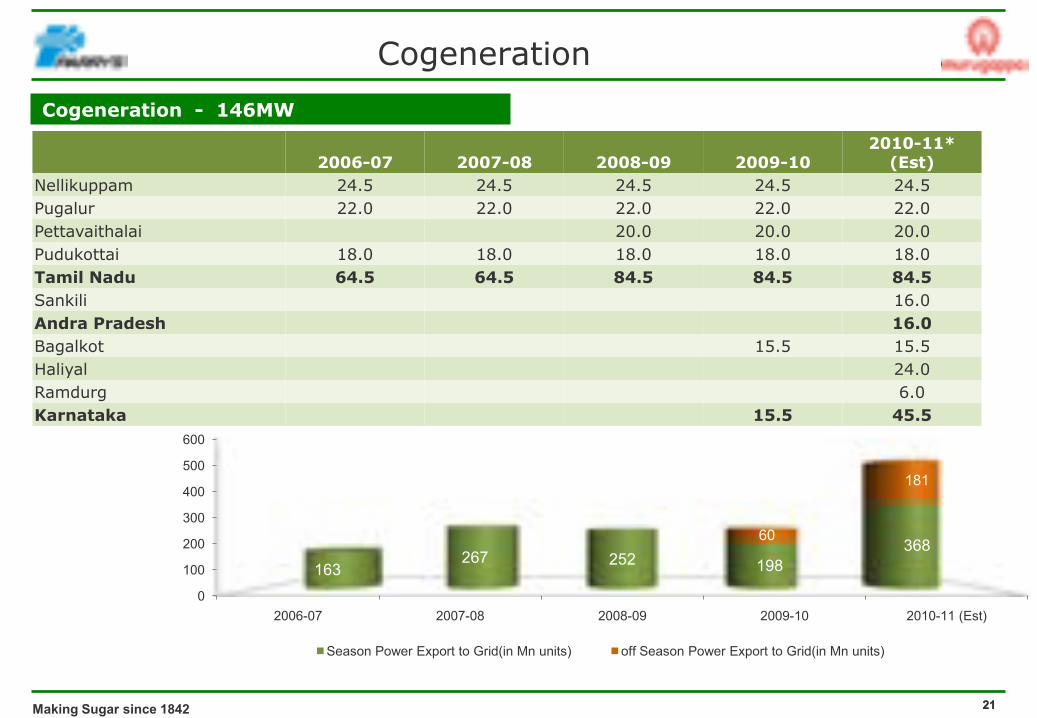
Cogeneration - 146MW
Cogeneration
2006-07 2007-08 2008-09 2009-102010-11*
(Est)Nellikuppam 24.5 24.5 24.5 24.5 24.5Pugalur 22.0 22.0 22.0 22.0 22.0Pettavaithalai 20.0 20.0 20.0Pudukottai 18.0 18.0 18.0 18.0 18.0Tamil Nadu 64.5 64.5 84.5 84.5 84.5Sankili 16.0Andra Pradesh 16.0Bagalkot 15.5 15.5Haliyal 24.0Ramdurg 6.0Karnataka 15.5 45.5
0
100
200
300
400
500
600
2006-07 2007-08 2008-09 2009-10 2010-11 (Est)
163267 252 198
36860
181
Season Power Export to Grid(in Mn units) off Season Power Export to Grid(in Mn units)
22Making Sugar since 1842 22
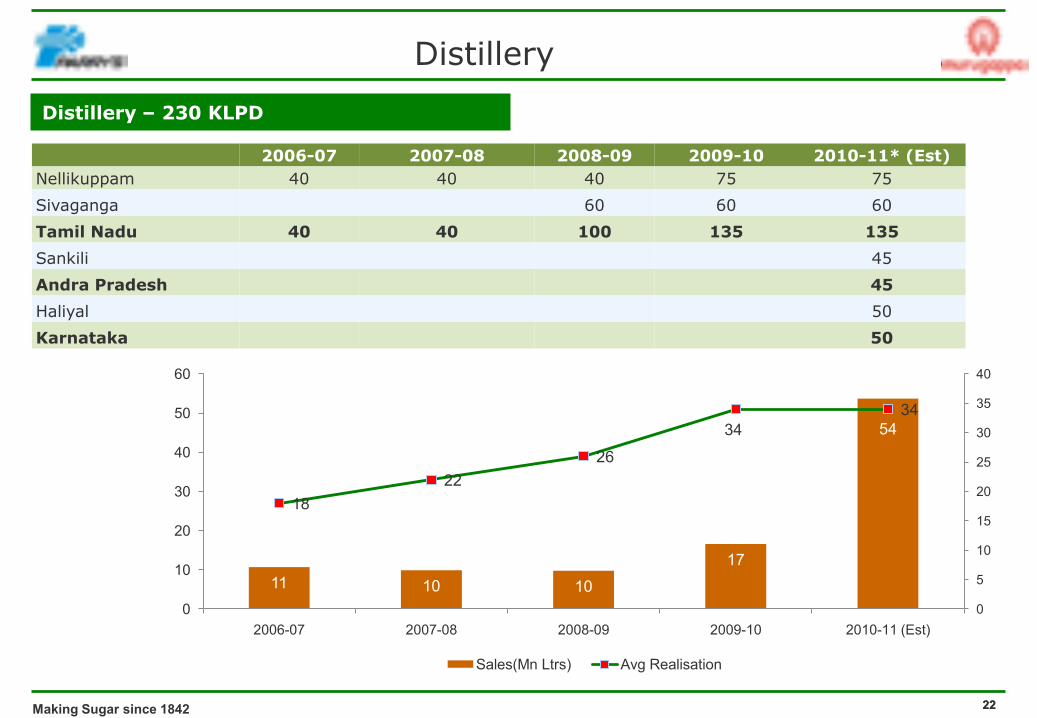
Distillery – 230 KLPD
Distillery
2006-07 2007-08 2008-09 2009-10 2010-11* (Est)Nellikuppam 40 40 40 75 75
Sivaganga 60 60 60
Tamil Nadu 40 40 100 135 135
Sankili 45
Andra Pradesh 45
Haliyal 50
Karnataka 50
11 10 1017
54
1822
2634
34
0
5
10
15
20
25
30
35
40
0
10
20
30
40
50
60
2006-07 2007-08 2008-09 2009-10 2010-11 (Est)
Sales(Mn Ltrs) Avg Realisation

23Making Sugar since 1842 23
52%
72%
79%
89%92%
40%
50%
60%
70%
80%
90%
100%
2006-07 2007-08 2008-09 2009-10 2010-11 E
22% 31%
69%
100%
0%
20%
40%
60%
80%
100%
120%
2007-08 2008-09 2009-10 2010-11 E
Level of Value Addition
Bagasse utilisation (%) for Value Addition
Molasses utilisation (%) for Value Addition
Bagasse to Power
Molasses to Alcohol
24Making Sugar since 1842 24
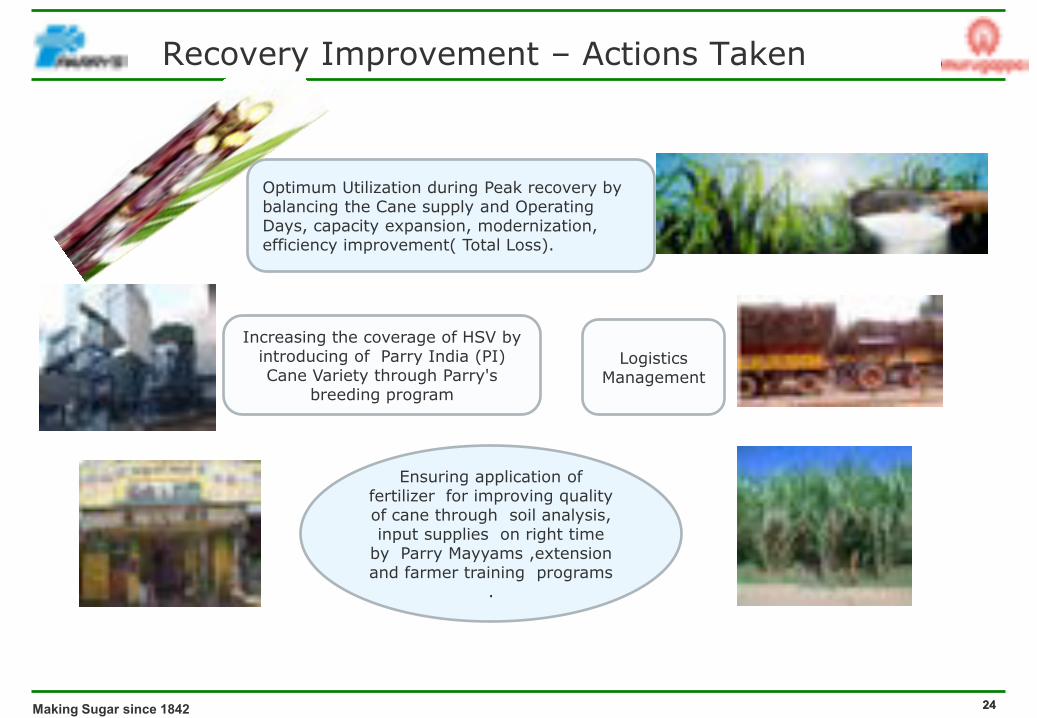
Increasing the coverage of HSV by introducing of Parry India (PI) Cane Variety through Parry's
breeding program
LogisticsManagement
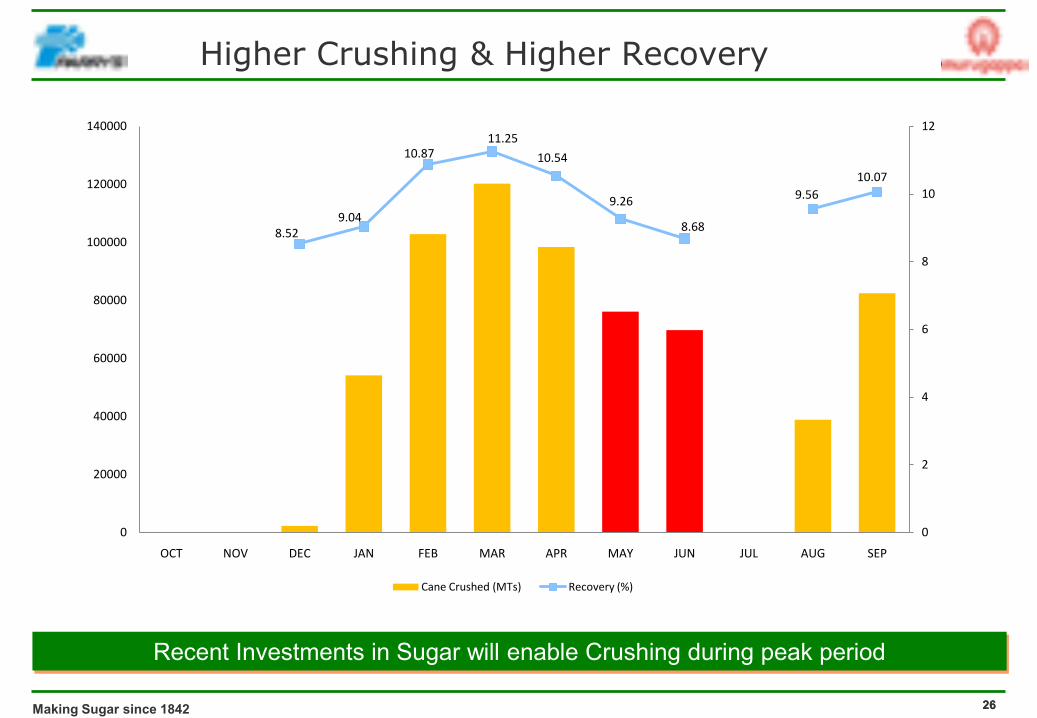
Optimum Utilization during Peak recovery by balancing the Cane supply and Operating Days, capacity expansion, modernization, efficiency improvement( Total Loss).
Ensuring application of fertilizer for improving quality of cane through soil analysis, input supplies on right time
by Parry Mayyams ,extension and farmer training programs
.
Recovery Improvement – Actions Taken
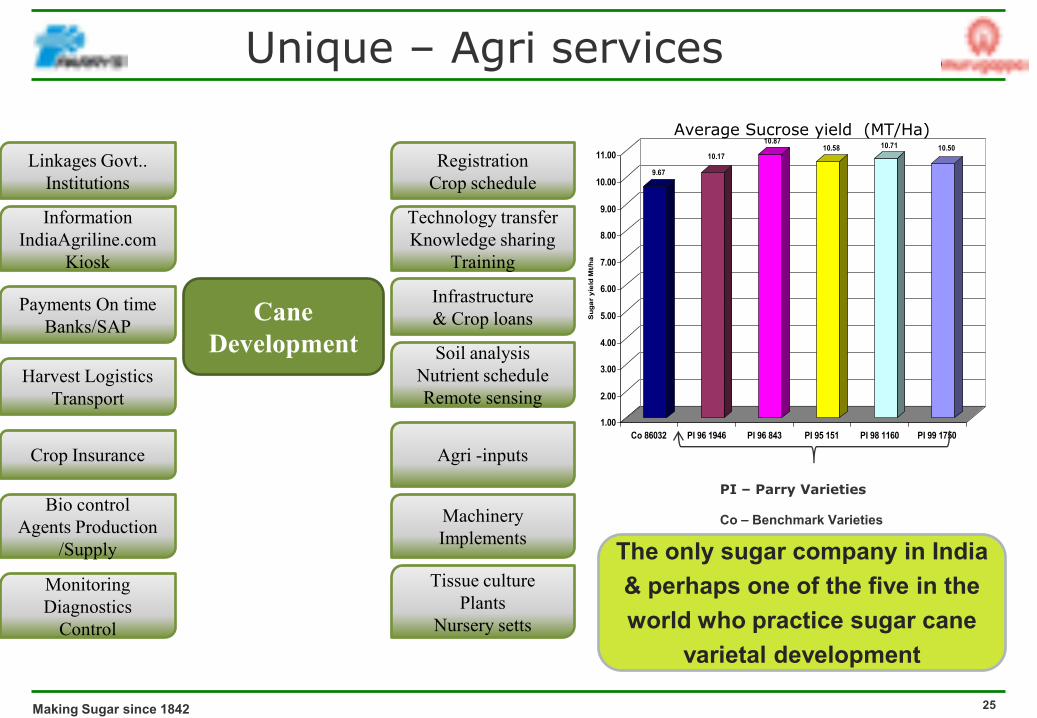
Unique – Agri services
Making Sugar since 1842 25
Cane Development
Linkages Govt..Institutions
Information IndiaAgriline.com
Kiosk
Payments On timeBanks/SAP
Harvest LogisticsTransport
Crop Insurance
Bio controlAgents Production
/Supply
MonitoringDiagnostics
Control
RegistrationCrop schedule
Technology transferKnowledge sharing
Training
Infrastructure& Crop loans
Soil analysisNutrient scheduleRemote sensing
Agri -inputs
MachineryImplements
Tissue culturePlants
Nursery setts
PI – Parry Varieties
Co – Benchmark Varieties
The only sugar company in India & perhaps one of the five in the world who practice sugar cane
varietal development
9.67
10.17
10.8710.58 10.71 10.50
1.00
2.00
3.00
4.00
5.00
6.00
7.00
8.00
9.00
10.00
11.00
Co 86032 PI 96 1946 PI 96 843 PI 95 151 PI 98 1160 PI 99 1750
Sug
ar y
ield
Mt/h
a
Average Sucrose yield (MT/Ha)
26Making Sugar since 1842 26
Higher Crushing & Higher Recovery
Recent Investments in Sugar will enable Crushing during peak period
8.529.04
10.8711.25
10.54
9.26
8.68
9.5610.07
0
2
4
6
8
10
12
0
20000
40000
60000
80000
100000
120000
140000
OCT NOV DEC JAN FEB MAR APR MAY JUN JUL AUG SEP
Cane Crushed (MTs) Recovery (%)
27Making Sugar since 1842 27
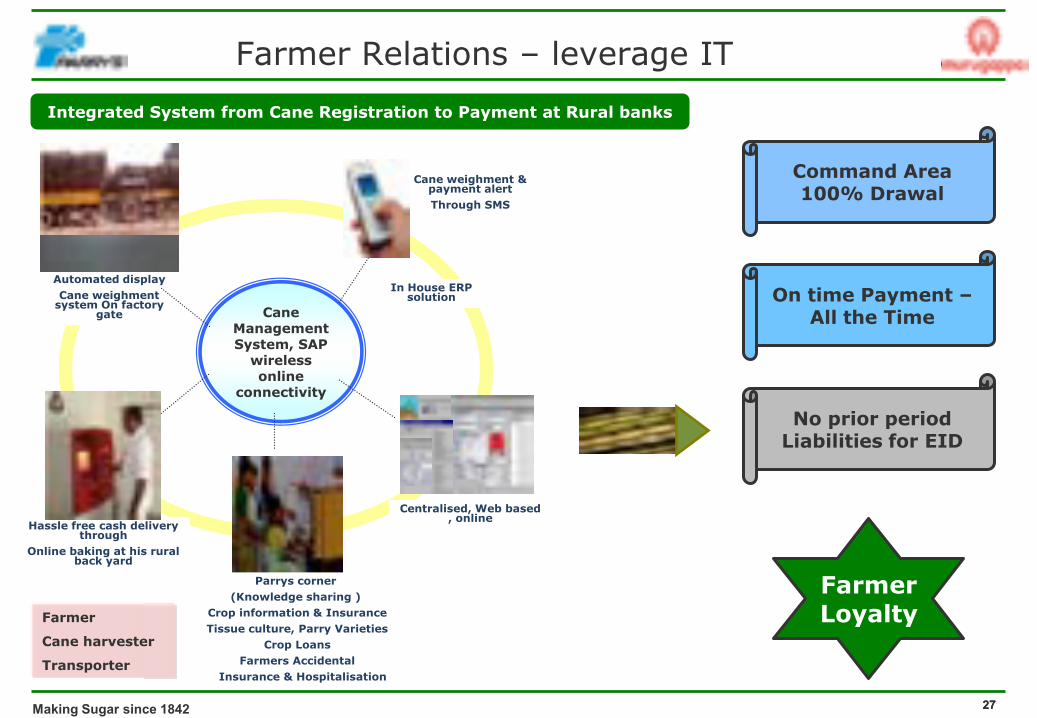
On time Payment –All the Time
Command Area100% Drawal
Cane weighment & payment alertThrough SMS
Integrated System from Cane Registration to Payment at Rural banks
No prior period Liabilities for EID
Farmer Loyalty
Parrys corner(Knowledge sharing )
Crop information & InsuranceTissue culture, Parry Varieties
Crop LoansFarmers Accidental
Insurance & Hospitalisation
Centralised, Web based , online
Automated display Cane weighment
system On factory gate
Hassle free cash delivery through
Online baking at his rural back yard
Cane Management System, SAP
wireless online
connectivity
In House ERP solution
Farmer
Cane harvester
Transporter
Farmer Relations – leverage IT
28Making Sugar since 1842 28
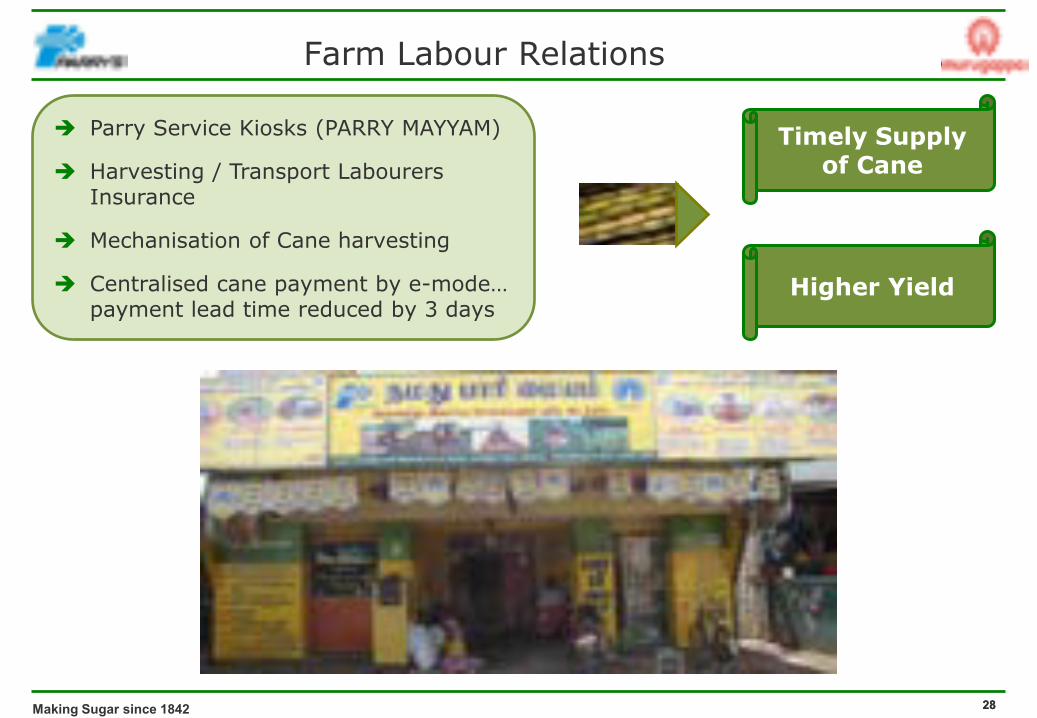
Parry Service Kiosks (PARRY MAYYAM)
Harvesting / Transport Labourers Insurance
Mechanisation of Cane harvesting
Centralised cane payment by e-mode… payment lead time reduced by 3 days
Higher Yield
Timely Supply of Cane
Farm Labour Relations
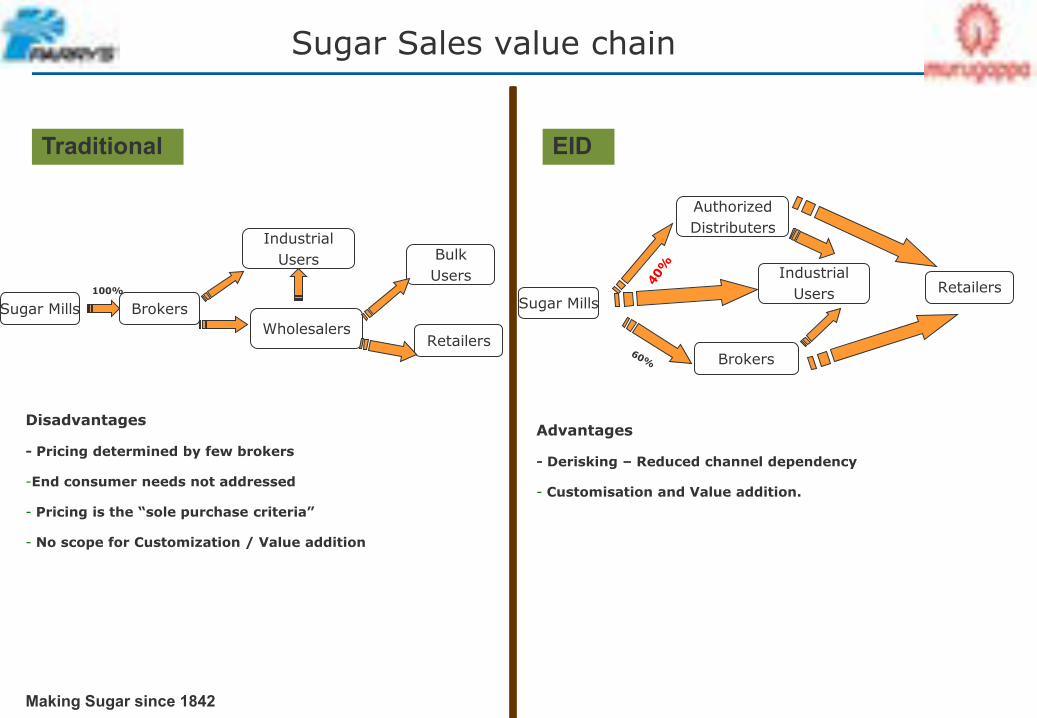
BrokersSugar Mills
Bulk Users
WholesalersRetailers
Industrial Users
Traditional
Disadvantages
- Pricing determined by few brokers
-End consumer needs not addressed
- Pricing is the “sole purchase criteria”
- No scope for Customization / Value addition
Brokers
Sugar Mills
EID
Sugar Sales value chain
Advantages
- Derisking – Reduced channel dependency
- Customisation and Value addition.
Authorized Distributers
Industrial Users Retailers100%
Making Sugar since 1842
Making Sugar since 1842 30
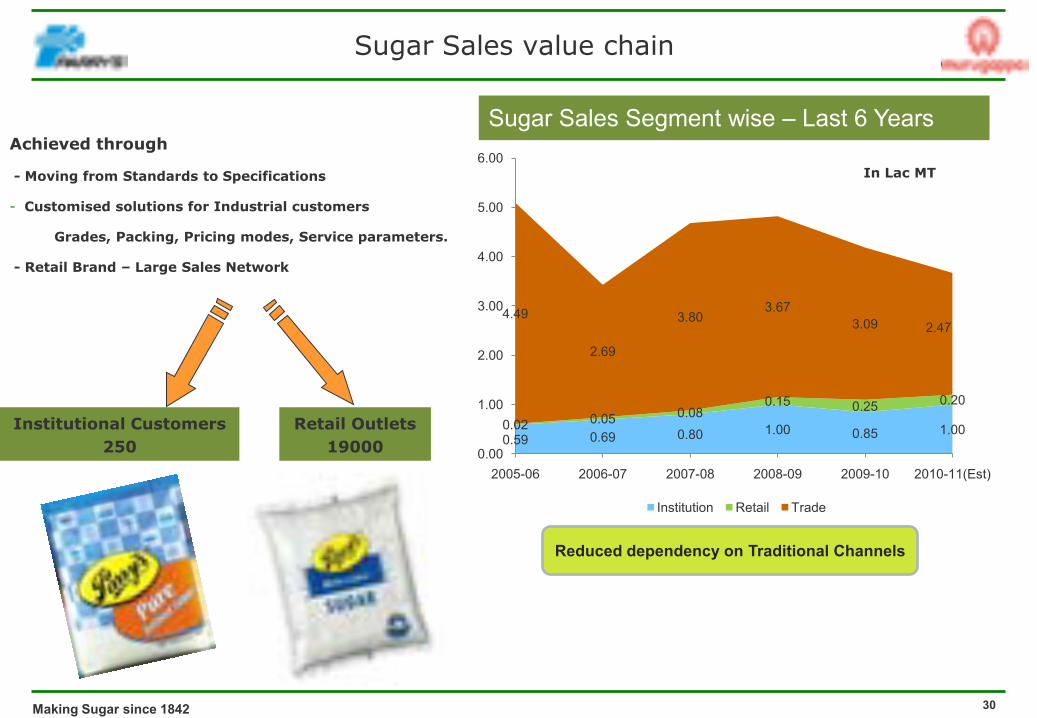
Sugar Sales Segment wise – Last 6 Years
Institutional Customers 250
Retail Outlets 19000
Achieved through
- Moving from Standards to Specifications
- Customised solutions for Industrial customers
Grades, Packing, Pricing modes, Service parameters.
- Retail Brand – Large Sales Network
Sugar Sales value chain
Reduced dependency on Traditional Channels
0.59 0.69 0.80 1.00 0.85 1.000.02 0.05 0.080.15 0.25 0.20
4.49
2.69
3.803.67
3.09 2.47
0.00
1.00
2.00
3.00
4.00
5.00
6.00
2005-06 2006-07 2007-08 2008-09 2009-10 2010-11(Est)
Institution Retail Trade
In Lac MT
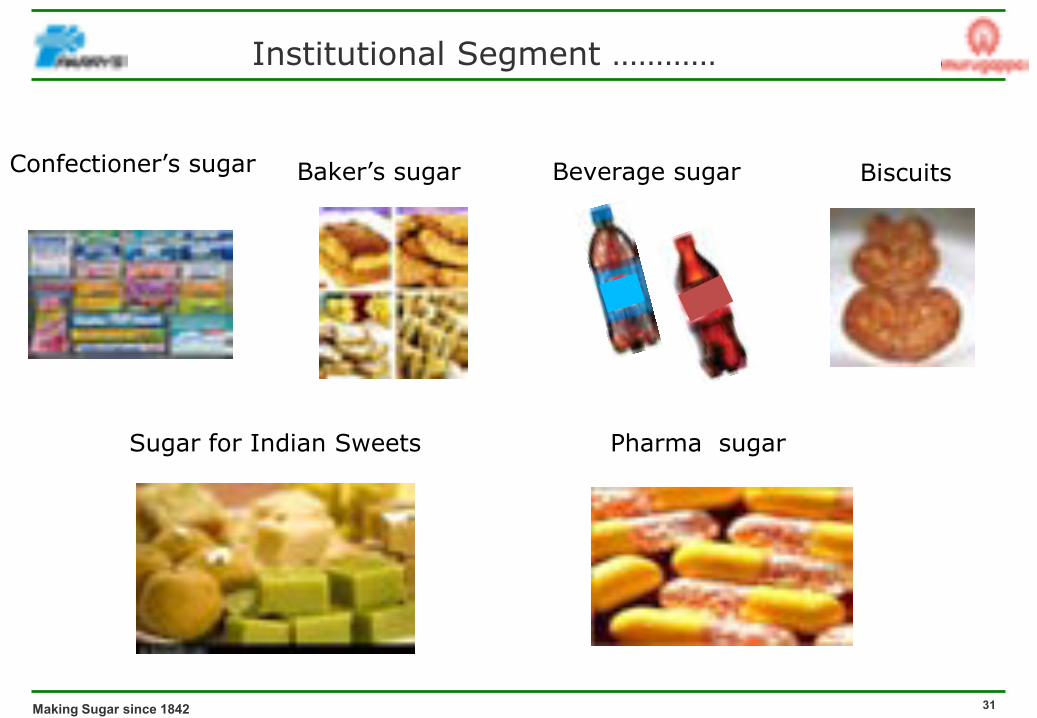
Institutional Segment …………
Making Sugar since 1842 31
Beverage sugarConfectioner’s sugar BiscuitsBaker’s sugar
Pharma sugarSugar for Indian Sweets
32Making Sugar since 1842 32
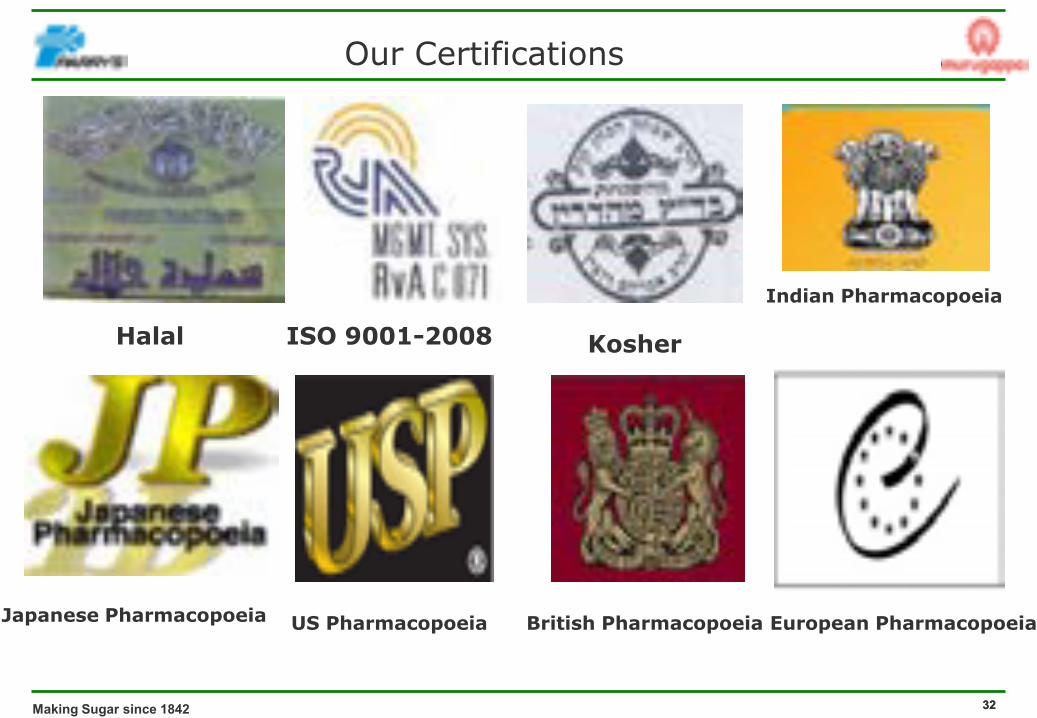
Halal
Indian Pharmacopoeia
Our Certifications
British Pharmacopoeia
Kosher
US Pharmacopoeia
ISO 9001-2008
Japanese Pharmacopoeia European Pharmacopoeia
33Making Sugar since 1842 33
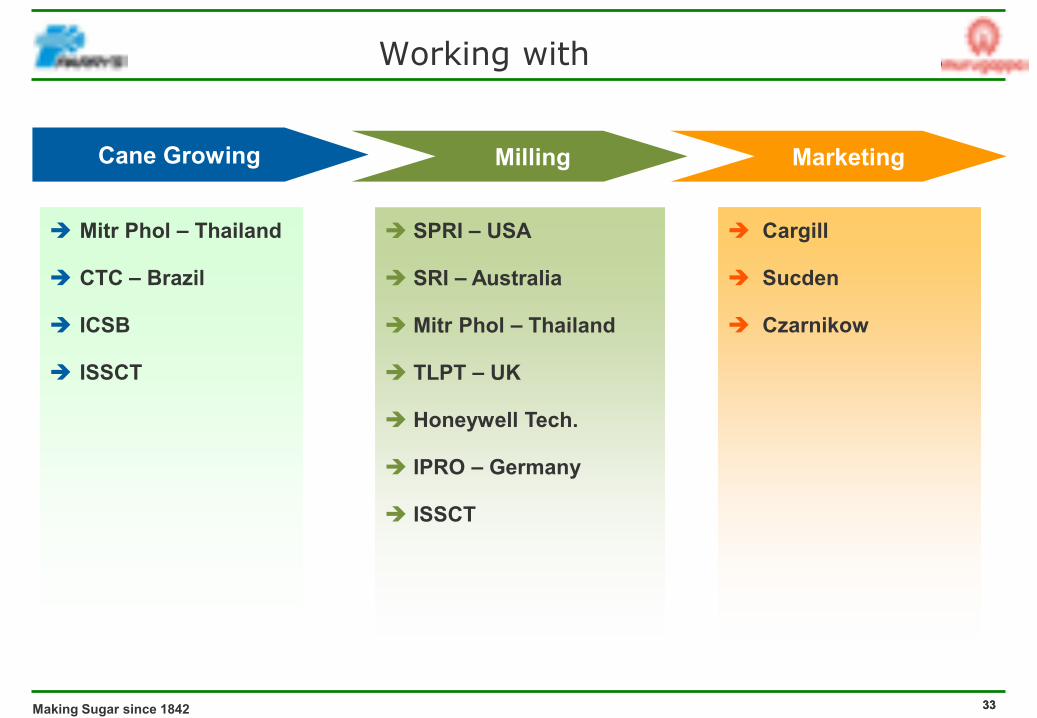
SPRI – USA
SRI – Australia
Mitr Phol – Thailand
TLPT – UK
Honeywell Tech.
IPRO – Germany
ISSCT
Mitr Phol – Thailand
CTC – Brazil
ICSB
ISSCT
Milling MarketingCane Growing
Cargill
Sucden
Czarnikow
Working with
34Making Sugar since 1842 34
REACHING OUT BEYOND TRADITIONAL FRONTIERS………..
Silkroad Sugar… An Innovative Business Model
35Making Sugar since 1842 35
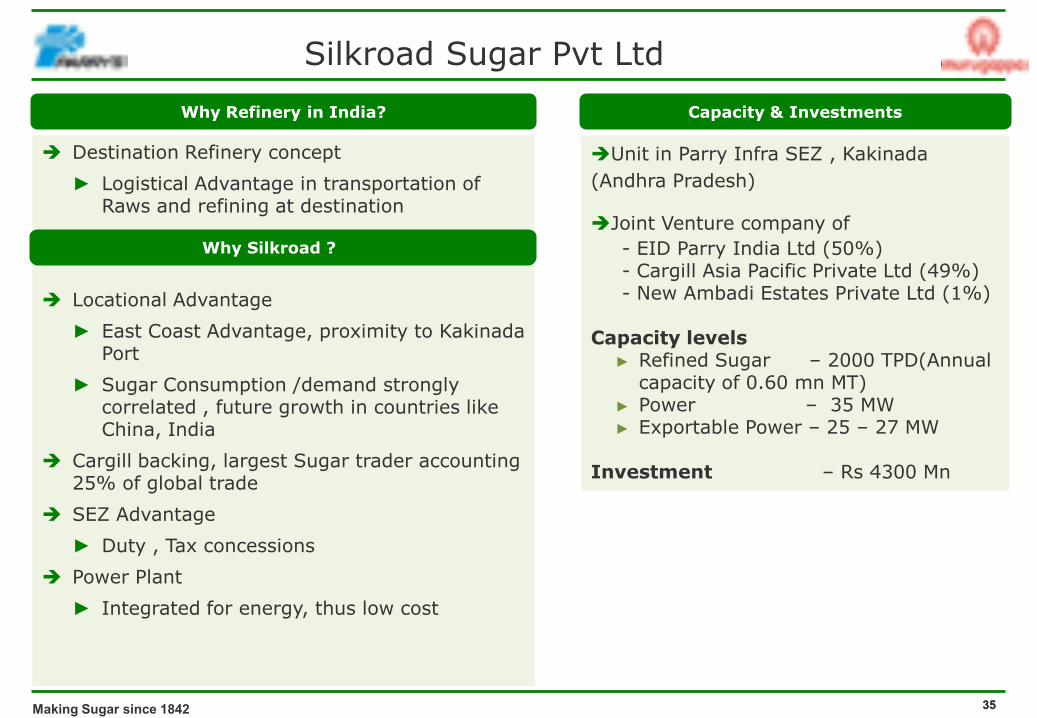
Destination Refinery concept
► Logistical Advantage in transportation of Raws and refining at destination
Locational Advantage
► East Coast Advantage, proximity to Kakinada Port
► Sugar Consumption /demand strongly correlated , future growth in countries like China, India
Cargill backing, largest Sugar trader accounting 25% of global trade
SEZ Advantage
► Duty , Tax concessions
Power Plant
► Integrated for energy, thus low cost
Silkroad Sugar Pvt Ltd
Unit in Parry Infra SEZ , Kakinada (Andhra Pradesh)
Joint Venture company of - EID Parry India Ltd (50%)- Cargill Asia Pacific Private Ltd (49%) - New Ambadi Estates Private Ltd (1%)
Capacity levels► Refined Sugar – 2000 TPD(Annual
capacity of 0.60 mn MT)► Power – 35 MW► Exportable Power – 25 – 27 MW
Investment – Rs 4300 Mn
Why Refinery in India? Capacity & Investments
Why Silkroad ?
Making Sugar since 1842 36
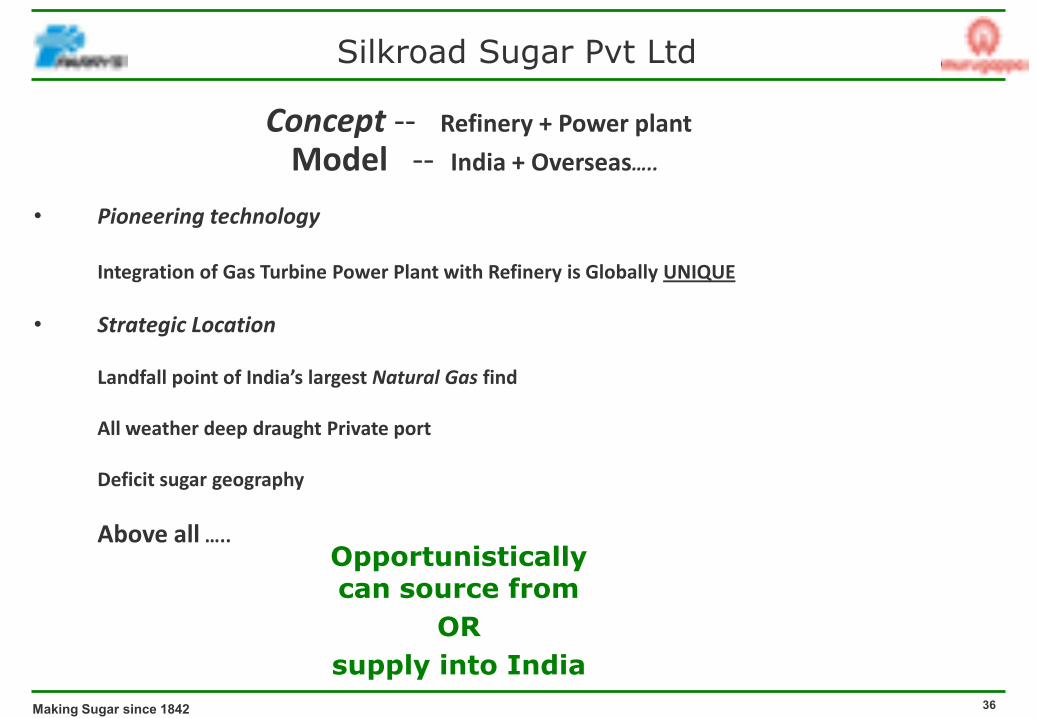
Concept -- Refinery + Power plant
Model -- India + Overseas…..
• Pioneering technology
Integration of Gas Turbine Power Plant with Refinery is Globally UNIQUE
• Strategic Location
Landfall point of India’s largest Natural Gas find
All weather deep draught Private port
Deficit sugar geography
Above all …..
Silkroad Sugar Pvt Ltd
Opportunistically can source from
OR supply into India
37
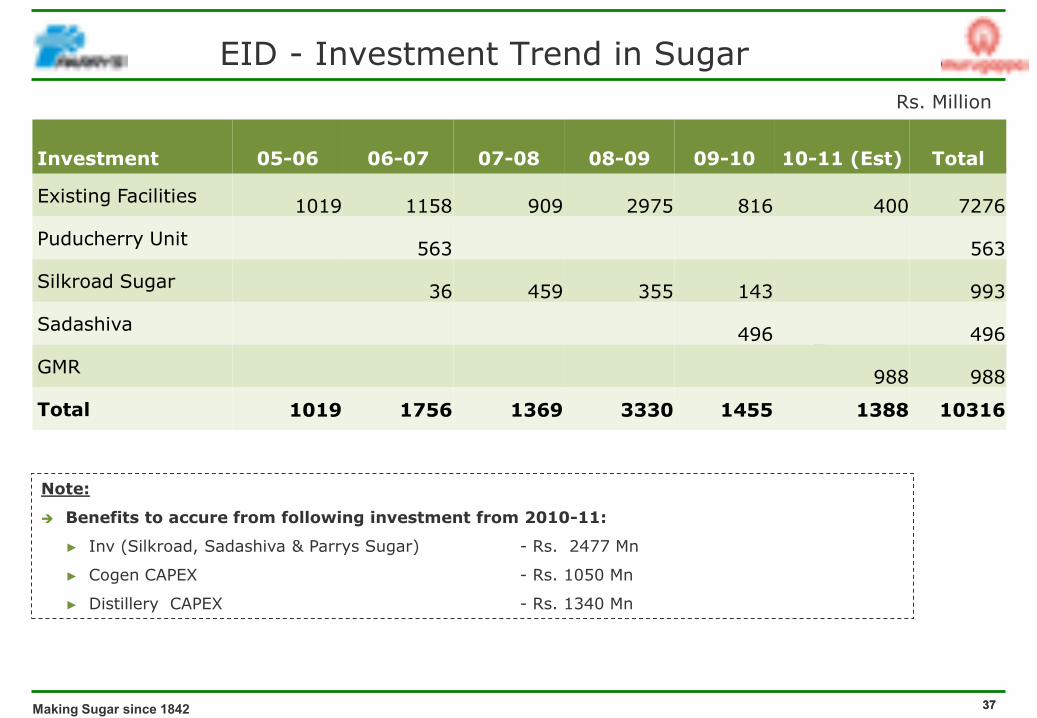
EID - Investment Trend in Sugar
Making Sugar since 1842 37
Rs. Million
Note:
Benefits to accure from following investment from 2010-11:
► Inv (Silkroad, Sadashiva & Parrys Sugar) - Rs. 2477 Mn
► Cogen CAPEX - Rs. 1050 Mn
► Distillery CAPEX - Rs. 1340 Mn
Investment 05-06 06-07 07-08 08-09 09-10 10-11 (Est) Total
Existing Facilities 1019 1158 909 2975 816 400 7276
Puducherry Unit 563 563
Silkroad Sugar 36 459 355 143 993
Sadashiva 496 496
GMR 988 988
Total 1019 1756 1369 3330 1455 1388 10316
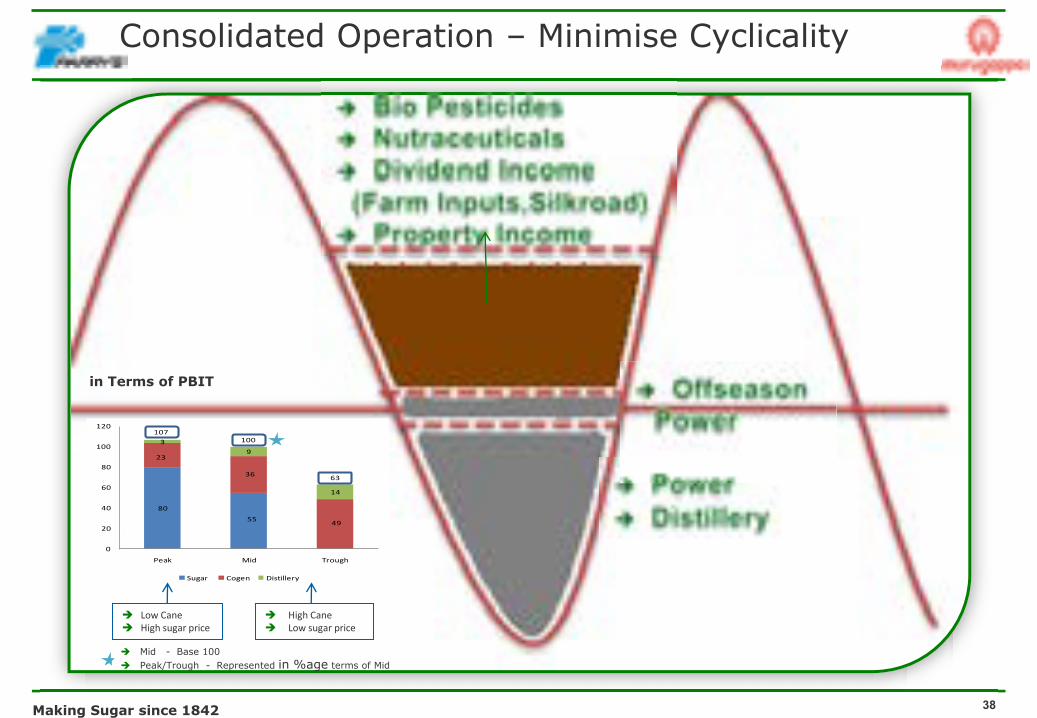
Low Cane High sugar price
Mid - Base 100 Peak/Trough - Represented in %age terms of Mid
80
55
23
36
49
39
14
0
20
40
60
80
100
120
Peak Mid Trough
Sugar Cogen Distillery
107100
63
Consolidated Operation – Minimise Cyclicality
High Cane Low sugar price
38Making Sugar since 1842
in Terms of PBIT
39
Agenda
Making Sugar since 1842 39
Company Overview
Sugar Business
► World and Indian Sugar Balance
► Closer look @ Sugar in South India
► EID – Sugar Business
Bio Products Business
► Nutraceuticals
► Bio Pesticides
Consolidated Financials
40
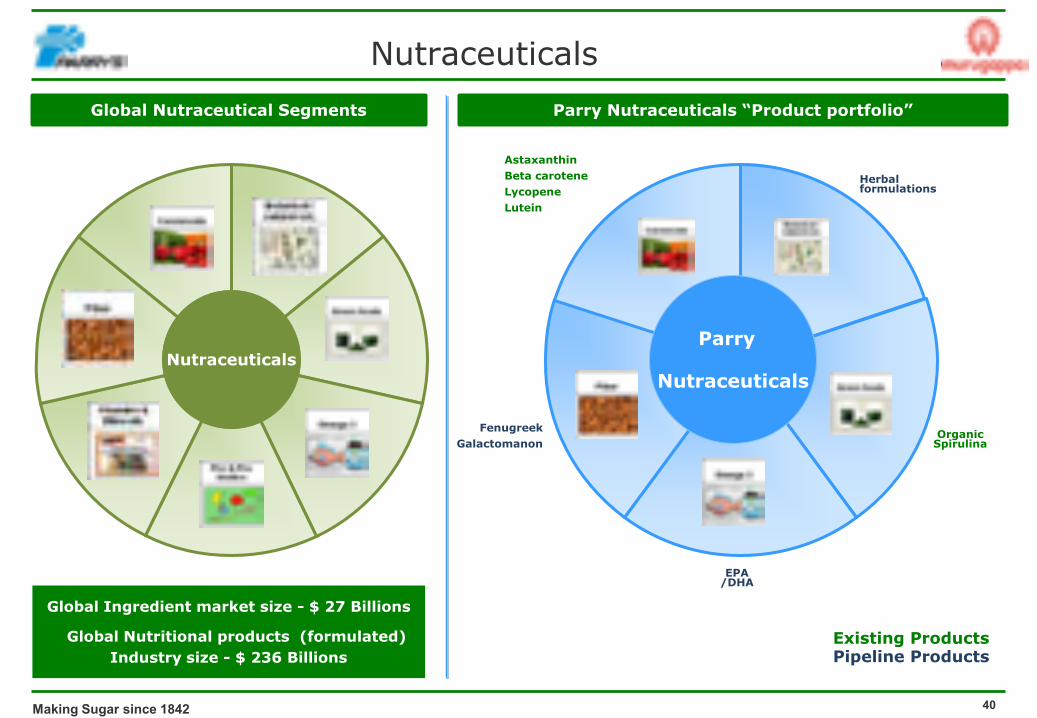
NutraceuticalsGlobal Nutraceutical Segments Parry Nutraceuticals “Product portfolio”
NutraceuticalsParry
Nutraceuticals
Herbal formulations
Organic Spirulina
AstaxanthinBeta caroteneLycopeneLutein
EPA /DHA
FenugreekGalactomanon
Existing ProductsPipeline Products
Global Ingredient market size - $ 27 Billions
Global Nutritional products (formulated) Industry size - $ 236 Billions
Making Sugar since 1842
41
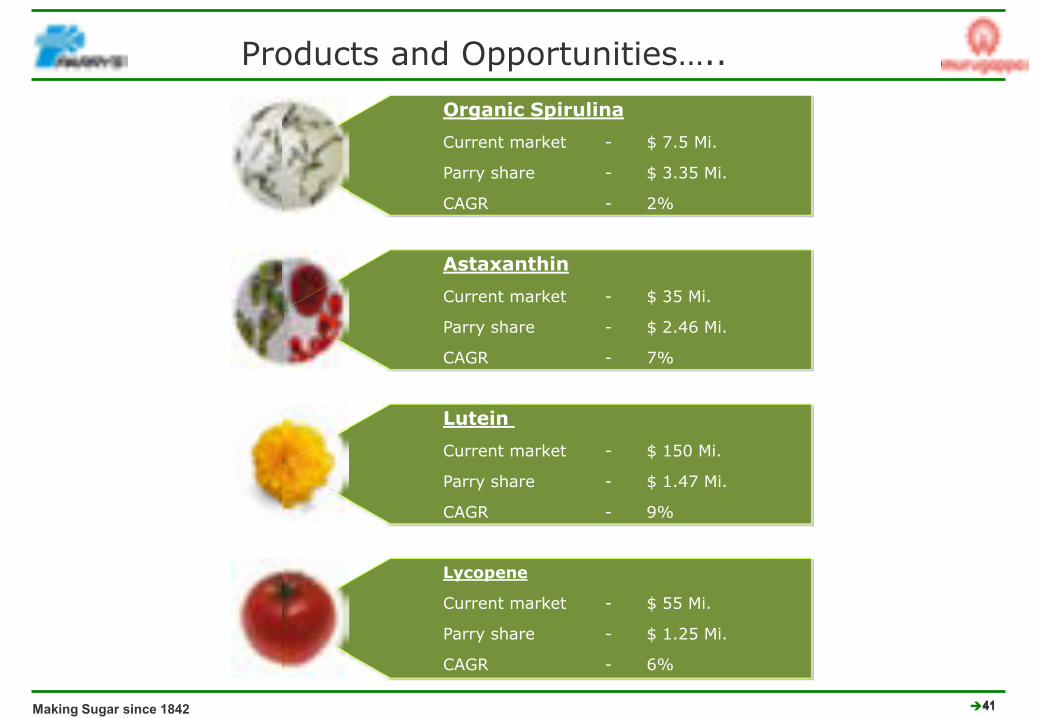
Products and Opportunities…..
Making Sugar since 1842 41
Organic Spirulina
Current market - $ 7.5 Mi.
Parry share - $ 3.35 Mi.
CAGR - 2%
Astaxanthin
Current market - $ 35 Mi.
Parry share - $ 2.46 Mi.
CAGR - 7%
Lutein
Current market - $ 150 Mi.
Parry share - $ 1.47 Mi.
CAGR - 9%
Lycopene
Current market - $ 55 Mi.
Parry share - $ 1.25 Mi.
CAGR - 6%
42
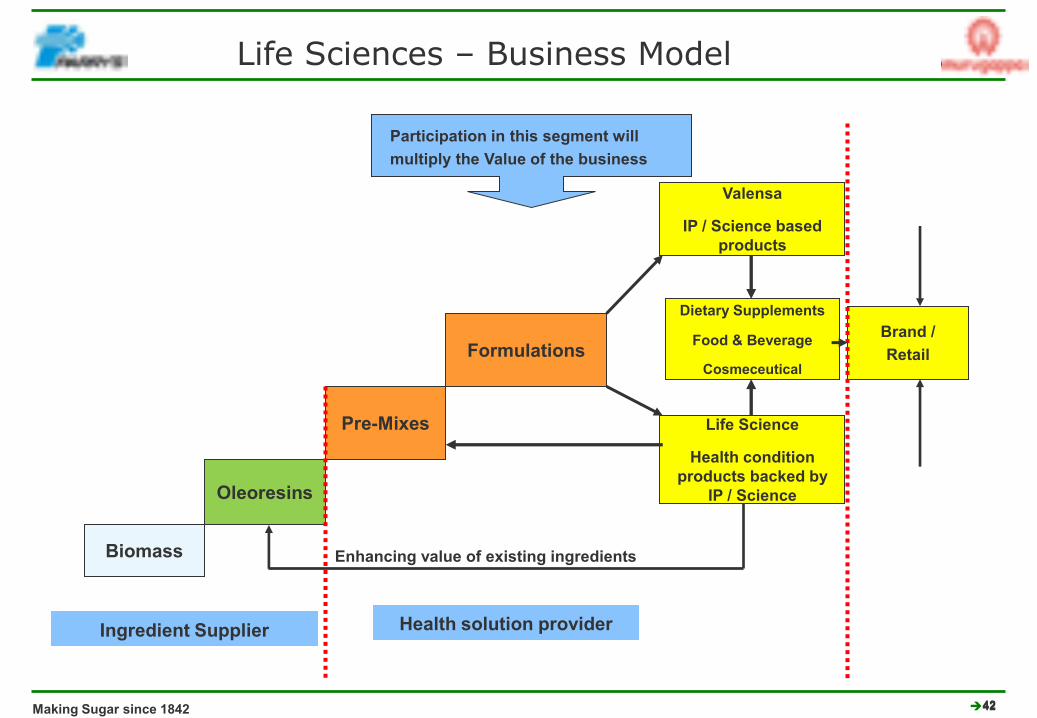
Life Sciences – Business Model
Making Sugar since 1842 42
Biomass
Oleoresins
Pre-Mixes
Formulations
Ingredient Supplier
Valensa
IP / Science based products
Life Science
Health condition products backed by
IP / Science
Enhancing value of existing ingredients
Dietary Supplements
Food & Beverage
Cosmeceutical
Brand / Retail
Health solution provider
Participation in this segment will multiply the Value of the business
43
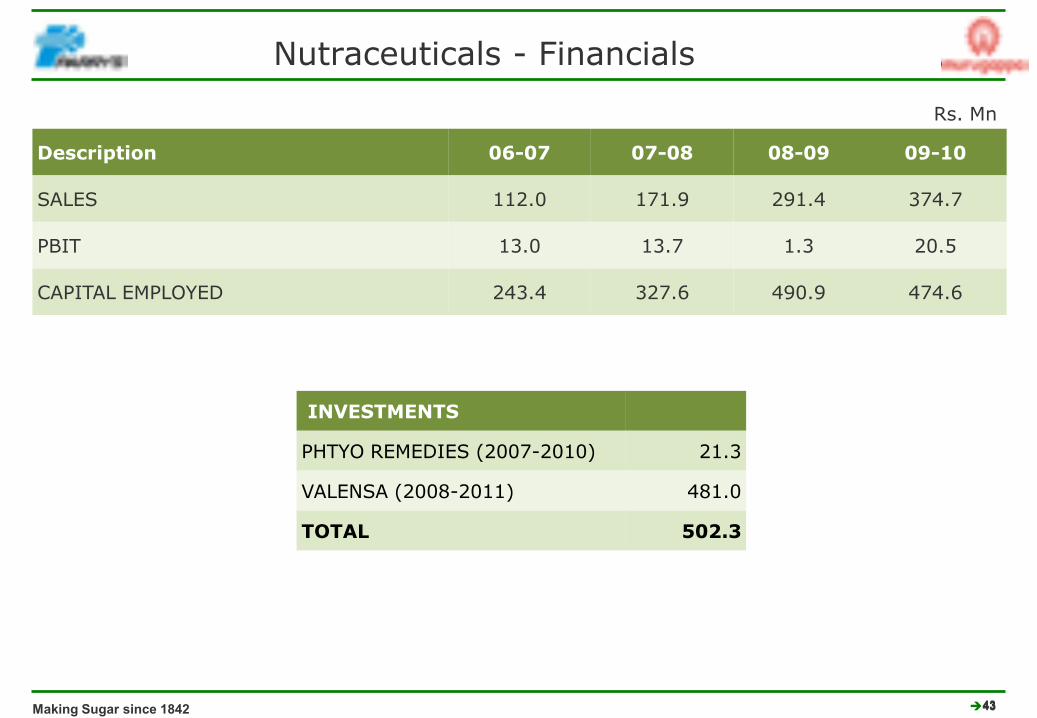
Nutraceuticals - Financials
Making Sugar since 1842 43
Description 06-07 07-08 08-09 09-10
SALES 112.0 171.9 291.4 374.7
PBIT 13.0 13.7 1.3 20.5
CAPITAL EMPLOYED 243.4 327.6 490.9 474.6
INVESTMENTS
PHTYO REMEDIES (2007-2010) 21.3
VALENSA (2008-2011) 481.0
TOTAL 502.3
Rs. Mn
44
Agenda
Making Sugar since 1842 44
Company Overview
Sugar Business
► World and Indian Sugar Balance
► Closer look @ Sugar in South India
► EID – Sugar Business
Bio Products Business
► Nutraceuticals
► Bio Pesticides
Consolidated Financials
45Making Sugar since 1842 45
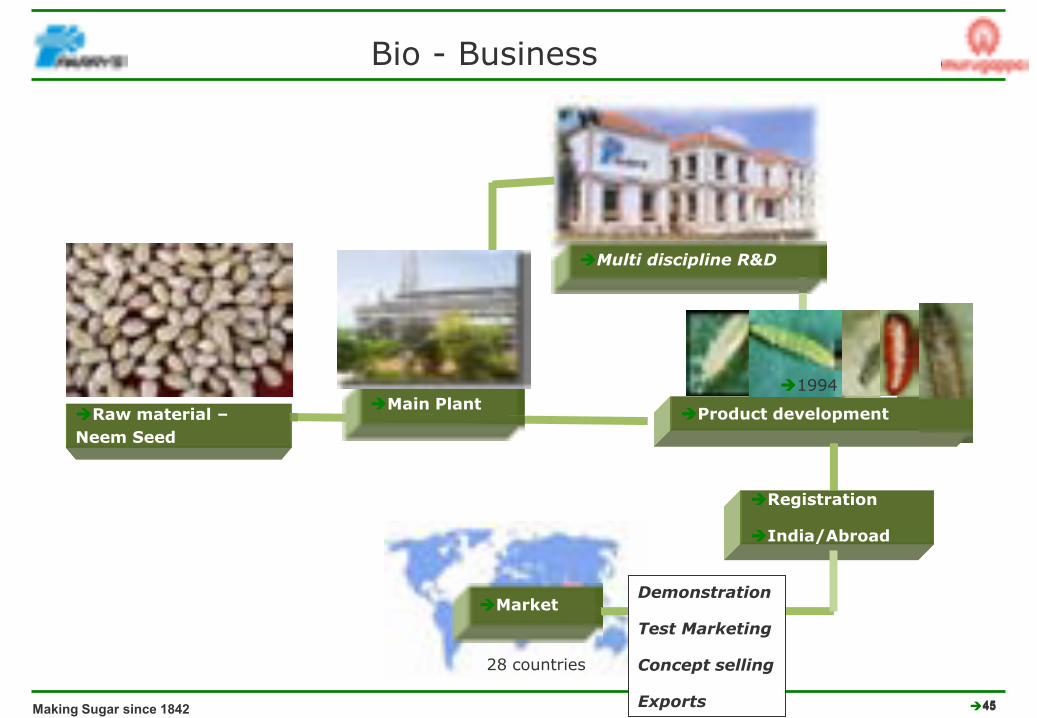
Multi discipline R&D
Product development
Registration
India/Abroad
Raw material –Neem Seed
MarketDemonstration
Test Marketing
Concept selling
Exports
1994
28 countries
Main Plant
Bio - Business
46Making Sugar since 1842 46
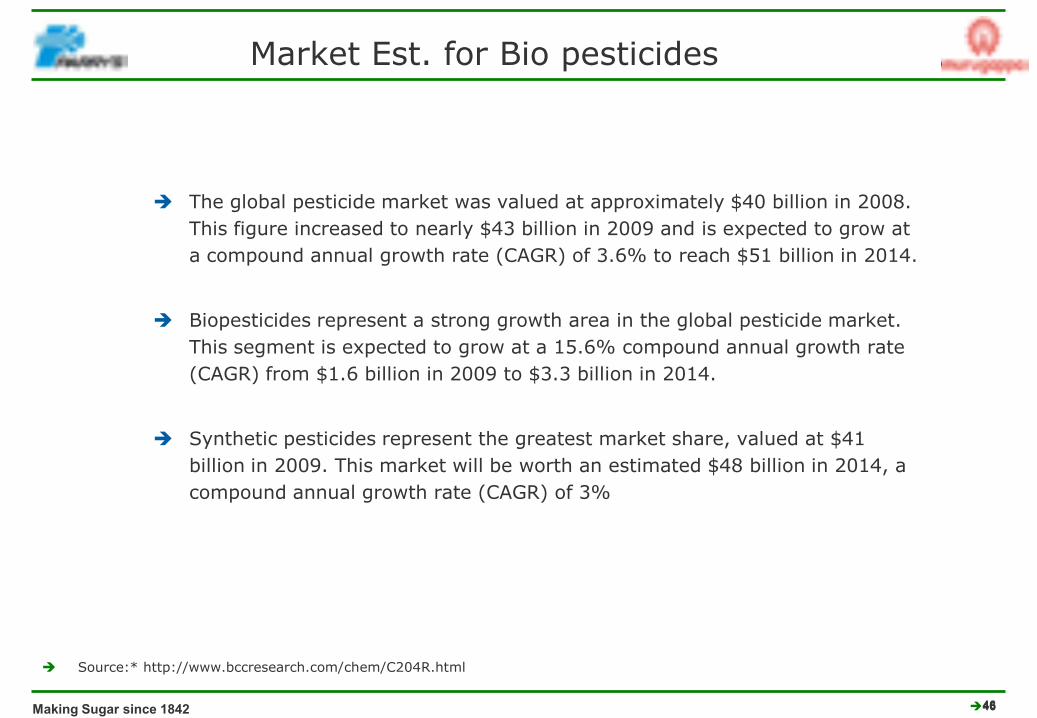
Market Est. for Bio pesticides
The global pesticide market was valued at approximately $40 billion in 2008. This figure increased to nearly $43 billion in 2009 and is expected to grow at a compound annual growth rate (CAGR) of 3.6% to reach $51 billion in 2014.
Biopesticides represent a strong growth area in the global pesticide market. This segment is expected to grow at a 15.6% compound annual growth rate (CAGR) from $1.6 billion in 2009 to $3.3 billion in 2014.
Synthetic pesticides represent the greatest market share, valued at $41 billion in 2009. This market will be worth an estimated $48 billion in 2014, a compound annual growth rate (CAGR) of 3%
Source:* http://www.bccresearch.com/chem/C204R.html
47Making Sugar since 1842 47
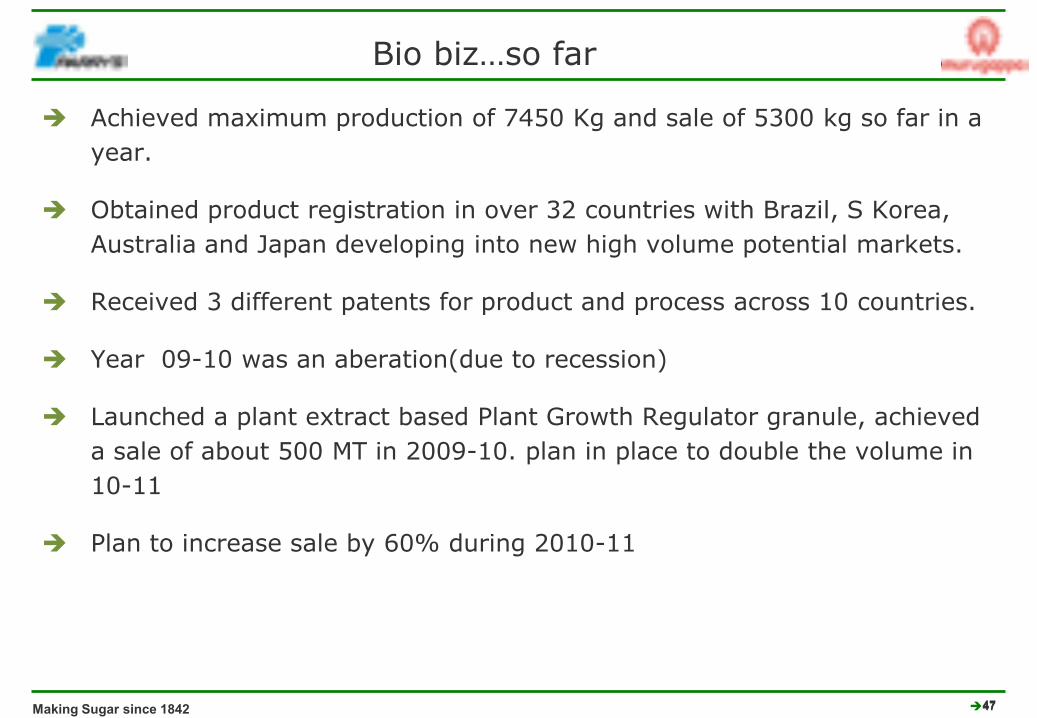
Bio biz…so far
Achieved maximum production of 7450 Kg and sale of 5300 kg so far in a year.
Obtained product registration in over 32 countries with Brazil, S Korea, Australia and Japan developing into new high volume potential markets.
Received 3 different patents for product and process across 10 countries.
Year 09-10 was an aberation(due to recession)
Launched a plant extract based Plant Growth Regulator granule, achieved a sale of about 500 MT in 2009-10. plan in place to double the volume in 10-11
Plan to increase sale by 60% during 2010-11
48Making Sugar since 1842 48
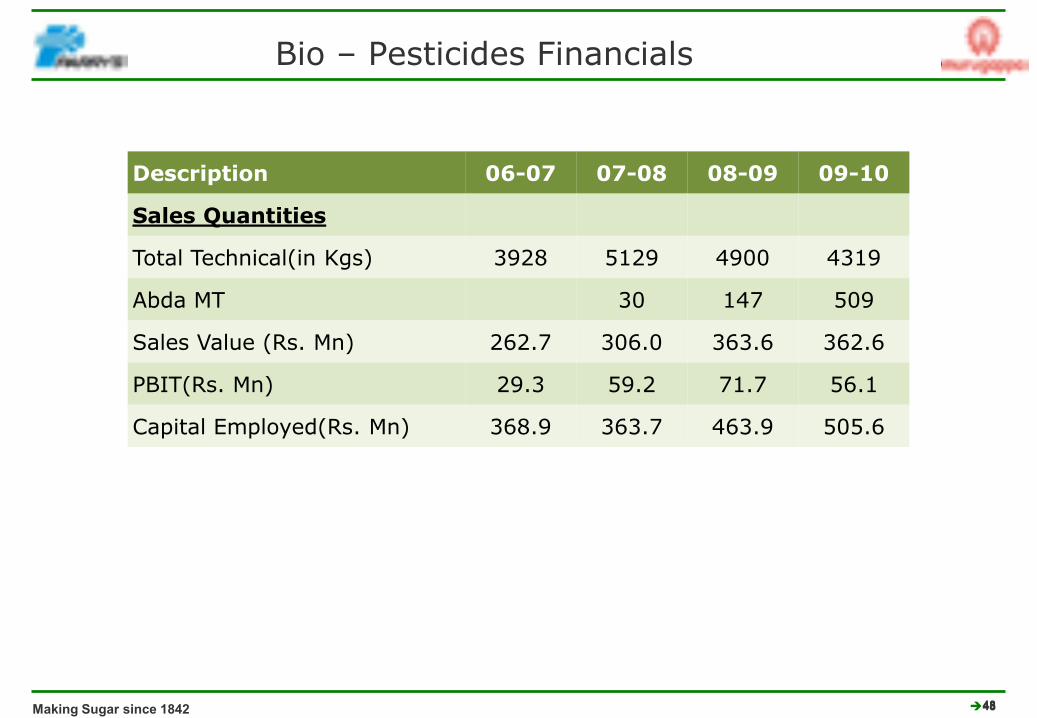
Description 06-07 07-08 08-09 09-10
Sales Quantities
Total Technical(in Kgs) 3928 5129 4900 4319
Abda MT 30 147 509
Sales Value (Rs. Mn) 262.7 306.0 363.6 362.6
PBIT(Rs. Mn) 29.3 59.2 71.7 56.1
Capital Employed(Rs. Mn) 368.9 363.7 463.9 505.6
Bio – Pesticides Financials
49
Agenda
Making Sugar since 1842 49
Company Overview
Sugar Business ► World and Indian Sugar Balance► Closer look @ Sugar in South India► EID – Sugar Business
Bio Products Business► Nutraceuticals► Bio Pesticides
Consolidated Financials
50Making Sugar since 1842 50
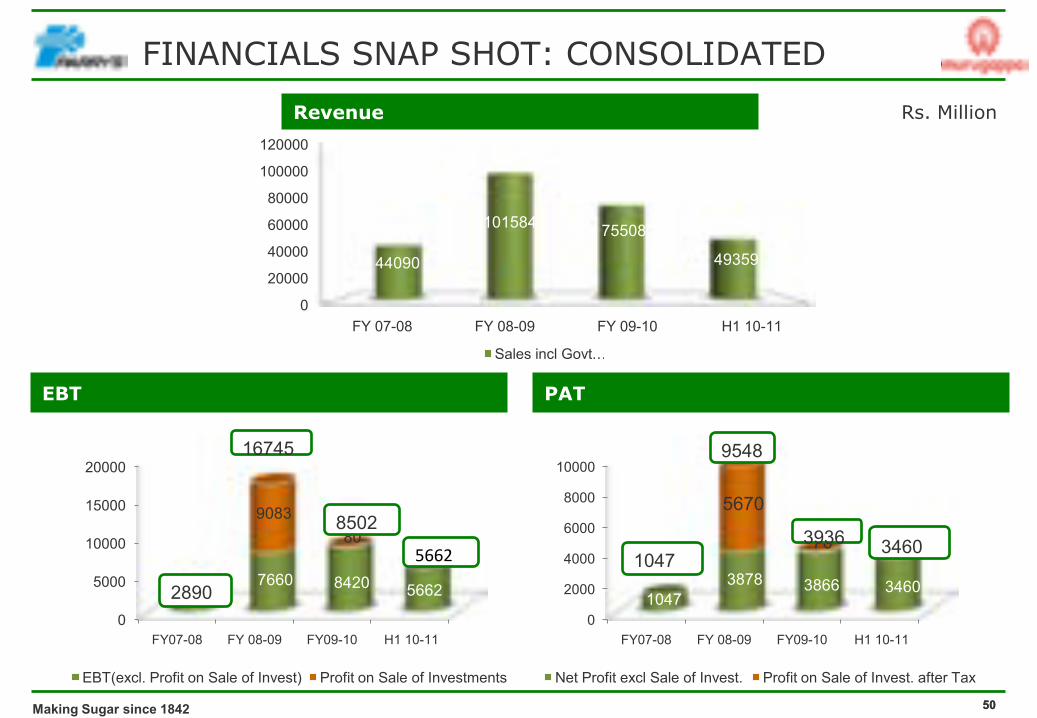
FINANCIALS SNAP SHOT: CONSOLIDATED
Revenue
EBT PAT
Rs. Million
0
20000
40000
60000
80000
100000
120000
FY 07-08 FY 08-09 FY 09-10 H1 10-11
44090
101584 75508
49359
Sales incl Govt. …
0
5000
10000
15000
20000
FY07-08 FY 08-09 FY09-10 H1 10-11
28907660 8420 5662
908380
EBT(excl. Profit on Sale of Invest) Profit on Sale of Investments
16745
8502
2890
5662
0
2000
4000
6000
8000
10000
FY07-08 FY 08-09 FY09-10 H1 10-11
10473878 3866 3460
5670
70
Net Profit excl Sale of Invest. Profit on Sale of Invest. after Tax
9548
39361047
3460
51Making Sugar since 1842 51
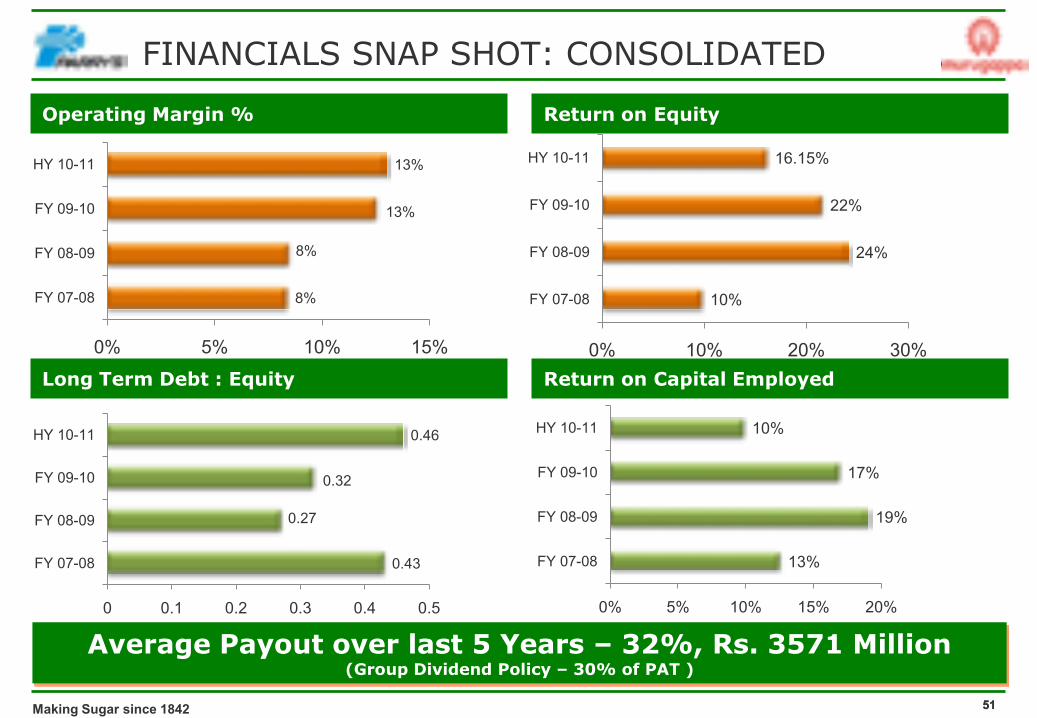
Average Payout over last 5 Years – 32%, Rs. 3571 Million(Group Dividend Policy – 30% of PAT )
Operating Margin % Return on Equity
Long Term Debt : Equity Return on Capital Employed
FINANCIALS SNAP SHOT: CONSOLIDATED
10%
24%
22%
16.15%
0% 10% 20% 30%
FY 07-08
FY 08-09
FY 09-10
HY 10-11
8%
8%
13%
13%
0% 5% 10% 15%
FY 07-08
FY 08-09
FY 09-10
HY 10-11
0.43
0.27
0.32
0.46
0 0.1 0.2 0.3 0.4 0.5
FY 07-08
FY 08-09
FY 09-10
HY 10-11
13%
19%
17%
10%
0% 5% 10% 15% 20%
FY 07-08
FY 08-09
FY 09-10
HY 10-11
Making Sugar since 1842 52
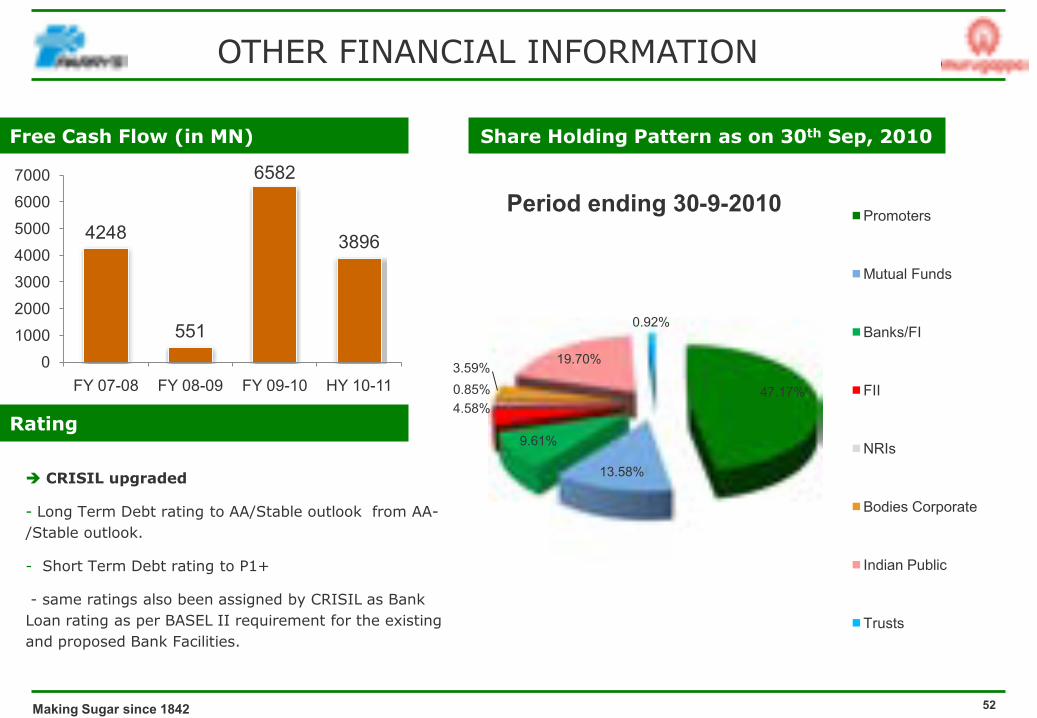
OTHER FINANCIAL INFORMATION
Share Holding Pattern as on 30th Sep, 2010Free Cash Flow (in MN)
4248
551
6582
3896
01000200030004000500060007000
FY 07-08 FY 08-09 FY 09-10 HY 10-11
Rating
CRISIL upgraded
- Long Term Debt rating to AA/Stable outlook from AA-/Stable outlook.
- Short Term Debt rating to P1+
- same ratings also been assigned by CRISIL as Bank Loan rating as per BASEL II requirement for the existing and proposed Bank Facilities.
47.17%
13.58%
9.61%
4.58%0.85%3.59% 19.70%
0.92%
Period ending 30-9-2010 Promoters
Mutual Funds
Banks/FI
FII
NRIs
Bodies Corporate
Indian Public
Trusts
53Making Sugar since 1842 53
Quartely ResultsLast week of January „2011 and April „2011, July „2011, October „2011
For further information, please contact:
P. Gopalakrishnan,
Vice-President (Finance)
E.I.D. - Parry (India) Limited,
Dare House, 234 NSC Bose Road,
Chennai – 600 001.
Tel: +44 – 2530-6789
Email: [email protected]
Website: www.eidparry.com
Investor Co-ordinator

54Making Sugar since 1846 54
Stronger… Greener… Bigger…