Strong Two Party Politics in the Industrial Heartland.
22
Strong Two Party Politics in the Industrial Heartland
-
date post
21-Dec-2015 -
Category
Documents
-
view
215 -
download
0
Transcript of Strong Two Party Politics in the Industrial Heartland.

Strong Two Party Politics in the Industrial Heartland

% Democratic Presidential Vote
20.0%
30.0%
40.0%
50.0%
60.0%
70.0%
1948 1956 1964 1972 1980 1988 1996 2004
Illinois National
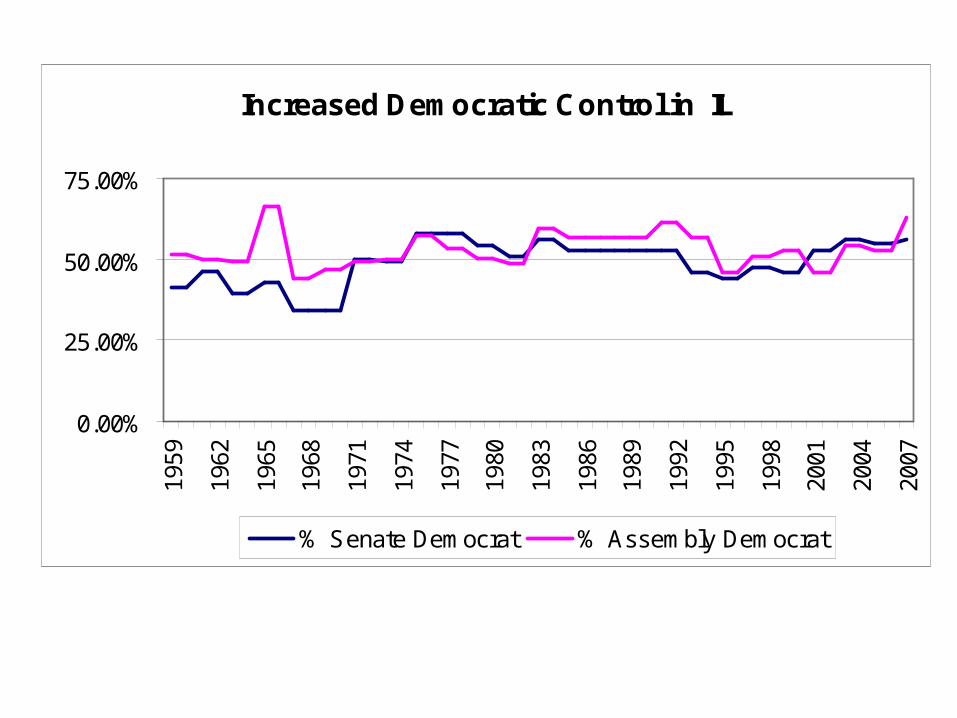
Increased Democratic Control in IL
0.00%
25.00%
50.00%
75.00%19
59
1962
1965
1968
1971
1974
1977
1980
1983
1986
1989
1992
1995
1998
2001
2004
2007
% Senate Democrat % Assembly Democrat

% of Senate, Assembly and Governor Controlled by Democratic Party (IL)
0.0%
20.0%
40.0%
60.0%
80.0%
100.0%
1959
1962
1965
1968
1971
1974
1977
1980
1983
1986
1989
1992
1995
1998
2001
2004
2007

State Government and Citizen Liberalism in IL
0.0%10.0%20.0%30.0%40.0%50.0%60.0%70.0%80.0%90.0%
1960
1963
1966
1969
1972
1975
1978
1981
1984
1987
1990
1993
1996
1999
2002
SGL CL

1960 2004
John Kennedy (D)
Richard Nixon (R)
John Kerry (D)
George W. Bush (R)

% Democratic Presidential Vote
20.0%
30.0%
40.0%
50.0%
60.0%
70.0%
1948 1956 1964 1972 1980 1988 1996 2004
Indiana National

Variable, then Shared Control in IN
0.00%
25.00%
50.00%
75.00%
100.00%19
59
1962
1965
1968
1971
1974
1977
1980
1983
1986
1989
1992
1995
1998
2001
2004
2007
% Senate Democrat % Assembly Democrat

% of Senate, Assembly and Governor Controlled by Democratic Party (IN)
0.0%
20.0%
40.0%
60.0%
80.0%
100.0%19
59
1962
1965
1968
1971
1974
1977
1980
1983
1986
1989
1992
1995
1998
2001
2004
2007

State Government and Citizen Liberalism in IN
0.0%10.0%20.0%30.0%40.0%50.0%60.0%70.0%80.0%90.0%
1960
1963
1966
1969
1972
1975
1978
1981
1984
1987
1990
1993
1996
1999
2002
SGL CL

1960 2004
John Kennedy (D)
Richard Nixon (R)
John Kerry (D)
George W. Bush (R)

% Democratic Presidential Vote
20.0%
30.0%
40.0%
50.0%
60.0%
70.0%
1948 1956 1964 1972 1980 1988 1996 2004
Ohio National

Large Losses for Deomocrats in OH
0.00%
25.00%
50.00%
75.00%19
59
1962
1965
1968
1971
1974
1977
1980
1983
1986
1989
1992
1995
1998
2001
2004
2007
% Senate Democrat % Assembly Democrat

% of Senate, Assembly and Governor Controlled by Democratic Party (OH)
0.0%
20.0%
40.0%
60.0%
80.0%
100.0%19
59
1962
1965
1968
1971
1974
1977
1980
1983
1986
1989
1992
1995
1998
2001
2004
2007

State Government and Citizen Liberalism in OH
0.0%
20.0%
40.0%
60.0%
80.0%
100.0%
1960
1963
1966
1969
1972
1975
1978
1981
1984
1987
1990
1993
1996
1999
2002
SGL CL

1960 2004
John Kennedy (D)
Richard Nixon (R)
John Kerry (D)
George W. Bush (R)

% Democratic Presidential Vote
20.0%
30.0%
40.0%
50.0%
60.0%
70.0%
1948 1956 1964 1972 1980 1988 1996 2004
Pennsylvania National
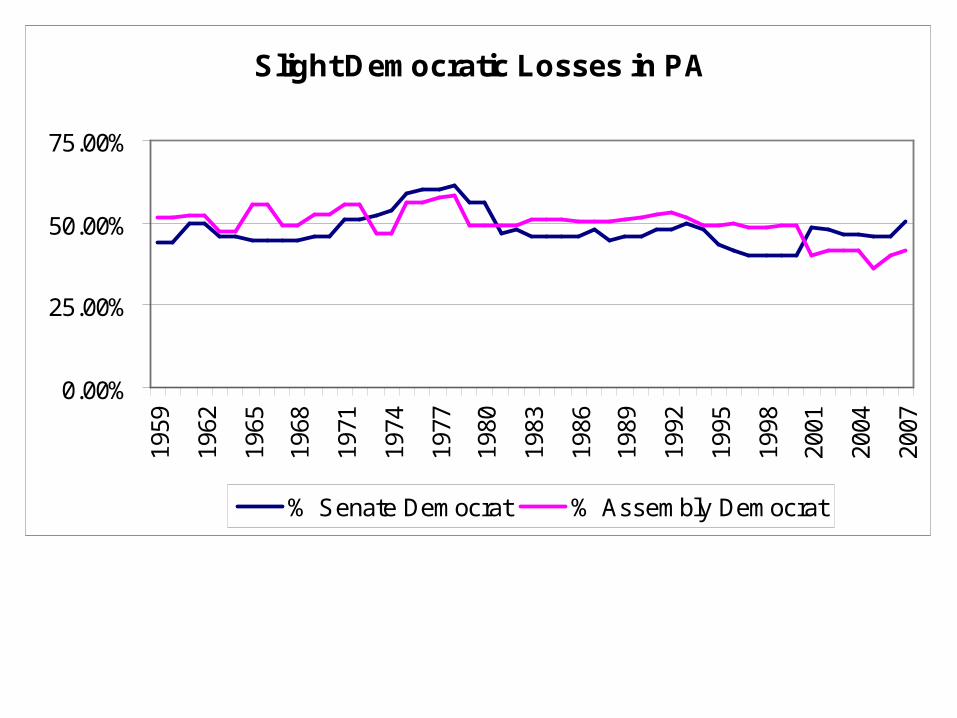
Slight Democratic Losses in PA
0.00%
25.00%
50.00%
75.00%19
59
1962
1965
1968
1971
1974
1977
1980
1983
1986
1989
1992
1995
1998
2001
2004
2007
% Senate Democrat % Assembly Democrat

% of Senate, Assembly and Governor Controlled by Democratic Party (PA)
0.0%
20.0%
40.0%
60.0%
80.0%
100.0%19
59
1962
1965
1968
1971
1974
1977
1980
1983
1986
1989
1992
1995
1998
2001
2004
2007

State Government and Citizen Liberalism in PA
0.0%10.0%20.0%30.0%40.0%50.0%60.0%70.0%80.0%90.0%
1960
1963
1966
1969
1972
1975
1978
1981
1984
1987
1990
1993
1996
1999
2002
SGL CL

1960 2004
John Kennedy (D)
Richard Nixon (R)
John Kerry (D)
George W. Bush (R)

General Trends
• Strong two party trends
• Split between presidential vote and state legislature vote
• Republican and democrat dominance switch frequently
• Urban areas gain population, gain influence, elect democrats