Strong specic anti-viral responses in pediatric COVID-19 ...
61
Strong speciヲc anti-viral responses in pediatric COVID-19 patients in South Brazil Tiago Fazolo Departamento de Ciências Básicas da Saúde, Universidade Federal de Ciências da Saúde de Porto Alegre - UFCSPA. https://orcid.org/0000-0001-6560-7004 Karina Lima Departamento de Ciências Básicas da Saúde, Universidade Federal de Ciências da Saúde de Porto Alegre - UFCSPA. Julia Fontoura Departamento de Ciências Básicas da Saúde, Universidade Federal de Ciências da Saúde de Porto Alegre - UFCSPA. Priscila de Souza Departamento de Ciências Básicas da Saúde, Universidade Federal de Ciências da Saúde de Porto Alegre - UFCSPA. Gabriel Hilario Departamento de Ciências Básicas da Saúde, Universidade Federal de Ciências da Saúde de Porto Alegre - UFCSPA. https://orcid.org/0000-0001-5314-2131 Renata Zorzetto Departamento de Ciências Básicas da Saúde, Universidade Federal de Ciências da Saúde de Porto Alegre - UFCSPA. https://orcid.org/0000-0003-3105-1014 Luiz Rodrigues Júnior Departamento de Ciências Básicas da Saúde, Universidade Federal de Ciências da Saúde de Porto Alegre - UFCSPA. Veridiane Pscheidt Departamento de Ciências Básicas da Saúde, Universidade Federal de Ciências da Saúde de Porto Alegre - UFCSPA. Jayme Ferreira Neto Departamento de Ciências Básicas da Saúde, Universidade Federal de Ciências da Saúde de Porto Alegre - UFCSPA. Alisson Haubert Departamento de Ciências Básicas da Saúde, Universidade Federal de Ciências da Saúde de Porto Alegre - UFCSPA. Izza Gambin Departamento de Ciências Básicas da Saúde, Universidade Federal de Ciências da Saúde de Porto Alegre - UFCSPA.
Transcript of Strong specic anti-viral responses in pediatric COVID-19 ...
Strong speci�c anti-viral responses in pediatricCOVID-19 patients in South BrazilTiago Fazolo
Departamento de Ciências Básicas da Saúde, Universidade Federal de Ciências da Saúde de PortoAlegre - UFCSPA. https://orcid.org/0000-0001-6560-7004Karina Lima
Departamento de Ciências Básicas da Saúde, Universidade Federal de Ciências da Saúde de PortoAlegre - UFCSPA.Julia Fontoura
Departamento de Ciências Básicas da Saúde, Universidade Federal de Ciências da Saúde de PortoAlegre - UFCSPA.Priscila de Souza
Departamento de Ciências Básicas da Saúde, Universidade Federal de Ciências da Saúde de PortoAlegre - UFCSPA.Gabriel Hilario
Departamento de Ciências Básicas da Saúde, Universidade Federal de Ciências da Saúde de PortoAlegre - UFCSPA. https://orcid.org/0000-0001-5314-2131Renata Zorzetto
Departamento de Ciências Básicas da Saúde, Universidade Federal de Ciências da Saúde de PortoAlegre - UFCSPA. https://orcid.org/0000-0003-3105-1014Luiz Rodrigues Júnior
Departamento de Ciências Básicas da Saúde, Universidade Federal de Ciências da Saúde de PortoAlegre - UFCSPA.Veridiane Pscheidt
Departamento de Ciências Básicas da Saúde, Universidade Federal de Ciências da Saúde de PortoAlegre - UFCSPA.Jayme Ferreira Neto
Departamento de Ciências Básicas da Saúde, Universidade Federal de Ciências da Saúde de PortoAlegre - UFCSPA.Alisson Haubert
Departamento de Ciências Básicas da Saúde, Universidade Federal de Ciências da Saúde de PortoAlegre - UFCSPA.Izza Gambin
Departamento de Ciências Básicas da Saúde, Universidade Federal de Ciências da Saúde de PortoAlegre - UFCSPA.
Aline Oliveira Departamento de Ciências Básicas da Saúde, Universidade Federal de Ciências da Saúde de Porto
Alegre - UFCSPA.Raissa Mello
Departamento de Ciências Básicas da Saúde, Universidade Federal de Ciências da Saúde de PortoAlegre - UFCSPA.Matheus Balbe e Gutierres
Departamento de Ciências Básicas da Saúde, Universidade Federal de Ciências da Saúde de PortoAlegre - UFCSPA.Rodrigo Gassen
Center for Transplantation Sciences, Department of Surgery, Massachusetts General Hospital, HarvardMedical SchoolIvaine Sartor
Social responsibility – PROADI-SUS, Hospital Moinhos de VentoGabriela Zavaglia
Social responsibility - PROADI-SUS, Hospital Moinhos de Vento https://orcid.org/0000-0001-5419-665XIngrid Fernandes
Social responsibility – PROADI-SUS, Hospital Moinhos de VentoFernanda Varela
Social responsibility – PROADI-SUS, Hospital Moinhos de VentoMárcia Polese-Bonatto
Social responsibility – PROADI-SUS, Hospital Moinhos de VentoThiago Borges
PUCRSSidia Callegari-Jacques
Departamento de Estatística, Universidade Federal do Rio Grande do SulMarcela da Costa
Coordenação-Geral do Programa Nacional de Imunizações – Departamento de Imunizações e DoençasTransmissíveis – Secretaria de VigJaqueline Schwartz
Coordenação-Geral do Programa Nacional de Imunizações – Departamento de Imunizações e DoençasTransmissíveis – Secretaria de VigMarcelo Scotta
Social responsibility – PROADI-SUS, Hospital Moinhos de VentoRenato T. Stein Stein
Social responsibility – PROADI-SUS, Hospital Moinhos de VentoCristina Bonorino ( [email protected] )

Universidade Federal de Ciências da Saúde de Porto Alegre - UFCSPA https://orcid.org/0000-0003-2755-3978
Article
Keywords: COVID-19, SARS-CoV-2, pediatrics, anti-viral responses
Posted Date: May 7th, 2021
DOI: https://doi.org/10.21203/rs.3.rs-424079/v1
License: This work is licensed under a Creative Commons Attribution 4.0 International License. Read Full License
Version of Record: A version of this preprint was published at Nature Communications on November 25th,2021. See the published version at https://doi.org/10.1038/s41467-021-27120-y.

1
Strong specific anti-viral responses in pediatric COVID-19 patients in South Brazil 1
2
Authors 3
Tiago Fazolo1*, Karina Lima1*, Julia C. Fontoura1*, Priscila Oliveira de Souza1, Gabriel 4
Hilario1, Renata Zorzetto1, Luiz Rodrigues Júnior1, Veridiane Maria Pscheidt1, Jayme de 5
Castilhos Ferreira Neto1, Alisson.F. Haubert1, Izza Gambin1, Aline C. Oliveira1, Raissa S. 6
Mello1, Matheus de Bastos Balbe e Gutierres1, Rodrigo Benedetti Gassen5, Ivaine Tais Sauthier 7
Sartor3, Gabriela Oliveira Zavaglia3, Ingrid Rodrigues Fernandes3, Fernanda Hammes 8
Varela3,4, Márcia Polese-Bonatto3, Thiago J. Borges5, Sidia Maria Callegari-Jacques6, Marcela 9
Santos Correa da Costa7, Jaqueline de Araujo Schwartz7, Marcelo Comerlato Scotta3,4, Renato 10
T. Stein3,4, Cristina Bonorino 1,2** 11
12
Affiliations 13
1. Departamento de Ciências Básicas da Saúde, Universidade Federal de Ciências da 14
Saúde de Porto Alegre - UFCSPA. Porto Alegre RS Brazil 15
2. Department of Surgery, University of California at San Diego- UCSD. La Jolla, CA 16
USA 17
3. Social Responsibility – PROADI-SUS, Hospital Moinhos de Vento, Porto Alegre, 18
Brazil 19
4. Escola de Medicina, Pontifícia Universidade Católica do Rio Grande do Sul - PUCRS, 20
Porto Alegre, Brazil 21
5. Center for Transplantation Sciences, Department of Surgery, Massachusetts General 22
Hospital, Harvard Medical School, Boston, MA 23
6. Departamento de Estatística, Universidade Federal do Rio Grande do Sul 24
2
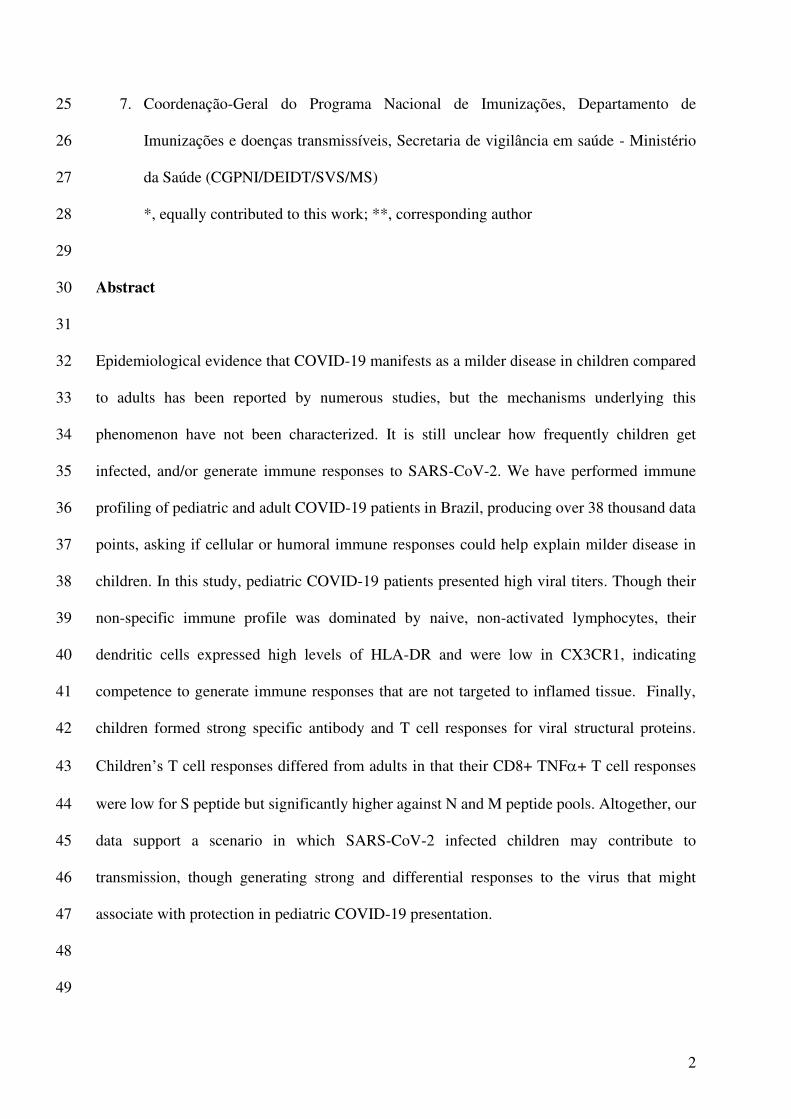
7. Coordenação-Geral do Programa Nacional de Imunizações, Departamento de 25
Imunizações e doenças transmissíveis, Secretaria de vigilância em saúde - Ministério 26
da Saúde (CGPNI/DEIDT/SVS/MS) 27
*, equally contributed to this work; **, corresponding author 28
29
Abstract 30
31
Epidemiological evidence that COVID-19 manifests as a milder disease in children compared 32
to adults has been reported by numerous studies, but the mechanisms underlying this 33
phenomenon have not been characterized. It is still unclear how frequently children get 34
infected, and/or generate immune responses to SARS-CoV-2. We have performed immune 35
profiling of pediatric and adult COVID-19 patients in Brazil, producing over 38 thousand data 36
points, asking if cellular or humoral immune responses could help explain milder disease in 37
children. In this study, pediatric COVID-19 patients presented high viral titers. Though their 38
non-specific immune profile was dominated by naive, non-activated lymphocytes, their 39
dendritic cells expressed high levels of HLA-DR and were low in CX3CR1, indicating 40
competence to generate immune responses that are not targeted to inflamed tissue. Finally, 41
children formed strong specific antibody and T cell responses for viral structural proteins. 42
Children’s T cell responses differed from adults in that their CD8+ TNF+ T cell responses 43
were low for S peptide but significantly higher against N and M peptide pools. Altogether, our 44
data support a scenario in which SARS-CoV-2 infected children may contribute to 45
transmission, though generating strong and differential responses to the virus that might 46
associate with protection in pediatric COVID-19 presentation. 47
48
49

3
Introduction 50
51
COVID-19 is a complex disease, with multisystemic involvement, and an array of clinical 52
manifestations that can vary from asymptomatic to severe outcomes leading to death (1) which 53
lead to an ongoing worldwide emergency (2). Epidemiological evidence of less severe forms 54
of the disease and reduced mortality in children upon infection with SARS-CoV-2 has been 55
consistently reported (3,4), except for an inflammatory syndrome (MISC) associated with co-56
morbidities in a relatively low percentage of children (5). The pediatric population (0-19 years 57
old) represents more than 25% of the Brazilian population, however, it is observed that this 58
group corresponds to only 1.9% (19,589 / 989,170) of all cases of SARS by COVID-19 59
reported in the past 12 months. Mortality among children represented 0.5% (1,564 / 321,659) 60
of all deaths due to the disease reported in the same period. The lethality in children and 61
adolescents hospitalized due to SARS by covid-19 was 8.0% (1,574 / 19,589), while the overall 62
lethality in all age groups was 32.5% (321,659 / 989,170), in the observed period (data from 63
SIVEP-Gripe, Brazilian Ministry of Health). Thus, a significantly lower number of children 64
and adolescents has severe clinical presentations with the need for hospitalization, or that will 65
lead to death, when compared to other age groups. 66
Different hypotheses have been raised to explain this phenomenon (6,7). Milder disease in 67
children could result from a reduced expression of the viral receptor ACE2, leading to lower 68
levels of viral replication (8). Alternatively, it could be explained by a differential immune 69
response in children, correlated to a distinct infection course from adults (9). A third popular 70
hypothesis is that the pre-existence of neutralizing antibodies to seasonal coronaviruses could 71
confer some cross-protection against SARS-CoV-2 induced disease, mainly because children 72
are considered the main reservoir for these viruses (10). At present, the scarcity of data prevents 73

4
a clear understanding of the striking differences between the pediatric and adult outcomes after 74
infection by COVID-19. 75
Comprehensive studies have characterized immune responses in adults with mild or severe 76
forms of COVID-19 (11–14). However, considerably fewer studies have focused on pediatric 77
patients. This is a subject of paramount importance, not only because it is central to the design 78
of public policies regulating school opening (and all the activities associated with it) during the 79
pandemic, but also because understanding the milder disease presentation in children may 80
provide important clues for the design of prevention strategies as well as novel therapeutic 81
pathways for the management of COVID-19. In this study, we sought to characterize in detail 82
the innate and adaptive immune responses in a cohort of patients consisting of children with 83
mild disease and adults with different degrees of severity presenting at health care facilities 84
with symptoms suggestive of COVID-19. We sought to identify an immune profile in children 85
that could explain the striking differences in outcome between them and adult COVID-19 86
patients. We collected plasma and peripheral blood mononuclear cells (PBMCs) from adult 87
and pediatric COVID-19 patients, and detailed characterization of their immune response was 88
performed by multi-parameter flow cytometry, defining 78 immune cell subsets and expression 89
of key activation markers, anti-SARS-CoV-2 IgA and IgG antibodies, and frequencies of 90
specific effector T cells, producing 38,670 data points. Pediatric patients with mild COVID-91
19 had high viral load titers, high frequencies of dendritic cells, with high HLA-DR expression, 92
but low in CX3CR1. Although their non-specific adaptive cells immune profile was dominated 93
by antigen-inexperienced cells, SARS-CoV-2 specific antibodies and T cells were detected in 94
levels comparable to the ones in adults with either severe or mild disease. Children showed 95
higher CD8+ TNF+ T cell responses to N and M peptide pools than for S peptides, while this 96
was not observed in adults. This response did not correlate with anti-S or anti-N antibody 97
levels. Taken together, our findings suggest that children produce a differential immune 98

5
response when compared to adults, which associates with the mild manifestation in pediatric 99
COVID-19. 100
101
Methods 102
103
Ethics Statement 104
105
This study was approved by the Institutional Review Board (IRB 30749720.4.1001.5330) at 106
Hospital Moinhos de Vento and by the Ethics Committee at Universidade Federal de Ciências 107
da Saúde (CAAE 30749720.4.3001.5345). Legal consent was obtained from all participants or 108
their legal guardians. The study was conducted according to good laboratory practices and 109
following the Declaration of Helsinki. 110
111
Patients 112
113
A prospective cohort study was carried out at Hospital Moinhos de Vento and at Hospital 114
Restinga e Extremo Sul, both in Porto Alegre, southern Brazil. A convenience sample of adults 115
and children older than 2 months were enrolled from June to December 2020 at either the 116
outpatient clinics (OPC), emergency rooms (ER), or hospitalized. Subjects were screened if 117
presenting cough and/or axillary temperature ≥37.8ºC and/or sore throat. Both blood samples 118
and respiratory samples collected through nasopharyngeal swabs were obtained at enrollment. 119
Only patients with the clinical diagnosis of COVID-19 and SARS-CoV-2 infection confirmed 120
by RT-PCR were included in the study. Clinical and demographic data were collected at 121
inclusion, following a standardized protocol. Disease severity was classified according to the 122
World Health Organization classification after completing the follow-up questionnaire (15). 123

6
124
SARS-CoV-2 RT-q-PCR 125
126
A qualitative RT-PCR assay to SARS-CoV-2 was performed for all participants. Bilateral 127
nasopharyngeal and oropharyngeal swabs were collected and placed in the same transport 128
medium with saline solution and RNAlater®, RNA Stabilization Solution (Catalog number 129
AM7021, Invitrogen™). MagMax™ Viral/Pathogenic Nucleic Acid Isolation Kit (Applied 130
Biosystems) was used to extract viral RNA in the KingFisher Duo Prime System 131
(ThermoFisher, USA) automated platform. The RT-PCR assay was performed in 10 µL total 132
reaction, using Path™ 1-Step RT-qPCR Master Mix, CG (catalog number A15299, 133
AppliedBiosystems) and TaqMan™ 2019-nCoV Assay Kit v1 (catalog number A47532, 134
AppliedBiosystems) which comprises the SARS-CoV-2–specific targets (gene ORF1ab, gene 135
S and gene N). As reaction control was used 5 µL (200 copies/µL) the TaqMan™ 2019-nCoV 136
Control Kit v1 (catalog number A47533, AppliedBiosystems). QuantStudio 5 (ThermoFisher 137
Scientific, USA) was used to perform the PCR. 138
139
PBMC isolation and cryopreservation 140
141
Blood was collected in EDTA tubes (Firstlab, PR, Brazil) and stored at room temperature 142
before processing for PBMC isolation and plasma collection. Plasma was separated by 143
centrifugation and cryopreserved. PBMCs were next isolated by density-gradient 144
centrifugation using Ficoll–Paque™ PLUS (GE Healthcare®), and either studied directly or 145
resuspended in FBS 5% DMSO and stored in liquid nitrogen until use. 146
147
148

7
Flow cytometry 149
150
Cells were thawed by diluting them in 5mL pre-warmed complete RPMI1640 medium (Sigma-151
Aldrich - R8758) containing 5% FBS and spun at 1500 rpm for 5 minutes. Supernatants were 152
carefully removed, and cells were resuspended in PBS. After, were stained with the BD 153
Horizon™ Fixable Viability Stain 510 together with antibodies for surface markers, as follows: 154
anti-CD3-APC-H7 (clone SK7), anti-CD24-APC-H7 (clone ML5), anti-HLA-DR-APC-H7 155
(clone G46-6), anti-CD4-PerCP-Cy5.5 (clone RPA-T4), anti-CD27-PerCP-Cy5.5 (clone M-156
T271), anti-CD11c-PerCP-Cy5.5 (clone B-ly6), anti-CD14-PerCP-Cy5.5 (clone M5E2), anti-157
CD8-FITC (clone HIT8a), anti-IgG-FITC (clone G18-145), Lineage 2-FITC (cat. 643397), 158
anti-CD16-FITC (clone 3G8), anti-CXCR5 (CD185)-BB515 (clone RF8B2), anti-CD19-APC 159
(clone HIB19), anti-CD127-Alexa 647 (clone HIL-7R-M21), anti-CX3CR1-Alexa647 (clone 160
2A9-1), anti-CD69-APC (clone FN50), anti-CD38-PE (clone HIT2), anti-ICOS (CD278)-PE 161
(clone DX29), anti-CD141-PE (clone 1A4), anti-CD66b-PE (clone G10F5), anti-CD137 (4-162
1BB)-PE (clone 4B4-1), anti-HLA-DR-PE-Cy7 (clone G46-6), anti-CD19-PE-Cy7 (clone 163
SJ25C1), anti-CD25-PE-Cy7 (clone 2A3), anti-CD45RA-PE-Cy7 (clone L48), anti-IgM-164
BV421 (clone G20-127), anti-PD-1 (CD279)-BV421 (clone MIH4), anti-CD303-BV421 165
(clone V24-785), anti-CD56-BV421 (clone NCAM 16), anti-CCR7-BV421 (clone 2-L1-A) 166
antibodies. For intracellular staining, cells were first stained for surface markers and 167
subsequently fixed and permeabilized using the Transcription Factor Buffer Set (BD 168
Biosciences-Pharmingen, USA), then stained with anti-Ki-67-BV421 (clone B56), anti-169
Perforin-Alexa 647 (clone δG9), and anti-Granzyme B-BV421 (clone GB11) antibodies. 170
Following in vitro stimulation assays with specific peptides, cells were stained with the BD 171
Horizon™ Fixable Viability Stain 510 and anti-CD3-PE-Cy7 (clone SK7), anti-CD4-PerCP-172
Cy5.5 (clone RPA-T4), anti-CD8-APC-H7 (clone SK1), anti-CCR7-BV421 (clone 2-L1-A), 173

8
and subsequently fixed and permeabilized using the Cytofix/Cytoperm kit (BD Biosciences-174
Pharmingen, USA), then stained with anti-IFNγ-FITC (clone 4S.B3), anti-TNF (clone MAb11) 175
and anti-IL-17-PE (clone SCPL1362) antibodies. All samples were analyzed using a BD 176
Biosciences - FACSCanto II and FlowJo 10.7.1 software. 177
178
In vitro T cells stimulation assays 179
180
PBMC were thawed, assayed for viability, counted, and plated in 96-well plates at 3×10⁶ 181
PBMCs/mL, 100 uL/well in RPMI1640 medium (Sigma-Aldrich - R8758) supplemented with 182
10% fetal bovine serum (100 IU of penicillin/mL, 100 μg of streptomycin/mL (Lonza, 183
Belgium) and 2 mM L-glutamine (Lonza, Belgium) (R10H medium), and subsequently 184
stimulated with peptide PepTivator SARS-CoV-2 Prot S (130-126-700 - Miltenyi Biotec, 185
Germany), PepTivator SARS-CoV-2 Prot N (130-126-698 - Miltenyi Biotec, Germany) and 186
PepTivator SARS-CoV-2 Prot M (130-126-702 - Miltenyi Biotec, Germany) at 1 μg/mL. PMA 187
(50 ng/mL, Sigma, USA) plus ionomycin (1 μg/mL, Cayman chemical company, USA) and 188
DMSO were used as positive and negative controls for stimulation, respectively. Stimulation 189
with a CMV peptide pool at 2μg/mL (Mabtech, Sweden) was also performed, as a positive 190
control for the assay. All treatments were submitted for 18h at 37ºC and 5% CO2. Three hours 191
before harvesting, Golgi Plug (BD Biosciences, USA) 1μg/mL was added to each well. Cells 192
were stained and analyzed for phenotype as described above. 193
194
ELISA 195
196
Plasma was tested for IgG and IgA antibodies to S-RBD protein (#RP-87678 - Invitrogen, 197
USA) and N protein (kindly provided by Dr. Ricardo Gazinelli - Fiocruz Belo Horizonte, 198

9
Brazil) using a protocol described in (16). Briefly, ELISA plates (Kasvi, Brazil) were coated 199
overnight with 1μg/mL of SARS-CoV-2 Spike Protein (S-RBD). On the following day, plates 200
were blocked for 1 h at room temperature with blocking buffer (3% Skim Milk Powder in 201
Phosphate Buffered Saline (PBS) containing 0.05% Tween-20). Plasma samples were heat-202
inactivated at 56°C for 60 minutes and then serially diluted in 1% milk in 0.05% PBS-Tween 203
20 starting at a 1:25. Plasma was incubated for 2 h at 37°C. Secondary antibodies were diluted 204
in 0.05% PBS-Tween and incubated for 1 h at room temperature. For both IgG, anti-human 205
peroxidase produced in rabbit (#IC-1H01 - Rhea Biotec, Brazil), and IgA, anti-human 206
peroxidase produced in goat (#A18781 - Invitrogen, USA), was used at a 1:10,000 dilution. 207
The assay was developed with TMB Elisa Substrate - High Sensitivity (Abcam, United 208
Kingdom) for 30 minutes, and the reaction stopped with 1M chloric acid. Readings were 209
performed in an ELISA reader (Biochrom EZ 400), and O.D. at 450 nm was used to calculate 210
the area under the curve (AUC), using a baseline of 0.07 for peak calculation (17). 211
212
Statistics 213
214
Percentages were used to describe categorical variables. Pearson's Chi-square test was used to 215
evaluate proportions among the children, severe and mild adults. Data normality assumptions 216
were verified for continuous variables and summarized in terms of median and interquartile 217
range (IQR). Two-tailed Kruskal-Wallis test followed by Benjamini-Hochberg correction for 218
multiple comparisons was used to compare values among the groups. Principal Component 219
Analysis (PCA) was employed to reduce the dimensions of 78 immunological variables 220
generated by flow cytometry analysis, to explain the total variability with a smaller, new set of 221
variables. Spearman correlations were performed between all variables (every set of two 222
variables) and within sets of variables to identify clusters of correlated variables. In PCA of the 223

10
variables grouped in clusters, variables containing redundant information were excluded. 224
Comparison among groups regarding single variables or PC values was performed by non-225
parametric Kruskal-Wallis test, followed by 2 by 2 multiple comparisons with p-values 226
adjusted accordingly. All analyses were performed either in GraphPad Prism v.9 or R and 227
sometimes confirmed in Python. 3D analysis of PCA was plotted in Python. Scripts are detailed 228
in supplemental materials. 229
230
Results 231
232
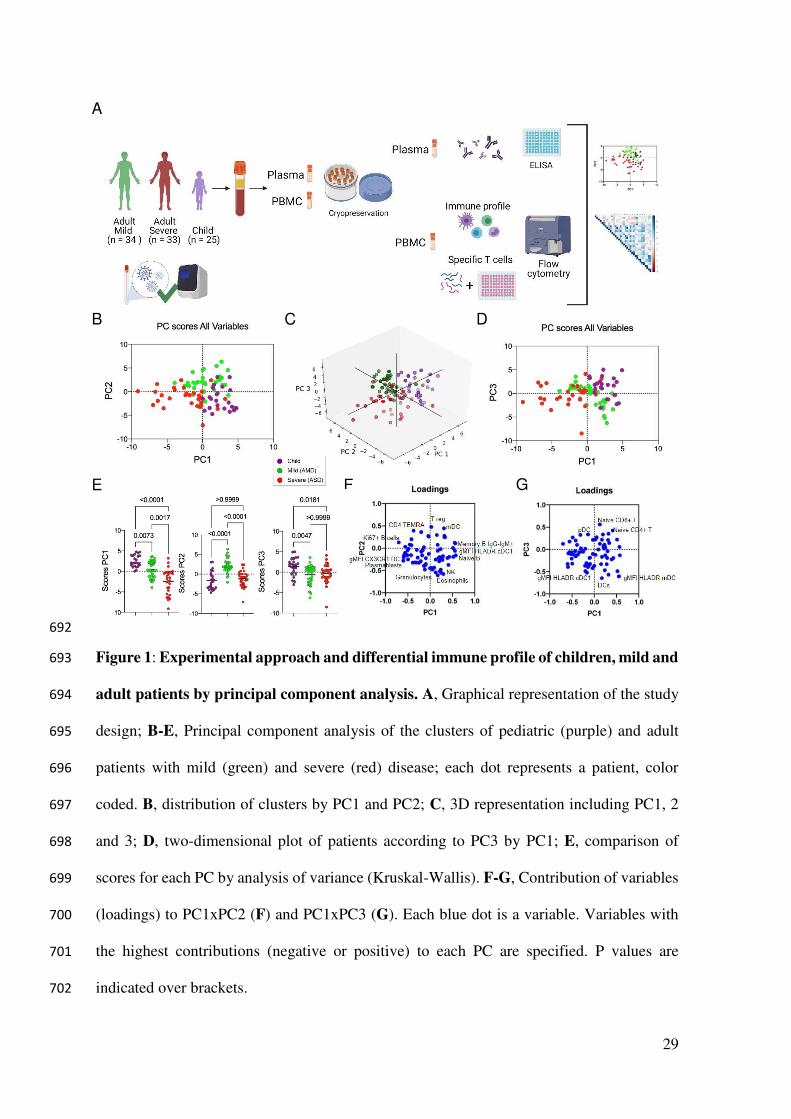
The study design is summarized in Figure 1A. We have recruited a total of 92 patients (25 233
children; 34 adults with mild disease - AMD; and 33 adults with severe disease - ASD). All 234
subjects had COVID-19 confirmed by PCR. All children had mild disease and were treated as 235
outpatients. Their characteristics are described in Table 1. The youngest individual enrolled 236
was 7 months old – which does not appear in the table because only the interquartile interval 237
(IQR) is shown. Most individuals were Caucasian. As expected, comorbidities were 238
concentrated in the group with severe disease, which was also the group with a higher mean 239
age. Some symptoms are probably not accurately assessed in some children, such as anosmia 240
or dysgeusia, due to the age of some individuals in this group. Dyspnea was significantly less 241
frequent in children. Median Ct levels for all three probes used in PCR were higher in AMD, 242
and not different between ASD and children. 243
244
Immune responses separate pediatric patients, adults with mild and severe disease from each 245
other 246
247

11
Comprehensive immune profiling of PBMCs from pediatric and adult patients was performed 248
using flow cytometry, generating 78 variables (frequencies of cell subpopulations and gMFI of 249
activation markers). Gating strategies are detailed in Supplementary Figure 1 (A-H). To reduce 250
the dimensionality of the numerous variables, a PCA analysis was carried out. This approach 251
indicated that the three groups (pediatric patients; mild adult patients -AMD; and severe adult 252
patients - ASD) separated from each other based on three of the new variables created, PC1, 253
PC2, and PC3. PC1 separated the three groups, while PC2 separated mild patients from severe 254
ones (Figure 1B). 3D plotting performed to include PC3 showed that children again separated 255
from mild and severe adult patients (Figure 1C) and confirmed in 2D (Figure 1D). The PC 256
scores from all three groups were plotted and the significance of these differences was analyzed 257
by a Kruskal-Wallis (KW) test. Children had the highest mean score value for PC1 (2.765), 258
followed by AMD (0.142) and ASD (-2.351), and these differences were highly significant 259
(Figure 1E). For PC2, AMD had a mean score of 2.079, higher (p<0.0001) from children and 260
ASD (mean scores of -1.585 and -1.180, respectively, p>0.999). PC3 scores were highest in 261
children (mean=1.384) and significantly different from adults with mild (mean=-0.629; 262
p<0.0047) and severe (mean=-0.247; p<0.0181) disease. 263
Principal components are calculated based on correlations among variables, and to interpret the 264
meaning of each PC we analyzed the positive or negative contributions (loadings) of each 265
variable in each PC. The variables with the main positive and negative contributions (loadings) 266
are identified in Figures 1F, for PC1 and PC2; and 1G, for PC3. Respective loadings values are 267
listed in Supplementary Table 1. PC1 had positive inputs mainly by IgM+ memory B cells, 268
naïve B cells, and cDC1 DR expression; and main negative contributions by proliferating B 269
cells; plasmablasts; and CX3CR1+ expression in dendritic cells (DC) (Figure 1F). That 270
indicated that the group with the highest mean scores for PC1 (children) would be characterized 271
by a profile of predominantly naive or low-affinity memory B cells, not 272

12
activated/differentiated; and their dendritic cells would be high in DR, but low in CX3CR1. 273
The opposite would be true for individuals with the lowest mean scores (ASD), while AMD 274
would be characterized by an intermediate profile for these variables. The main positive 275
influences for PC2 were T regs, mDCs, and TEMRA cells, indicating mild adult patients 276
present significantly higher frequencies of these cell subpopulations. The main negative 277
influences for PC2 were eosinophils, NK cells, and granulocytes (Figure 1F), and these should 278
be the lowest in AMD. For PC3 (Figure 1G), the main positive contributions came from naive 279
CD8+ T cells, naive CD4+ T cells, and pDCs; and main negative contributions were DCs; and 280
expression of HLA-DR in mDC and cDC1. Because children had the highest scores for PC3, 281
they should have significantly higher frequencies of such cells (and higher expression of HLA-282
DR in DCs) compared to both AMD and ASD. To verify these PCA interpretations, we 283
compared them to the analysis of variance (Kruskal-Wallis) results performed among the three 284
groups of patients regarding the three most relevant, positive (Figure 2A) and negative (Figure 285
2B) influencers, variables for PC1, PC2, and PC3. The comparison of the three groups for their 286
variances regarding each variable agreed with the differences among them detected by PCA. 287
A pattern that emerged from these two combined analyses was that children, AMD and ASD, 288
separate from each other based mostly on differences in the state of activation of B and T 289
lymphocytes, and in targeting innate inflammatory responses to inflamed tissues. 290
The percent of the total variability explained by these first principal components was low; the 291
first three PCs together explained only 28.81% of the variance (Supplementary Table 1). This 292
indicated that these 78 variables were not highly correlated as a whole. A correlation analysis 293
using Spearman´s coefficient confirmed this observation (Supplementary Figure 2), revealing 294
a general pattern of moderate to weak correlations, but also identifying clusters of variables 295
that were more correlated than others. These clusters represented six types of immune 296
“signatures”: Proliferating/activated T cells; DCs; Granulocytes + Monocytes; NK cells; B 297

13
cells; and memory T cells. Follicular helper T cells (Tfh) related variables were weakly 298
correlated and were not considered as a cluster. We thus performed six separated PCAs for the 299
identified clusters of variables, hypothesizing that they could bring more specific information 300
to explain immunological differences among the three groups of patients. In this analysis, the 301
first two PCs for each cluster were now explained a larger portion of the total variance (44.19, 302
63.17, 50.37, 67.35, 49.56, and 42.49%, respectively - Supplementary Table 1) among the three 303
types of patients, and their distributions in children, AMD and ASD were analyzed. The results 304
are shown in Figure 3 (A-D) and Supplementary Figure 3 (A-C), with the respective graphic 305
representations for scores and loadings. We started by analyzing PCs formed by the innate 306
cells’ signatures. Principal components for the clusters of Granulocytes + Monocytes (Figure 307
3A) and NK cells (Figure 3B), although derived from expressive correlations among their 308
respective variables, did not separate the three groups of patients, indicating that the individuals 309
were not significantly different for the variables that composed these PCs. That was intriguing 310
because those variables had, as stated above, important contributions for the PC2 of all 311
variables (Figure 1), but it also indicated that this contribution helped separate the groups 312
mostly based on their correlations with other variables in the group of all variables, and not on 313
the differences among groups for those variables alone. Although highly correlated among 314
them (Supplementary Figure 2), variables composing the signatures for Granulocytes + 315
Monocytes and NK cells did not separate the groups when used together in a PCA (not shown) 316
and did not generate any new information. 317
Findings in PCA for the DCs signature (Figure 3C) indicated that children were significantly 318
separated from ASD, but not from AMD, with lower scores for PC1 (mostly CX3CR1 319
expression in DCs) and higher scores for frequencies of DCs (Figure 3C). HLA-DR expression 320
in DCs subpopulations constituted negative contributions for PC1. This indicated that children, 321
as well as AMD, would have more DCs than ASD, high in HLA-DR and low in CX3CR1. That 322
14
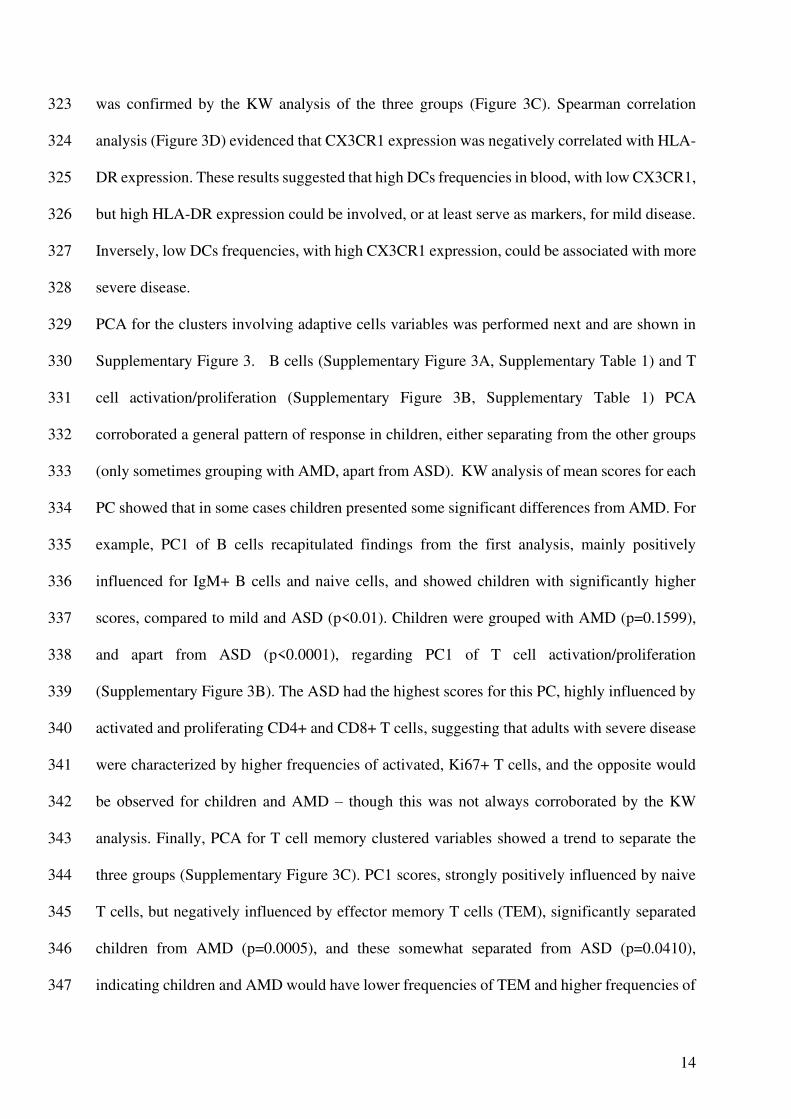
was confirmed by the KW analysis of the three groups (Figure 3C). Spearman correlation 323
analysis (Figure 3D) evidenced that CX3CR1 expression was negatively correlated with HLA-324
DR expression. These results suggested that high DCs frequencies in blood, with low CX3CR1, 325
but high HLA-DR expression could be involved, or at least serve as markers, for mild disease. 326
Inversely, low DCs frequencies, with high CX3CR1 expression, could be associated with more 327
severe disease. 328
PCA for the clusters involving adaptive cells variables was performed next and are shown in 329
Supplementary Figure 3. B cells (Supplementary Figure 3A, Supplementary Table 1) and T 330
cell activation/proliferation (Supplementary Figure 3B, Supplementary Table 1) PCA 331
corroborated a general pattern of response in children, either separating from the other groups 332
(only sometimes grouping with AMD, apart from ASD). KW analysis of mean scores for each 333
PC showed that in some cases children presented some significant differences from AMD. For 334
example, PC1 of B cells recapitulated findings from the first analysis, mainly positively 335
influenced for IgM+ B cells and naive cells, and showed children with significantly higher 336
scores, compared to mild and ASD (p<0.01). Children were grouped with AMD (p=0.1599), 337
and apart from ASD (p<0.0001), regarding PC1 of T cell activation/proliferation 338
(Supplementary Figure 3B). The ASD had the highest scores for this PC, highly influenced by 339
activated and proliferating CD4+ and CD8+ T cells, suggesting that adults with severe disease 340
were characterized by higher frequencies of activated, Ki67+ T cells, and the opposite would 341
be observed for children and AMD – though this was not always corroborated by the KW 342
analysis. Finally, PCA for T cell memory clustered variables showed a trend to separate the 343
three groups (Supplementary Figure 3C). PC1 scores, strongly positively influenced by naive 344
T cells, but negatively influenced by effector memory T cells (TEM), significantly separated 345
children from AMD (p=0.0005), and these somewhat separated from ASD (p=0.0410), 346
indicating children and AMD would have lower frequencies of TEM and higher frequencies of 347

15
naive T cells compared to ASD. Terminally differentiated memory CD4+ and CD8+ T cells 348
(TEMRA) were strong positive influences for PC2, while expression of CD69 and CD137 in 349
TEM cells negatively influenced PC2. Children and AMD, with high scores for PC2, did not 350
differ from each other, suggesting they would both be characterized by higher frequencies of 351
TEMRA (especially CD4+ TEMRA) cells than ASD, which in turn would have higher 352
frequencies of activated, CD69+, CD137+, TEM cells. Confirmations of the interpretations of 353
these PCs were again sought in the KW analysis for individual variables next to each PCA 354
results (Supplementary Figure 3C), and also in Supplementary Figure 4 - which compiles all 355
the remaining variables KW analyses results. This led us to note that for TEMRA, children 356
differed from AMD and not from ASD. CD45RA, a marker upregulated both in naïve and 357
TEMRA cells, has been shown to show different expression during the generation of memory 358
pools of chronic infections (18) as well as in response to vaccination (19). CD4+ TEMRA cells 359
associated with protection in Dengue (20). Thus, the PCA could indicate possible differences 360
for children and AMD, compared to ASD, in pathways for the generation of memory. In the 361
KW comparisons, CD4+TEMRA cells were lower in children than in AMD, and only AMD 362
differed from ASD significantly. For TCM, there were no differences among groups 363
(Supplementary Figure 4). Altogether, the patterns revealed by PCA indicated that children 364
have higher frequencies of non-specific antigen inexperienced B and T cells and DCs, with 365
high HLA-DR and low CX3CR1 expression. In some cases, children and AMD shared not only 366
a mild presentation of the disease but also a similar immune profile. Finally, the immune profile 367
of ASD was characterized by higher frequencies and markers of T and B cell activation and 368
proliferation, TEM cells, and lower DCs with high expression of CX3CR1. 369
370
SARS-CoV-2 specific T cells and antibodies responses in children are comparable to the ones 371
of adult patients 372

16
The characteristics of the non-specific immune profile of children led us to ask if they had 373
effectively formed SARS-CoV-2 specific responses upon infection. Seroconversion after 374
infection with SARS-CoV-2 patients with all forms of the disease has been described by several 375
studies - reviewed in (21). Antibodies to the S protein, and more specifically to the RBD of this 376
protein, are clinically considered a hallmark of infection, and frequently proposed as a correlate 377
of protection. We thus compared children, AMD, and ASD for their RBD specific- IgA and 378
IgG titers. On average, children presented levels of both IgG and IgA comparable to the adult 379
patients (Figure 4). In our cohort, although some individuals from the ASD group presented 380
higher levels of antibodies, differences among the groups were non-significant. Our results 381
revealed that, even though children presented a generally naive, non-activated, immune profile, 382
they had efficiently generated SARS-CoV-2 specific antibody responses, in levels that did not 383
differ from the ones in AMD (p<0.103 for IgA; p>0.999 for IgG) or ASD (p<0.916 for IgA; 384
p>0.999 for IgG) COVID-19 patients. 385
We next asked if children had generated specific effector T cell responses to SARS-CoV-2. 386
There are four structural proteins in SARS-CoV-2: the spike glycoprotein (S), the envelope (E) 387
protein, the membrane (M) protein, and the nucleocapsid (N) protein. Specific effector T cell 388
responses have been described in adult COVID-19 patients, both with mild and severe disease 389
(22,23), however fewer studies have focused on specific immune responses in pediatric patients 390
infected with SARS-CoV-2. We measured the frequencies of CD4+T and CD8+T cells 391
expressing TNF, IFN, or IL-17 in response to stimulation by peptide pools of the S, N, and 392
M proteins of the virus (Figure 5). Figure 5A shows representative flow cytometry plots of 393
cytokine-producing CD4+ or CD8+ T cells upon stimulation with SARS-CoV-2 peptide pools. 394
Negative (DMSO) and positive (PMA + ionomycin) control representative plots can be seen 395
in Supplementary Figure 5. Children presented detectable CD4+ and CD8+ T cell responses 396
upon stimulation with all three peptide pools (Figure 5B). When we compared types of 397

17
responses in each group for the different peptide pools, children showed a significantly higher 398
CD8+T TNF+ response for the M (p<0.005) and for the N (p<0.0409) peptide pools than for 399
the S pool (5B, upper right panel). This was not seen in adults, and although there was a trend 400
for lower CD4+ TNF+ responses in children, it was not significant. Supplementary Figure 6 401
shows the responses compared among the groups. About 30% of individuals – of all groups - 402
did not show responding CD4+ T cells to the peptide pools; a higher frequency of individuals 403
did not respond to the S pool compared to the M and N pools. In the ones that responded, CD4+ 404
IL-17+ T cell responses were higher for all three peptide pools (about 1 log higher than INF 405
and TNF CD4+T cell responses). CD8+ T cell responses were, in general, more robust, 406
although for S and M peptide pools there were still some individuals, though fewer, that did 407
not respond to stimulation. The absence of response, in our sample, did not correlate with the 408
early time of collection, as reported by (18). TNF+ CD8+ T cell responses were about 1 log 409
higher than what was detected for CD4+ T cells, for all peptide pools (Supplementary Figure 410
6). The IL-17+ CD4+T cells responses to stimulation by all three pools, were higher than the 411
TNF+CD4+ and INF+ CD4+ for all three groups. The differential TNF+ cytotoxic 412
response to M and N peptides seen in children led us to investigate levels of anti-N antibodies. 413
Children made strong anti-N IgG levels, not different from AMD and ASD (Figure 6A). Anti- 414
RBD IgA, but not IgG levels, correlated positively with CD4+ INF+ responses (Figure 6B). 415
Interestingly, the TNF+ cytotoxic responses to M and N peptide pools were inversely 416
correlated with levels of anti-RBD and anti-N antibodies (Figure 6B). Anti-N antibody levels 417
correlated positively with anti-N CD4+INF+ responses (Figure 6B). Taken together, these 418
results indicate that children do generate specific humoral and effector cell responses upon 419
infection with SARS-CoV-2, with a differential, higher cytotoxic response against proteins M 420
and N, not associated with antibody responses to the spike protein. 421
422

18
Discussion 423
424
It is clear from our study as well as from others (24) children do get infected by SARS-CoV-425
2, and thus possibly contribute to the community-based spread of the virus, contrary to what 426
has been suggested by studies on the low nasal ACE2 expression in children (25). The lower 427
rates of infection in children can be biased by lower testing, as suggested by (26), and should 428
be more carefully studied, given its importance for planning school openings. Our findings on 429
the more naïve, non-specific lymphocyte profile presented by in children, if taken isolated from 430
the other results in this study, could indicate that a naive immune system does better than an 431
old one, as has been suggested (9) – that children would be better equipped to mount fast and 432
efficient immune responses to rapidly clear the virus. However, one prediction from this 433
hypothesis is that children would be more likely to present mild forms of all viral diseases, and 434
this is not the case. While milder manifestations are observed in MERS, SARS, and varicella, 435
the opposite is observed for infection with poliovirus, and also respiratory viruses, especially 436
influenza and respiratory syncytial virus (RSV) - reviewed in (6). 437
Our data indicate the possibility that not only the adaptive but also their innate immune system 438
has relevant characteristics that enabled children to mount an efficient immune response and 439
control the infection. The important differences observed for dendritic cells might offer an 440
important clue. DCs play crucial roles in initiating and shaping the adaptive response, and 441
subpopulations of DCs, especially pDC, are determinants for the generation of efficient 442
antiviral responses, being one of the main sources of type I interferon (27). A previous study 443
in COVID-19 adult patients indicated decreased activation and numbers of DCs (28). In our 444
study, children consistently showed higher frequencies of DCs, including pDCs, compared to 445
adults. High HLA-DR expression is characteristic of mature DCs; as they become activated by 446
engagement of pattern recognizing receptors, HLA-DR first increases, and then decreases as 447
19
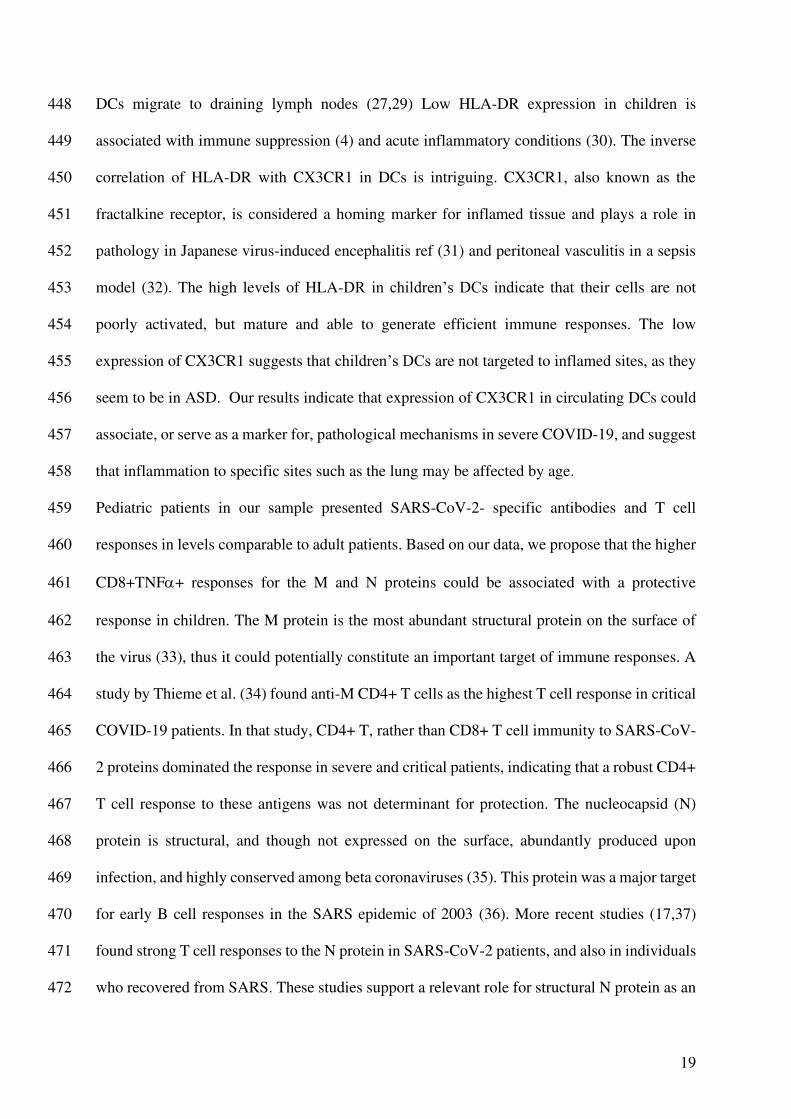
DCs migrate to draining lymph nodes (27,29) Low HLA-DR expression in children is 448
associated with immune suppression (4) and acute inflammatory conditions (30). The inverse 449
correlation of HLA-DR with CX3CR1 in DCs is intriguing. CX3CR1, also known as the 450
fractalkine receptor, is considered a homing marker for inflamed tissue and plays a role in 451
pathology in Japanese virus-induced encephalitis ref (31) and peritoneal vasculitis in a sepsis 452
model (32). The high levels of HLA-DR in children’s DCs indicate that their cells are not 453
poorly activated, but mature and able to generate efficient immune responses. The low 454
expression of CX3CR1 suggests that children’s DCs are not targeted to inflamed sites, as they 455
seem to be in ASD. Our results indicate that expression of CX3CR1 in circulating DCs could 456
associate, or serve as a marker for, pathological mechanisms in severe COVID-19, and suggest 457
that inflammation to specific sites such as the lung may be affected by age. 458
Pediatric patients in our sample presented SARS-CoV-2- specific antibodies and T cell 459
responses in levels comparable to adult patients. Based on our data, we propose that the higher 460
CD8+TNF+ responses for the M and N proteins could be associated with a protective 461
response in children. The M protein is the most abundant structural protein on the surface of 462
the virus (33), thus it could potentially constitute an important target of immune responses. A 463
study by Thieme et al. (34) found anti-M CD4+ T cells as the highest T cell response in critical 464
COVID-19 patients. In that study, CD4+ T, rather than CD8+ T cell immunity to SARS-CoV-465
2 proteins dominated the response in severe and critical patients, indicating that a robust CD4+ 466
T cell response to these antigens was not determinant for protection. The nucleocapsid (N) 467
protein is structural, and though not expressed on the surface, abundantly produced upon 468
infection, and highly conserved among beta coronaviruses (35). This protein was a major target 469
for early B cell responses in the SARS epidemic of 2003 (36). More recent studies (17,37) 470
found strong T cell responses to the N protein in SARS-CoV-2 patients, and also in individuals 471
who recovered from SARS. These studies support a relevant role for structural N protein as an 472

20
immune target in SARS-CoV-2 infection. We found robust antibody responses in children both 473
to the S RBD as well as to the N protein, while Weisberg et al. (9) found antibodies to the S, 474
but not the N protein; and Cohen et al. (38) found lower responses in children in general. These 475
differences, as well as a lower response to the S protein in general in our sample, may reflect 476
differences in HLA between American and Brazilian populations, or even a difference in 477
immunization history, given a tradition in vaccination program for children in Brazil. The 478
correlations of antibody responses with CD4+ T cells are somewhat expected, given the help 479
needed for antibody production, and indicate that these responses are somewhat coordinated, 480
but also that not all antibodies produced are linked to TNF or INF help. Our next studies will 481
focus on further characterizing this antibody response in detail. The inverse correlation between 482
specific CD8+ T cell responses and antibodies may indicate a relevant role for cytotoxic 483
immunity against SARS-CoV-2, beyond antibody production. 484
Children are considered the natural reservoir of seasonal coronaviruses that cause the common 485
cold (4). A hypothesis frequently raised to explain milder disease in children with COVID-19 486
is that the presence of neutralizing antibodies to such viruses could cross-protect them upon 487
infection with SARS-CoV-2. However, a recent study in adults found no evidence of cross-488
protection associated with levels of these antibodies (39). Alternatively, protection could be 489
conferred not by cross-reactive antibodies, but rather by pre-existing N-protein-specific T cells. 490
Most studies - and most vaccines - have so far focused on protection against SARS-CoV-2 491
infection by antibodies to the spike protein. Both screen studies by Ferreti et al. and Ng et al. 492
indicated that T cell immunity to SARS-CoV-2 infected individuals includes many targets 493
outside the spike protein and that they are not conserved among coronaviruses that cause the 494
common cold. These findings are in agreement with the ones of the Le Bert study. Our results 495
support that the role of T cell responses to the N protein must be further investigated, with a 496
more detailed T cell epitope mapping. Such work might reveal additional correlates of 497

21
protection, and/or epitopes to add in the next generation of COVID-19 vaccines. A recent report 498
(40) indicated that T cell immunity was not markedly affected, so far, by the emergence of new 499
variants, supporting the study of T cell epitopes to be added to the next vaccines. 500
The main limitation of this study is that it is mostly an exploratory, descriptive one, and 501
compares individuals in different age groups. We believe this was a valid approach given the 502
magnitude of what is unknown at the moment. Usually, biomarkers in peripheral blood are 503
only useful when highly correlated with outcomes. Yet, most studies that seek to understand 504
how immune responses can correlate with protection compare adult s with mild and severe 505
disease, and it is known that these are in different age groups. At present, the best age-matched 506
controls for SARS-CoV-2 infected patients are still unknown. Certainly, the absence of a pre-507
pandemic healthy children control group is a limitation of this and all the other studies that 508
focused on the general, non-specific immune profile of children with COVID-19. There is still 509
much to be understood about immunological differences not only between pediatric and adult 510
COVID-19 patients but also in other diseases. In this sense, we believe our work contributes 511
significant information which was collected in a completely unbiased investigation - we did 512
not know what differences or similarities to expect. At the time the project started, COVID-19 513
numbers in Brazil were still not high and the frequency of MISC patients or children with 514
severe manifestations of the disease was still too low to include. Inclusion of patients was 515
easiest in ASD because they were admitted to the hospital, thus their time of symptoms to 516
sample collection is shorter compared to AMD and children. However, we do not think this 517
was a major influence in the results - if so, differences would have been highest between ASD 518
and AMD, and that was not the case. Finally, these results are based on a single point of 519
collection and we still do not know how they will evolve into the memory responses that will 520
be ultimately generated. The study on this cohort is still ongoing, with two more points of 521
sample collection. We expect that further analysis of our data, as well as other studies’, on 522

22
immune profile data and specific responses, will bring relevant information on the generation 523
of immune memory in pediatric COVID-19. 524
525
Acknowledgments 526
Funding for this study was provided by PROADI - HMV, and the Ministry of Health; 527
fellowships for Karina Lima, Julia Fontoura, Renato Stein, and Cristina Bonorino are from 528
CNPq; fellowships for Gabriel Hilario, Priscila Oliveira, and Tiago Fazolo are from CAPES. 529
TJB is a recipient of an American Heart Association fellowship grant. We wish to thank Drs. 530
André Báfica, Daniel Mansur, Helder Nakaya, Leo Riella, Graham Pawelec and Steve Hedrick 531
for critical readings of this manuscript. Finally, we wish to thank all the patients who accepted 532
to enroll in the study and donate blood. 533
534
535
536
537
538
539
540
541
542
543
544
545
546
547

23
Tables 548
549
Table 1. Clinical characteristics of all patients in this study. 550
Supplementary Table 1. Principal Component Analysis (PCA) variances and loading. 551
552
Figures 553
554
Main figures 555
1. Experimental approach and differential immune profile of children, mild and adult patients 556
by principal component analysis. 557
2.Analysis of variance of the main variables contributing to principal components. 558
3. Principal Component Analysis of innate cells immune signatures. 559
4. Antibody responses. 560
5. Specific T cell responses. 561
6. Anti-N IgG response and correlation of specific responses. 562
563
Supplementary figures 564
1. Gating strategies for the key cell populations. 565
2. Spearman correlation of all variables composing the immune profile. 566
3. Principal Component Analysis of adaptive cells immune signatures. 567
4. Analysis of variance (Kruskall-Wallis) of remaining immune variables. 568
5. Control gate strategies for flow cytometry analysis of specific T cell responses. 569
6. Comparison of specific T cell responses by effector T cell type among the groups. 570
571
572

24
References 573
1. Zhou F, Yu T, Du R, Fan G, Liu Y, Liu Z, et al. Clinical course and risk factors for 574
mortality of adult inpatients with COVID-19 in Wuhan, China: a retrospective cohort 575
study. Lancet. 2020;395(10229):1054–62. 576
2. World Health Organization. WHO Coronavirus (COVID-19) Dashboard [Internet]. 577
Available from: https://covid19.who.int/ 578
3. Bialek S, Boundy E, Bowen V, Chow N, Cohn A, Dowling N, et al. Severe Outcomes 579
Among Patients with Coronavirus Disease 2019 (COVID-19) — United States, 580
February 12–March 16, 2020. MMWR Morb Mortal Wkly Rep. 2020;69(12):343–6. 581
4. Zimmermann P, Curtis N. COVID-19 in Children, Pregnancy and Neonates: A Review 582
of Epidemiologic and Clinical Features. Pediatr Infect Dis J. 2020;39(6):469–77. 583
5. Cheung EW, Zachariah P, Gorelik M, Boneparth A, Kernie SG, Orange JS, et al. 584
Multisystem Inflammatory Syndrome Related to COVID-19 in Previously Healthy 585
Children and Adolescents in New York City. JAMA - J Am Med Assoc. 586
2020;324(3):294–6. 587
6. Singh T, Heston SM, Langel SN, Blasi M, Hurst JH, Fouda GG, et al. Lessons from 588
COVID-19 in Children: Key Hypotheses to Guide Preventative and Therapeutic 589
Strategies. Clin Infect Dis. 2020;71(8):2006–13. 590
7. Zimmermann P, Curtis N. Why is COVID-19 less severe in children? A review of the 591
proposed mechanisms underlying the age-related difference in severity of SARS-CoV-592
2 infections. Arch Dis Child. 2020;1–11. 593
8. Schouten LR, van Kaam AH, Kohse F, Veltkamp F, Bos LD, de Beer FM, et al. Age-594
dependent differences in pulmonary host responses in ARDS: a prospective 595
observational cohort study. Ann Intensive Care. 2019;9(1). 596
9. Weisberg SP, Connors TJ, Zhu Y, Baldwin MR, Lin WH, Wontakal S, et al. Distinct 597

25
antibody responses to SARS-CoV-2 in children and adults across the COVID-19 598
clinical spectrum. Nat Immunol. 2021;22(1):25–31. 599
10. Ng KW, Faulkner N, Cornish GH, Rosa A, Harvey R, Hussain S, et al. Pre-existing 600
and de novo humoral immunity to SARS-CoV-2 in humans. bioRxiv. 601
2020;1343(December):1339–43. 602
11. Grifoni A, Weiskopf D, Ramirez SI, Mateus J, Dan JM, Moderbacher CR, et al. 603
Targets of T Cell Responses to SARS-CoV-2 Coronavirus in Humans with COVID-19 604
Disease and Unexposed Individuals. Cell. 2020;181(7):1489-1501.e15. 605
12. Hartley GE, Edwards ESJ, Aui PM, Varese N, Stojanovic S, McMahon J, et al. Rapid 606
generation of durable B cell memory to SARS-CoV-2 spike and nucleocapsid proteins 607
in COVID-19 and convalescence. Sci Immunol. 2020;5(54):1–15. 608
13. Lucas C, Wong P, Klein J, Castro TBR, Silva J, Sundaram M, et al. Longitudinal 609
analyses reveal immunological misfiring in severe COVID-19. Nature. 610
2020;584(7821):463–9. 611
14. Rodda LB, Netland J, Shehata L, Pruner KB, Morawski PA, Thouvenel CD, et al. 612
Functional SARS-CoV-2-Specific Immune Memory Persists after Mild COVID-19. 613
Cell. 2021. 614
15. Definitions C. WHO-2019-nCoV-Surveillance_Case_Definition-2020.2-eng. 615
2020;(December):2020. 616
16. Amanat F, Stadlbauer D, Strohmeier S, Nguyen THO, Chromikova V, McMahon M, et 617
al. A serological assay to detect SARS-CoV-2 seroconversion in humans. Nat Med. 618
2020. 619
17. Stadlbauer D, Amanat F, Chromikova V, Jiang K, Strohmeier S, Arunkumar GA, et al. 620
SARS-CoV-2 Seroconversion in Humans: A Detailed Protocol for a Serological 621
Assay, Antigen Production, and Test Setup. Curr Protoc Microbiol. 2020;57(1):1–15. 622

26
18. Champagne P, Ogg GS, King AS, Knabenhans C, Ellefsen K, Nobile M, et al. Skewed 623
maturation of memory HIV-specific CD8 T lymphocytes. Nature. 624
2001;410(6824):106–11. 625
19. Miller JD, van der Most RG, Akondy RS, Glidewell JT, Albott S, Masopust D, et al. 626
Human Effector and Memory CD8+ T Cell Responses to Smallpox and Yellow Fever 627
Vaccines. Immunity. 2008;28(5):710–22. 628
20. Weiskopf D, Bangs DJ, Sidney J, Kolla R V., De Silva AD, De Silva AM, et al. 629
Dengue virus infection elicits highly polarized CX3CR1+ cytotoxic CD4+ T cells 630
associated with protective immunity. Proc Natl Acad Sci U S A. 2015;112(31):E4256–631
63. 632
21. Huang AT, Garcia-Carreras B, Hitchings MDT, Yang B, Katzelnick L, Rattigan SM, 633
et al. A systematic review of antibody mediated immunity to coronaviruses: antibody 634
kinetics, correlates of protection, and association of antibody responses with severity 635
of disease. medRxiv. 2020;2020.04.14.20065771. 636
22. Mathew D, Giles JR, Baxter AE, Oldridge DA, Greenplate AR, Wu JE, et al. Deep 637
immune profiling of COVID-19 patients reveals distinct immunotypes with therapeutic 638
implications. Science (80- ). 2020;369(6508). 639
23. Le Bert N, Tan AT, Kunasegaran K, Tham CYL, Hafezi M, Chia A, et al. SARS-CoV-640
2-specific T cell immunity in cases of COVID-19 and SARS, and uninfected controls. 641
Nature. 2020;584(7821):457–62. 642
24. Dong Y, Dong Y, Mo X, Hu Y, Qi X, Jiang F, et al. Epidemiology of COVID-19 643
among children in China. Pediatrics. 2020;145(6). 644
25. Bunyavanich S, Do A, Vicencio A. Nasal Gene Expression of Angiotensin-Converting 645
Enzyme 2 in Children and Adults. JAMA - Journal of the American Medical 646
Association. 2020. 647

27
26. Hyde Z. COVID-19, children and schools: overlooked and at risk. Med J Aust. 2020. 648
27. Liu YJ. Dendritic cell subsets and lineages, and their functions in innate and adaptive 649
immunity. Cell. 2001;106(3):259–62. 650
28. Zhou R, To KKW, Wong YC, Liu L, Zhou B, Li X, et al. Acute SARS-CoV-2 651
Infection Impairs Dendritic Cell and T Cell Responses. Immunity. 2020;53(4):864-652
877.e5. 653
29. Steinman RM. Decisions about dendritic cells: Past, present, and future. Annu Rev 654
Immunol. 2012;30:1–22. 655
30. Boeddha NP, Kerklaan D, Dunbar A, van Puffelen E, Nagtzaam NMA, Vanhorebeek I, 656
et al. HLA-DR Expression on Monocyte Subsets in Critically Ill Children. Pediatr 657
Infect Dis J. 2018;37(10):1034–40. 658
31. Choi JY, Kim JH, Hossain FMA, Uyangaa E, Park SO, Kim B, et al. Indispensable 659
role of CX3CR1+ dendritic cells in regulation of virus-induced neuroinflammation 660
through rapid development of antiviral immunity in peripheral lymphoid tissues. Front 661
Immunol. 2019;10(JUN):1–24. 662
32. Hamon P, Loyher PL, De Chanville CB, Licata F, Combadìere C, Boissonnas A. 663
CX3CR1-dependent endothelial margination modulates Ly6Chigh monocyte systemic 664
deployment upon inflammation in mice. Blood. 2017;129(10):1296–307. 665
33. Hu Y, Wen J, Tang L, Zhang H, Zhang X, Li Y, et al. The M protein of SARS-CoV: 666
basic structural and immunological properties. Genomics, proteomics Bioinforma / 667
Beijing Genomics Inst. 2003;1(2):118–30. 668
34. Thieme CJ, Anft M, Paniskaki K, Blazquez-Navarro A, Doevelaar A, Seibert FS, et al. 669
Robust T Cell Response Toward Spike, Membrane, and Nucleocapsid SARS-CoV-2 670
Proteins Is Not Associated with Recovery in Critical COVID-19 Patients. Cell Reports 671
Med. 2020;1(6):100092. 672

28
35. De Wit E, Van Doremalen N, Falzarano D, Munster VJ. SARS and MERS: Recent 673
insights into emerging coronaviruses. Nat Rev Microbiol. 2016;14(8):523–34. 674
36. Wu HS, Hsieh YC, Su IJ, Lin TH, Chiu SC, Hsu YF, et al. Early detection of 675
antibodies against various structural proteins of the SARS-associated coronavirus in 676
SARS patients. J Biomed Sci. 2004;11(1):117–26. 677
37. Ferretti AP, Kula T, Wang Y, Nguyen DMV, Weinheimer A, Dunlap GS, et al. 678
Unbiased Screens Show CD8+ T Cells of COVID-19 Patients Recognize Shared 679
Epitopes in SARS-CoV-2 that Largely Reside outside the Spike Protein. Immunity. 680
2020. 681
38. Cohen CA, Li AP, Hachim A, Hui DS, Kwan MY, Tsang OT, et al. SARS-CoV-2 682
specific T cell responses are lower in children and increase with age and time after 683
infection. medRxiv Prepr Serv Heal Sci. 2021. 684
39. Anderson EM, Goodwin EC, Verma A, Arevalo CP, Bolton MJ, Weirick ME, et al. 685
Seasonal human coronavirus antibodies are boosted upon SARS-CoV-2 infection but 686
not associated with protection. Cell. 2021;1858–64. 687
40. Alison Tarke A, Sidney J, Methot N, Zhang Y, Dan JM, Goodwin B, et al. Negligible 688
impact of SARS-CoV-2 variants on CD4 + and CD8 + T cell reactivity in COVID-19 689
exposed donors and vaccinees. bioRxiv. 2021;2021.02.27.433180. 690
691
29
692
Figure 1: Experimental approach and differential immune profile of children, mild and 693
adult patients by principal component analysis. A, Graphical representation of the study 694
design; B-E, Principal component analysis of the clusters of pediatric (purple) and adult 695
patients with mild (green) and severe (red) disease; each dot represents a patient, color 696
coded. B, distribution of clusters by PC1 and PC2; C, 3D representation including PC1, 2 697
and 3; D, two-dimensional plot of patients according to PC3 by PC1; E, comparison of 698
scores for each PC by analysis of variance (Kruskal-Wallis). F-G, Contribution of variables 699
(loadings) to PC1xPC2 (F) and PC1xPC3 (G). Each blue dot is a variable. Variables with 700
the highest contributions (negative or positive) to each PC are specified. P values are 701
indicated over brackets. 702
A
B C D
E G F
30
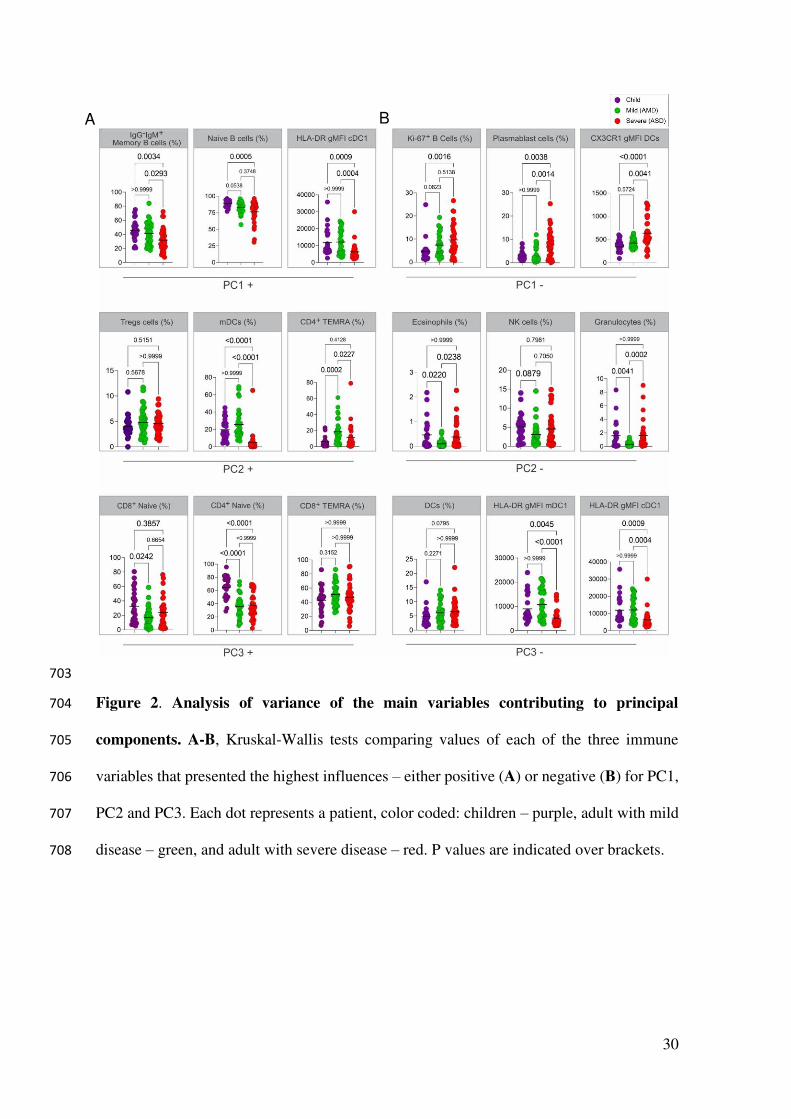
703
Figure 2. Analysis of variance of the main variables contributing to principal 704
components. A-B, Kruskal-Wallis tests comparing values of each of the three immune 705
variables that presented the highest influences – either positive (A) or negative (B) for PC1, 706
PC2 and PC3. Each dot represents a patient, color coded: children – purple, adult with mild 707
disease – green, and adult with severe disease – red. P values are indicated over brackets. 708
A B

31
709
Figure 3. Principal Component Analysis of innate cells immune signatures. A-G, 710
Principal component analysis of the clusters of patients (each dot representing a patient, 711
color coded), according to the immune signatures (A, Granu+Mono, Granulocytes and 712
Monocytes; B, NK cells; C, Dendritic Cells; D, Spearman correlation analysis of HLA-DR 713
and CX3CR1 expression in DCS. For each signature, are displayed the PCA plot of 714
PC1xPC2, the differences in scores of individuals for each PC; the loadings of the main 715
variables contributing to each PC and Kruskal-Wallis tests comparisons of the major 716
contributing variables values for each group of patients. 717
D
A
B
C

32
718
Figure 4. Antibody responses. SARS-CoV-2 spike RBD IgA and IgG antibody titers 719
determined by ELISA using serial dilutions of plasma. Individual titration curves for each 720
individual (represented by a line, color coded) and analysis of variance (Kruskal-Wallis) of 721
the values calculated as the area under the curve (AUC) for IgA (A) and IgG (B) are 722
displayed. P values are displayed over brackets. 723
A
B

33
724
A
B

34
725
Figure 5. Specific T cell responses. A, gating strategies and typical plots of CD4+ and 726
CD8+ T cells stimulated with peptide pools from structural proteins spike (S), membrane 727
(M) and nucleocapsid (N), and analyzed by flow cytometry for cytokine production. B, 728
Comparisons of effector T cells in each group - percentages of CD4+ or CD8+ cells, 729
producing INF, TNF or IL-17 in response to stimulation by each peptide pool. Each dot 730
represents a patient, color coded: purple for children; green for adults with mild disease and 731
red for adults with severe disease. All analyses are Kruskal-Wallis tests, and the p values are 732
indicated over brackets. Significant differences are indicated by p values in a higher font. 733

35
734
A
B
36
735
Figure 6. Anti-N IgG response and correlation of specific responses. A, SARS-CoV-2 736
anti-N IgG antibody titers determined by ELISA using serial dilutions of plasma. Individual 737
titration curves for each individual (represented by a line, color coded) and analysis of 738
variance (Kruskal-Wallis) of the values calculated as the area under the curve (AUC) for 739
IgG (A) are displayed. P values are displayed over brackets. B, Matrix representing a 740
Spearman correlation analysis of specific effector T cells responses (in percentages of 741
positive CD4+ and CD8+ positive cytokine expressing cells in response to peptide pools) 742
and the antibody response to the RBD of the spike protein and to the N protein (represented 743
as values for the AUC). Correlations between the specific effector CD8+ T and CD4+ T 744
cells frequencies, and the antibody (AUC – area under the curve) values for the RBD and N 745
protein are highlighted. 746

37
747
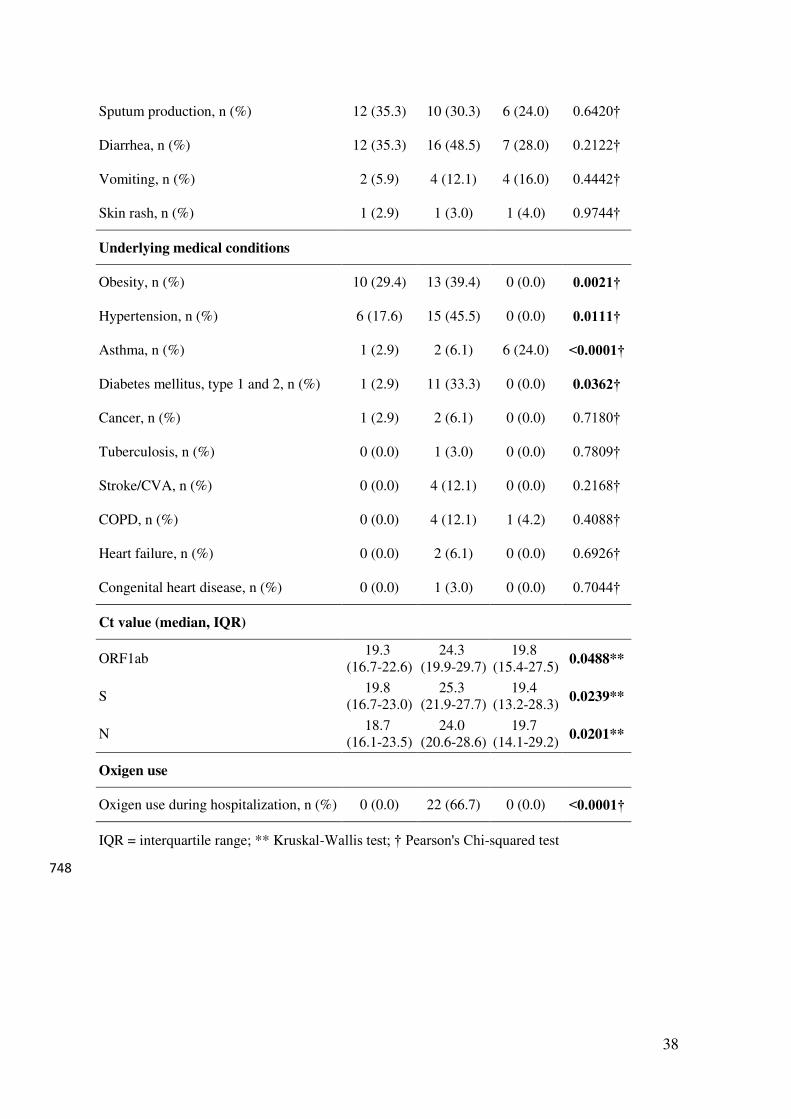
Table 1. Clinical characteristics of all patients in this study.
Characteristics Mild
(n = 34) Severe (n = 33)
Children (n = 25)
P-value
Age (y), median (IQR) 37.8
(27.0-44.6) 60.8
(38.8-75.9) 9.0
(1.5-13.5) <0.0001*
Female sex, n (%) 22 (64.7) 17 (51.5) 10 (42.0) 0.1657†
Active or passive smoking, n (%) 2 (5.9) 6 (18.2) 3 (12.0) 0.0791†
Racial or ethnic group
Caucasian, n (%) 28 (82.4) 20 (60.6) 17 (68.0) 0.1129†
Non-caucasian, n (%) 4 (11.8) 1 (3.0) 5 (20.0)
Days from of symptom onset to sample collection
Days, median (IQR) 18.0
(16.0-20.5) 10.0
(7.5-14.0) 15.0
(8.5-17.5) <0.0001**
Symptoms
Headache, n (%) 32 (94.1) 23 (69.7) 14 (56.0) 0.0262†
Myalgia, n (%) 30 (88.2) 20 (60.6) 9 (36.0) 0.0030†
Malaise, n (%) 28 (82.4) 31 (93.9) 14 (56.0) 0.0006†
Coryza, n (%) 26 (76.5) 18 (54.5) 16 (64.0) 0.2167†
Cough, n (%) 25 (73.5) 30 (90.9) 17 (68.0) 0.0782†
Fever, n (%) 23 (67.6) 26 (78.8) 20 (80.0) 0.4899†
Chills, n (%) 21 (61.8) 20 (60.6) 9 (36.0) 0.0823†
Dyspnea, n (%) 20 (58.8) 22 (66.7) 4 (16.0) 0.0003†
Dysgeusia, n (%) 20 (58.8) 12 (36.4) 6 (24.0) 0.1580†
Sore throat, n (%) 19 (55.9) 12 (36.4) 11 (44.0) 0.2986†
Appetite loss, n (%) 19 (55.9) 21 (63.6) 13 (52.0) 0.6226†
Anosmia, n (%) 19 (55.9) 11 (33.3) 6 (24.0) 0.1841†
Stuffy nose, n (%) 17 (50.0) 11 (33.3) 13 (52.0) 0.3868†
Conjuctivitis, n (%) 16 (47.1) 10 (30.3) 7 (28.0) 0.2465†
Nausea, n (%) 14 (41.2) 12 (36.4) 7 (28.0) 0.7791†
38
Sputum production, n (%) 12 (35.3) 10 (30.3) 6 (24.0) 0.6420†
Diarrhea, n (%) 12 (35.3) 16 (48.5) 7 (28.0) 0.2122†
Vomiting, n (%) 2 (5.9) 4 (12.1) 4 (16.0) 0.4442†
Skin rash, n (%) 1 (2.9) 1 (3.0) 1 (4.0) 0.9744†
Underlying medical conditions
Obesity, n (%) 10 (29.4) 13 (39.4) 0 (0.0) 0.0021†
Hypertension, n (%) 6 (17.6) 15 (45.5) 0 (0.0) 0.0111†
Asthma, n (%) 1 (2.9) 2 (6.1) 6 (24.0) <0.0001†
Diabetes mellitus, type 1 and 2, n (%) 1 (2.9) 11 (33.3) 0 (0.0) 0.0362†
Cancer, n (%) 1 (2.9) 2 (6.1) 0 (0.0) 0.7180†
Tuberculosis, n (%) 0 (0.0) 1 (3.0) 0 (0.0) 0.7809†
Stroke/CVA, n (%) 0 (0.0) 4 (12.1) 0 (0.0) 0.2168†
COPD, n (%) 0 (0.0) 4 (12.1) 1 (4.2) 0.4088†
Heart failure, n (%) 0 (0.0) 2 (6.1) 0 (0.0) 0.6926†
Congenital heart disease, n (%) 0 (0.0) 1 (3.0) 0 (0.0) 0.7044†
Ct value (median, IQR)
ORF1ab 19.3
(16.7-22.6) 24.3
(19.9-29.7) 19.8
(15.4-27.5) 0.0488**
S 19.8
(16.7-23.0) 25.3
(21.9-27.7) 19.4
(13.2-28.3) 0.0239**
N 18.7
(16.1-23.5) 24.0
(20.6-28.6) 19.7
(14.1-29.2) 0.0201**
Oxigen use
Oxigen use during hospitalization, n (%) 0 (0.0) 22 (66.7) 0 (0.0) <0.0001†
IQR = interquartile range; ** Kruskal-Wallis test; † Pearson's Chi-squared test
748

39
749
A
B
C
D
E

40
750
H
G
F

41
751
Supplementary Figure 1. Gating strategies for the key cell populations described in 752
Fig. 1-4, Fig. 6A-B, Fig. 7, and other supplementary figures. A, Gating strategy to 753
identify all populations described in B-H. B, B and T cell surface staining gating strategy to 754
identify B cells proliferation, CD4 and CD8 T cells, proliferation and TCR-activated T cells. 755
C, T cell surface staining gating strategy to identify CD4 and CD8 T cells producing 756
granzyme B and perforin in the population with or without TCR-activated T cells. D, B cell 757
surface staining gating strategy to identify B10 cells, plasmablasts, transitional B cells, IgM 758
cells, IgG cells, memory and naive cells populations. E, T cell surface staining gating 759
strategy to identify Treg and TFH CD4 cells population. F, DCs surface staining gating 760
strategy to identify differences in HLA-DR and CX3CR1 expression in DCs, mDC and 761
pDCs cell populations. G, Innate cells and T surface staining gating strategy to identify NK 762
cells, NK T cells, Eosinophils, Neutrophils and Monocytes populations. H, T cell surface 763
staining gating strategy to identify differences in CD137 and CD69 expression in CD4 and 764
CD8 T cells effector memory, central memory, terminally differentiated and naive 765
population. 766

42
767
768
769
1 PBMCs 27 Naive B Cells 53 HLA-DR+ NK Cells
2 T cells 28 PD-1+ CD4+ T 54 CX3CR1+ NK T cells
3 CD4+ 29 Tfh cells 55 CD66+ Granulocytes
4 Ki-67+ CD4+ 30 ICOS+ Tfh cells 56 CD66b+ CD16 hi Neutrophils
5 TCR-activated CD4+ 31 Treg 57 CD66b+ CD16 int Neutrophils
6 TCR-activated Ki-67+ CD4+ 32 CXCR5+ Treg 58 CD66b+ CD16 low Eosinophils
7 CD8+ 33 DCs 59 Classical Monocytes
8 Ki-67+ CD8+ 34 CX3CR1 gMFI DCs 60 Intermediate Monocytes
9 TCR-activated CD8+ 35 HLA-DR gMFI DCs 61 NC Monocytes
10 TCR-activated Ki-67+ CD8+ 36 mDCs 62 CX3CR1+ Classical Monocytes
11 GranzB+Perf+ CD4+ 37 CX3CR1 gMFI mDCs 63 CX3CR1+ Intermediate Monocytes
12 TCR-activated GranzB+Perf+
CD4+ 38 HLA-DR gMFI mDCs 64 CX3CR1+ NC Monocytes
13 GranzB+Perf+ CD8+ 39 cDC1 65 CX3CR1+ T cells
14 TCR-activated GranzB+Perf+
CD8+ 40 CX3CR1 gMFI cDC1 66 CD4+ TCM
15 B cells 41 HLA-DR gMFI cDC1 67 CD4+ T Naive
16 Ki-67+ B cells 42 Non cDC1 68 CD4+ TEMRA
17 B10 cells 43 CX3CR1 gMFI Non cDC1 69 CD4+ TEM
18 Plasmoblasts 44 HLA-DR gMFI Non cDC1 70 CD69+ gMFI CD4+ TEM
19 IgG-IgM+ B cells 45 pDCs 71 CD137+ gMFI CD4+ TEM
20 IgG+IgM+ B cells 46 CX3CR1 gMFI pDCs 72 CD8+
21 IgG+IgM- B cells 47 HLA-DR gMFI pDCs 73 CD8+ TCM
22 Transitional B cells 48 NK cells 74 CD8+ T Naive
23 Memory B cells 49 CD16+NK cells 75 CD8+ TEMRA
24 IgG-IgM+ Memory B cells 50 CD16- NK cells 76 CD8+ TEM
25 IgG+IgM+ Memory B cells 51 NK T cells 77 CD69+ gMFI CD8+ TEM
26 IgG+IgM- Memory B cells 52 CX3CR1+ NK Cells 78 CD137+ gMFI CD8+ TEM
A
B
43
770
Supplementary Figure 2. Spearman correlation of all variables composing the immune 771
profile. A, Clusters of more correlated variables are outlined and identified in a Spearman 772
correlation matrix of all variables. B, List of immune variables indicated by numbers by 773
which they are plotted on the matrix. 774

44
775
A
C
B

45
776
Supplementary Figure 3. Principal Component Analysis of adaptive cells immune 777
signatures. A, B cells; B, Proliferating/activated T cells; and C, Memory T cells). For each 778
signature, are displayed the PCA plot of PC1xPC2, the differences in scores of individuals 779
for each PC; the loadings of the main variables contributing to each PC; and Kruskal-Wallis 780
tests comparisons of the major contributing variables values for each group of patients. 781

46
782

47
783

48
784
Supplementary Figure 4. Analysis of variance (Kruskall-Wallis) of remaining immune 785
variables. Analysis of variance of the values for immune variables (in percentages or gMFI) 786
that were lesser influencers of the three first principal components and thus not included in 787
the main figures. 788

49
789
Supplementary Figure 5. Control gate strategies for flow cytometry analysis of specific 790
T cell responses. Negative (DMSO) and positive (PMA+Ionomycin) controls gate 791
strategies and representative plots of CD4+ or CD8+ T cell simulations. 792
50
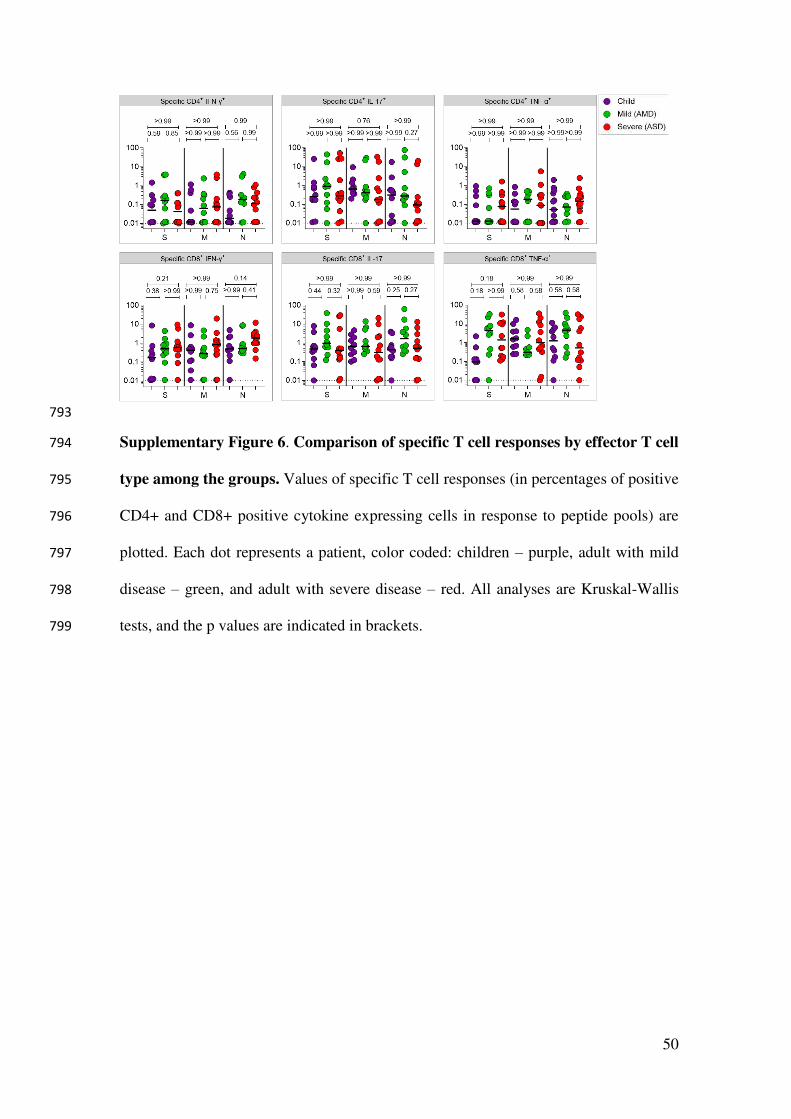
793
Supplementary Figure 6. Comparison of specific T cell responses by effector T cell 794
type among the groups. Values of specific T cell responses (in percentages of positive 795
CD4+ and CD8+ positive cytokine expressing cells in response to peptide pools) are 796
plotted. Each dot represents a patient, color coded: children – purple, adult with mild 797
disease – green, and adult with severe disease – red. All analyses are Kruskal-Wallis 798
tests, and the p values are indicated in brackets. 799

51
Supplementary Table 1. Principal Component Analysis (PCA) variances and loading.
PCA all variables
Positive
(loadings)
PC1 1 2 3 PC2 1 2 3 PC3 1 2 3
Memory B
IgG-IgM+
Naïve B
cells
cDC1
gMFI DR Treg mDC
CD4+
TEMRA
Naïve
CD8+T
Naïve
CD4+T pDC
%cumul
variance
0.57 0.56 0.55 0.53 0.45 0.40 0.56 0.43 0.35
% variance
explained 12.16 8.53 8.12 28.81
Negative
(loadings)
PC1 1 2 3 PC2 1 2 3 PC3 1 2 3
B cells
Ki67+
Plasma
blasts
DC gMFI
CX3CR1
Eosino
phils NK cells
Granulo
cytes DCs
mDC
gMFI
DR
cDC1
gMFI
DR
-0.71 -0.58 -0.60 -0.58 -0.55 -0.48 -0.64 -0.60 -0.60
PCA Granu+Mono
Positive
(loadings)
PC1 1 2 3 PC2 1 2
Classical
Monocytes
Intermediate
Monocytes
Intermediate
Monocytes
CX3CR1+
Classical Monocytes
CX3CR1+ CD16 Int Neutrophils
%cumul
variance
0.84 0.80 0.75 0.43 0.37
% variance
explained 33.41 16.96 50.37
Negative
(loadings)
PC1 1 2 2 PC2 1 2
- - - NC Monocytes NC Monocytes
CX3CR1+
- - - -0.66 -0.64
PCA NK cells
Positive
(loadings)
PC1 1 2 3 PC2 1 2
NK Cells HLA-
DR+
NK Cells HLA-
DR+ NK CX3CR1+ NK T CX3CR1+ NK T
%cumul
variance
0.85 0.77 0.73 0.85 1.87
% variance
explained 37.42 29.94 67.35
Negative
(loadings)
PC1 1 2 3 PC2 1 2
- - - NK Cytotoxic NK Regulatory
- - - -0.43 -0.34
PCA Dendritic Cells
Positive
(loadings)
PC1 1 2 3 PC2 1 2 3
mDCs gMFI
CX3CR1
cDC1 gMFI
CX3CR1
Non cDC1
gMFI CX3CR1 pDCs mDCs cDC1
% cumul
variance
0.57 0.51 0.44 0.59 0.57 0.23

52
% variance
explained 35.81 27.36 63.17
Negative
(loadings)
PC1 1 2 3 PC2 1 2 3
mDCs gMFI DR DCs gMFI DR cDC1 gMFI DR cDC1 gMFI
CX3CR1
Non cDC1
gMFI CX3CR1
cDC1 gMFI
DR
-0.85 -0.85 -0.83 -0.60 -0.53 -0.49
PCA T cell activation + proliferation
Positive
(loadings)
PC1 1 2 3 PC2 1 2
CD4+ T HLADR+
GranB+Perf+ CD8+ T HLADR+ - CD4 T Ki67+ CD8 T Ki67+
% cumul
variance
0.76 0.64 - 0.55 0.43
% variance
explained 24.22 19.97 44.19
Negative
(loadings)
PC1 1 2 3 PC2 1 2
CD8+ T
Ki-67+ CD4+ T Ki67+
CD4+ T
HLADR+
GranB+ Perf+
CD4+ T GranB+ Perf+ CD8+ T GranB+ Perf+
-0.70 -0.67 -0.59 -0.64 -0.54
PCA B cells
Positive
(loadings)
PC1 1 2 3 PC2 1 2
B IgG- IgM+ Naive B Cells Memory B IgG-
IgM+ Memory B IgG+ IgM- -
% cumul
variance
0.82 0.69 0.67 0.75 -
% variance
explained 31.2 18.36 49.56
Negative
(loadings) PC1 1 2 3 PC2 1 2
B IgG+ IgM- Plasmablasts B cells Ki-67+ B IgG+ IgM+ Memory IgG+ IgM+
-0.75 -0.67 -0.59 -0.80 -0.57
PCA T cell memory
Positive
(loadings)
PC1 1 2 PC2 1 2
CD4+ T Naive CD8+ T Naive CD4+ TEMRA CD8+ TEMRA % cumul
variance
0.81 0.79 0.61 0.41
% variance
explained 25.38 17.1 42.49
Negative
(loadings)
PC1 1 2 PC2 1 2
CD4+ TEM CD8+ TEM CD4+ TCM CD8+ TEM
-0.76 -0.61 -0.66 -0.50

Figures
Figure 1
Experimental approach and differential immune pro�le of children, mild and adult patients by principalcomponent analysis. A, Graphical representation of the study design; B-E, Principal component analysisof the clusters of pediatric (purple) and adult patients with mild (green) and severe (red) disease; each dotrepresents a patient, color coded. B, distribution of clusters by PC1 and PC2; C, 3D representationincluding PC1, 2 and 3; D, two-dimensional plot of patients according to PC3 by PC1; E, comparison ofscores for each PC by analysis of variance (Kruskal-Wallis). F-G, Contribution of variables (loadings) toPC1xPC2 (F) and PC1xPC3 (G). Each blue dot is a variable. Variables with the highest contributions(negative or positive) to each PC are speci�ed. P values are indicated over brackets.

Figure 2
Analysis of variance of the main variables contributing to principal components. A-B, Kruskal-Wallis testscomparing values of each of the three immune variables that presented the highest in�uences – eitherpositive (A) or negative (B) for PC1, PC2 and PC3. Each dot represents a patient, color coded: children –purple, adult with mild disease – green, and adult with severe disease – red. P values are indicated overbrackets.

Figure 3
Principal Component Analysis of innate cells immune signatures. A-G, Principal component analysis ofthe clusters of patients (each dot representing a patient, color coded), according to the immunesignatures (A, Granu+Mono, Granulocytes and Monocytes; B, NK cells; C, Dendritic Cells; D, Spearmancorrelation analysis of HLA-DR and CX3CR1 expression in DCS. For each signature, are displayed the PCAplot of PC1xPC2, the differences in scores of individuals for each PC; the loadings of the main variablescontributing to each PC and Kruskal-Wallis tests comparisons of the major contributing variables valuesfor each group of patients.

Figure 4
Antibody responses. SARS-CoV-2 spike RBD IgA and IgG antibody titers determined by ELISA using serialdilutions of plasma. Individual titration curves for each individual (represented by a line, color coded) andanalysis of variance (Kruskal-Wallis) of the values calculated as the area under the curve (AUC) for IgA(A) and IgG (B) are displayed. P values are displayed over brackets.

Figure 5
Speci�c T cell responses. A, gating strategies and typical plots of CD4+ and CD8+ T cells stimulated withpeptide pools from structural proteins spike (S), membrane (M) and nucleocapsid (N), and analyzed by�ow cytometry for cytokine production. B, Comparisons of effector T cells in each group - percentages ofCD4+ or CD8+ cells, producing INFy, TNFa or IL-17 in response to stimulation by each peptide pool. Eachdot represents a patient, color coded: purple for children; green for adults with mild disease and red for
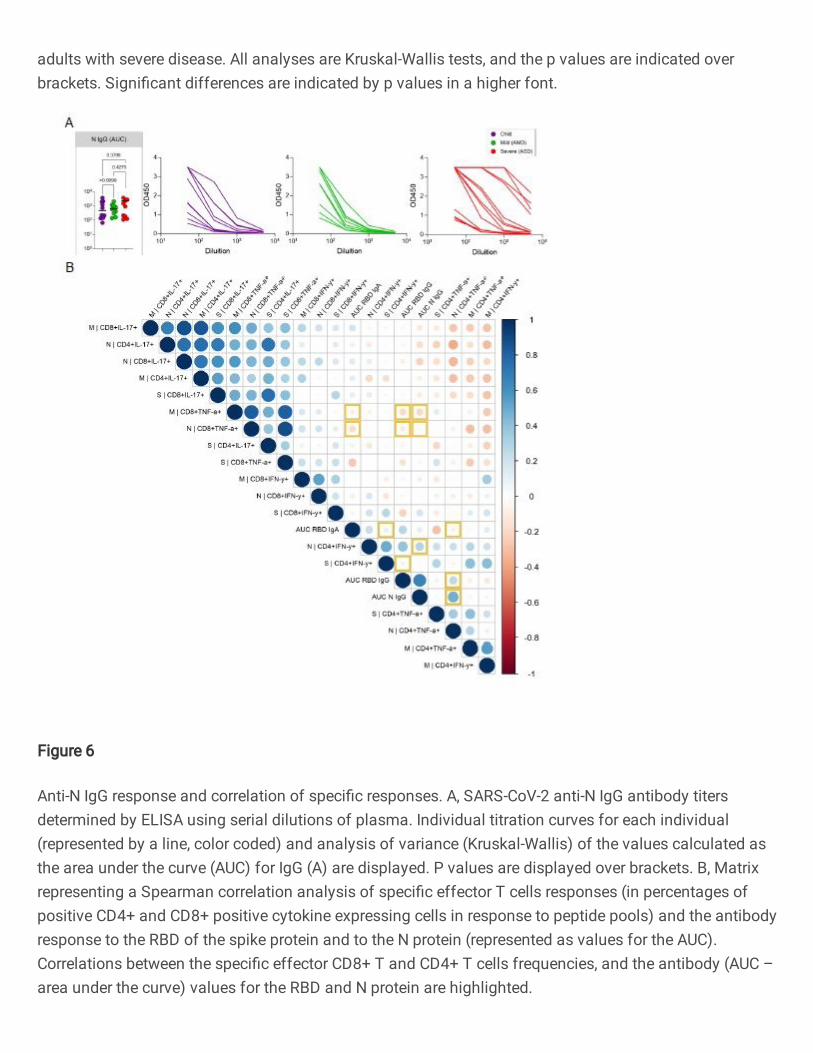
adults with severe disease. All analyses are Kruskal-Wallis tests, and the p values are indicated overbrackets. Signi�cant differences are indicated by p values in a higher font.
Figure 6
Anti-N IgG response and correlation of speci�c responses. A, SARS-CoV-2 anti-N IgG antibody titersdetermined by ELISA using serial dilutions of plasma. Individual titration curves for each individual(represented by a line, color coded) and analysis of variance (Kruskal-Wallis) of the values calculated asthe area under the curve (AUC) for IgG (A) are displayed. P values are displayed over brackets. B, Matrixrepresenting a Spearman correlation analysis of speci�c effector T cells responses (in percentages ofpositive CD4+ and CD8+ positive cytokine expressing cells in response to peptide pools) and the antibodyresponse to the RBD of the spike protein and to the N protein (represented as values for the AUC).Correlations between the speci�c effector CD8+ T and CD4+ T cells frequencies, and the antibody (AUC –area under the curve) values for the RBD and N protein are highlighted.