Strong metal-support interactions between palladium and...
28
1 Strong metal-support interactions between palladium and iron oxide and their effect on CO oxidation Raoul Naumann d’Alnoncourt a , Matthias Friedrich a , Edward Kunkes a , Dirk Rosenthal a , Frank Girgsdies a , Bingsen Zhang a , Lidong Shao a,b , Manfred Schuster a , Malte Behrens a,c , Robert Schlögl a a Fritz Haber Institute of the Max Planck Society, Department of Inorganic Chemistry, Faradayweg 4-6, 14195 Berlin, Germany b College of Environmental and Chemical Engineering, Shanghai University of Electric Power, Shanghai 200090, PR China c Universität Duisburg-Essen, Fakultät für Chemie, Universitätsstraße 5, 45141 Essen, Germany corresponding author: Matthias Friedrich, [email protected], Fritz Haber Institute of the Max Planck Society, Department of Inorganic Chemistry, Faradayweg 4-6, 14195 Berlin, Germany phone: +49 30 / 8413-4611 Abstract Pd/FeO x catalysts were prepared by co-precipitation and characterized before and after reduction using X-ray powder diffraction, thermal analysis, CO chemisorption, electron microscopy, and X-ray photoelectron spectroscopy. Results give evidence for the encapsulation of palladium particles by iron oxide after reduction at high temperatures (523 K). Oxidation of carbon monoxide was applied as test reaction to characterize catalyst samples in different states. Strong metal-support interactions significantly enhance catalytic activity for oxidation of carbon monoxide. However, this state is not stable under the applied reaction conditions. Catalyst deactivation occurs in two ways: 1. via changes in the oxidation state of iron species and 2. due to sintering of palladium particles. 1. Introduction The term “strong metal-support interactions” (SMSI) was introduced in 1978 by Tauster et al. [1]. The authors reported considerably decreased sorption capacity for CO and H 2 on Group VIII noble metals supported on TiO 2 after reduction at 773 K, compared to the state after reduction at 473 K. The effect could be reversed by calcination of the samples at 673 K. No indication for
Transcript of Strong metal-support interactions between palladium and...

1
Strong metal-support interactions between palladium and iron oxide and their effect on CO oxidation
Raoul Naumann d’Alnoncourta, Matthias Friedricha, Edward Kunkesa, Dirk Rosenthala, Frank
Girgsdiesa, Bingsen Zhanga, Lidong Shaoa,b, Manfred Schustera, Malte Behrensa,c, Robert
Schlögla a Fritz Haber Institute of the Max Planck Society, Department of Inorganic Chemistry,
Faradayweg 4-6, 14195 Berlin, Germany b College of Environmental and Chemical Engineering, Shanghai University of Electric Power,
Shanghai 200090, PR China c Universität Duisburg-Essen, Fakultät für Chemie, Universitätsstraße 5, 45141 Essen, Germany
corresponding author: Matthias Friedrich, [email protected], Fritz Haber Institute of the Max Planck Society, Department of
Inorganic Chemistry, Faradayweg 4-6, 14195 Berlin, Germany phone: +49 30 / 8413-4611
Abstract Pd/FeOx catalysts were prepared by co-precipitation and characterized before and after reduction
using X-ray powder diffraction, thermal analysis, CO chemisorption, electron microscopy, and
X-ray photoelectron spectroscopy. Results give evidence for the encapsulation of palladium
particles by iron oxide after reduction at high temperatures (523 K). Oxidation of carbon
monoxide was applied as test reaction to characterize catalyst samples in different states. Strong
metal-support interactions significantly enhance catalytic activity for oxidation of carbon
monoxide. However, this state is not stable under the applied reaction conditions. Catalyst
deactivation occurs in two ways: 1. via changes in the oxidation state of iron species and 2. due
to sintering of palladium particles.
1. Introduction The term “strong metal-support interactions” (SMSI) was introduced in 1978 by Tauster et al.
[1]. The authors reported considerably decreased sorption capacity for CO and H2 on Group VIII
noble metals supported on TiO2 after reduction at 773 K, compared to the state after reduction at
473 K. The effect could be reversed by calcination of the samples at 673 K. No indication for

2
agglomeration or sintering of the metal particles was found. The authors concluded that the
observed effect was initiated by metal-metal bonding between noble metal and titanium cations
or by to the formation of intermetallic compounds. Further studies proved that the effect was not
restricted to TiO2. In 1981, Tauster et al. showed that the occurrence of SMSI correlates with the
reducibility of transition metal oxides used as support [2]. The effect was observed for Ir
supported on Nb2O5, TiO2, Ta2O5, V2O3 or MnO, but not for Ir on ZrO2, HfO2, Y2O3 or Sc2O3. It
was concluded that the loss of sorption capacity is caused by support species migrating onto the
noble metal particles, thus reducing the accessible surface of the metal crystallites by
encapsulation, rather than electronic effects induced by metal-metal bonding [3-6]. In 1989,
Braunschweig et al. confirmed the encapsulation model for Rh on TiO2 by transmission electron
microscopy (TEM) [7]. In another TEM study, Datye et al. visualized the encapsulation of Pt by
TiO2 in the SMSI state [8].
The effects of SMSI states on catalytic properties are summarized in a review by Uchijima,
focusing on Rh and Pd supported on Nb2O5 as model catalysts [9]. In general, structure-sensitive
reactions such as hydrogenolysis of hydrocarbons or hydrogenation of CO are strongly
suppressed in the SMSI state. This effect is usually rationalized by geometric ensemble effects.
In contrast, structure-insensitive reactions, e.g. dehydrogenation/hydrogenation of hydrocarbons,
are only mildly suppressed. During CO hydrogenation by Rh/Nb2O5/SiO2 catalysts, Nb2O5 acts
as promoter after reduction at low temperature, but suppresses activity in the SMSI state via the
ensemble effect. The hydroformylation of ethylene is catalyzed by Pd/Nb2O5 in the SMSI state,
but not by Pd/Nb2O5 in the state after reduction at low temperature. Presumably, NbOx species
on the Pd surface act as ligand for CO, thus creating new reaction sites.
Freund and coworkers investigated the Pt/Fe3O4(111)/Pt(111) model system in UHV studies [10-
13]. They reported the existence of SMSI between Pt and Fe3O4. Upon annealing above 800 K,
iron oxide species formed a monolayer on the surface, thereby fully encapsulated the Pt particles
resulting in reduced CO adsorption capacity but increased CO oxidation activity. Indications for
SMSI were also found for the systems ZnO(0001)/Pt(111), MnO/Pt(111) and
Pd/FeO(111)/Pt(111) [14-16].
CO oxidation can serve as a model reaction for more complex heterogeneous reactions [17]. It
has been studied extensively using Pd as catalyst. The activity in CO oxidation on Pd on different
supports is known to be influenced by the reducibility of the support [18]. The studies range

3
from probing single crystal surfaces as well as supported catalysts. Pd supported on iron oxide is
investigated in several papers [19-26]. It was found that Pd supported on iron oxide is highly
active in CO oxidation, at temperatures unusually low even for Pd. Independent from the
pressure range, it is suggested that the reaction follows a Langmuir-Hinshelwood mechanism on
Pt group metals (Pd, Pt, Rh) [27-29]. CO is adsorbed on the metal, O2 is adsorbed on the support,
and the reaction takes place at the metal/support perimeter. The high activity of Pd on iron oxide
at low temperature is mainly attributed to the redox properties and oxygen storage capabilities of
iron oxides. Partially reduced iron oxide (i.e. Fe3O4) provides sorption sites for O2 in form of
Fe2+ ions and thereby acts as oxygen sink.
Pd supported on different iron oxides has been reported to show great potential as catalyst in
other reactions, i.e. aqueous-phase reforming of ethylene glycol [30], selective dechlorination
[31] and denitrification of water [32].
In the present study, well characterized catalyst samples of Pd supported on various iron oxides
are investigated aiming at a deeper understanding of the nature of the interaction between Pd and
iron oxide. The oxidation of CO is applied as test reaction to characterize samples in different
states. Parts of this study have already been included in a previous publication [17].
2. Experimental
2.1 Preparation PdO/α-Fe2O3 was synthesized by co-precipitation in an automated laboratory reactor system
(Labmax, Mettler Toledo). A 0.2 M metal salt solution was prepared by dissolving
Fe(NO3)3·9 H2O (Aldrich) and Pd(NO3)2 solution in 10 wt. % HNO3 (Alfa Aesar) in deionized
water to yield a final Pd content of 2 wt. % on the support. Precipitation was performed at 298 K
by simultaneously controlled drop-wise addition of the metal solution (450 mL, 10 mL/min) and
a 0.6 M NaOH solution into 400 mL deionized water. The pH was maintained at 9 during the
precipitation. The precipitate was aged for 1 h and subsequently washed with 3 batches (1 L) of
deionized water. Electric conductivity of the filtrate after the third washing step was below
0.02 mS. The washed precipitate was dried at 298 K under flowing air for 12 h and subsequently
calcined in air at 823 K for 2 h (2 K/min) to yield PdO/α-Fe2O3.
Pure hematite (α-Fe2O3) and Pd/CNT (cf. SI) were synthesized for comparison. α-Fe2O3 was
prepared in the same way as Pd/α-Fe2O3, excluding Pd in the metal nitrate solution.

4
2.2 Characterization Thermogravimetry coupled with differential scanning calorimetry (TG-DSC) was carried out in a
thermobalance (Netzsch STA 449C Jupiter) connected to a mass spectrometer (Omnistar,
Pfeiffer) and equipped with a gas mixing unit. To determine a suitable temperature for
calcination, precursor samples were heated in a stream of pure Ar (100 mL/min) from room
temperature to 1273 K with a heating rate of 10 K/min. The reduction behavior of iron oxides
was investigated by heating calcined samples in a stream of 5% H2 in Ar (100 mL/min) from
room temperature to 973 K with a heating rate of 5 K/min.
X-ray diffraction (XRD) was performed in Bragg-Brentano reflection geometry on a theta/theta
diffractometer (D8 Advance, Bruker AXS) equipped with a secondary graphite monochromator
(Cu K1+2 radiation) and scintillation detector. Larger amounts of sample powder, if available,
were filled into a cup-shaped sample holder, the surface of the powder bed being flush with the
sample holder edge. Alternatively, smaller amounts of sample were dispersed onto the surface of
a low-background single-crystal silicon sample holder. XRD data in reactive atmospheres were
collected in Bragg-Brentano reflection geometry on a STOE theta/theta X-ray diffractometer
(Cu Kα1+2 radiation, secondary graphite monochromator, scintillation counter) equipped with an
in situ reactor chamber (XRK 900, Anton Paar). The reaction gas feed was mixed by mass flow
controllers (Bronkhorst) using He as inert balance gas at a total flow rate of 100-150 mL/min.
The effluent product gas composition was monitored by a quadrupole mass spectrometer
(Omnistar, Pfeiffer). Calcined samples were investigated in the initial state, after reduction in 5%
H2 at 523 K (100 mL/min), after CO oxidation reaction in gas mixtures (150 mL/min) of 4.0%
CO/0.5% O2 and of 1.0% CO/0.5% O2 at 523 K, and finally after calcination at 673 K and
1073 K in 20% O2 (100 mL/min). All diffraction patterns were recorded at room temperature.
Data analysis was performed using the software package Topas (v 2.1, Bruker AXS). Crystallite
size values are based on the double-Voigt approach and reported as LVol-IB values (volume
weighted mean column length based on integral breadth) without further assumptions about
crystallite shape or size distribution [33]. Some samples exhibited a certain degree of anisotropic
peak broadening, i.e. the diffraction profile is not only a function of the diffraction angle 2 but
also of the direction in the crystallites and thus hkl. Such anisotropic peak broadening can be
rationalized by shape anisotropy of the crystallites. Nevertheless, the data was fitted with the
isotropic double-Voigt model for more convenient parameterization of the fit results.
5
BET measurements were carried out in a volumetric N2 physisorption set-up (Autosorb-6-B,
Quantachrome) at the temperature of liquid nitrogen. Samples were degassed in dynamic
vacuum at 423 K for 2 h prior to physisorption. Full adsorption and desorption isotherms were
measured. In general, 11 points in the linear range of the desorption isotherm were considered to
calculate the specific surface area according to the BET method [34].
CO chemisorption was carried out at 313 K in a volumetric chemisorption set-up equipped for
sample pretreatment in flowing gas (Autosorb-1-C, Quantachrome). Samples (PdO/γ-Fe2O3: 300
mg, Pd/CNT: 180 mg) were degassed in dynamic vacuum at the end temperature of the
pretreatment (reduction: RT, 423 K or 523 K, oxidation: 673 K) for 60-90 min prior to
chemisorption experiments. Two adsorption isotherms were measured at 313 K in the pressure
range of 3-747 hPa, the first isotherm corresponding to both weakly and strongly adsorbed
species and the second isotherm corresponding only to weakly adsorbed species. The difference
of both isotherms represents the amount of strongly adsorbed species. Since carbonate formation
on iron oxides cannot be excluded, the calculated dispersion values might be overestimated.
Nevertheless, comparison of relative changes of the dispersion of one sample after different
treatments is valid.
Electron microscopy and energy dispersive X-ray spectroscopy (EDX) were applied to
investigate samples in the state after calcination, after reduction or after CO oxidation. The
respective treatments were carried out in the set-up used for catalytic tests (see below). Samples
were transferred into the microscope via a glove box (O2 and H2O concentration below 1 ppm)
without contact to air. A Philips CM 200 FEG TEM operated at 200 kV and a Hitachi S-4800
SEM were used to study the morphology and microstructure of samples. A FEI Cs-corrected
Titan 80-300 microscope was employed to acquire STEM and HR-TEM images. An energy
dispersive X-ray detector (Genesis 4000) attached to the FEG TEM was used to conduct
elemental mapping and composition analysis.
In situ X-ray photoelectron spectroscopy (XPS) was performed at ISISS beamline at BESSY II
synchrotron facility at the Helmholtz Zentrum Berlin, in a setup described elsewhere [35]. The
samples were mounted on a sapphire sample holder, which could be heated from the rear by an
IR laser (continuous wave, 808 nm). The temperature was measured by a K-type thermocouple
fixed onto the sample surface. The gas flow into the analysis chamber was controlled by mass
flow controllers (Bronkhorst). Sample treatments and XPS measurements were performed

6
simultaneously in 25 Pa of He, H2, or O2. A differentially pumped quadrupole mass spectrometer
(Prisma, Pfeiffer) was connected through a leak valve to the experimental cell to monitor the gas
phase composition. The photoelectron spectra were normalized by the storage ring current and
the energy dependent incident photon flux, which was measured prior to the measurements using
a gold foil with known quantum efficiency. The photon flux obtained has been corrected for
higher diffraction orders that contribute only to the background but not to the peak intensity in
XPS. The binding energy scale was calibrated with respect to the Fermi level of the electron
analyzer. The XPS spectra were recorded at a constant electron kinetic energy of 150 eV by
varying the excitation energy for each core orbital measured. The corresponding inelastic mean
free path (IMFP) is about 0.6 nm, as calculated for pure Fe2O3 using the NIST Standard
Reference Database [36, 37]. Semi-quantitative calculations were performed using normalized
Fe 2p and Pd 3d intensities, taking into account the photon-energy dependence of the atomic
subshell photo-ionization cross sections [38]. Peak positions were referenced to the O 1s peak
following ref. [39, 40].
2.3 Catalytic testing The oxidation of CO was investigated as catalytic test reaction in a plug-flow reactor. The
measurements were carried out in a set-up consisting of a gas dosing section, a reactor inside a
copper block oven, and two on-line gas analyzer units. The gas dosing section includes lines for
Ar, He, H2, O2, and three calibration gases (5% H2 in Ar, 5% O2 in He, and 5% CO in Ar). Each
line consists of a filter, a mass flow controller (El-Flow, Bronkhorst), a check valve, and a shut-
off valve. The gases can be mixed via custom-designed switching valves (Valco, Vici). The
reactor itself is a U-tube reactor with an outer diameter of 0.25″ made of glass lined steel (Glass
Lined Tubing, SGE). It is connected to a four-way valve (Valco, Vici) used as bypass and for
sealing the reactor during sample transfer into the glove box. The reactor is heated by a custom-
made copper block oven, providing an isothermal (±1 K) zone of 10 cm at temperatures up to
673 K. The sample temperature is monitored by an internal thermocouple of type K. Analytics
are performed by an on-line detector consisting of two IR detectors for CO and CO2 (EL 1020,
ABB) and a second on-line detector including a thermal conductivity detector for H2 and a
paramagnetic sensor for O2 (X-Stream, Rosemount).
In a typical experiment ca. 25 mg of sample (sieve fraction 255–350 µm) were diluted by 250
mg SiC of the same sieve fraction. The resulting catalyst bed was ca. 2 cm in length and ca. 2

7
cm³ in volume. Pre-reduction of the catalysts was either done at room temperature or at 523 K (2
K/min, holding for 30 min), both in 5% H2 in Ar at a total gas flow of 80 ml/min. CO oxidation
was investigated in the temperature range from room temperature to 523 K. The feed consisted
of 1.0% CO and 0.5% O2 balanced with a mixture of He and Ar. The total flow was set to
100 mL/min, giving a gas hourly space velocity of 240,000 mL g-1 h-1. The deactivation behavior
of the samples was tested by temperature cycles (5 repetitions) in the range of 350-523 K with a
rate of 1 K/min and holding times of 30 min at 523 K. After deactivation, reaction rates were
measured for 0.5-4 h at constant temperatures chosen to yield conversions below 25%. The
conversion of CO in the empty reactor was below 0.005 at 523 K. Significant conversion of CO
started at 573 K and reached 0.1 at 635 K, which is above the investigated temperature range.
3. Results and discussion
3.1 Characterization of calcined samples After investigating the Pd-containing and Pd-free precipitates by TG-DSC in Ar, a calcination
temperature of 823 K was derived for both samples to enable complete precursor decomposition
and crystallization of the iron oxide phase (see supporting information, Fig. S1 and Table S1).
XRD patterns of the calcined samples and of the Pd-containing sample after calcination at a
lower temperature (673 K), i.e. before the exothermic process (cf. Fig. S1), are included in
Fig. 1, corresponding crystallographic data is given in Table S2. All sharp reflections in the
pattern of the samples calcined at 823 K (Fig. 1 a+c) can be assigned to hematite (α-Fe2O3).
Rietveld fit confirms the presence of palladium oxide as minority phase in PdO/α-Fe2O3 and
indicates possible shape anisotropy of the hematite crystallites in both samples (Fig. S2).
The XRD pattern of the Pd-containing sample after calcination at 673 K (Fig. 1 b) shows a series
of reflections that are solely assigned to hematite. Some very broad reflections may be a
contribution of amorphous or nanocrystalline material, which would be in line with the DSC
profile (Fig. S1). Rietveld fit of the profile using two patterns of hematite with different
crystallite sizes gives a good approximation of the experimental profile.
SEM micrographs of the calcined samples confirm the results obtained by XRD and TG-DSC
(Fig. 2). After calcination at 823 K uniformly elongated particles with widths and lengths in the
range of 10 and 100 nm, respectively, can be seen (Fig. 2 b). After calcination at 673 K much
8
smaller particles, almost not distinguishable using SEM, are observed (Fig. 2 a). EDX analysis of
the Pd containing samples gave local palladium contents of 2.0-2.1 wt. %, which is in excellent
agreement with the nominal content and confirms the homogeneous distribution of Pd.
The data from N2 physisorption experiments shown in Fig. S3 are in qualitative agreement with
the results obtained by TG-DSC, XRD and SEM. The adsorption isotherms of the Pd-free and
the Pd-containing sample after calcination at 823 K are both of type IV with a hysteresis of type
H1, typical for agglomerates of compact particles [31]. The fact that the BET surface area of the
Pd-free sample is slightly smaller than that of PdO/α-Fe2O3 is in accordance with the higher Lvol-
IB value of the α-Fe2O3 phase derived from XRD, which is a measure for the crystallite size. The
N2 adsorption isotherm of the Pd-containing sample after calcination at 673 K is of type IV with
a hysteresis of type H2, typical for porous materials with ill-defined pore structure [31].
3.2 Characterization of reduced samples The calcined samples were reduced in TG-DSC experiments to determine a temperature suitable
for reduction of hematite to magnetite (Fe3O4). TG and DSC profiles are shown in Fig. S4,
details are given in Table S1. The data measured on pure α-Fe2O3 reveals three processes: 1)
small mass loss of 0.4% at temperatures below 523 K that may be attributed to drying, 2) the
reduction from hematite to magnetite in the temperature range of 523–623 K, indicated by a
broad and weak exothermic peak in the DSC curve and the mass loss of 3.4% which is in very
good agreement with a theoretical value of 3.3%, 3) the beginning reduction of magnetite to iron
at temperatures above 623 K. Heating to 973 K revealed a mass loss of 28.1%, indicating almost
complete reduction to iron (theoretical mass loss: 30.1%). The data obtained on PdO/α-Fe2O3
also shows three processes: 1) a mass loss of 1.1 % below 473 K, which may be attributed to
drying and possibly to the beginning reduction of hematite, 2) the reduction of hematite to
magnetite between 473 K and 523 K with a mass loss of 3.1%, giving a sharp peak in the DSC
profile, 3) the almost complete reduction of iron oxide to iron, with a total mass loss of 26.8% at
973 K. The reduction of PdO to Pd is not observed in the DSC curve, because it occurred already
at room temperature while flushing the DSC apparatus with hydrogen. The fact that in presence
of palladium hematite is reduced in a more defined step at lower temperatures, compared to pure
α-Fe2O3, can be explained by spill-over of H2 dissociatively adsorbed on palladium. Based on
these results, a reduction temperature of 523 K was chosen for Pd containing catalysts. Although
the total mass loss at 523 K of 4.2% indicates that the iron oxide support is not completely in the

9
state of magnetite and that some FeO could be present, reduction at this temperature should yield
reproducible states.
XRD patterns of PdO/α-Fe2O3 reduced at 523 K and of Pd/Fe3O4 calcined at 673 K are included
in Fig. 1, corresponding crystallographic data is given in Table S2. All major reflections in the
pattern of PdO/α-Fe2O3 after reduction at 523 K can be assigned to magnetite (Fig. 1 d). Rietveld
fit indicates the presence of palladium, palladium oxide and iron as minority phases (Fig. S5).
There is no indication in the Rietveld fit for any shape anisotropy of the magnetite crystallites.
The profile of Pd/Fe3O4 calcined at 673 K shows reflections that can only be assigned to
maghemite (γ-Fe2O3, Fig. 1 e). There exist two structural models for maghemite: a simpler cubic
model and a more complex tetragonal structure built up of three cubic unit cells [41, 42].
Satisfactory fitting of the profile requires the use of the tetragonal model. No minority phases are
needed for the fitting. There is no indication in the Rietveld fit for any shape anisotropy of the
maghemite crystallites. No significant change of crystallite sizes due to reduction and subsequent
calcination has occurred, considering the LVol-IB values for PdO/α-Fe2O3 reduced at 523 K and
of Pd/Fe3O4 calcined at 673 K in comparison to the Pd-containing precursor material after
calcination at 823 K (Table S2).
This is also reflected by the N2 physisorption data included in Fig. S3. There is no change in the
shape of the adsorption isotherms compared to the Pd-containing precursor material after
calcination at 823 K. The only difference is an increase in BET surface area in case of PdO/γ-
Fe2O3 (Fig. S3 d).
To investigate the size and the distribution of palladium particles, HR-TEM and STEM in
HAADF (high-angle annular dark field) mode were applied on PdO/α-Fe2O3 after reduction at
523 K and transfer into the microscopes without contact to air (Fig. 3). The results show that two
different types of Pd particles exist in the sample. By HR-TEM only very few and relatively
large Pd particles in the range of 5-10 nm were found (Fig. 3 a). In contrast, HAADF STEM
experiments revealed the presence of numerous small Pd particles with a mean diameter of
1.0±0.5 nm, visible as white dots (Fig. 3 b). Elemental mapping of Pd, Fe, and O showed that,
with the exception of the few larger particles, Pd is homogeneously distributed on the iron oxide,
and EDX confirmed the nominal Pd content of the sample.
In summary, co-precipitation was successfully applied to yield precursor materials for Pd-
containing catalysts supported on different iron oxides. The type of iron oxide could be set by

10
applying different thermal treatments, carefully chosen based on TG-DSC data: hematite,
magnetite, and maghemite are accessible without other iron oxide phases present (Fig. 4). In all
cases, well defined and homogeneous catalysts with large specific surface areas and a high
dispersion of Pd were accessible. The crystallite size of iron oxide particles was in the range of
20 nm, while the vast majority of Pd particles had crystallite sizes in the range of 1-2 nm. A
reference Pd catalyst supported on SMSI-inert CNT with comparable Pd particle size was
synthesized by impregnation of CNT (cf. supp. information).
3.3 Strong-metal support interaction between Pd and iron oxide Strong-metal support interactions are observed when the catalyst support is in a partially reduced
state, at least in close vicinity to the noble metal particles. One systematic approach to follow the
formation of this state starts from an initially oxidized sample that is subjected to reductive
treatments and monitored by different methods. Hence, PdO/γ-Fe2O3 was chosen to investigate
SMSI between palladium and iron oxide, i.e. the reversible encapsulation of Pd particles by iron
oxide under reducing conditions. CO chemisorption was measured after different reduction
treatments of PdO/γ-Fe2O3 to follow the development of surface area and particle sizes. HR-
TEM was applied to visualize the state of Pd particles after reduction of PdO/γ-Fe2O3 at 523 K.
Finally, in situ XPS was carried out to probe the surface composition of PdO/γ-Fe2O3 after
reductive and oxidative treatments.
CO chemisorption experiments consisted of measuring the adsorption isotherm of CO twice,
with evacuation in dynamic vacuum in-between. Both adsorption isotherms and their difference,
which represents the amount of strongly adsorbed CO, are shown in Fig. 5, details are given in
Table S3. Fig. 5 a) shows the results after reduction of PdO/γ-Fe2O3 at room temperature,
representing a state of completely reduced Pd while the support is in the oxidized form as Pd/γ-
Fe2O3. In this state the dispersion of Pd is very high at a value of 28%, yielding a free Pd surface
area of 2.54 m2/gcat. Assuming spherical and fully accessible particles a mean diameter of 3.9 nm
can be derived for Pd particles, a value that is in reasonable agreement with the mean particle
size of Pd particles derived from STEM micrographs of PdO/α-Fe2O3 after reduction at 523 K.
Upon reduction of the sample at 523 K, a state in which the iron oxide support is in its partially
reduced form of Fe3O4, more than 90% of the free Pd surface area is lost and dispersion goes
down to 2% (Fig. 5 b). If this loss was due to sintering and particle growth, the resulting particles
should have a mean diameter of about 47 nm. Nevertheless, only a few particles in the scale of

11
50 nm were found by HR-TEM, after transfer into the microscope without contact to air (Fig. 6).
Few Pd particles in the range of 5 nm and many particles in the range of 1 nm were observed,
which is similar to the results obtained for PdO/α-Fe2O3 after reduction at 523 K (Fig. 3 a+b).
Looking at the Pd particles located at the edge of the iron oxide particles, an amorphous
overlayer can be seen that consists of iron oxide, depicting what could possibly be the SMSI
state. Since beam irradiation for several minutes has not shown significant changes to the
particles and overlayers, carbon accumulation on the particles can be excluded (Fig. S7).
Fig. 5 c) shows the adsorption isotherms measured after re-oxidation of Pd/Fe3O4 at 673 K
followed by room temperature reduction. It can be clearly seen, that the changes induced by
reduction at 523 K are almost completely reversible. The dispersion is again above 20%, and the
derived mean particle size is 5.3 nm. The change from 3.9 nm to 5.3 nm may be related to
sintering.
CO chemisorption experiments investigating the reference sample PdO/CNT after reduction at
423 K and 523 K showed a similar degree of sintering of Pd particles (see Fig. S8 and Table S3),
but not the huge loss of free Pd surface area observed for Pd/γ-Fe2O3, which can be explained by
the non-reducible CNT support that is not capable of encapsulating the Pd particles.
To clarify if the overlayer on Pd particles seen in Fig. 6 is iron oxide, in situ XPS measurements
were performed under reducing and oxidizing conditions (Fig. 7 and Table S4). The initial state
of PdO/γ-Fe2O3 was measured at a pressure of 25 Pa He at 423 K. The Pd 3d5/2 peak is located at
335.5 eV with a resolved shoulder at 337.2 eV, indicating the presence of metallic and oxidized
palladium, respectively [43]. The position of the Fe 2p doublet (Fe 2p3/2 at 710.8 eV) and the
satellite in between the 2p1/2 and 2p3/2 peaks at 719.0 eV indicate the presence of Fe3+, metallic
Fe is absent [39]. The shoulder on the low BE side of the Fe 2p3/2 peak is indicative for minor
amounts of Fe2+. The atomic ratio of Pd/Fe in the initial state is 0.084. In comparison, a rough
estimation based on free Pd surface area measured by CO chemisorption after room temperature
reduction and considering the BET surface area of Pd/γ-Fe2O3 as (111) surface of maghemite
yields a ratio of 0.212, which is in reasonable agreement. In addition, too low Pd/Fe ratios from
XPS may be caused by geometric effects (e.g. in case of half-spherical Pd particles) and the fact
that the information depth is in the range of the average Pd particle size (both in the range of
1 nm). The sample was then heated to 523 K in 25 Pa of H2 and kept under these conditions for
more than 14 h. During this time, the area of the Pd peaks decreased while the area of the Fe

12
peaks increased. After 14 h the Pd/Fe ratio is only 0.005, indicating that more than 90% of the Pd
disappeared from the surface of the sample, which is in excellent agreement with the CO
chemisorption results, suggesting overgrowth of the Pd particles by iron oxide species as
observed by HR-TEM (Fig. 6). Furthermore, the signal for oxidized Pd vanished; only metallic
Pd was detected. In the Fe 2p region, the overall width of the Fe 2p3/2 signal decreased, which
suggests the formation of a more defined surface iron oxide with less different Fe species. This is
also reflected by the shift of the position of the shoulder below 710 eV towards higher binding
energies. Upon oxidation of the sample at 673 K in 25 Pa of O2, the Pd reappears at the surface.
After 5.25 h more than 25% of the Pd reappeared, as reflected in the Pd/Fe ratio of 0.023. The Pd
3d region indicates that all Pd on the surface was oxidized. The low BE shoulder in the Fe 2p
region vanished completely, suggesting the full oxidation of remaining Fe2+ to Fe3+ on the
surface under these conditions.
In summary, CO chemisorption experiments showed a loss of sorption capacity for CO adsorbed
on Pd after reduction of PdO/γ-Fe2O3 at elevated temperatures. This loss could be reversed by re-
oxidation of the sample. Furthermore, after reduction of PdO/γ-Fe2O3 an amorphous overlayer on
Pd particles could be observed by HR-TEM. In situ XPS experiments showed that this overlayer
consisted of iron oxide. These results give strong evidence for the existence of SMSI in
Pd/Fe3O4.
3.4 Catalytic activity results The oxidation of CO was investigated as catalytic test reaction to characterize PdO/α-Fe2O3 and
PdO/γ-Fe2O3, and to probe the effect of SMSI on the catalytic properties. Pd/CNT and α-Fe2O3
were tested for comparison. CO conversion of 0.065% at 523 K was measured on α-Fe2O3 (after
reduction at 573 K), with no activity detected below 473 K. Thus, any contribution of the iron
oxide support to CO conversion measured on Pd-containing catalysts can be neglected.
The first CO oxidation experiment was carried out under steady-state conditions on initial
PdO/α-Fe2O3. After temperature-programmed reduction at 523 K to yield Pd/Fe3O4 (cf. Fig. 4),
followed by cooling to room temperature in Ar, isothermal CO oxidation conditions were applied
at 373 K, 403 K, 423 K, and 433 K for 4 h, respectively, yielding data set a) in the Arrhenius plot
shown in Fig. 8. The measurement was repeated after cooling from 433 K to 373 K, giving data
set b) in Fig. 8. After measuring data set b), the molar fraction of CO was kept at 1.0%, but the
molar fraction of O2 was changed to 1.0%, then to 2.5%, and back to 1.0%. Under each
13
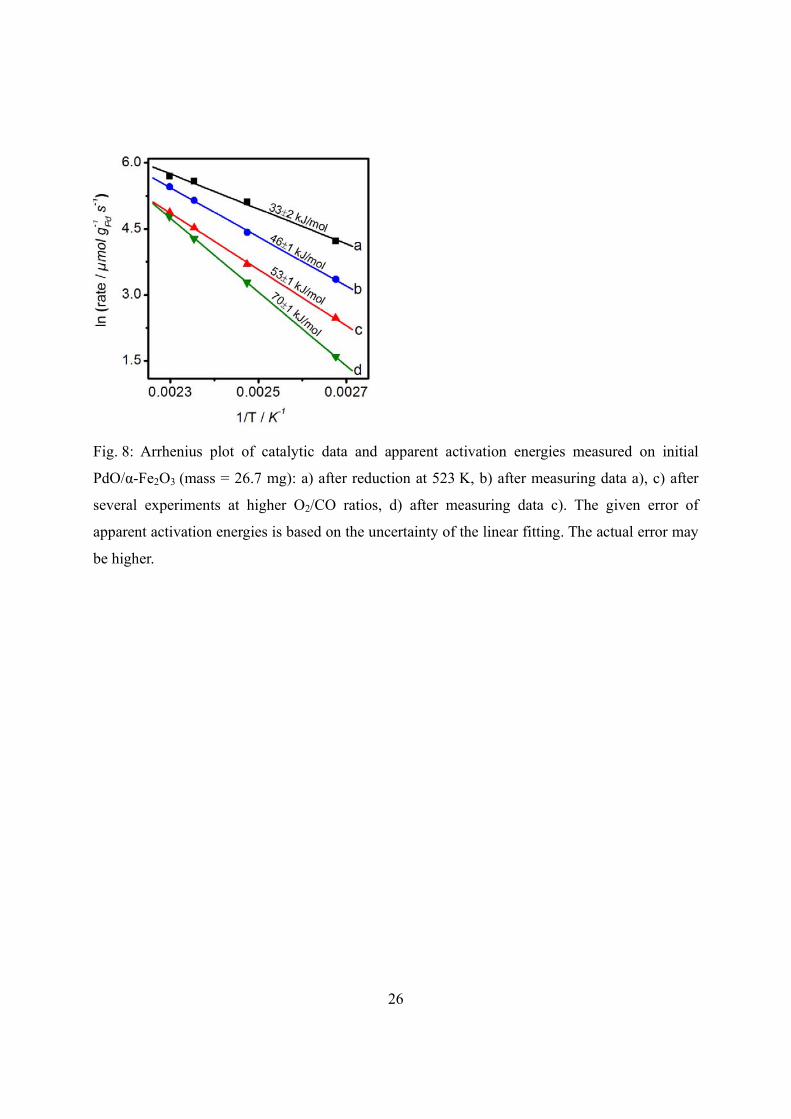
condition, catalytic data were measured for 4 h at 373 K, 403 K, 423 K, and 433 K, respectively,
repeating the measurement after cooling to 373 K. Finally, the molar fraction of O2 was set again
to 0.5%, and data sets c) and d) in Fig. 8 were measured. It can be clearly seen, that the catalyst
deactivates drastically in the course of the experiment. The fact that the apparent activation
energies Ea derived from the Arrhenius plot change from 33 kJ/mol for data set a) to 70 kJ/mol
for data set d) indicates that the deactivation is related to a change of the nature of the active sites
with time on stream rather than to simple sintering of Pd particles. Assuming that the SMSI state
was formed after the initial reduction, it seems to be destroyed quickly after applying CO
oxidation conditions. Mass transfer calculations were carried out at the highest rate for initial
PdO/Fe2O3 after reduction at 523 K to yield Pd/Fe3O4 (cf. Fig. 8a). The Weisz-Prater criterion
was calculated at 8.5·10-3, indicating negligible internal mass transport limitation (see
supplementary information) [44].
To probe and compare the deactivation behavior of different samples, CO oxidation was carried
out in temperature-dependent cycles (Fig. 9). After reductive pre-treatments the samples were
heated in the reactive feed to 523 K with 1 K/min and cooled to room temperature, five
heating/cooling cycles were conducted. Values of T50, the temperature at 50% CO conversion,
are given in Table S5. For all iron oxide samples, the main part of deactivation occurred during
the first heating cycle. Since after pre-reduction at 523 K the T50 values for initial PdO/α-Fe2O3
(Fig. 9 a) and initial PdO/γ-Fe2O3 (Fig. 9 c) are nearly identical for all five cycles, both samples
are most likely in the same state before the first cycle: Pd/Fe3O4, with most of the Pd surface
covered by FeOx. A comparison of all T50 values measured on iron oxide samples leads to the
following conclusion: the SMSI between Pd and iron oxide strongly enhances the catalytic
activity of Pd for CO oxidation. The T50 values of the first cycle for PdO/α-Fe2O3 and PdO/γ-
Fe2O3 after reduction at 523 K, i.e. in the SMSI state, are significantly lower compared to PdO/α-
Fe2O3 after reduction at room temperature, although only a small fraction of the Pd surface area
in the SMSI state is accessible and can serve as active sites. The T50 values of cycles 2–5 are the
same for all iron oxide containing catalysts. It is interesting to see that even after three cycles, the
iron oxide containing catalysts are still subject to deactivation, as indicated by increasing T50
values. Deactivation can either be caused by sintering of Pd particles or by changes in the
oxidation state of the iron oxide supports, either at the surface or in the vicinity of Pd particles.
STEM shows that Pd particles in the deactivated state after CO oxidation are significantly larger

14
compared to Pd particles on a freshly reduced sample (Fig. 3 b+d), suggesting that sintering is
one reason for deactivation of the Pd supported iron oxide catalyst. For Pd/CNT sintering should
be the main deactivation route (Fig. 9 d). Formation of SMSI or changes in the oxidation state of
the support are not expected to play a role because of the non-reducibility of the carbon support.
After activation during the first cycle, the performance of Pd/CNT was stable during cycles 2-5.
Subsequent to the heating/cooling cycles, steady-state measurements under isothermal
conditions were carried out. Based on the results of the cycling experiments, an individual
temperature range for steady-state measurements was chosen for each catalyst. Within this
region, the sample was heated up in steps of 10 K and then cooled down in steps of 5 K. The data
collected during cooling down is shown in Fig. 10 on samples that previously were exposed to
the conditions applied in Fig. 9. Additionally, data measured on PdO/α-Fe2O3 after reduction at
523 K without previous temperature cycling (data set a) in Fig. 8), which is representative for the
SMSI state, is included for comparison. The iron oxide containing catalysts are more active by an
order of magnitude compared to Pd/CNT. Initial PdO/α-Fe2O3 after room temperature reduction,
i.e. without SMSI, and PdO/γ-Fe2O3 after reduction at 523 K, both in the already deactivated
states show similar results. The slight differences may be due to different degrees of deactivation
that could possibly result in different iron oxide phases present in the support. The data of
PdO/α-Fe2O3 in the SMSI state after reduction at 523 K show an increase of activity by an order
of magnitude at low temperatures. At higher temperatures the SMSI state decomposes, but still
renders the sample twice as active.
In situ XRD experiments were carried out on initial PdO/α-Fe2O3 to clarify whether possible
bulk changes in the iron oxide support can serve as another reason for the deactivation of the
catalyst under CO oxidation conditions, besides sintering of the particles (cf. Fig. 3 b+d). Fig. S9
indicates that in the initial state, all iron oxide is found to be hematite. After reduction in 5% H2
at 523 K the iron oxide is mainly present as magnetite, hematite being a small minority phase.
CO oxidation at 523 K was then carried out in the XRD cell in two different feeds: 1) CO-rich
feed (4.0% CO, 0.5% O2), 2) stoichiometric feed (1% CO, 0.5% O2). Despite the different
oxidation potentials of the respective feeds the diffraction patterns are nearly identical: γ-Fe2O3
(maghemite) was formed in both cases while the minority phase hematite (α-Fe2O3) was still
present. Subsequent calcination at 673 K induced no changes to the maghemite phase, only the
content of the hematite phase increased slightly. Increasing the calcination temperature to 1073 K

15
eventually resulted in the formation of α-Fe2O3. Furthermore, large crystallites of PdO were
formed and are visible in the diffraction pattern. The in situ XRD results indicate that bulk
changes of the iron oxide, i.e. the oxidation of Fe3O4 (magnetite) to γ-Fe2O3 (maghemite), occur
during CO oxidation within hours, even in the excess of CO. Hence, these bulk changes may
only play a role in the initial deactivation of the catalyst (cf. Fig. 9). The changes of Ea shown in
Fig. 9 took place over the course of days and are therefore most likely caused by sintering of the
Pd particles and the associated loss of active surface area.
In summary, Pd particles supported on iron oxide are much more active for CO oxidation than Pd
particles supported on CNT, highlighting the widely-studied role of oxide supports for CO
oxidation over metal catalysts. The activity of Pd on iron oxide can be further increased by
partial reduction of the iron oxide. After reduction of the iron oxide at elevated temperatures,
when the surface of Pd particles is almost completely covered by Fe species, the activity is
increased by an order of magnitude. For samples in this state values of Ea as low as 33 kJ/mol
were found. These findings correlate well with model studies on Fe films grown on Pt(111), that
show highest CO oxidation activity when Pt(111) is covered by only a monolayer film of iron
oxide (i.e. non-stoichiometric FeOx) to form a SMSI-like state, compared to low activities on
bare Pt(111) and on Pt(111) covered by nm-thick Fe3O4 films [12, 45]. However, the highly
active SMSI state on the powder catalyst studied here is subject to fast deactivation. Deactivation
occurs in two ways. The first process is fast and has a strong influence on Ea, increasing Ea to
values of 80–90 kJ/mol. This process may be related to changes in the oxidation state of Fe
species in the vicinity of Pd particles. The second process occurs more slowly and can be
explained by sintering of Pd particles.
4. Conclusions Co-precipitation was successfully applied to synthesize the precursor material for Pd catalysts
supported on iron oxide. The resulting iron oxide can either be hematite, magnetite or maghemite
depending on the subsequent processing of the precursor material. In all cases, well defined
catalysts with high specific surface areas and high dispersion of Pd were obtained.
The existence of SMSI between Pd and iron oxide was strongly evidenced on Pd/Fe3O4 by a
combination of CO chemisorption experiments, electron microscopy, and in situ XPS
experiments. Upon reduction at elevated temperatures, the CO chemisorption capacity of Pd is
strongly decreased, oxidation can reverse the effect. HR-TEM micrographs revealed the presence

16
of an overlayer on Pd particles after reduction at elevated temperatures. Finally, in situ XPS
experiments confirmed that the overlayer consists of Fe species, and that the process of
encapsulation of Pd particles is reversible.
SMSI has a strong effect on the catalytic properties of Pd particles. The activity for CO oxidation
is strongly enhanced when the Pd particles are covered by Fe species. However, this state is not
stable under the applied reaction conditions. Catalyst deactivation occurred in two ways. A fast
process has direct influence on the nature of the active site and may be correlated to changes in
the oxidation state of Fe species. A second process is sintering of the Pd particles with time on
stream. After deactivation, Pd supported on iron oxide is still an order of magnitude more active
than Pd supported on a non-reducible support like carbon nanotubes.
We have shown that the SMSI state is easily decomposed in the presence of oxidizing
atmospheres, however this highly active state may be stable under highly reducing atmosphere
(e.g. in excess H2). Therefore, the use of Pd/iron oxide as a catalyst for the preferential oxidation
of CO in presence of hydrogen - a reaction critical to H2 purification for fuel cell applications,
may be feasible.

17
5. Acknowledgements The Helmholtz Zentrum Berlin is acknowledged for providing beamtime at BESSY II (ISISS beamline) and ongoing support.

18
6. References [1] S. J. Tauster, S. C. Fung, R. L. Garten, J. Am. Chem. Soc. 100 (1978) 170. [2] S. J. Tauster, S. C. Fung, R. T. K. Baker, J. A. Horsley, Science 211 (1981) 1121. [3] R. T. K. Baker, E. B. Prestridge, R. L. Garten, J. Catal. 56 (1979) 390. [4] J. Santos, J. Phillips, J. A. Dumesic, J. Catal. 81 (1983) 147. [5] D. J. Dwyer, J. L. Robbins, S. D. Cameron, N. Dudash, J. Hardenberg, in: R. T. K. Baker,
S. J. Tauster, J. A. Dumesic (Eds.), Strong Metal-Support Interactions, ACS Symposium Series, Washington, 1986, p. 21.
[6] Y. W. Chung, Y. B. Chao, in: R. T. K. Baker, S. J. Tauster, J. A. Dumesic (Eds.), Strong Metal-Support Interactions, ACS Symposium Series, Washington, 1986, p. 54.
[7] E. J. Braunschweig, A. D. Logan, A. K. Datye, D. J. Smith, J. Catal. 118 (1989) 227. [8] A. K. Datye, D. S. Kalakkad, M. H. Yao, D. J. Smith, J. Catal. 155 (1995) 148. [9] T. Uchijima, Cat. Today 28 (1996) 105. [10] Z.-H. Qin, M. Lewandowski, Y.-N. Sun, S. Shaikhutdinov, H.-J. Freund, J. Phys. Chem.
C 112 (2008) 10209. [11] Z.-H. Qin, M. Lewandowski, Y.-N. Sun, S. Shaikhutdinov, H.-J. Freund, J. Phys.:
Condens. Matter 21 (2009), 134019. [12] Y.-N. Sun, Z.-H. Qin, M. Lewandowski, E. Carrasco, M. Sterrer, S. Shaikhutdinov, H.-J.
Freund, J. Catal. 266 (2009) 359. [13] Y.-N. Sun, L. Giordano, J. Goniakowski, M. Lewandowski, Z.-H. Qin, C. Noguera, S.
Shaikhutdinov, G. Pacchioni, H.-J. Freund, Angew. Chem. Int. Ed. 26 (2010) 4418. [14] Y. Martynova, B. H. Liu, M. E. McBriarty, I. M. N. Groot, M. J. Bedzyk, S.
Shaikhutdinov, H. J. Freund, J. Catal. 301 (2013) 227. [15] Y. Martynova, M. Soldemo, J. Weissenrieder, S. Sachert, S. Polzin, W. Widdra, S.
Shaikhutdinov, H.-J. Freund, Catal. Lett. 143 (2013) 1108. [16] R. Meyer, M. Bäumer, S. K. Shaikhutdinov, H.-J. Freund, Surf. Sci. 546 (2003) L813. [17] H.-J. Freund, G. Meijer, M. Scheffler, R. Schlögl, M. Wolf, Angew. Chem. Int. Ed. 50
(2011) 10064. [18] A. Satsuma, K. Osaki, M. Yanagihara, J. Ohyama, K. Shimizu, Appl. Catal. B 132-133
(2013) 511. [19] M. M. Gadgil, S. K. Kulshreshtha, J. Mol. Catal. A: Chem. 95 (1995) 211. [20] A. V. Kalinkin, V. I. Savchenko, A. V. Pashis, Catal. Lett. 59 (1999) 115. [21] S. Golunski, R. Rajaram, N. Hodge, G. J. Hutchings, C. J. Kiely, Catal. Today 72 (2002)
107. [22] R. Meyer, Sh. K. Shaikhutdinov, H.-J. Freund, Z. Phys. Chem. 218 (2004) 905. [23] B. Qiao, L. Liu, J. Zhang, Y. Deng, J. Catal. 261 (2009) 241. [24] X. C. Jiang, A. B. Yu, J. Mater. Process. Technol. 209 (2009) 4558. [25] L. Liu, F. Zhou, L. Wang, X. Qi, F. Shi, Y. Deng, J. Catal. 274 (2010) 1. [26] S. Chen, R. Si, E. Taylor, J. Janzen, J. Chen, J. Phys. Chem. C 116 (2012) 12969. [27] T. Engel, G. Ertl, J. Chem. Phys. 69 (1978) 1267. [28] T. Engel, G. Ertl, in: D. A. King, J. P. Woodruff (Eds.), The Chemical Physics of Solid
Surfaces and Heterogeneous Catalysis, Vol. 4, Elsevier, Amsterdam, 1982, p. 73. [29] S. M. McClure, D. W. Goodman, Chem. Phys. Lett. 469 (2009) 1. [30] J. Liu, B. Sun, J. Hu, Y. Pei, H. Li, M. Qiao, J. Catal. 274 (2010) 287. [31] H. Hildebrand, K. Mackenzie, F. G. Kopinke, Appl. Catal. B 91 (2009) 389. [32] W. Sun, Q. Li, S. Gao, J. K. Shang, Appl. Catal. B 125 (2012) 1-9.

19
[33] D. Balzar, in: R. L. Snyder, H. J. Bunge, and J. Fiala (Eds.), Defect and Microstructure Analysis by Diffraction, Oxford University Press, Oxford, 1999, p. 94.
[34] K. S. W. Sing, D. H. Everett, R. A. W. Haul, L. Moscou, R. A. Pierotti, J. Rouquérol, T. Siemieniewska, Pure Appl. Chem. 57 (1985) 603.
[35] A. Knop-Gericke, E. Kleimenov, M. Hävecker, R. Blume, D. Teschner, S. Zafeiratos, R. Schlögl, V. I. Bukhtiyarov, V. V. Kaichev, I. P. Prosvirin, A. I. Nizovskii, H. Bluhm, A. Barinov, P. Dudin, M. Kiskinova, Adv. Catal. 52 (2009) 213.
[36] NIST Electron Inelastic-Mean-Free-Path Database, Version 1.2, 2010. [37] S. Tanuma, C. J. Powell, D. R. Penn, Surf. Interface Anal. 17 (1991) 911. [38] J. J. Yeh, I. Lindau, At. Data Nucl. Data Tables 32 (1985) 1. [39] T. Fujii, F. M. F. de Groot, G. A. Sawatzky, F. C. Voogt, T. Hibma, K. Okada, Phys. Rev.
B 59 (1999) 3195. [40] C. R. Brundle, T. J. Chuang, K. Wandelt, Surf. Sci. 68 (1977) 459. [41] G. W. van Oosterhout, C. J. M. Rooijmans, Nature 181 (1958) 44. [42] A. N. Shmakov, G. N. Kryukova, S. V. Tsybulya, A. L. Chuvilin, L. P. Solovyeva, J.
Appl. Cryst. 28 (1995) 141. [43] M. Brun, A. Berthet, J. C. Bertolini, J. Electron Spectrosc. Relat. Phenom. 104 (1999) 55. [44] P. B. Weisz, C. D. Prater, Adv. Catal. 6 (1954) 143. [45] M. Willinger et al., Angew. Chem. (2014) accepted.

20
7. Figure legend
Fig. 1: XRD patterns of (a) the Pd-free precursor calcined at 823 K, (b) the Pd-containing
precursor calcined at 673 K, (c) the Pd-containing precursor calcined at 823 K, (d) sample (c)
reduced at 523 K, (e) sample (d) calcined at 673 K.

21
Fig. 2: SEM micrographs of the initial Pd-containing precursor (a) after calcination at 673 K and
(b) after calcination at 823 K.

22
Fig. 3: HR-TEM (left) and HAADF STEM (right) micrographs of initial PdO/α-Fe2O3 after
reduction at 523 K (a, b) and after CO oxidation (c, d).

23
Fig. 4: Phase evolution of the Pd-containing iron oxide supports derived from thermal analysis
and XRD results.

24
Fig. 5: Results of CO chemisorption experiments: adsorption isotherms of CO on PdO/γ-Fe2O3
(a) after reduction at room temperature, (b) after reduction at 523 K, and (c) after re-oxidation of
(b) at 673 K followed by reduction at room temperature.
Fig. 6: HR-TEM image of initial PdO/γ-Fe2O3 after reduction at 523 K to form the SMSI state.
In on-edge views of larger Pd particles an amorphous overlayer covering the particles can be
seen.

25
Fig. 7: Results of in situ XPS experiments: Fe 2p and Pd 3d core level regions after different
treatments of PdO/γ-Fe2O3. The initial state was investigated in 25 Pa of He at 423 K (bottom
spectrum). Subsequently, the reduction process was investigated in 25 Pa of H2 at 523 K over a
period of 14 h. Finally, the re-oxidation process was investigated in 25 Pa of O2 at 673 K over a
period of 5.25 h. Data has been background corrected (Shirley-type) and offset for clarity.
26
Fig. 8: Arrhenius plot of catalytic data and apparent activation energies measured on initial
PdO/α-Fe2O3 (mass = 26.7 mg): a) after reduction at 523 K, b) after measuring data a), c) after
several experiments at higher O2/CO ratios, d) after measuring data c). The given error of
apparent activation energies is based on the uncertainty of the linear fitting. The actual error may
be higher.

27
Fig. 9: Temperature-programmed CO oxidation by repeated heating/cooling cycles with 1 K/min
in a flow of 1.0% CO and 0.5% O2 in Argon (total flow 100 ml/min): a) PdO/α-Fe2O3 after
reduction at 523 K, b) PdO/α-Fe2O3 after reduction at room temperature, c) PdO/γ-Fe2O3 after
reduction at 523 K; d: PdO/CNT after reduction at 523 K. The direction of the arrow marks the
chronological sequence of cycles 1-5. In d) cycles 2-5 are on top of each other.

28
Fig. 10: Steady-state CO conversion rates measured after deactivation tests (cf. Fig. 9); filled
squares: initial PdO/α-Fe2O3 after reduction at room temperature; circles: initial PdO/γ-Fe2O3
after reduction at 523 K; triangles: initial PdO/CNT after reduction at 523 K. Rates are
normalized to sample mass, to Pd mass (assuming a Pd content of 2.0 wt % for all samples), to
specific Pd surface area derived from CO chemisorption experiments, and to the number of Pd
surface atoms (turnover frequency), assuming that every Pd surface atom represents an active
site. Data measured with PdO/α-Fe2O3 in the SMSI state, directly after reduction at 523 K
without deactivation test, is included for comparison (hollow squares).