Strong Inflation, Supply Issues and New Pandemic Fears ...
16
ECONOMIC & FINANCIAL OUTLOOK Jimmy Jean, Vice-President, Chief Economist and Strategist • Mathieu D’Anjou, Director and Deputy Chief Economist Hélène Bégin, Senior Economist • Benoit P. Durocher, Senior Economist • Francis Généreux, Senior Economist • Hendrix Vachon, Senior Economist Desjardins, Economic Studies: 514-281-2336 or 1 866-866-7000, ext. 5552336 • [email protected] • desjardins.com/economics NOTE TO READERS: The letters k, M and B are used in texts and tables to refer to thousands, millions and billions respectively. IMPORTANT: This document is based on public information and may under no circumstances be used or construed as a commitment by Desjardins Group. While the information provided has been determined on the basis of data obtained from sources that are deemed to be reliable, Desjardins Group in no way warrants that the information is accurate or complete. The document is provided solely for information purposes and does not constitute an offer or solicitation for purchase or sale. Desjardins Group takes no responsibility for the consequences of any decision whatsoever made on the basis of the data contained herein and does not hereby undertake to provide any advice, notably in the area of investment services. The data on prices or margins are provided for information purposes and may be modified at any time, based on such factors as market conditions. The past performances and projections expressed herein are no guarantee of future performance. The opinions and forecasts contained herein are, unless otherwise indicated, those of the document’s authors and do not represent the opinions of any other person or the official position of Desjardins Group. Copyright © 2021, Desjardins Group. All rights reserved. CONTENTS Highlights .......................................................... 1 Risks Inherent in Our Scenarios .......................... 2 Financial Forecasts ............................................. 3 Economic Forecasts Overseas............... 4 United States............. 6 Canada ................. 8 Quebec ....................10 Ontario and Other Provinces........................... 12 Medium-Term Issues and Forecasts ................ 15 Strong Inflation, Supply Issues and New Pandemic Fears: Major Uncertainties Heading into 2022 ECONOMIC STUDIES | DECEMBER 7, 2021 HIGHLIGHTS f The world’s economy has improved in the last few quarters, but the pandemic is clearly not over yet and its economic impacts are very much with us. Supply problems along with significant increases in energy and commodity prices contributed to an almost general surge in inflation worldwide. f U.S. real GDP growth disappointed in the third quarter of 2021, but better growth is forecast for the year’s final quarter. In the United States, inflation should remain high in the near term and real GDP growth is expected to reach 3.5% in 2022. f In Canada, economic growth in the fourth quarter of 2021 appears to be off to an encouraging start but flooding in British Columbia has exacerbated supply issues. Annualized real GDP growth for the fourth quarter could still come in at around 4%. On average, 2021 could see expansion of 4.5%, followed by gains of 3.9% in 2022 and 3.1% in 2023. Imbalances between supply and demand are expected to continue exerting upward price pressure on many goods and services. f Quebec’s real GDP has been seesawing since it finished recovering last March. As elsewhere, supply problems, the scarcity of labour, and increased costs for businesses will curb economic activity over the coming quarters. f After deep contractions in 2020, provincial economies are recovering unevenly. Alberta is expected to stand out as its energy sector bounces back. Faced with challenges from supply issues and recent flooding, Ontario and British Columbia could see real GDP growth slightly trail the national average in 2021 but are expected to outperform again starting in 2022. f The major spike in European COVID-19 cases and emergence of the Omicron variant pummelled financial markets at the end of November. We still expect the Federal Reserve and Bank of Canada to start gradually raising their key rates in the second quarter of 2022; bond yields should shortly start to trend up again. f Economic growth will slow over the medium range in the United States and Canada, but inflation pressure should be felt more than in the previous economic cycle. This will combine with other challenges, such as the energy transition, debt load and financial stability. f Another wave of the pandemic and the spread of the Omicron variant could hurt the economic situation in the near term, further disrupt supply chains, and intensify inflationary pressure.
Transcript of Strong Inflation, Supply Issues and New Pandemic Fears ...

ECONOMIC & FINANCIAL OUTLOOK
Jimmy Jean, Vice-President, Chief Economist and Strategist • Mathieu D’Anjou, Director and Deputy Chief Economist Hélène Bégin, Senior Economist • Benoit P. Durocher, Senior Economist • Francis Généreux, Senior Economist • Hendrix Vachon, Senior Economist
Desjardins, Economic Studies: 514-281-2336 or 1 866-866-7000, ext. 5552336 • [email protected] • desjardins.com/economics
NOTE TO READERS: The letters k, M and B are used in texts and tables to refer to thousands, millions and billions respectively.IMPORTANT: This document is based on public information and may under no circumstances be used or construed as a commitment by Desjardins Group. While the information provided has been determined on the basis of data obtained from sources that are deemed to be reliable, Desjardins Group in no way warrants that the information is accurate or complete. The document is provided solely for information purposes and does not constitute an offer or solicitation for purchase or sale. Desjardins Group takes no responsibility for the consequences of any decision whatsoever made on the basis of the data contained herein and does not hereby undertake to provide any advice, notably in the area of investment services. The data on prices or margins are provided for information purposes and may be modified at any time, based on such factors as market conditions. The past performances and projections expressed herein are no guarantee of future performance. The opinions and forecasts contained herein are, unless otherwise indicated, those of the document’s authors and do not represent the opinions of any other person or the official position of Desjardins Group. Copyright © 2021, Desjardins Group. All rights reserved.
CONTENTSHighlights .......................................................... 1Risks Inherent in Our Scenarios .......................... 2Financial Forecasts ............................................. 3
Economic ForecastsOverseas ............... 4 United States ............. 6Canada ................. 8 Quebec ....................10
Ontario and Other Provinces ...........................12Medium-Term Issues and Forecasts ................15
Strong Inflation, Supply Issues and New Pandemic Fears: Major Uncertainties Heading into 2022
ECONOMIC STUDIES | DECEMBER 7, 2021
HIGHLIGHTS
f The world’s economy has improved in the last few quarters, but the pandemic is clearly not over yet and its economic impacts are very much with us. Supply problems along with significant increases in energy and commodity prices contributed to an almost general surge in inflation worldwide.
f U.S. real GDP growth disappointed in the third quarter of 2021, but better growth is forecast for the year’s final quarter. In the United States, inflation should remain high in the near term and real GDP growth is expected to reach 3.5% in 2022.
f In Canada, economic growth in the fourth quarter of 2021 appears to be off to an encouraging start but flooding in British Columbia has exacerbated supply issues. Annualized real GDP growth for the fourth quarter could still come in at around 4%. On average, 2021 could see expansion of 4.5%, followed by gains of 3.9% in 2022 and 3.1% in 2023. Imbalances between supply and demand are expected to continue exerting upward price pressure on many goods and services.
f Quebec’s real GDP has been seesawing since it finished recovering last March. As elsewhere, supply problems, the scarcity of labour, and increased costs for businesses will curb economic activity over the coming quarters.
f After deep contractions in 2020, provincial economies are recovering unevenly. Alberta is expected to stand out as its energy sector bounces back. Faced with challenges from supply issues and recent flooding, Ontario and
British Columbia could see real GDP growth slightly trail the national average in 2021 but are expected to outperform again starting in 2022.
f The major spike in European COVID-19 cases and emergence of the Omicron variant pummelled financial markets at the end of November. We still expect the Federal Reserve and Bank of Canada to start gradually raising their key rates in the second quarter of 2022; bond yields should shortly start to trend up again.
f Economic growth will slow over the medium range in the United States and Canada, but inflation pressure should be felt more than in the previous economic cycle. This will combine with other challenges, such as the energy transition, debt load and financial stability.
f Another wave of the pandemic and the spread of the Omicron variant could hurt the economic situation in the near term, further disrupt supply chains, and intensify inflationary pressure.
ECONOMIC STUDIES
2DECEMBER 2021 | ECONOMIC & FINANCIAL OUTLOOK
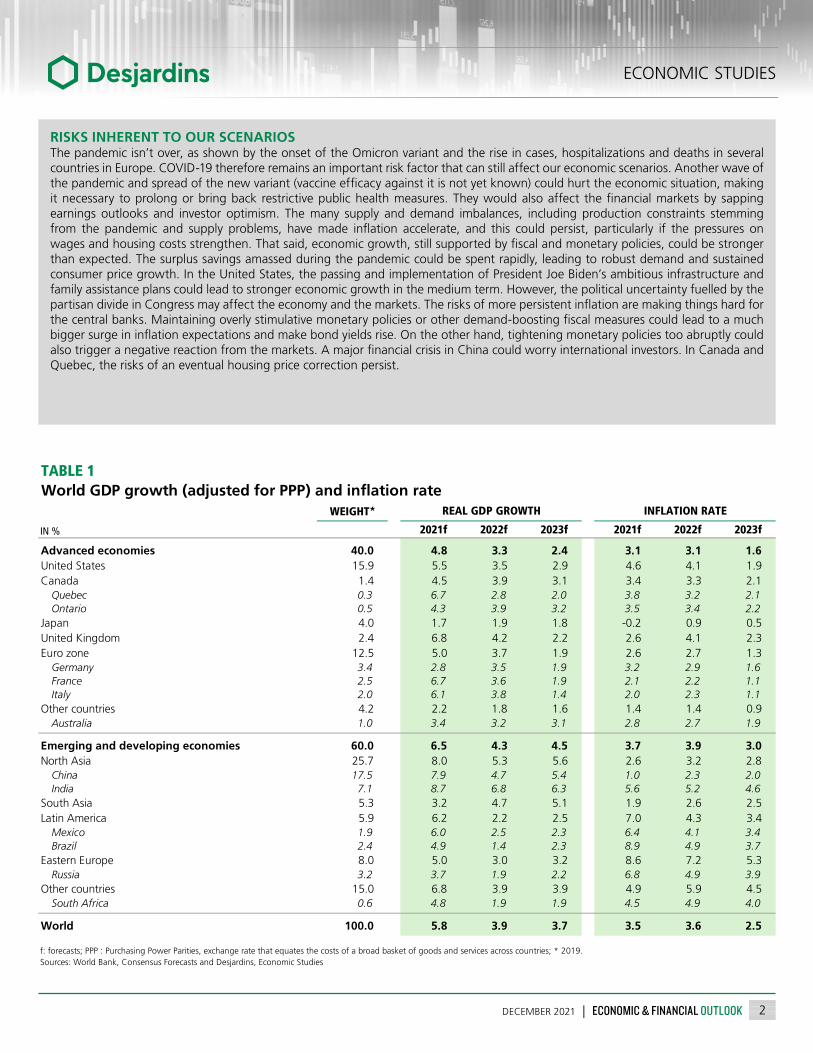
RISKS INHERENT TO OUR SCENARIOSThe pandemic isn’t over, as shown by the onset of the Omicron variant and the rise in cases, hospitalizations and deaths in several countries in Europe. COVID-19 therefore remains an important risk factor that can still affect our economic scenarios. Another wave of the pandemic and spread of the new variant (vaccine efficacy against it is not yet known) could hurt the economic situation, making it necessary to prolong or bring back restrictive public health measures. They would also affect the financial markets by sapping earnings outlooks and investor optimism. The many supply and demand imbalances, including production constraints stemming from the pandemic and supply problems, have made inflation accelerate, and this could persist, particularly if the pressures on wages and housing costs strengthen. That said, economic growth, still supported by fiscal and monetary policies, could be stronger than expected. The surplus savings amassed during the pandemic could be spent rapidly, leading to robust demand and sustained consumer price growth. In the United States, the passing and implementation of President Joe Biden’s ambitious infrastructure and family assistance plans could lead to stronger economic growth in the medium term. However, the political uncertainty fuelled by the partisan divide in Congress may affect the economy and the markets. The risks of more persistent inflation are making things hard for the central banks. Maintaining overly stimulative monetary policies or other demand-boosting fiscal measures could lead to a much bigger surge in inflation expectations and make bond yields rise. On the other hand, tightening monetary policies too abruptly could also trigger a negative reaction from the markets. A major financial crisis in China could worry international investors. In Canada and Quebec, the risks of an eventual housing price correction persist.
WEIGHT*
2021f 2022f 2023f 2021f 2022f 2023f
Advanced economies 40.0 4.8 3.3 2.4 3.1 3.1 1.6United States 15.9 5.5 3.5 2.9 4.6 4.1 1.9Canada 1.4 4.5 3.9 3.1 3.4 3.3 2.1
Quebec 0.3 6.7 2.8 2.0 3.8 3.2 2.1Ontario 0.5 4.3 3.9 3.2 3.5 3.4 2.2
Japan 4.0 1.7 1.9 1.8 -0.2 0.9 0.5United Kingdom 2.4 6.8 4.2 2.2 2.6 4.1 2.3Euro zone 12.5 5.0 3.7 1.9 2.6 2.7 1.3
Germany 3.4 2.8 3.5 1.9 3.2 2.9 1.6France 2.5 6.7 3.6 1.9 2.1 2.2 1.1Italy 2.0 6.1 3.8 1.4 2.0 2.3 1.1
Other countries 4.2 2.2 1.8 1.6 1.4 1.4 0.9Australia 1.0 3.4 3.2 3.1 2.8 2.7 1.9
Emerging and developing economies 60.0 6.5 4.3 4.5 3.7 3.9 3.0North Asia 25.7 8.0 5.3 5.6 2.6 3.2 2.8
China 17.5 7.9 4.7 5.4 1.0 2.3 2.0India 7.1 8.7 6.8 6.3 5.6 5.2 4.6
South Asia 5.3 3.2 4.7 5.1 1.9 2.6 2.5Latin America 5.9 6.2 2.2 2.5 7.0 4.3 3.4
Mexico 1.9 6.0 2.5 2.3 6.4 4.1 3.4Brazil 2.4 4.9 1.4 2.3 8.9 4.9 3.7
Eastern Europe 8.0 5.0 3.0 3.2 8.6 7.2 5.3Russia 3.2 3.7 1.9 2.2 6.8 4.9 3.9
Other countries 15.0 6.8 3.9 3.9 4.9 5.9 4.5South Africa 0.6 4.8 1.9 1.9 4.5 4.9 4.0
World 100.0 5.8 3.9 3.7 3.5 3.6 2.5
f: forecasts; PPP : Purchasing Power Parities, exchange rate that equates the costs of a broad basket of goods and services across countries; * 2019.Sources: World Bank, Consensus Forecasts and Desjardins, Economic Studies
TABLE 1World GDP growth (adjusted for PPP) and inflation rate
IN %
REAL GDP GROWTH INFLATION RATE
3DECEMBER 2021 | ECONOMIC & FINANCIAL OUTLOOK
ECONOMIC STUDIES
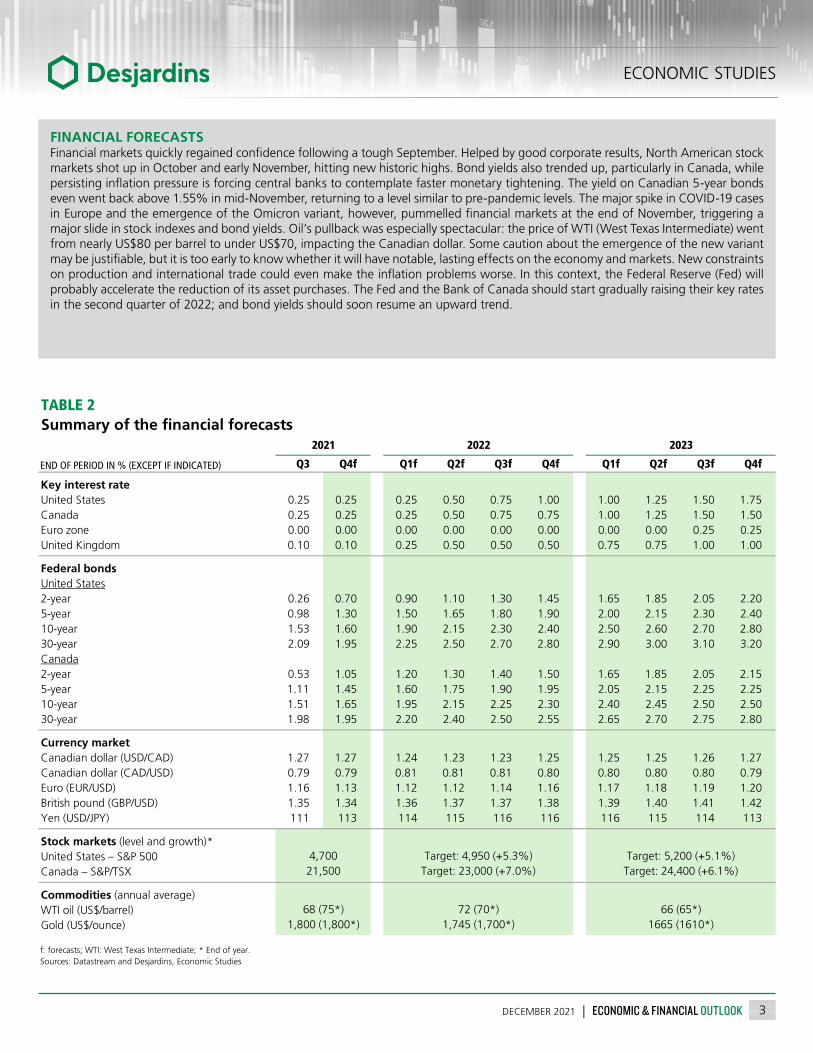
FINANCIAL FORECASTSFinancial markets quickly regained confidence following a tough September. Helped by good corporate results, North American stock markets shot up in October and early November, hitting new historic highs. Bond yields also trended up, particularly in Canada, while persisting inflation pressure is forcing central banks to contemplate faster monetary tightening. The yield on Canadian 5-year bonds even went back above 1.55% in mid-November, returning to a level similar to pre-pandemic levels. The major spike in COVID-19 cases in Europe and the emergence of the Omicron variant, however, pummelled financial markets at the end of November, triggering a major slide in stock indexes and bond yields. Oil’s pullback was especially spectacular: the price of WTI (West Texas Intermediate) went from nearly US$80 per barrel to under US$70, impacting the Canadian dollar. Some caution about the emergence of the new variant may be justifiable, but it is too early to know whether it will have notable, lasting effects on the economy and markets. New constraints on production and international trade could even make the inflation problems worse. In this context, the Federal Reserve (Fed) will probably accelerate the reduction of its asset purchases. The Fed and the Bank of Canada should start gradually raising their key rates in the second quarter of 2022; and bond yields should soon resume an upward trend.
Q3 Q4f Q1f Q2f Q3f Q4f Q1f Q2f Q3f Q4f
Key interest rateUnited States 0.25 0.25 0.25 0.50 0.75 1.00 1.00 1.25 1.50 1.75Canada 0.25 0.25 0.25 0.50 0.75 0.75 1.00 1.25 1.50 1.50Euro zone 0.00 0.00 0.00 0.00 0.00 0.00 0.00 0.00 0.25 0.25United Kingdom 0.10 0.10 0.25 0.50 0.50 0.50 0.75 0.75 1.00 1.00
Federal bondsUnited States2-year 0.26 0.70 0.90 1.10 1.30 1.45 1.65 1.85 2.05 2.205-year 0.98 1.30 1.50 1.65 1.80 1.90 2.00 2.15 2.30 2.4010-year 1.53 1.60 1.90 2.15 2.30 2.40 2.50 2.60 2.70 2.8030-year 2.09 1.95 2.25 2.50 2.70 2.80 2.90 3.00 3.10 3.20Canada2-year 0.53 1.05 1.20 1.30 1.40 1.50 1.65 1.85 2.05 2.155-year 1.11 1.45 1.60 1.75 1.90 1.95 2.05 2.15 2.25 2.2510-year 1.51 1.65 1.95 2.15 2.25 2.30 2.40 2.45 2.50 2.5030-year 1.98 1.95 2.20 2.40 2.50 2.55 2.65 2.70 2.75 2.80
Currency marketCanadian dollar (USD/CAD) 1.27 1.27 1.24 1.23 1.23 1.25 1.25 1.25 1.26 1.27Canadian dollar (CAD/USD) 0.79 0.79 0.81 0.81 0.81 0.80 0.80 0.80 0.80 0.79Euro (EUR/USD) 1.16 1.13 1.12 1.12 1.14 1.16 1.17 1.18 1.19 1.20British pound (GBP/USD) 1.35 1.34 1.36 1.37 1.37 1.38 1.39 1.40 1.41 1.42Yen (USD/JPY) 111 113 114 115 116 116 116 115 114 113
Stock markets (level and growth)*United States – S&P 500Canada – S&P/TSX
Commodities (annual average)WTI oil (US$/barrel)Gold (US$/ounce)
f: forecasts; WTI: West Texas Intermediate; * End of year.Sources: Datastream and Desjardins, Economic Studies
68 (75*) 72 (70*) 66 (65*)1,800 (1,800*) 1,745 (1,700*) 1665 (1610*)
4,700 Target: 4,950 (+5.3%) Target: 5,200 (+5.1%)21,500 Target: 23,000 (+7.0%) Target: 24,400 (+6.1%)
TABLE 2Summary of the financial forecasts
END OF PERIOD IN % (EXCEPT IF INDICATED)
2021 2022 2023

ECONOMIC STUDIES
4DECEMBER 2021 | ECONOMIC & FINANCIAL OUTLOOK
Most of the world’s major advanced economies saw good real GDP growth in the third quarter of 2021, especially in the euro zone, although less in Asia (graph 1). Thanks to vaccination and vaccine passport mandates, it was possible to relax public health measures as of last spring, but the benefits were also felt during the summer. This allowed the service sector and to a lesser extent tourism to start recovering.
The solid economic growth came despite the supply problems haunting manufacturing and other sectors. Moreover, international merchandise shipping costs have risen a lot, particularly for merchandise from Asia (graph 2). This contributed to a slowdown in global trade after several months of catching up following the pandemic’s first wave (graph 3).
Growth in global demand and supply problems along with significant increases in energy and commodity prices contributed to an almost general surge in inflation worldwide. The effects materialized in North America first, but some euro zone nations and the United Kingdom are also seeing consumer prices shoot up (graph 4 on page 5). Inflation is forecast to remain high in the near term, but should start to wane as of mid 2022.
The new COVID-19 wave, seen in Eastern Europe as well as the euro zone, could slow the global supply chain normalization process by triggering new disruptions in the most affected countries. This could amplify the inflation problem. The arrival of the Omicron variant is also a disruptive factor. As a potential drag on production, it further complicates supply issues. It could
OverseasThe Pandemic Is Still Being Felt
FORECASTSThe world’s economy has improved substantially in the last few quarters, but the pandemic is clearly not over yet and its economic impacts are very much with us. The new wave of COVID-19 should limit real GDP growth in the final quarter of 2021, particularly in Europe. For now, the expected fallout is modest, as few countries are resorting to drastic sector shutdowns. The new wave, which could be amplified by the Omicron variant, should also further hamper supply chains. This could amplify the heavy inflation seen in many countries, although the pressures on oil prices could wane. We expect global real GDP growth of 5.8% in 2021, followed by gains of 3.9% in 2022 and 3.7% in 2023. Inflation accelerated substantially in 2021, but should ease in the second half of next year.
GRAPH 1Economic growth was especially strong in Europe in the third quarter
Sources: Organisation for Economic Co-operation and Development and Desjardins, Economic Studies
Real GDP – Variation in Q3 2021
Quarterly annualized variation in %
-4-202468
101214
Austr
alia
Japa
n
Indo
nesia
Mex
ico
Braz
il
China
Kore
a
U.S.
U.K.
Cana
da
Germ
any
Spain
Euro
zone Italy
Fran
ce
GRAPH 2Container transportation costs increased significantly in 2021
Sources: Datastream and Desjardins, Economic Studies
Price to ship a 40-foot container
In US$
0
2,500
5,000
7,500
10,000
12,500
15,000
17,500
20,000
22,500
2018 2019 2020 2021 2022
GlobalAsia to the West coast of the United StatesAsia to Northern Europe
GRAPH 3Global merchandise trade remains high, but has stagnated since last spring
Sources: CPB Netherlands Bureau for Economic Policy Analysis and Desjardins, Economic Studies
Global trade volume
2010 = 100
-20
-15
-10
-5
0
5
10
15
20
25
100
105
110
115
120
125
130
135
2016 2017 2018 2019 2020 2021
Level (left) Annual variation (right)In %

5DECEMBER 2021 | ECONOMIC & FINANCIAL OUTLOOK
ECONOMIC STUDIES
CHINA
China’s economy continues to show signs of slowing. Real GDP grew by only 0.2% in the third quarter (0.8% annualized). Excluding the beginning of 2020, when the first wave of the pandemic was raging, and the identical result for the first quarter of 2021, this is the weakest variation since quarterly data started being published in 2010 (graph 5). Constraints on energy production and the struggling real estate sector will continue to limit growth in 2022. We expect China’s economy to grow 7.9% in 2021, with probable real GDP gains of 4.7% in 2022 and 5.4% in 2023.
also hamper demand if its spread makes governments tighten public health measures or increases consumers’ fears and erodes confidence.
Oil prices are expected to see a lull after surging in 2021. The price per barrel of WTI (West Texas Intermediate) shot up over the year, going from US$47 a barrel in early January to US$84 in November. However, the surge in COVID-19 cases recently pulled it below US$70 a barrel. Although prices are likely to rebound somewhat, the uncertainty surrounding demand could limit gains by oil prices. Given that several increases in supply were expected, an inadequate response from producers could even accentuate the drop in prices.
EURO ZONE
With annualized real GDP growth of 9.3% in the third quarter, the euro zone is getting closer and closer to its pre-pandemic level. It is now only 0.5% from hitting its real GDP for the fourth quarter of 2019. The pace of Euroland’s real GDP growth should be slower in the fourth quarter. Some zone countries have already firmed up public health measures in response to the new wave of cases that mainly emerged in Eastern Europe. The PMI indexes have been declining for several months and household and business confidence have stopped rising. Inflation is also more aggressive, including skyrocketing energy prices. We expect Euroland’s real GDP to grow 5.0% in 2021, followed by gains of 3.7% in 2022 and 1.9% in 2023.
UNITED KINGDOM
After rebounding 23.9% on an annualized basis in the second quarter, Britain’s real GDP rose 5.1% in the third quarter. It is now 2.1% below where it was at the end of 2019. The United Kingdom is also being hobbled by supply chain and merchandise transportation issues, exacerbated by additional post-Brexit complications. The U.K.’s real GDP growth should be 6.8% in 2021, 4.2% in 2022, and 2.2% in 2023.
GRAPH 4Inflation has accelerated almost everywhere, but less in Asia
Sources: Datastream and Desjardins, Economic Studies
Total consumer price index
Annual variation in %
-2-101234567
2019 2020 2021 2022
U.S. Canada Euro zone U.K. GermanyFrance Italy Japan China
GRAPH 5Real GDP growth has slowed sharply in China
Sources: National Bureau of Statistics of China and Desjardins, Economic Studies
Real GDP
Quarterly variation in %
-10-8-6-4-202468
10
2011 2012 2013 2014 2015 2016 2017 2018 2019 2020 2021

ECONOMIC STUDIES
6DECEMBER 2021 | ECONOMIC & FINANCIAL OUTLOOK
The supply problems dogging the global and U.S. economies were still affecting U.S. real GDP growth in the third quarter. They are especially noticeable in the auto industry, where this sector GDP fell 38.4% on an annualized basis. This led to declines in durable goods consumption, investment in equipment, foreign trade, and business inventories. Excluding the automotive sector, quarterly annualized real GDP growth was 3.5% rather than 2.1%.
Thankfully, the automotive industry seems to be starting to improve in recent months. After climbing 5.5% in October, new car sales were down a modest 0.7% in November. Light vehicle assembly also reflects these early steps forward, gaining 19.4% in October. These signs are very tentative and are no guarantee that the supply problems are resolved (we even expect them to keep plaguing the U.S. economy for much of 2022), but they suggest that the worst may be over. Other supply chain bottlenecks are also showing signs of nascent improvement, particularly the ports on the west coast.
Better U.S. economic growth is expected in the fourth quarter than in the third, unless, of course, the Omicron variant disrupts the holidays. Real consumption did well in August (0.7%), September (0.3%) and October (0.7%), yielding a good carryover for the year’s last quarter. Caution is warranted, however, since the recent movement in confidence indexes is fairly negative. In November, the University of Michigan confidence index fell to its lowest point since the fall of 2011 (graph 6). The erosion is partly due to higher inflation, particularly in energy and food. For its part, the recovery of the labour market remains uneven. Job creation was good in October, but disappointed in November. The job market’s shortfall from February 2020 is now 3,912,000 jobs; we expect the gap to close entirely in the fall of 2022.
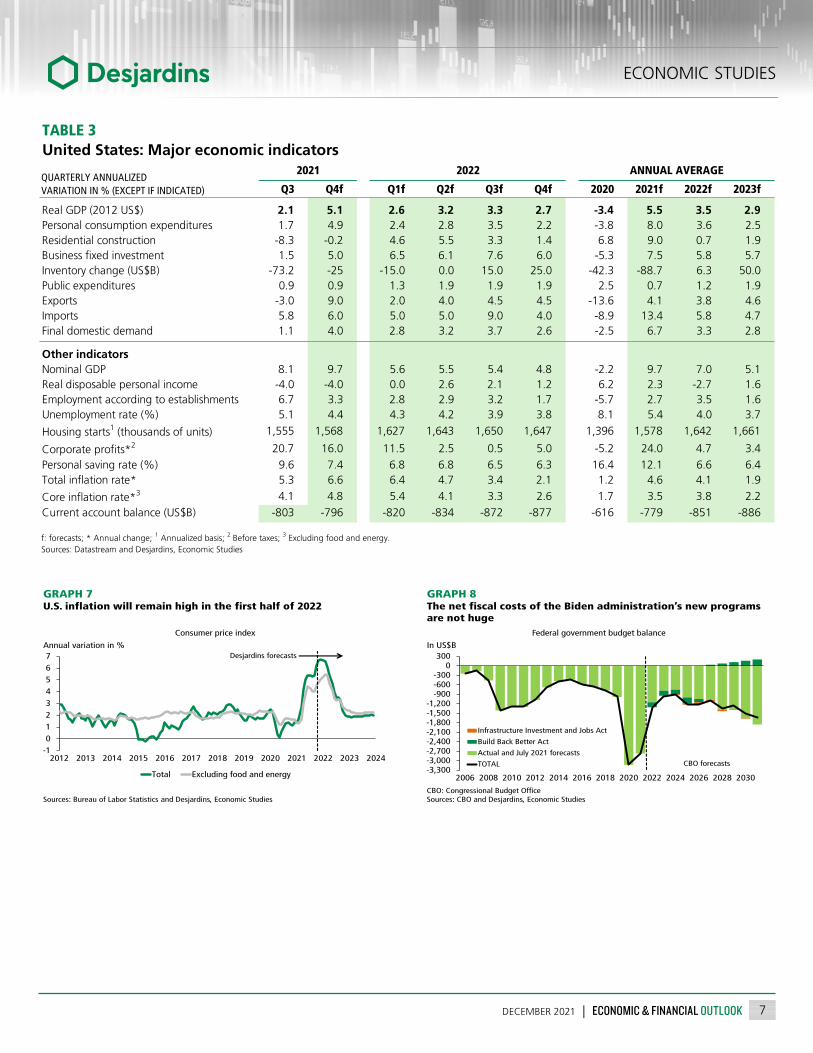
The inflation situation will still be a serious issue in the short-term in the United States. The annual variation in the total consumer price index (CPI) hit 6.6% in October, the highest total inflation since November 1990. The rise in prices is stronger and also
more generalized,1 with over 85% of the goods and services basket recording an increase above the 2% inflation that the Federal Reserve traditionally targets. Inflation should remain elevated in the coming months, as comparisons with last year will support the annual CPI variation despite the expected lull in oil prices. Core inflation, which excludes food and energy, should only peak in the winter of 2022. Inflation should drop back to 3% next fall, then get closer to 2% in 2023 (graph 7 on page 7).
At the time of writing, Congress had still not approved the Biden administration’s social investment project, the Build Back Better Act. Some of the White House’s agenda—the bipartisan agreement on infrastructure (Infrastructure Investment and Jobs Act)—has already been passed, but the amounts committed are fairly low. The part still awaiting a decision from Congress is more ambitious, although its short-term impacts should be modest and its positive consequences, for the labour supply, for example, will probably materialize later (graph 8 on page 7). The question of renewing the debt ceiling could also be back at centre stage shortly.
United StatesSupply Problems: Is the Worst behind Us?
FORECASTSU.S. GDP growth was disappointing in the third quarter of 2021, gaining just 2.1%. The economy was particularly hard hit by supply problems, especially in the auto industry. However, better growth is forecast for the year’s last quarter, with an annualized gain of 5.1%. Inflation should remain high in the near term, and the supply issues should stay in the headlines for some of 2022, then ease. U.S. real GDP should rise 5.5% in 2021, 3.5% in 2022, and 2.9% in 2023.
GRAPH 6The drop in U.S. household confidence seems primarily due to the rise in gas and food prices
Sources: Bureau of Labor Statistics, University of Michigan and Desjardins, Economic Studies
Annual variation in % (inverted scale)
50
60
70
80
90
100
110-15-10-505
101520
2005 2007 2009 2011 2013 2015 2017 2019 2021
Food and energy prices (left, inverted scale)University of Michigan confidence index (right)
Index
1 For more details, see: Is Higher Inflation Widespread in the United States?, Desjardins, Economic Studies, Economic Viewpoint, November 12, 2021, 5 p.
7DECEMBER 2021 | ECONOMIC & FINANCIAL OUTLOOK
ECONOMIC STUDIES
Q3 Q4f Q1f Q2f Q3f Q4f 2020 2021f 2022f 2023f
Real GDP (2012 US$) 2.1 5.1 2.6 3.2 3.3 2.7 -3.4 5.5 3.5 2.9Personal consumption expenditures 1.7 4.9 2.4 2.8 3.5 2.2 -3.8 8.0 3.6 2.5Residential construction -8.3 -0.2 4.6 5.5 3.3 1.4 6.8 9.0 0.7 1.9Business fixed investment 1.5 5.0 6.5 6.1 7.6 6.0 -5.3 7.5 5.8 5.7Inventory change (US$B) -73.2 -25 -15.0 0.0 15.0 25.0 -42.3 -88.7 6.3 50.0Public expenditures 0.9 0.9 1.3 1.9 1.9 1.9 2.5 0.7 1.2 1.9Exports -3.0 9.0 2.0 4.0 4.5 4.5 -13.6 4.1 3.8 4.6Imports 5.8 6.0 5.0 5.0 9.0 4.0 -8.9 13.4 5.8 4.7Final domestic demand 1.1 4.0 2.8 3.2 3.7 2.6 -2.5 6.7 3.3 2.8
Other indicatorsNominal GDP 8.1 9.7 5.6 5.5 5.4 4.8 -2.2 9.7 7.0 5.1Real disposable personal income -4.0 -4.0 0.0 2.6 2.1 1.2 6.2 2.3 -2.7 1.6Employment according to establishments 6.7 3.3 2.8 2.9 3.2 1.7 -5.7 2.7 3.5 1.6Unemployment rate (%) 5.1 4.4 4.3 4.2 3.9 3.8 8.1 5.4 4.0 3.7
Housing starts1 (thousands of units) 1,555 1,568 1,627 1,643 1,650 1,647 1,396 1,578 1,642 1,661
Corporate profits*2 20.7 16.0 11.5 2.5 0.5 5.0 -5.2 24.0 4.7 3.4Personal saving rate (%) 9.6 7.4 6.8 6.8 6.5 6.3 16.4 12.1 6.6 6.4Total inflation rate* 5.3 6.6 6.4 4.7 3.4 2.1 1.2 4.6 4.1 1.9
Core inflation rate*3 4.1 4.8 5.4 4.1 3.3 2.6 1.7 3.5 3.8 2.2Current account balance (US$B) -803 -796 -820 -834 -872 -877 -616 -779 -851 -886
f: forecasts; * Annual change; 1 Annualized basis; 2 Before taxes; 3 Excluding food and energy.Sources: Datastream and Desjardins, Economic Studies
TABLE 3United States: Major economic indicators
QUARTERLY ANNUALIZEDVARIATION IN % (EXCEPT IF INDICATED)
ANNUAL AVERAGE2021 2022
GRAPH 7U.S. inflation will remain high in the first half of 2022
Sources: Bureau of Labor Statistics and Desjardins, Economic Studies
Annual variation in %
-101234567
2012 2013 2014 2015 2016 2017 2018 2019 2020 2021 2022 2023 2024
Total Excluding food and energy
Consumer price index
Desjardins forecasts
GRAPH 8The net fiscal costs of the Biden administration’s new programs are not huge
CBO: Congressional Budget OfficeSources: CBO and Desjardins, Economic Studies
Federal government budget balance
In US$B
-3,300-3,000-2,700-2,400-2,100-1,800-1,500-1,200
-900-600-300
0300
2006 2008 2010 2012 2014 2016 2018 2020 2022 2024 2026 2028 2030
Infrastructure Investment and Jobs Act
Build Back Better Act
Actual and July 2021 forecasts
TOTAL CBO forecasts

ECONOMIC STUDIES
8DECEMBER 2021 | ECONOMIC & FINANCIAL OUTLOOK
After retreating 3.2% (quarterly annualized) in the second quarter, real GDP rebounded in the third quarter, rising 5.4% and beating expectations. Among other things, household consumption spending rose 17.9% over the quarter due to a net acceleration in services when some activities resumed after the third COVID-19 wave. For example, a little more than one third of the increase in household consumption spending came from accommodation and food services. Despite this good news, a number of obstacles persist, which could impact the Canadian economy in the near term.
In terms of the pandemic, several parts of the country are seeing cases spike, and the potential spread of the Omicron variant is raising concerns. That being said, hospitalizations remain relatively low and public health measures are not really being tightened for now.
The pandemic has created substantial supply and demand imbalances for some goods and services. Several industries are reporting supply problems in the context of lively demand as the economy reopens. In Canada, the recent floods in British Columbia temporarily paralyzed merchandise transportation between western and eastern Canada. Note that the Port of Vancouver is a very important freight forwarding hub for the entire Canadian economy. These difficulties have amplified the existing supply problems.
Added to this are the labour shortages. They were already present in some sectors and regions before the pandemic, but with the economic recovery, the scarcity of workers is hitting even harder. Since September, the number of jobs is higher than it was before the pandemic. However, the labour force participation rate (that is, the ratio between the number of people with jobs or looking for jobs in relation to the total population 15 years of age and over) is slightly lower than it was before the pandemic, showing that some imbalances persist. Moreover, a Bank of Canada survey on businesses shows that government pandemic measures and the absenteeism associated with the pandemic have exacerbated the labour
shortage, already impacted by structural problems stemming from demographics and heavy cyclical competition for labour. The number of vacant positions exceeded the one-million mark last September (graph 9). The problem is affecting the accommodation and food services sector and the construction industry in particular.
Substantial efforts are currently in place to resolve the supply problems and labour shortage. Among other things, the Bank of Canada survey of businesses shows that a large proportion of plan to increase their investments in machinery and equipment in the next 12 months. However, it will take several more months for the situation to improve.
In the meantime, the supply and demand imbalances should keep upside pressure on prices for many goods and services. Canada’s total annual inflation rate was 4.7% in October, a level not seen since 2003. Gas, motor vehicle purchases, owned accommodation, food and recreation are the components making particularly large contributions to the annual variation in the consumer price index (graph 10 on page 9). Inflation should peak within the next few months, followed by gradual slowing as some imbalances should fade.
CanadaConsumption Is Fuelling Growth… but Several Obstacles Persist
FORECASTSAccording to Statistics Canada’s interim results, real GDP by industry increased about 0.8% in October. This suggests that the fourth quarter of 2021 will begin on a positive note. Still, November looks more challenging, and a slight decline in real GDP is likely because of the flooding in British Columbia, which worsened supply-chain issues. The repercussions for transportation infrastructure seem to be dissipating fairly quickly, so that production is forecast to return in positive territory in December. As a whole, the fourth quarter could therefore end with annualized growth of about 4%. On average, 2021 could end with a gain of 4.5%, followed by growth of 3.9% in 2022 and 3.1% in 2023.
GRAPH 9Job vacancies on the rise in Canada
* Corresponds to the number of job vacancies relative to all (vacant and occupied) positions.Sources: Statistics Canada and Desjardins, Economic Studies
Job vacancies – Not seasonally adjusted
In number
2.5
3.0
3.5
4.0
4.5
5.0
5.5
6.0
6.5
400,000
500,000
600,000
700,000
800,000
900,000
1,000,000
1,100,000
OCT. NOV. DEC. JAN. FEB. MAR. APR. MAY. JUN. JUL. AUG. SEP.
Job vacancies (left)Job vacancy rate* (right)
In %
2020 2021

9DECEMBER 2021 | ECONOMIC & FINANCIAL OUTLOOK
ECONOMIC STUDIES
Lastly, the housing market, long a major driver in Canada’s economic growth, is continuing the downtrend started last spring. Residential investment fell an annualized 31.3% in the third quarter. Given the expected rise in interest rates and
erosion of affordability due to surging prices, the downtrend should persist in the coming quarters. However, there is a risk the housing market will show unexpected resilience, as indicated by the increase in the number of existing properties sold in September and October.
Q3 Q4f Q1f Q2f Q3f Q4f 2020 2021f 2022f 2023f
Real GDP (2012 $) 5.4 4.4 2.9 5.3 5.0 3.4 -5.2 4.5 3.9 3.1Final consumption expenditure [of which:] 12.1 6.8 4.2 6.1 1.9 1.0 -4.5 5.4 5.2 2.2
Household consumption expenditure 17.9 9.3 5.3 8.2 3.1 2.1 -6.2 5.7 7.2 3.8Governments consumption expenditure -0.7 0.6 1.7 1.0 -0.9 -1.8 0.0 4.9 0.6 -1.5
Gross fixed capital formation [of which:] -13.7 2.9 2.8 4.0 4.4 1.7 -2.8 8.1 3.5 3.5Residential structures -31.3 -6.2 -4.9 -3.3 -3.5 -1.2 4.3 14.1 -8.8 0.5Non-residential structures -1.1 9.4 7.2 9.9 11.3 3.1 -10.0 -4.8 7.1 4.3Machinery and equipment -0.7 6.1 5.5 9.9 12.0 3.7 -15.4 6.8 8.1 4.5Intellectual property products -5.7 9.8 7.4 10.2 11.7 3.2 -3.3 3.1 6.7 4.4Governments gross fixed capital formation 8.7 8.8 10.0 5.5 4.0 4.1 6.2 4.7 6.3 3.4
Investment in inventories (2012 $B) -8.3 0.7 0.7 2.8 11.6 15.9 -18.7 -2.2 7.7 8.4Exports 8.0 5.1 11.1 12.1 10.1 7.2 -9.7 1.1 7.4 6.0Imports -2.3 15.0 14.4 14.6 7.0 2.1 -10.8 7.1 9.8 3.4Final domestic demand 5.4 5.8 3.9 5.5 2.5 1.1 -4.1 5.5 4.1 2.3
Other indicatorsNominal GDP 8.9 7.6 2.4 7.9 6.7 4.6 -4.5 12.4 6.1 4.5Real disposable personal income 2.7 -15.8 1.9 6.1 4.2 2.9 8.4 0.5 -0.4 3.0Employment 7.4 6.0 3.2 2.7 2.7 2.2 -5.2 4.8 4.0 1.9Unemployment rate (%) 7.2 6.2 6.0 5.7 5.5 5.4 9.5 7.5 5.7 5.3
Housing starts1 (thousands of units) 262 233 228 226 223 221 218 270 225 212
Corporate profits*2 12.6 10.0 2.0 8.0 8.0 7.0 -1.9 30.8 6.2 5.0Personal saving rate (%) 11.0 4.8 4.0 3.5 3.7 3.9 14.5 10.7 3.8 2.9Total inflation rate* 4.1 4.7 4.6 4.0 2.8 1.8 0.7 3.4 3.3 2.1
Core inflation rate*3 3.0 3.1 3.2 2.8 2.1 1.8 1.1 2.3 2.5 1.8Current account balance ($B) 1.4 -4.8 -11.9 -13.8 -13.5 -11.9 -39.4 -0.4 -51.0 -46.9
f: forecasts; * Annual change; 1 Annualized basis; 2 Before taxes; 3 Excluding food and energy.Sources: Datastream and Desjardins, Economic Studies
TABLE 4Canada: Major economic indicators
QUARTERLY ANNUALIZEDVARIATION IN % (EXCEPT IF INDICATED)
ANNUAL AVERAGE2021 2022
GRAPH 10Gasoline, motor vehicle purchases, owned accommodation, food and recreation drive up inflation in Canada
Sources: Statistics Canada and Desjardins, Economic Studies
Contributions to the annual variation in the consumer price index
In %
0
1
2
3
4
5
JAN. FEB. MAR. APR. MAY. JUN. JUL. AUG. SEP. OCT.
Gasoline Motor vehicle purchasesOwned accommodation Food purchased from storesFood purchased from restaurants RecreationOther components TOTAL
2021
ECONOMIC STUDIES
10DECEMBER 2021 | ECONOMIC & FINANCIAL OUTLOOK
Employment has completely recovered, but intensifying labour shortages are hampering more and more businesses. Quebec hit a peak of nearly 280,000 unfilled jobs in September. In Quebec, 7.3% of positions are vacant, compared with 6.0% in Canada. Recruiting problems will strengthen as Quebec’s unemployment rate will continue to drop, nearing 4.0% at the end of 2023.
The upward pressures on wages are already intensifying, particularly in the sectors hardest hit by the labour shortage, like accommodation and food services, as well as construction. The rise in labour costs is one more challenge for both the private and public sectors. This fall, the Quebec government awarded substantial wage increases targeted at the health and education sectors. Together, these factors will push up Quebec’s total weekly earnings’ growth. They will advance about 4.0% as of 2022 compared with this year’s 3.5%. The coming increases should be higher than the inflation rate (graph 11).
As elsewhere, inflation has been accelerating since the start of 2021. In Quebec, the annual increase in the consumer price index even hit 5.3% in October, the biggest variation since the start of the 1990s. The province’s economy bounced back quickly, heightening pressures on prices, so that inflation is
growing more rapidly than in Canada as a whole (graph 12). The faster pace is based on most goods and services. Price pressures are very widespread and could persist a few more months, before starting to wane in 2022. The inflation rate should reach 3.2% next year, compared with 3.8% this year.
While the jump in the cost of living will eat into some of the increase in household income, households will be able to draw on the surplus savings accumulated since the pandemic began. The rebound in spending on services, which was delayed by the public health restrictions and late opening of the borders, should therefore pick up speed in the coming quarters. The tourism season was relatively good thanks to relaxed public health measures and extensive travel by Quebecers in the province. However, the scarcity of international tourists continued to plague many merchants and the hotel industry, particularly in Quebec City and Montreal. Activity increased in the accommodation and food services sector, and the arts, entertainment and recreation industry, but they are nowhere near a full recovery. The further loosening of measures in the fall, allowing entertainment venues and restaurants to return to full capacity, should stimulate spending on services. For a while, spending on goods could be hampered by low auto dealer
QuebecThe Economy’s Rebound Gives Way to a Slower Pace
FORECASTSQuebec’s economy completed its recovery period in March, and some signs of flagging are materializing. Real GDP has been seesawing for the last few months, although the public health restrictions have gradually been lifted. The economy slowed in the third quarter following the sharp growth that characterized the catch-up period. As elsewhere, supply problems, the scarcity of labour, and increased costs for businesses will curb economic activity over the coming quarters. In this context, real GDP will increase 6.7% this year, instead of the 7.0% previously expected. Growth is forecast to be 2.8% in 2022 and 2.0% in 2023.
GRAPH 11In Quebec, inflation will take a bite out of wage increases
Source: Desjardins, Economic Studies
Desjardins forecasts
Variation in %
3.8
3.2
2.1
3.5
3.94.1
1.5
2.0
2.5
3.0
3.5
4.0
4.5
2021 2022 2023
Inflation Average weekly earnings
GRAPH 12Quebec’s inflation rate has exceeded Canada’s since last spring
Sources: Statistics Canada and Desjardins, Economic Studies
Consumer price index
Annual variation in %
-1
0
1
2
3
4
5
6
JAN. APR. JUL. OCT. JAN. APR. JUL. OCT. JAN. APR. JUL. OCT.
Canada Quebec
2019 2020 2021
11DECEMBER 2021 | ECONOMIC & FINANCIAL OUTLOOK
ECONOMIC STUDIES
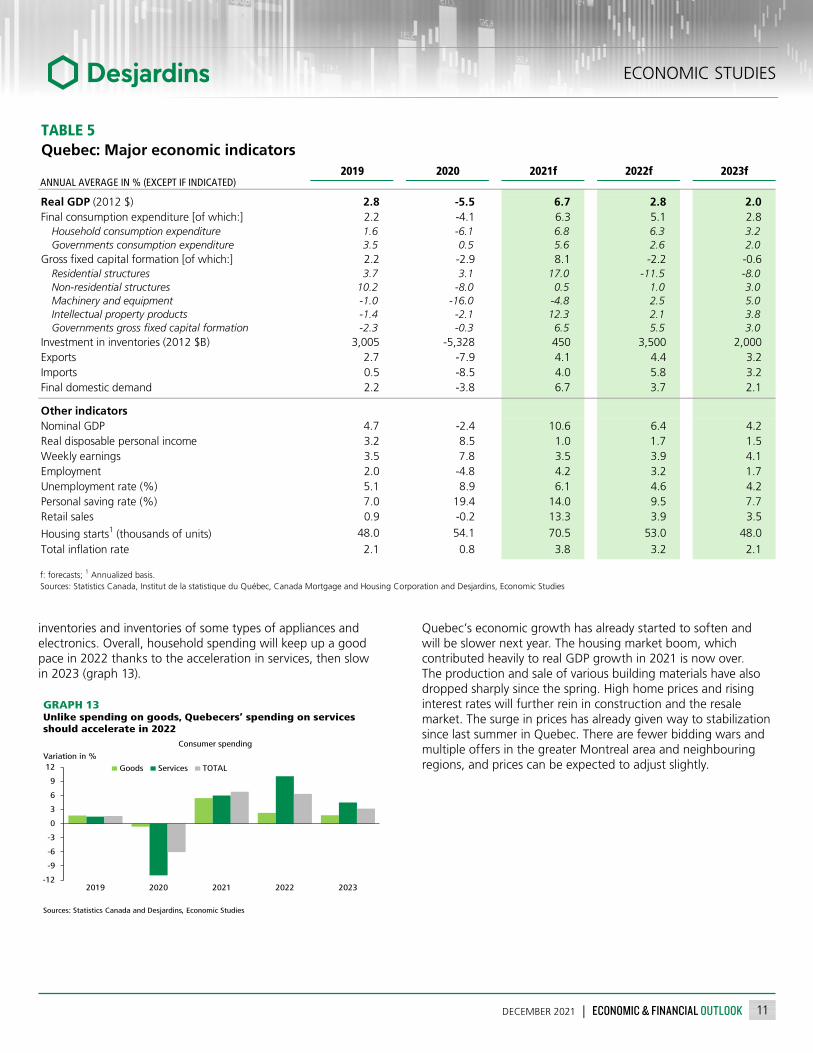
inventories and inventories of some types of appliances and electronics. Overall, household spending will keep up a good pace in 2022 thanks to the acceleration in services, then slow in 2023 (graph 13).
Quebec’s economic growth has already started to soften and will be slower next year. The housing market boom, which contributed heavily to real GDP growth in 2021 is now over. The production and sale of various building materials have also dropped sharply since the spring. High home prices and rising interest rates will further rein in construction and the resale market. The surge in prices has already given way to stabilization since last summer in Quebec. There are fewer bidding wars and multiple offers in the greater Montreal area and neighbouring regions, and prices can be expected to adjust slightly.
2019 2020 2021f 2022f 2023f
Real GDP (2012 $) 2.8 -5.5 6.7 2.8 2.0Final consumption expenditure [of which:] 2.2 -4.1 6.3 5.1 2.8
Household consumption expenditure 1.6 -6.1 6.8 6.3 3.2Governments consumption expenditure 3.5 0.5 5.6 2.6 2.0
Gross fixed capital formation [of which:] 2.2 -2.9 8.1 -2.2 -0.6Residential structures 3.7 3.1 17.0 -11.5 -8.0Non-residential structures 10.2 -8.0 0.5 1.0 3.0Machinery and equipment -1.0 -16.0 -4.8 2.5 5.0Intellectual property products -1.4 -2.1 12.3 2.1 3.8Governments gross fixed capital formation -2.3 -0.3 6.5 5.5 3.0
Investment in inventories (2012 $B) 3,005 -5,328 450 3,500 2,000Exports 2.7 -7.9 4.1 4.4 3.2Imports 0.5 -8.5 4.0 5.8 3.2Final domestic demand 2.2 -3.8 6.7 3.7 2.1
Other indicatorsNominal GDP 4.7 -2.4 10.6 6.4 4.2Real disposable personal income 3.2 8.5 1.0 1.7 1.5Weekly earnings 3.5 7.8 3.5 3.9 4.1Employment 2.0 -4.8 4.2 3.2 1.7Unemployment rate (%) 5.1 8.9 6.1 4.6 4.2Personal saving rate (%) 7.0 19.4 14.0 9.5 7.7Retail sales 0.9 -0.2 13.3 3.9 3.5
Housing starts1 (thousands of units) 48.0 54.1 70.5 53.0 48.0Total inflation rate 2.1 0.8 3.8 3.2 2.1
TABLE 5Quebec: Major economic indicators
ANNUAL AVERAGE IN % (EXCEPT IF INDICATED)
f: forecasts; 1 Annualized basis.Sources: Statistics Canada, Institut de la statistique du Québec, Canada Mortgage and Housing Corporation and Desjardins, Economic Studies
GRAPH 13Unlike spending on goods, Quebecers’ spending on services should accelerate in 2022
Sources: Statistics Canada and Desjardins, Economic Studies
Consumer spending
Variation in %
-12
-9
-6
-3
0
3
6
9
12
2019 2020 2021 2022 2023
Goods Services TOTAL

ECONOMIC STUDIES
12DECEMBER 2021 | ECONOMIC & FINANCIAL OUTLOOK
ONTARIO
Particularly hard hit by difficulties from the pandemic’s third wave in spring 2021, the Ontario economy has been pushed to the fore of supply issues, particularly in the automotive industry. According to Canadian real GDP data by industry, motor vehicle manufacturing saw its fourth consecutive quarterly decline last summer (graph 14). There is every reason to believe these difficulties will persist for a few more months before a return to normal. In addition, as in most provinces, labour shortages have resurfaced in Ontario, impairing some businesses’ ability to meet increased demand. The job vacancy rate in Ontario rose from 3.3% in February to 5.6% in September, but was still slightly below the provincial average. Since the beginning of 2021, international immigration has started growing again in Ontario, after a very slow year in 2020, which is likely helping to fill some unmet labour needs.
Sharply higher household spending nationwide in the third quarter is welcome news for Ontario’s economy. As the province was coming out of lockdown during the period, spending in certain areas is expected to be markedly higher. For instance, Ontario saw the third quarter retail sales soar 32.4% (in
annualized values), the highest growth in Canada (graph 15). In these conditions, Ontario real GDP is pegged to be back the black in the third quarter, after contracting at an annualized 3.0% in the spring. Ultimately, our scenario now calls for real GDP to grow 4.3% in 2021, followed by gains of 3.9% in 2022 and 3.2% in 2023.
WESTERN PROVINCES
According to Canadian real GDP by industry data, crop sector production fell for the 13th consecutive month in September (graph 16 on page 13), owing in part to harsh weather conditions with major droughts hitting the Prairies last summer. Saskatchewan and Manitoba have been particularly affected.
Alberta is also impacted by problems in its agricultural sector. On the other hand, a rebounding oil industry is helping drive the province’s economic recovery. Indeed, oil export volumes were up sharply in the third quarter. The local business conditions index has improved significantly in the Calgary area since the beginning of 2021, although there has been a slight downturn
Ontario and Other ProvincesAlberta May Outperform Other Provinces
FORECASTSAll provinces experienced real GDP pull back sharply in 2020 due to the adverse effects of the pandemic. Each is pegged to return to expansion as early as 2021, yet the economic recovery is uneven. Driven by a rebounding energy sector, above-average real GDP growth is expected to set Alberta apart. The outlook is not as rosy for Manitoba and Saskatchewan, where droughts weighed heavily on the agricultural sector in 2021. Due to challenges sparked by supply issues and recent flooding, Ontario and British Columbia could report real GDP growth slightly below the national average in 2021 but are expected to outperform starting in 2022. Growth in the Atlantic provinces should be below the national average.
GRAPH 15Consumer spending particularly strong in Ontario this summer
Sources: Statistics Canada and Desjardins, Economic Studies
Q3 variation in the value of retail sales – Annualized rate
In %
-1.4 -1.8-4.6
0.9
32.4
4.10.2
21.1
-2.9-0.9
-10
-5
0
5
10
15
20
25
30
35
B.C. Alta. Sask. Man. Ont. Que. N.B. N.S. P.E.I. N.L.
GRAPH 14The auto industry is still facing stiff challenges
Sources: Statistics Canada and Desjardins, Economic Studies
Canada – Real GDP for motor vehicle manufacturing
In 2012 $B
0
1
2
3
4
5
6
7
JAN. MAR. MAY. JUL. SEP. NOV. JAN. MAR. MAY. JUL. SEP.2020 2021

13DECEMBER 2021 | ECONOMIC & FINANCIAL OUTLOOK
ECONOMIC STUDIES
recently, and Alberta boasted the highest growth gain for 2021 of any province according to the economic activity index.
In British Columbia, the focus is obviously on the recent flooding, which will cause major economic disruptions in November. However, a gradual return to normal is expected to begin in December.
ATLANTIC PROVINCES
Overall, economic growth in the Atlantic provinces is set to continue underperforming the national average in the next few years. Oil production continues to trend lower in Newfoundland and Labrador. In the Maritimes, hardships continue in the tourism sector, despite foreign tourists being replaced in part by visitors from other provinces.
2019 2020 2021f 2022f 2023f
Real GDP (2012 $) 2.0 -5.1 4.3 3.9 3.2Final consumption expenditure [of which:] 1.5 -5.8 5.2 5.4 2.4
Household consumption expenditure 1.6 -7.8 5.1 7.0 3.8Governments consumption expenditure 1.0 -0.2 5.5 0.9 -1.5
Gross fixed capital formation [of which:] -0.7 1.3 11.8 0.3 2.8Residential structures 0.3 6.8 19.1 -9.7 0.7Non-residential structures 1.4 -0.1 -2.6 8.1 5.0Machinery and equipment -0.5 -12.6 13.2 8.7 4.9Intellectual property products -2.4 1.0 7.6 5.5 3.6Governments gross fixed capital formation -3.9 3.1 3.8 5.9 3.5
Investment in inventories (2012 $B) 8,922 -5,283 5,000 8,000 7,000Exports 2.3 -7.3 -1.6 6.0 5.0Imports 0.6 -8.9 5.1 8.1 3.5Final domestic demand 1.0 -4.3 6.9 4.4 2.5
Other indicatorsNominal GDP 3.7 -2.8 11.1 6.2 4.8Real disposable personal income 3.2 9.4 1.4 -1.3 2.8Weekly earnings 2.7 7.3 3.8 2.3 2.3Employment 2.8 -4.8 4.9 4.8 1.9Unemployment rate (%) 5.6 9.6 8.0 6.0 5.6Personal saving rate (%) 0.1 15.4 7.5 2.6 1.6Retail sales 2.3 -3.5 7.6 6.3 6.0
Housing starts1 (thousands of units) 69.0 81.3 98.8 82.3 78.4Total inflation rate* 1.9 0.7 3.5 3.4 2.2
TABLE 6Ontario: Major economic indicators
ANNUAL AVERAGE IN % (EXCEPT IF INDICATED)
f: forecasts; * Annual change; 1 Annualized basis.Sources: Statistics Canada, Ontario's Ministry of Finance, Canada Mortgage and Housing Corporation and Desjardins, Economic Studies
GRAPH 16Crop production hit by droughts
Sources: Statistics Canada and Desjardins, Economic Studies
Canada – Real GDP for crop production
In 2012 $B
212223242526272829303132
2018 2019 2020 2021

ECONOMIC STUDIES
14DECEMBER 2021 | ECONOMIC & FINANCIAL OUTLOOK
2019 2020 2021f 2022f 2023f
Real GDP growth – Canada 1.9 -5.2 4.5 3.9 3.1Atlantic 2.7 -3.5 2.6 3.0 2.0Quebec 2.8 -5.5 6.7 2.8 2.0Ontario 2.0 -5.1 4.3 3.9 3.2Manitoba 0.4 -4.6 3.3 3.0 2.7Saskatchewan -1.1 -4.9 3.0 4.0 3.0Alberta -0.1 -7.9 4.9 5.5 4.0British Columbia 3.1 -3.4 3.9 4.5 3.5
Total inflation rate – Canada 1.9 0.7 3.4 3.3 2.1Atlantic 1.5 0.2 4.0 3.8 2.5Quebec 2.1 0.8 3.8 3.2 2.1Ontario 1.9 0.7 3.5 3.4 2.2Manitoba 2.2 0.5 3.3 3.1 2.0Saskatchewan 1.7 0.6 2.6 2.7 1.9Alberta 1.8 1.1 3.2 3.1 2.2British Columbia 2.3 0.8 2.8 2.7 2.0
Employment growth – Canada 2.2 -5.2 4.8 4.0 1.9Atlantic 1.7 -4.1 3.7 1.6 1.3Quebec 2.0 -4.8 4.2 3.2 1.7Ontario 2.8 -4.8 4.9 4.8 1.9Manitoba 1.0 -3.7 3.5 2.6 1.8Saskatchewan 1.9 -4.7 2.5 2.0 1.5Alberta 0.7 -6.6 5.0 4.0 2.5British Columbia 3.0 -6.6 6.6 4.5 2.2
Unemployment rate – Canada 5.7 9.5 7.5 5.7 5.3Atlantic 8.7 10.8 9.6 7.5 7.0Quebec 5.1 8.9 6.1 4.6 4.2Ontario 5.6 9.6 8.0 6.0 5.6Manitoba 5.3 8.0 6.5 5.0 4.6Saskatchewan 5.6 8.4 6.7 5.1 4.7Alberta 7.0 11.4 8.8 6.7 6.2British Columbia 4.7 8.9 6.6 5.0 4.6
Retail sales growth – Canada 1.2 -1.3 11.1 6.0 5.1Atlantic 1.9 0.1 13.8 7.1 4.0Quebec 0.9 -0.2 13.3 3.9 3.5Ontario 2.3 -3.5 7.6 6.3 6.0Manitoba 0.8 0.8 14.0 7.5 5.0Saskatchewan 0.3 -1.1 10.5 5.5 4.0Alberta -0.8 -2.3 12.5 6.5 5.0British Columbia 0.6 2.4 13.2 7.0 6.0
Housing starts – Canada (thousands of units) 208.7 217.8 270.1 224.6 212.2Atlantic 10.1 10.3 12.3 9.8 8.8Quebec 48.0 54.1 70.5 53.0 48.0Ontario 69.0 81.3 98.8 82.3 78.4Manitoba 6.9 7.3 7.6 6.3 6.0Saskatchewan 2.4 3.1 4.1 3.7 3.5Alberta 27.3 24.0 31.1 28.5 27.5British Columbia 44.9 37.7 45.7 41.0 40.0
TABLE 7Canada: Major economic indicators by provinces
ANNUAL AVERAGE IN % (EXCEPT IF INDICATED)
f: forecastsSources: Statistics Canada, Institut de la statistique du Québec, Ontario's Ministry of Finance, Canada Mortgage and Housing Corporationand Desjardins, Economic Studies

15DECEMBER 2021 | ECONOMIC & FINANCIAL OUTLOOK
ECONOMIC STUDIES
Economic growth will slow over the medium term, likely dropping below 2% in the United States and Canada. This pace would be consistent with potential GDP growth, which will continue to be hobbled by the labour shortage. Inflationary pressures should be more visible than in the previous economic cycle, and they will combine with other challenges, such as the energy transition, debt loads and financial stability.
Beware of InflationGiven the labour shortage, it will be easier for the unemployment rate to stay low over the coming years. On the other hand, inflation could become more visible. Firstly, the labour shortage itself could be a vector for inflation by resulting in faster wage growth than in the previous economic cycle, and in higher costs for businesses. Businesses will also have a hard time meeting demand if they can’t hire all the staff they need. However, productivity gains could be achieved, which would help curb inflation pressure.
The surplus savings accumulated during the pandemic is a short-term issue for inflation, but one that could persist over the medium term. It is hard to predict how the savings will be released into the economy, and the extent to which it could push up demand and inflationary pressure in the coming years. A wealth effect fueled by the strong increase in the value of many assets over the last two years could also come into play. People whose wealth has increased could push up their consumption.
Lastly, inflation expectations could also affect the pace of price increases for goods and services. Price adjustments will tend to be bigger if consumer and business expectations are higher. So far, most inflation expectation indicators are fairly stable for the medium and long term. However, a Federal Reserve Bank of New York indicator recently raised some concern, showing a strong increase in inflation expectations over a three-year horizon (graph 17).
Higher Interest Rates NecessaryThe central banks will certainly not want to let above-target inflation settle in on a lasting basis. This is why several interest rate increases have been incorporated into the short-term scenario, with additional increases forecast for the medium term. This will curb demand growth and keep inflation expectations entrenched. The top of the target range for the U.S. federal funds rate should be at 2.50% in 2024. In Canada, we expect the overnight rate to be 2.00%.
Higher interest rates combined with a reduction in the liquidity being injected into the financial markets should also limit
inflation in assets. The stock market is expected to make smaller gains over the medium term. The housing market should also keep moderating. Home prices are likely to decrease slightly in some markets.
A Shakier EconomyIn comparison with previous periods of high inflation, the forecast increases in interest rates remain small. Our medium-term forecasts take the economy’s weaknesses into consideration. In particular, there are issues with debt. Many households and businesses are carrying a lot of debt and could have trouble handling more interest rate increases. Governments also have a debt issue, particularly after all the expenses incurred during the pandemic. The pressure on public finances will also be heavy because of the investments that will have to be made to really tackle the energy transition. Lastly, there is also a risk from the perspective of financial stability. Overly forceful interest rate increases could cause asset values to correct sharply and put the economy back in a tough position.
Medium-Term Issues and ForecastsMany Challenges on the Horizon
GRAPH 17Keep an eye on rising inflation expectations
* University of Michigan consumer confidence index; ** Federal Reserve Bank of New York.Sources: University of Michigan, Federal Reserve Bank of New York and Desjardins, Economic Studies
Inflation expectations in the United States
In %
2.0
2.5
3.0
3.5
4.0
4.5
5.0
2010 2011 2012 2013 2014 2015 2016 2017 2018 2019 2020 2021 2022
Consumers* – 1-year
Consumers** – 3-year
Consumers* – 5-year

ECONOMIC STUDIES
16DECEMBER 2021 | ECONOMIC & FINANCIAL OUTLOOK
2020 2021f 2022f 2023f 2024f 2025f 2026f 2016–2020 2021–2026f
United StatesReal GDP (var. in %) -3.4 5.5 3.5 2.9 2.1 1.6 1.7 1.1 2.9Total inflation rate (var. in %) 1.2 4.6 4.1 1.9 2.2 2.1 2.0 1.8 2.8Unemployment rate 8.1 5.4 4.0 3.7 3.7 3.7 3.5 5.0 4.0
S&P 500 index (var. in %)1 16.3 25.1 5.3 5.1 3.0 3.0 5.0 13.6 7.8Federal funds rate 0.54 0.25 0.45 1.20 2.00 2.50 2.50 1.27 1.48Prime rate 3.54 3.25 3.45 4.20 5.00 5.50 5.50 4.27 4.48Treasury bills – 3-month 0.37 0.05 0.45 1.20 2.00 2.40 2.40 1.14 1.42Federal bonds – 10-year 0.89 1.45 2.20 2.65 3.00 3.05 3.05 2.02 2.57Federal bonds – 30-year 1.56 2.05 2.55 3.05 3.35 3.40 3.40 2.55 2.97WTI oil (US$/barrel) 39 68 72 66 65 64 60 51 66Gold (US$/ounce) 1,771 1,800 1,745 1,665 1,600 1,600 1,600 1,388 1,668
CanadaReal GDP (var. in %) -5.2 4.5 3.9 3.1 1.9 1.6 1.7 0.7 2.8Total inflation rate (var. in %) 0.7 3.4 3.3 2.1 2.3 2.0 2.1 1.6 2.5Employment (var. in %) -5.2 4.8 4.0 1.9 1.5 1.0 1.2 0.3 2.4Employment (thousands) -986 854 654 390 294 211 240 41 440Unemployment rate 9.5 7.5 5.7 5.3 5.2 4.9 4.8 6.9 5.5Housing starts (thousands of units) 218 270 225 212 218 215 220 211 227
S&P/TSX index (var. in %)1 2.2 23.3 7.0 6.1 4.0 4.0 5.0 6.6 8.2Exchange rate (US$/C$) 0.75 0.79 0.81 0.80 0.79 0.78 0.78 0.76 0.79Overnight funds 0.56 0.25 0.55 1.30 1.90 2.00 2.00 0.98 1.33Prime rate 2.75 2.45 2.75 3.50 4.10 4.20 4.20 3.18 3.53Mortgage rate – 1-year 3.25 2.80 3.00 3.55 4.05 4.10 4.10 3.33 3.60Mortgage rate – 5-year 4.95 4.80 5.20 5.60 5.75 5.75 5.75 4.98 5.48Treasury bills – 3-month 0.44 0.10 0.60 1.35 1.94 2.00 2.00 0.93 1.33Federal bonds – 2-year 0.51 0.50 1.35 1.95 2.20 2.20 2.20 1.15 1.73Federal bonds – 5-year 0.60 0.95 1.80 2.15 2.30 2.30 2.30 1.28 1.97Federal bonds – 10-year 0.75 1.35 2.15 2.45 2.60 2.60 2.60 1.53 2.29Federal bonds – 30-year 1.21 1.85 2.40 2.75 2.90 2.90 2.90 1.92 2.62Yield spreads (Canada—United States)Treasury bills – 3-month 0.07 0.05 0.15 0.15 -0.06 -0.40 -0.40 -0.21 -0.09Federal bonds – 10-year -0.14 -0.10 -0.05 -0.20 -0.40 -0.45 -0.45 -0.49 -0.28Federal bonds – 30-year -0.35 -0.20 -0.15 -0.30 -0.45 -0.50 -0.50 -0.63 -0.35
QuebecReal GDP (var. in %) -5.5 6.7 2.8 2.0 1.7 1.4 1.6 0.9 2.7Total inflation rate (var. in %) 0.8 3.8 3.2 2.1 2.2 2.0 2.1 1.3 2.6Employment (var. in %) -4.8 4.2 3.2 1.7 1.5 1.0 1.1 0.4 2.1Employment (thousands) -209 170 140 75 65 45 50 -6 91Unemployment rate 8.9 6.1 4.6 4.2 4.0 3.8 3.6 6.6 4.4Retail sales (var. in %) -0.2 13.3 3.9 3.5 3.5 3.0 3.0 3.3 5.0Housing starts (thousands of units) 54 71 53 48 44 41 42 47 50
OntarioReal GDP (var. in %) -5.1 4.3 3.9 3.2 1.9 1.7 1.8 1.1 2.8Total inflation rate (var. in %) 0.7 3.5 3.4 2.2 2.4 2.1 2.1 1.7 2.6Employment (var. in %) -4.8 4.9 4.8 1.9 1.4 1.1 1.2 0.5 2.6Employment (thousands) -355 337 331 158 110 88 97 35 187Unemployment rate 9.6 8.0 6.0 5.6 5.2 4.8 4.7 6.7 5.7Retail sales (var. in %) -3.5 7.6 6.3 6.0 4.5 3.7 4.0 3.6 5.4Housing starts (thousands of units) 81 99 82 78 80 78 78 77 83
f: forecasts; WTI : West Texas Intermediate; 1 Variations are based on observation of the end of period.Sources: Datastream, Statistics Canada, Institut de la statistique du Québec, Ontario's Ministry of Finance, Canada Mortgage and Housing Corporationand Desjardins, Economic Studies
TABLE 8Medium-term major economic and financial indicators
IN % (EXCEPT IF INDICATED)
ANNUAL AVERAGE AVERAGES


![Workplace and the Americans with Pandemic Preparedness in the · objective, factual information, "not on subjective perceptions . . . [or] irrational fears" about a specific disability](https://static.fdocuments.in/doc/165x107/5fd7b000112f0e0c62170af2/workplace-and-the-americans-with-pandemic-preparedness-in-the-objective-factual.jpg)