STRONG BANKABLE FEASIBILITY STUDY RESULTS...
66
Image Resources NL ABN 57 063 977 579 Ground Floor, 23 Ventnor Ave West Perth WA 6005 | PO Box 469 West Perth WA 6872 T: 08 9485 2410 | F: 08 9486 8312 www.imageres.com.au Page 1 of 11 30 May 2017 __________________________________________________________________________________ STRONG BANKABLE FEASIBILITY STUDY RESULTS BOONANARRING / ATLAS PROJECT _________________________________________________________________________________________________________________ HIGHLIGHTS: • Low project capital cost estimate of A$52M inclusive of ~$8M for resalable land; • Project Pre-Tax NPV of A$135M at 8% discount rate; • Project Pre-Tax IRR of 64%; • Payback period of 22 months; • Off-Take Agreement for 100% of products/revenue in place; • Relocatable capital equipment to produce HMC already acquired; • First production targeted for March 2018; • Upside Opportunities at and near Boonanarring including: o Confirmed potential to extend mine life with high grade mineralisation; o Potential to process lower grade overlying layer of mineralisation; o Several other deposits with high grade Mineral Resources in the vicinity. _________________________________________________________________________________ Image Resources NL (ASX: IMA) (“Image” or “the Company”) is pleased to announce the results of a Bankable Feasibility Study (BFS) on its 100%-owned Boonanarring and Atlas mineral sands deposits (collectively the ‘Project’) located in the infrastructure-rich North Perth Basin, with Boonanarring approximately 80 km north of Perth, Western Australia. The Project is considered a very low capital cost project when compared to other mineral sand projects (Figure 3) with a rapid payback period estimated at just 22 months. The BFS includes estimated project capital costs of approximately A$52M with approximately $8M for the purchase of land which is resalable following the completion of mining and rehabilitation. The pre-tax NPV for the Project is estimated to be A$135M, based on TZMI forecast mineral sands prices (Figure 1), using an 8% discount rate, with a corresponding IRR of 64%. Importantly, using current ‘spot’ commodity prices as at 30 April with no escalation in future years, results in a very healthy pre-tax NPV estimate of A$58M. This estimate will increase as commodity prices rise; for example, as recently announced by Iluka Resources indicating a zircon price increase of US$130/tonne (up to US$1,100/tonne), scheduled to take effect 1 July 2017.
Transcript of STRONG BANKABLE FEASIBILITY STUDY RESULTS...

Image Resources NL ABN 57 063 977 579
Ground Floor, 23 Ventnor Ave West Perth WA 6005 | PO Box 469 West Perth WA 6872 T: 08 9485 2410 | F: 08 9486 8312
www.imageres.com.au Page 1 of 11
30 May 2017
__________________________________________________________________________________
STRONG BANKABLE FEASIBILITY STUDY RESULTS BOONANARRING / ATLAS PROJECT
_________________________________________________________________________________________________________________
HIGHLIGHTS:
• Low project capital cost estimate of A$52M inclusive of ~$8M for resalable land;
• Project Pre-Tax NPV of A$135M at 8% discount rate;
• Project Pre-Tax IRR of 64%;
• Payback period of 22 months;
• Off-Take Agreement for 100% of products/revenue in place;
• Relocatable capital equipment to produce HMC already acquired;
• First production targeted for March 2018;
• Upside Opportunities at and near Boonanarring including:
o Confirmed potential to extend mine life with high grade mineralisation;
o Potential to process lower grade overlying layer of mineralisation;
o Several other deposits with high grade Mineral Resources in the vicinity.
_________________________________________________________________________________
Image Resources NL (ASX: IMA) (“Image” or “the Company”) is pleased to announce the results of a Bankable Feasibility Study (BFS) on its 100%-owned Boonanarring and Atlas mineral sands deposits (collectively the ‘Project’) located in the infrastructure-rich North Perth Basin, with Boonanarring approximately 80 km north of Perth, Western Australia.
The Project is considered a very low capital cost project when compared to other mineral sand projects (Figure 3) with a rapid payback period estimated at just 22 months. The BFS includes estimated project capital costs of approximately A$52M with approximately $8M for the purchase of land which is resalable following the completion of mining and rehabilitation.
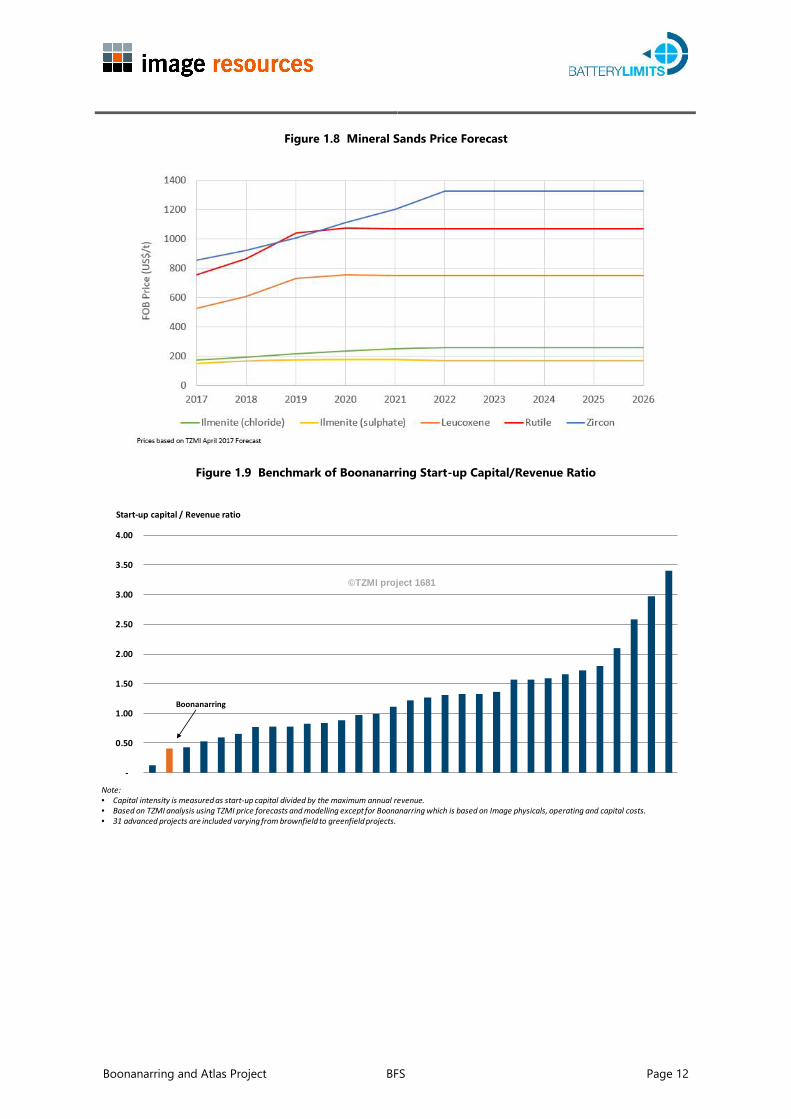
The pre-tax NPV for the Project is estimated to be A$135M, based on TZMI forecast mineral sands prices (Figure 1), using an 8% discount rate, with a corresponding IRR of 64%. Importantly, using current ‘spot’ commodity prices as at 30 April with no escalation in future years, results in a very healthy pre-tax NPV estimate of A$58M. This estimate will increase as commodity prices rise; for example, as recently announced by Iluka Resources indicating a zircon price increase of US$130/tonne (up to US$1,100/tonne), scheduled to take effect 1 July 2017.
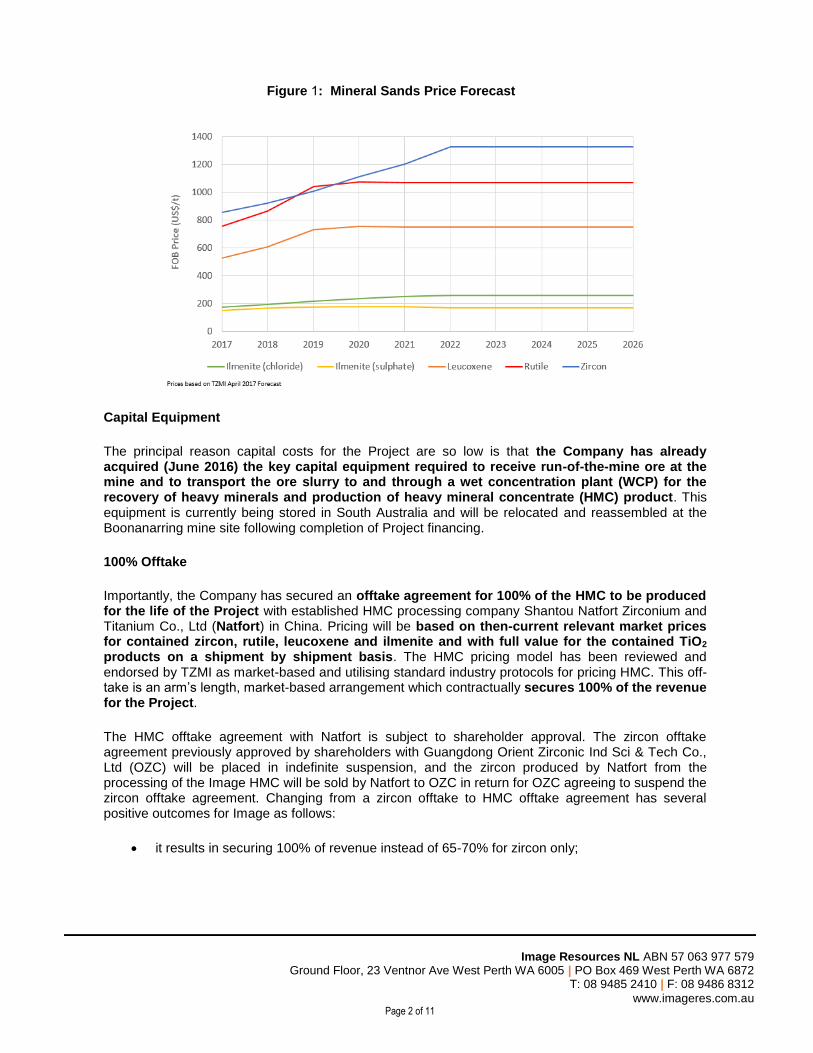
Image Resources NL ABN 57 063 977 579 Ground Floor, 23 Ventnor Ave West Perth WA 6005 | PO Box 469 West Perth WA 6872
T: 08 9485 2410 | F: 08 9486 8312
www.imageres.com.au Page 2 of 11
Figure 1: Mineral Sands Price Forecast
Capital Equipment
The principal reason capital costs for the Project are so low is that the Company has already acquired (June 2016) the key capital equipment required to receive run-of-the-mine ore at the mine and to transport the ore slurry to and through a wet concentration plant (WCP) for the recovery of heavy minerals and production of heavy mineral concentrate (HMC) product. This equipment is currently being stored in South Australia and will be relocated and reassembled at the Boonanarring mine site following completion of Project financing.
100% Offtake
Importantly, the Company has secured an offtake agreement for 100% of the HMC to be produced for the life of the Project with established HMC processing company Shantou Natfort Zirconium and Titanium Co., Ltd (Natfort) in China. Pricing will be based on then-current relevant market prices for contained zircon, rutile, leucoxene and ilmenite and with full value for the contained TiO2 products on a shipment by shipment basis. The HMC pricing model has been reviewed and endorsed by TZMI as market-based and utilising standard industry protocols for pricing HMC. This off-take is an arm’s length, market-based arrangement which contractually secures 100% of the revenue for the Project.
The HMC offtake agreement with Natfort is subject to shareholder approval. The zircon offtake agreement previously approved by shareholders with Guangdong Orient Zirconic Ind Sci & Tech Co., Ltd (OZC) will be placed in indefinite suspension, and the zircon produced by Natfort from the processing of the Image HMC will be sold by Natfort to OZC in return for OZC agreeing to suspend the zircon offtake agreement. Changing from a zircon offtake to HMC offtake agreement has several positive outcomes for Image as follows:
• it results in securing 100% of revenue instead of 65-70% for zircon only;

Image Resources NL ABN 57 063 977 579
Ground Floor, 23 Ventnor Ave West Perth WA 6005 | PO Box 469 West Perth WA 6872 T: 08 9485 2410 | F: 08 9486 8312
www.imageres.com.au Page 3 of 11
• it provides faster access to revenue as letters of credit can be converted to cash as soon as each shipment of HMC departs the Bunbury port, as compared to having to wait until the HMC is processed into final products and the zircon is loaded and departs the port of loading;
• it minimises total working capital requirements by A$7-8M due to the faster receipt of revenue; and
• it eliminates Image’s risks and potential extra costs associated with HMC processing (separation) including processing and delivery schedules, product quality issues, administration and marketing.
Project Upside Potential
The Project BFS is based on current Ore Reserves at Boonanarring and Atlas with a combined mine life of over 8 years. Importantly, there are a number of opportunities to extend the Project mine life including potential future production from a confirmed 5.6km extension area of high grade mineralisation to the north of Boonanarring that is within economic pumping distance of the planned location of the WCP (ASX announcement 13 March 2017 – Outstanding Drill Results Confirm 5.6km High Grade Extension of Boonanarring Deposit). Similarly, there is potential for extension of the Boonanarring deposit to the south and potential for extension of the current deposit at Atlas to the south, as well as potential additional Ore Reserves stemming from a reassessment of existing Mineral Resources if and as general market conditions and commodity prices improve.
In addition, consultant Optiro Pty Ltd identified a significant layer of lower grade mineralisation overlying high grade mineralised ore at Boonanarring in the update of the Mineral Resources estimate in accordance with the JORC Code (2012), (ASX announcement 13 January 2017 – Tonnage Doubles in Mineral Resources Update for Boonanarring Project). Only a small proportion of this mineralisation was included in the mine plan for the BFS. Consequently, there is an opportunity to process the balance of this material as commodity prices further improve.
Finally, Image has several other high-grade mineral sands projects with mineral resources in the vicinity of Boonanarring, that could potentially be accessed for mining in the coming years, by dry mining method and WCP processing as planned for Boonanarring and Atlas. These projects include Red Gully, Gingin South and Regans Ford which is still under application. Image also has two high-grade projects in the vicinity of Atlas that could potentially be accessed in the coming years, being Hyperion and Helene, with Hyperion potentially within pumping distance of the Atlas deposit.
Go-Forward Plan/Process
The Project has been on a fast-track development basis since June 2016, with project commissioning scheduled to occur in Q1 2018 and first production anticipated as early as March 2018. Now that the BFS has been completed, Image plans to continue to fast-track the development of the Project by proceeding directly to seeking to secure Project financing through a combination of debt and equity. However other project financing methods will also be considered. The Company has engaged the services of PCF Capital Group to assist with the debt portion of the financing.
In addition, Image’s project team and consultants will continue to review capital and operating costs to determine if any aspects of the plan can be further optimised to reduce overall costs.

Image Resources NL ABN 57 063 977 579 Ground Floor, 23 Ventnor Ave West Perth WA 6005 | PO Box 469 West Perth WA 6872
T: 08 9485 2410 | F: 08 9486 8312
www.imageres.com.au Page 4 of 11
BFS RESULTS
Financial Overview
The BFS is based on independent third party engineering, costings and pricing assumptions and financial modelling. BFS results demonstrates the Project is a relatively low capital cost project at only A$52M which includes approximately 15% for the purchase of land associated with the Boonanarring deposit. Pre-tax NPV is robust at A$135M based on an 8% discount rate, and a post-tax NPV of A$100M. Pre-tax and post-tax Internal Rate of Return (IRR) are 64% and 54% respectively.
The Project will provide significant returns and rapid payback on capital, estimated at only 22 months. Key financial metrics are summarised in Table 1.
Assuming the HMC offtake agreement will operate as contracted, Project cashflows are strong and will 100% underpin the life of the Project. Month by month revenue, operating costs, capital expenditure, tax and cash flow financial model projections are presented in Figure 2. Project Net Revenues, Royalties, Operating Costs and EBITDA are presented in Table 2.
Table 1: Project Financial Metrics
Valuation Date 1-Jul-17
Discount Rate 8%
Pre-Tax Project NPV (A$M) 135
Post-Tax Project NPV (A$M) 100
Pre-Tax IRR 64%
Post-Tax IRR 54%
Payback Period - From Construction Start (years) 2.2
Payback Period - From First Production (years) 1.8
Project Capital (A$M) 52
Note: figures presented in this Table are rounded.
Figure 2: Project Monthly Revenue, Costs and Cashflow
Source: Image/PCF Capital

Image Resources NL ABN 57 063 977 579
Ground Floor, 23 Ventnor Ave West Perth WA 6005 | PO Box 469 West Perth WA 6872 T: 08 9485 2410 | F: 08 9486 8312
www.imageres.com.au Page 5 of 11
Table 2: Project Net Revenues, Operating Costs and EBITDA
A$M, Real 2017 Prices Boonanarring Atlas Project
Revenue 553 240 793
Royalties (26) (11) (37)
Net Revenue 527 229 756
Operating Costs (336) (154) (490)
EBITDA 191 75 266
Sensitivity Analysis
The Project is relatively sensitive to movements in commodity prices, particularly zircon, as 60-70% of revenue is expected to be generated from contained zircon. Another key sensitivity is the A$:US$ exchange rate, given HMC will be priced in US$, whereas most of the capital and operating costs will be denominated in A$. Other areas of sensitivity are ore grade, HM recovery to product and operating costs.
Importantly, using ‘spot’ commodity prices and $A:$US exchange rate (as at 30 April 2017) with no escalations, results in a very positive project NPV of A$58M at an 8% discount rate. Moreover, mineral sands commodity prices have recently started trending upwards and are continuing to rise, as demonstrated by a recent announcement by Iluka Resources indicating a zircon price increase of US$130/tonne (up to US$1,100/tonne), scheduled to take effect 1 July 2017.
As a demonstration of the sensitivity of commodity prices, if the average price of all four mineral sand commodities increase 20% from TZMI commodity projections used in the financial model, the project NPV increases sharply to more than A$250M. Figure 3 displays various Project sensitivities.
Project Mine Life
Project economics are based on known current Ore Reserves for an initial 5 year mine life at Boonanarring followed by a move to Atlas to add a further 3 years to overall life of mine, as detailed in the financial model.
Figure 3: Project Sensitivity Analysis

Image Resources NL ABN 57 063 977 579
Ground Floor, 23 Ventnor Ave West Perth WA 6005 | PO Box 469 West Perth WA 6872 T: 08 9485 2410 | F: 08 9486 8312
www.imageres.com.au Page 6 of 11
Capital Costs
Total development capital for Boonanarring is estimated at A$52M. Approximately A$8M of this total is attributable to land purchases which will be available for resale once mine rehabilitation has been completed on each parcel.
The Boonanarring capital cost estimate for the Project has been prepared in accordance with capital cost estimating guidelines and BFS study standards. The inputs to this Study generally meet or exceed the requirements for BFS capital estimating. The total capital cost estimate complies with the
required accuracy range of 15%. Atlas is at PFS level of study. Peak cash draw for the development of Boonanarring is estimated at A$64M.
Figure 4 shows the relative capital cost for development of the Boonanarring deposit as compared to other mineral sands projects and demonstrates Boonanarring is a very low capital cost project.
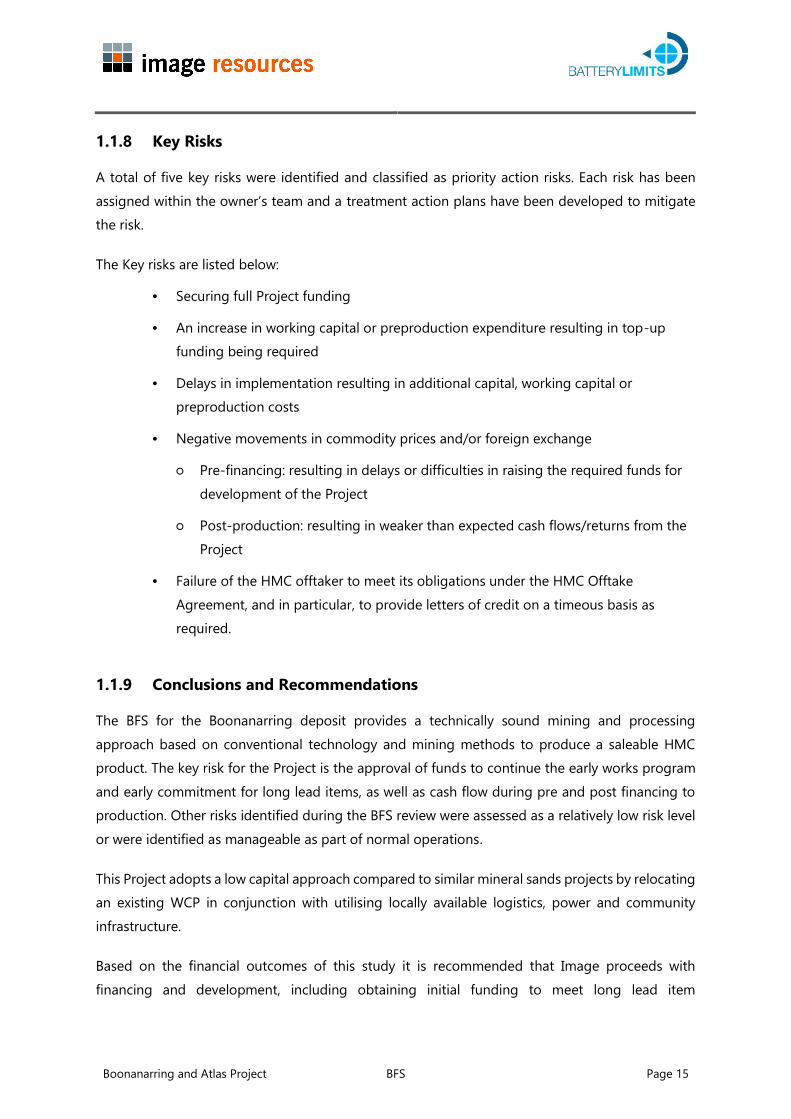
Figure 5 shows the relative comparison of the capital cost/revenue ratio for Boonanarring versus other mineral sands projects and once again demonstrates the very low capital cost of the project,
Figure 4: Project Capital Comparison (Source: TZMI; May 2017)
-
100
200
300
400
500
600
STA
- Fu
ngon
i
BPL
- Cop
i Nth
IMA
- Bo
onan
arri
ng
MZI
- Ke
ysbr
ook
Cris
tal -
Atl
as-
Cam
pasp
e
DRX
- Cy
clon
e
WTH
- Ra
nobe
ILU
- Ca
taby
ATR
- D
onal
d
TRO
X - F
airb
reez
e
SFX
- Thu
nder
bird
BSE
- Kw
ale
MU
- W
IM15
0
A$M
Note: • Data sourced from company reports in the public domain.• United States dollar capital costs are converted to Australian Dollars using an exchange rate of 0.75 (AUD:USD).• Cataby has a range of A$250M to A$275M, midpoint used in this analysis.• Ranobe capital cost is based on the 2012 DES estimate.
©TZMI project 1681
Figure 5: Start-up Capital/Revenue Comparison (Source: TZMI; May 2017)
-
0.50
1.00
1.50
2.00
2.50
3.00
3.50
4.00
Start-up capital / Revenue ratio
Note: • Capital intensity is measured as start-up capital divided by the maximum annual revenue.• Based on TZMI analysis using TZMI price forecasts and modelling except for Boonanarring which is based on Image physicals, operating and capital costs.• 31 advanced projects are included varying from brownfield to greenfield projects.
©TZMI project 1681
Boonanarring

Image Resources NL ABN 57 063 977 579
Ground Floor, 23 Ventnor Ave West Perth WA 6005 | PO Box 469 West Perth WA 6872 T: 08 9485 2410 | F: 08 9486 8312
www.imageres.com.au Page 7 of 11
Revenues
The Project will produce HMC containing four main products: ilmenite (both sulphate and chloride grades), leucoxene, rutile and zircon. Revenue will be based on the sale of HMC as a final product but with pricing based on then-current commodity pricing for each of the four main products. Project revenues are estimated at A$793M (Boonanarring: A$553M; Atlas: A$240M).
Zircon contained in the HMC is the key value driver representing 68% and 40% of total revenue for Boonanarring and Atlas respectively. Boonanarring zircon recovered is expected to be sold as standard grade zircon, however there is potential for some premium grade product. Atlas HMC is expected to produce a premium zircon product.
HMC Off-take Agreement
The potential cashflows, and hence financing for the Project, will be underpinned by a life-of-Project offtake agreement for all HMC produced. The offtake agreement is with Natfort Zirconium and Titanium Co., Ltd (Natfort), a private HMC processing company in China, which processed HMC from Murray Zircon’s Mindarie Mineral Sands Project in South Australia and sold the zircon to Orient Zirconic Sci Ind & Tech Co., Ltd. (OZC) for the past five years. Natfort (previously Shantou Guofu Zirconium and Titanium Co., Ltd) is located in Shantou City in the Guongdong Province in China and was established in 2012. Natfort focuses exclusively on processing mineral sands concentrates to produce zircon for sale to OZC and TiO2 products for sale to its customers in China.
Key highlights of the HMC offtake agreement are that 100% of HMC produced from the Project will be sold, with no minimum specification on HMC quality. Pricing for HMC will be based on a pricing model reviewed and endorsed by TZMI and which was confirmed to be market-based using published commodity prices (CIF China) with adjustments for the specific quality of Project products. The pricing model also includes allowances for HMC processing costs, foreign exchange rates, port handling and transport to the separation plant in China, estimated recoveries and an agreed 5% profit margin for the processor (Natfort).
HMC sales will be supported by Letters of Credit from Natfort based on the predetermined value of the HMC per the HMC pricing model. Natfort’s LCs will, in commercial effect, be indirectly supported by the provision of LCs from OZC to Natfort for the purchase of a minimum of 90% of the zircon produced by Natfort from the processing of the Image HMC. The existing zircon offtake agreement between Image and OZC will be indefinitely suspended during the period of operation of the HMC offtake agreement with Natfort.
Operating Costs
Project Operating costs are estimated at A$489M (Boonanarring: A$336M; Atlas A$154M). Details are provided in Table 3.
Logistics
During operations, all HMC supply-chain activities will be undertaken by a logistics contractor. The contractor will employ a team to oversee and arrange all activities that will allow HMC to be transported, stockpiled and loaded for shipping to China. Roads and logistics facilities are well established.

Image Resources NL ABN 57 063 977 579
Ground Floor, 23 Ventnor Ave West Perth WA 6005 | PO Box 469 West Perth WA 6872 T: 08 9485 2410 | F: 08 9486 8312
www.imageres.com.au Page 8 of 11
Table 3: Project Operating Costs
Item Boonanarring Atlas
A$M A$/t HMC(1) A$M A$/t HMC(1)
Mining 206.8 185.5 62.5 87.80
Processing 34.3 30.7 19.7 27.7
Direct cost 241.1 216.2 82.2 115.5
Land Access 0.6 0.5 0.5 0.6
Native Title Payments - - 1.5 2.2
Site Admin 19.8 17.8 18.9 26.6
Logistics(2) 73.9 66.3 50.9 71.6
Subtotal Operating Cost 335.4 300.8 154.0 216.5
Royalties(3) 26.0 23.4 10.9 15.4
MRF Levy(4) 0.1 0.1 0.1 0.1
Total Operating Costs(5) 361.5 324.2 165.0 232.0
Table Notes:
(1) Based on total HMC production of 1,115kt for Boonanarring and 711kt for Atlas
(2) Includes road transport, port charges and shipping
(3) Royalties are charged on the value of HMC sold at 5% (and treated as a deduction against revenues).
(4) Mineral Rehabilitation Fund Levy is charged at an average rate per hectare of disturbance
(5) Excluding capitalised pre-strip of A$7.5M included in initial development capital
Key Risks
Key risks were identified and classified as priority action risks. Each risk has been assigned within the owner’s team and action plans have been developed to mitigate the risks. The key risks include:
• Securing full Project capital funding;
• An increase in working capital or preproduction expenditure resulting in top-up funding being required;
• Delays in implementation resulting in additional capital, working capital or preproduction costs;
• Negative movements in commodity prices and/or foreign exchange;
○ Pre-financing: resulting in delays or difficulties in raising the required funds for development of the Project;
○ Post-production: resulting in weaker than expected cash flows/returns from the Project;
• Failure of the HMC offtaker to meet its obligations under the HMC Offtake Agreement, and in particular to provide letters of credit on a timeous basis as required;
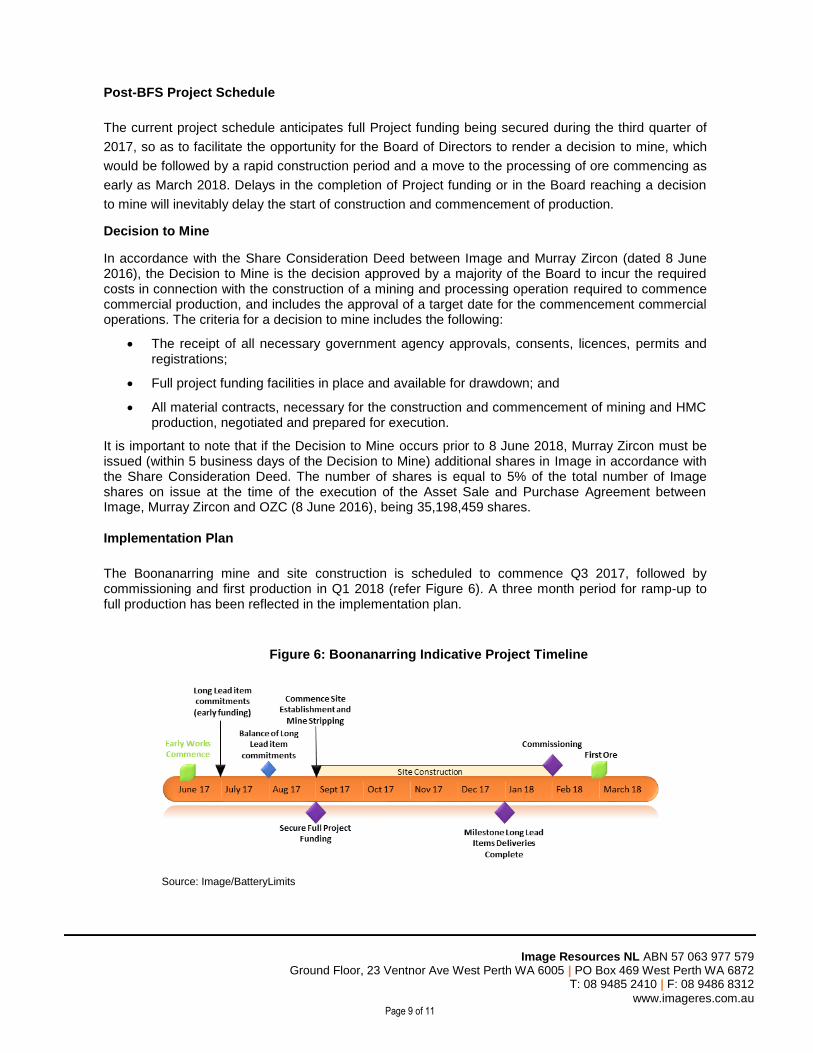
Image Resources NL ABN 57 063 977 579
Ground Floor, 23 Ventnor Ave West Perth WA 6005 | PO Box 469 West Perth WA 6872 T: 08 9485 2410 | F: 08 9486 8312
www.imageres.com.au Page 9 of 11
Post-BFS Project Schedule
The current project schedule anticipates full Project funding being secured during the third quarter of
2017, so as to facilitate the opportunity for the Board of Directors to render a decision to mine, which
would be followed by a rapid construction period and a move to the processing of ore commencing as
early as March 2018. Delays in the completion of Project funding or in the Board reaching a decision
to mine will inevitably delay the start of construction and commencement of production.
Decision to Mine
In accordance with the Share Consideration Deed between Image and Murray Zircon (dated 8 June 2016), the Decision to Mine is the decision approved by a majority of the Board to incur the required costs in connection with the construction of a mining and processing operation required to commence commercial production, and includes the approval of a target date for the commencement commercial operations. The criteria for a decision to mine includes the following:
• The receipt of all necessary government agency approvals, consents, licences, permits and registrations;
• Full project funding facilities in place and available for drawdown; and
• All material contracts, necessary for the construction and commencement of mining and HMC production, negotiated and prepared for execution.
It is important to note that if the Decision to Mine occurs prior to 8 June 2018, Murray Zircon must be issued (within 5 business days of the Decision to Mine) additional shares in Image in accordance with the Share Consideration Deed. The number of shares is equal to 5% of the total number of Image shares on issue at the time of the execution of the Asset Sale and Purchase Agreement between Image, Murray Zircon and OZC (8 June 2016), being 35,198,459 shares.
Implementation Plan
The Boonanarring mine and site construction is scheduled to commence Q3 2017, followed by commissioning and first production in Q1 2018 (refer Figure 6). A three month period for ramp-up to full production has been reflected in the implementation plan.
Figure 6: Boonanarring Indicative Project Timeline
Source: Image/BatteryLimits

Image Resources NL ABN 57 063 977 579
Ground Floor, 23 Ventnor Ave West Perth WA 6005 | PO Box 469 West Perth WA 6872 T: 08 9485 2410 | F: 08 9486 8312
www.imageres.com.au Page 10 of 11
Opportunities
The following opportunities will be considered during the detailed design and implementation stages of the Project as summarised in Table 4.
Table 4: Project Opportunities
Opportunity Impact Comment
Refurbished and/or second-hand plant and equipment
Reduced Capital cost Review and optimise equipment selection during details design stage
Processing Overlying mineralisation
Reduced strip ratio, increases HMC tonnes
Review and control blending based on grade during mining
Dry milling of HMC to Magnetic and Non-magnetic concentrates or final products
Reduced transport, improved revenue, increased process cost
Review once plant is operational
BFS Conclusions and Recommendations
Based on the financial outcomes of the BFS and subject to Board approval, it is anticipated that Image will proceed with Project financing and development, including funding considerations to meet orders for certain long-lead items including a slimes thickener, ore slurry attritioner and high voltage design and procurement. Early commitment to long-lead items will minimise delays in implementation of the Boonanarring development schedule.
See attached BFS Executive Summary by Battery Limits for additional information. For further information, please contact: Patrick Mutz Managing Director +61 8 9485 2410 [email protected] www.imageres.com.au
COMPLIANCE STATEMENT
The Mineral Resources (as reported for Boonanarring on 13 January 2017 in ASX announcement
‘Tonnage Doubles in Mineral Resources Update for Boonanarring Project’ and for Atlas on 8 May
2017 in ASX announcement ‘68% Increase in Mineral Resource Resources for Atlas Project’) have
been compiled by Mrs Christine Standing, who is a Member of the Australasian Institute of
Mining and Metallurgy (AusIMM) and the Australian Institute of Geoscientists (AIG). Mrs Standing is a
full-time employee of Optiro Pty Ltd and has sufficient experience which is relevant to the style of
mineralisation and type of deposit under consideration and to the activity which she is undertaking to
qualify as a Competent Person as defined in the 2012 Edition of the ‘Australasian Code for Reporting
of Exploration Results, Mineral Resources and Ore Reserves’.
The Ore Reserves (as reported for Boonanarring on 10 April 2017 in ASX announcement ‘Updated
Ore Reserves for Boonanarring Project increases ore tonnes by 39%’ and for Atlas on 30 May 2017 in

Image Resources NL ABN 57 063 977 579
Ground Floor, 23 Ventnor Ave West Perth WA 6005 | PO Box 469 West Perth WA 6872 T: 08 9485 2410 | F: 08 9486 8312
www.imageres.com.au Page 11 of 11
ASX announcement ‘Ore Reserves update for 100% owned Atlas Project’) have been compiled by
Jarrod Pye, Mining Engineer and full-time employee of Image Resources, under the direction of
Andrew Law of Optiro, who is a Fellow of the Australasian Institute of Mining and Metallurgy. Mr
Law has sufficient experience in Ore Reserves estimation relevant to the style of mineralisation and
type of deposit under consideration to qualify as a Competent Person as defined in the 2012 Edition
of the “Australasian Code for Reporting of Mineral Resources and Ore Reserves”.

Image Resources
Boonanarring and Atlas Project
Bankable Feasibility Study
Revision: 0
Date: 29/05/2017

Boonanarring and Atlas Project BFS Page 1
QA/CA
Revision Purpose Prepared By Reviewed By Date Final Sign Off
A Issued for InternalReview
J Khosa/FCalcei P Hearse 25/05/17
B Issued for ClientReview F Calcei T Colton 29/5/17
0 Issued for BFS
F Calcei
P Hearse 29/5/17
P Hearse
pp
Disclaimer
This document has been prepared by BatteryLimits for the use of Image Resources Ltd (“therecipient”), based on the assumptions identified throughout the text and upon information anddata supplied by third parties. While BatteryLimits has used its reasonable endeavours (followingmethodology and procedures, and exercised due care consistent with the intended level ofaccuracy, using its professional judgement and reasonable care) to verify the accuracy andcompleteness of information provided to it and on which it has relied in compiling the document,it cannot provide any warranty as to the accuracy or completeness of such information to anyperson.
Any reliance by the recipient or any other parties on this document is entirely at their own risk.BatteryLimits does not accept any responsibility for any interpretation, opinion or conclusion thatthe recipient or any other parties may form as a result of examining the document; or to informthe recipient or any other parties of any matter arising or coming to BatteryLimits’ notice whichmay affect or qualify any information which BatteryLimits provides to the recipient.

Boonanarring and Atlas Project BFS Page 2
1. Executive Summary
1.1 Project Overview
This Bankable Feasibility Study (BFS) covers the development of the high grade Boonanarring andAtlas mineral sands deposits located in the North Perth Basin in Western Australia and 100% ownedby Image Resources NL (Image).
Study assumptions include dry, open cut mining and conventional wet gravity separation at aprocessing rate of 500 dry tonnes per hour to recovery the Heavy Minerals into Heavy MineralConcentrate (HMC) for direct sale under an off-take agreement. Mining will begin at Boonanarringand the processing plant will be located near the mid-point of the 13km long deposit and willremain in place for the life of mine.
Mining will be conducted by a qualified mining contractor incorporating concurrent tailingsdisposal and rehabilitation of mined-out areas. After mining is completed at Boonanarring, themining fleet and processing equipment will be relocated to Atlas. Total life of the current reservesfor both deposits is 8+ years with significant opportunities for mine life extension, especially withregard to high grade extensions of the deposit at Boonanarring. Near Atlas are the Hyperion andHelene deposits of which Helene is within potential pumping distance of Atlas.
HMC product will be transported to Bunbury for bulk loading and shipping to the mineralseparation plant owned by the off-taker.
The BFS was started in July 2016 as a process of updating Image’s 2013 feasibility study to abankable standard and to incorporate the wet concentration plant and ancillary equipmentpurchased in June 2016, as well as updating all costs, assumptions and commodity prices. Basedon the financial outcomes of this study it is recommended that Image proceeds with financing anddevelopment.
The basis for this recommendation is summarised as follows:
Pre-Tax NPV1 of A$135M at an 8% discount rate
IRR1 of 64% and pre-tax EBITDA1 of A$266M
Rapid payback of capital post production estimated at less than 2 years
Initial development capital, including contingency and resalable land of only A$52M(refer to Table 1.1).
1. NPV = Net Present Value: IRR = Internal Rate of Return; EBITDA = Earnings Before Income Tax,Depreciation and Amortisation.
Other major factors considered in supporting this recommendation:
Conventional nature of the development
Relatively low risk of significant capital overruns or delays as the majority of thecapital equipment is already owned

Boonanarring and Atlas Project BFS Page 3
Significant opportunities for extension to base case mine life
Heavy mineral concentrate offtake agreement for 100% of production
Improving outlook for higher heavy mineral commodity prices
Boonanarring contains high HM and zircon grades, compared to other potentialmineral sands projects (refer to Figure 1.1 and Figure 1.2).
Table 1.1 Project Key Indices
Project Key Indices
Valuation Date Date 1-Jul-17
Discount Rate % 8
Pre-Tax Project NPV A$M 135
EBITDA A$M 266
Pre-Tax IRR % 64
Payback Period - From First Production Months 22
Initial Development Capital A$M 52
Average Operating Cost - Life of Project A$/t HMC 273
Total HMC Production - Life of Project Mt 1.83
Figure 1.1 Benchmark of Capital Cost for Various Mineral Sands Projects
-
100
200
300
400
500
600
STA
- Fun
goni
BPL
- Cop
i Nth
IMA
- Boo
nana
rrin
g
MZI
- Ke
ysbr
ook
Crist
al -
Atla
s-Ca
mpa
spe
DRX
- Cyc
lone
WTH
- Ra
nobe
ILU
- Cat
aby
ATR
- Don
ald
TROX
- Fa
irbre
eze
SFX
- Thu
nder
bird
BSE
- Kw
ale
MU
- WIM
150
A$M
Note:• Data sourced from company reports in the public domain.• United States dollar capital costs are converted to Australian Dollars using an exchange rate of 0.75 (AUD:USD).• Cataby has a range of A$250M to A$275M, midpoint used in this analysis.• Ranobe capital cost is based on the 2012 DES estimate.
©TZMI project 1681

Boonanarring and Atlas Project BFS Page 4
Figure 1.2 Benchmark of Boonanarring and Atlas Ore Grades Among Peers

Boonanarring and Atlas Project BFS Page 5
1.1.1 Introduction
This report discusses the technical feasibility and economics of developing mining and processingoperations to extract heavy mineral bearing sands and recover the contained Heavy Minerals (HM)from the Boonanarring and Atlas deposits, collectively referred to as ‘the Project’. Both depositsare 100% owned by Image Resources NL (Image) (refer to Figure 1.3).
Figure 1.3 Boonanarring and Atlas Location Plan
This study was compiled in accordance with the standards of a Bankable Feasibility Study (BFS) andparticularly focusses on the Boonanarring deposit, located 80 km north of Perth in WesternAustralia, and includes, at a Preliminary Feasibility Study (PFS) level, Image’s Atlas project located80 km north of Boonanarring.
The BFS is based on mining the Boonanarring deposit first, using conventional, dry, open pit miningtechniques to extract the ore, and using standard gravity separation in a Wet Concentration Plant(WCP) to recover the contained Heavy Minerals (HM) into a Heavy Minerals Concentrate (HMC) forsale. The HMC will be transported by road to a storage facility at Bunbury where it will be loadedonto ships and transported in bulk to China.
This study is based on current ore reserves at Boonanarring (total of 20 Mt @ 7.2% HM) asdetermined in accordance with the JORC Code (2012). Based on known ore reserves, mining and

Boonanarring and Atlas Project BFS Page 6
processing at Boonanarring will continue for approximately 5 years. Once mining at Boonanarringis completed, the WCP will be relocated to the Atlas deposit. Mining at Atlas will also be by dry,open cut mining techniques. Based on current ore reserves at Atlas (total of 9.5 Mt @ 8.1% HM),mining and processing will continue for a further 3 years.
The BFS is based on utilisation of the WCP (Figure 1.4) and associated ancillary equipment acquiredby Image from Murray Zircon Pty Ltd in June 2016, and which was previously utilised successfullyat the Mindarie Mineral Sands Project in South Australia. The WCP and associated equipment isbeing stored in South Australia and will be relocated to Boonanarring following project capitalfunding.
The plant and equipment will undergo necessary minor modifications required to meet WAenvironmental and other regulatory requirements, as well as appropriate engineering standardsand other modifications required to maximise heavy mineral recovery based on the Boonanarringore metallurgical characteristics.
Figure 1.4 The Image Wet Processing Plant located in South Australia
As mining of the Atlas deposit is more than 5 years in the future from the publication of this study,Atlas has been compiled at a preliminary feasibility study (PFS) level with an upgrade to a BFSplanned to be completed approximately two (2) years prior to the completion of mining atBoonanarring. Outputs from the Atlas PFS have been used in the Project BFS financial model.
The Atlas PFS includes the relocation of the WCP including associated equipment, infrastructureand mining operations from Boonanarring when mining at Boonanarring has been completed. Theoverall project concept for Atlas follows the same mining, processing and logistics pathway asBoonanarring.
Boonanarring and Atlas Project BFS Page 7
1.1.2 Tenement Holding
Image Resources’ North Perth Basin (NPB) project area consists of a total of 29 granted tenementsand 6 tenement applications covering a total 1,000 km2 between 80 km and 180 km north of Perthin Western Australia (refer to Figure 1.3). Within these tenements, Image has secured a number ofheavy mineral sands strandline deposits with including Boonanarring, Atlas, Red Gully, RegansFord, Gingin North, Gingin South, Hyperion, Helene and Bidaminna. The mineralisation in theproject area stretches along the Gingin Scarp from south of Gingin to 15 km inland from thetownship of Cervantes. The heavy mineral deposits delineated within the Image’s NPB projects areheld under a combination of Exploration Licences, Prospecting Licences and Mining Leases.
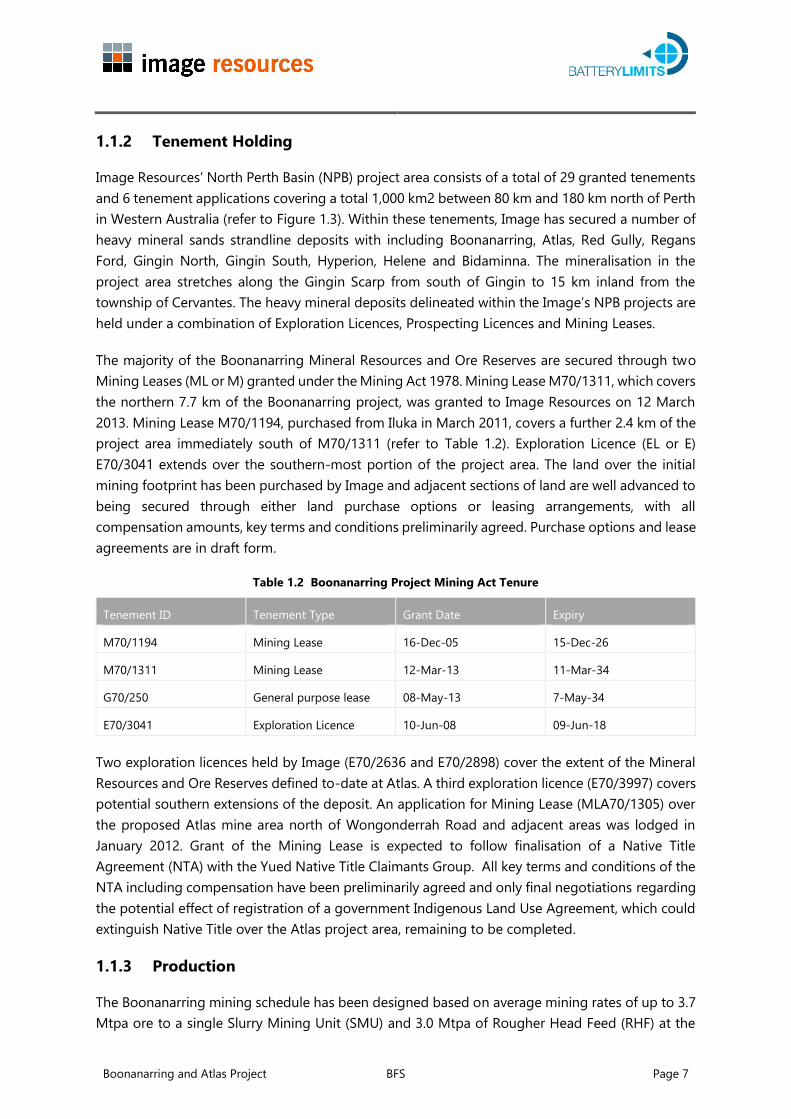
The majority of the Boonanarring Mineral Resources and Ore Reserves are secured through twoMining Leases (ML or M) granted under the Mining Act 1978. Mining Lease M70/1311, which coversthe northern 7.7 km of the Boonanarring project, was granted to Image Resources on 12 March2013. Mining Lease M70/1194, purchased from Iluka in March 2011, covers a further 2.4 km of theproject area immediately south of M70/1311 (refer to Table 1.2). Exploration Licence (EL or E)E70/3041 extends over the southern-most portion of the project area. The land over the initialmining footprint has been purchased by Image and adjacent sections of land are well advanced tobeing secured through either land purchase options or leasing arrangements, with allcompensation amounts, key terms and conditions preliminarily agreed. Purchase options and leaseagreements are in draft form.
Table 1.2 Boonanarring Project Mining Act Tenure
Tenement ID Tenement Type Grant Date Expiry
M70/1194 Mining Lease 16-Dec-05 15-Dec-26
M70/1311 Mining Lease 12-Mar-13 11-Mar-34
G70/250 General purpose lease 08-May-13 7-May-34
E70/3041 Exploration Licence 10-Jun-08 09-Jun-18
Two exploration licences held by Image (E70/2636 and E70/2898) cover the extent of the MineralResources and Ore Reserves defined to-date at Atlas. A third exploration licence (E70/3997) coverspotential southern extensions of the deposit. An application for Mining Lease (MLA70/1305) overthe proposed Atlas mine area north of Wongonderrah Road and adjacent areas was lodged inJanuary 2012. Grant of the Mining Lease is expected to follow finalisation of a Native TitleAgreement (NTA) with the Yued Native Title Claimants Group. All key terms and conditions of theNTA including compensation have been preliminarily agreed and only final negotiations regardingthe potential effect of registration of a government Indigenous Land Use Agreement, which couldextinguish Native Title over the Atlas project area, remaining to be completed.
1.1.3 Production
The Boonanarring mining schedule has been designed based on average mining rates of up to 3.7Mtpa ore to a single Slurry Mining Unit (SMU) and 3.0 Mtpa of Rougher Head Feed (RHF) at the
Boonanarring and Atlas Project BFS Page 8
WCP. Mining and related, ancillary activities will be conducted by a mining contractor with relevantexperience in mineral sands mining. The mining schedule has been developed to extract thehigher-grade sections of the deposits first, providing optimum early cashflow and rapid paybackof capital investment.
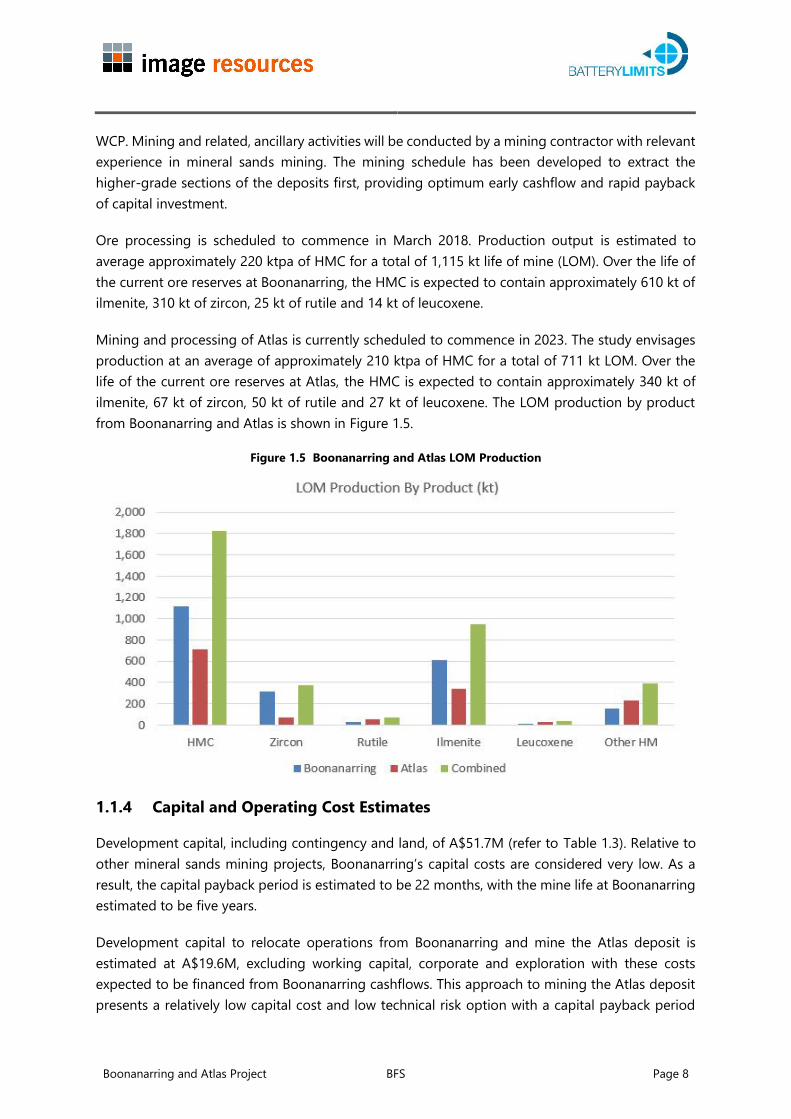
Ore processing is scheduled to commence in March 2018. Production output is estimated toaverage approximately 220 ktpa of HMC for a total of 1,115 kt life of mine (LOM). Over the life ofthe current ore reserves at Boonanarring, the HMC is expected to contain approximately 610 kt ofilmenite, 310 kt of zircon, 25 kt of rutile and 14 kt of leucoxene.
Mining and processing of Atlas is currently scheduled to commence in 2023. The study envisagesproduction at an average of approximately 210 ktpa of HMC for a total of 711 kt LOM. Over thelife of the current ore reserves at Atlas, the HMC is expected to contain approximately 340 kt ofilmenite, 67 kt of zircon, 50 kt of rutile and 27 kt of leucoxene. The LOM production by productfrom Boonanarring and Atlas is shown in Figure 1.5.
Figure 1.5 Boonanarring and Atlas LOM Production
1.1.4 Capital and Operating Cost Estimates
Development capital, including contingency and land, of A$51.7M (refer to Table 1.3). Relative toother mineral sands mining projects, Boonanarring’s capital costs are considered very low. As aresult, the capital payback period is estimated to be 22 months, with the mine life at Boonanarringestimated to be five years.
Development capital to relocate operations from Boonanarring and mine the Atlas deposit isestimated at A$19.6M, excluding working capital, corporate and exploration with these costsexpected to be financed from Boonanarring cashflows. This approach to mining the Atlas depositpresents a relatively low capital cost and low technical risk option with a capital payback period

Boonanarring and Atlas Project BFS Page 9
estimated to be 16 months. The capital costs associated with Boonanarring and Atlas is shown inTable 1.3.
Table 1.3 Capital Estimate for the Project
Capital CostsBoonanarring
A$M
Atlas
A$M
Project
A$M
Total Plant 31.1 19.6 50.7
Capitalised Operating Costs &Other Development Capital
20.6 - 20.6
Total Development Capital 51.7 19.6 71.3
Sustaining & other Capital 5.0 1.5 6.5
Total Project Capital 56.7 21.1 77.8
The average annual operating cost expenditure for Boonanarring and Atlas is estimated at A$301/tHMC and A$217/t HMC respectively.
Figure 1.6 and Figure 1.7 shows the average operating cost breakdown for Boonanarring and Atlasrespectively.

Boonanarring and Atlas Project BFS Page 10
Figure 1.6 Total Operating Cost Breakdown for Boonanarring (A$/t HMC)
Figure 1.7 Total Operating Cost Breakdown for Atlas (A$/t HMC)

Boonanarring and Atlas Project BFS Page 11
1.1.5 Financial Analysis
Financial analysis, of the Boonanarring and Atlas deposits, shows an EBITDA of A$266M over life-of-project, a pre-tax Net Present Value @ an 8% discount rate of A$135M and an Internal Rate ofReturn of 64% with payback of 22 months.
The BFS has demonstrated a relatively low capital cost with an initial development capital includingcontingency and resalable land of A$51.7M. Including working capital increases the initial projectfunding requirement to $64M. This results in a significant return on investment and rapid paybackon capital based on independent third party pricing assumptions (Refer to Figure 1.8 and Figure1.9).
The revenue by valuable HM in the HMC for Boonanarring and Atlas is shown in Figure 1.10. Zirconis the key driver representing 68% and 40% of total revenue for Boonanarring and Atlasrespectively.
Project economics are based on an initial 5+ year mine life at Boonanarring, followed by a moveto Atlas adding an additional 3+ years to overall mine life in the detailed financial model. It is notedthat potential exists to expand mine life or increase production through one or more of thefollowing:
Extension to the Boonanarring resources and reserves to the north and south of theplanned mine
Processing of lower grade overlying layer material not included in the current mineplan
Extensions to the Atlas resources and reserves
Potential to mine other high grade Image deposits with current Mineral Resources.
Given the current relatively short project life, extensions at Boonanarring or Atlas, or thedevelopment of other resources is likely to have a significant positive impact on overall projecteconomics.
Boonanarring and Atlas Project BFS Page 12
Figure 1.8 Mineral Sands Price Forecast
Figure 1.9 Benchmark of Boonanarring Start-up Capital/Revenue Ratio
-
0.50
1.00
1.50
2.00
2.50
3.00
3.50
4.00
Start-up capital / Revenue ratio
Note:• Capital intensity is measured as start-up capital divided by the maximum annual revenue.• Based on TZMI analysis using TZMI price forecasts and modelling except for Boonanarring which is based on Image physicals, operating and capital costs.• 31 advanced projects are included varying from brownfield to greenfield projects.
©TZMI project 1681
Boonanarring

Boonanarring and Atlas Project BFS Page 13
Figure 1.10 Boonanarring and Atlas Revenue by VHM components in HMC
The potential cashflows, and hence financing for the Project, is underpinned by a life-of-projectofftake agreement for all HMC produced.
1.1.6 Project Sensitivities
The Project is highly sensitive to changes in prices of the mineral sands products (in total) containedwithin the HMC and to variations in the A$:US$ exchange rate. A 10% increase from TZMI projectedmineral sands commodity prices increases the NPV from A$135M to over A$190M, and a 20%increase in commodity prices increases the NPV to over A$250M.
The Project NPV is sensitive to changes in zircon price as well as overall HM grade of the ore. TheProject NPV is also relatively sensitive to mining costs, as they are a significant portion of overalloperating costs.
The Project is relatively insensitive to the other individual mineral sands commodity prices (otherthan zircon), as well as to capital costs and operating costs (other than mining costs).
At current spot prices with no price escalations, the Project generates significant cash flows andhas a pre-tax NPV of A$58M at an 8% discount rate and an IRR of 44%.
Sensitivities of the Project to various factors are illustrated in Figure 1.11.

Boonanarring and Atlas Project BFS Page 14
Figure 1.11 Project Sensitivity Analysis
1.1.7 Implementation Plan
The Boonanarring mine and site construction is scheduled to commence Q3 2017, followed bycommissioning and first production by Q1 2018 (refer to Figure 1.12). A three month period forramp up to full production has been reflected in the implementation plan.
Figure 1.12 Boonanarring Indicative Project Timeline
Boonanarring and Atlas Project BFS Page 15
1.1.8 Key Risks
A total of five key risks were identified and classified as priority action risks. Each risk has beenassigned within the owner’s team and a treatment action plans have been developed to mitigatethe risk.
The Key risks are listed below:
Securing full Project funding
An increase in working capital or preproduction expenditure resulting in top-upfunding being required
Delays in implementation resulting in additional capital, working capital orpreproduction costs
Negative movements in commodity prices and/or foreign exchange
○ Pre-financing: resulting in delays or difficulties in raising the required funds fordevelopment of the Project
○ Post-production: resulting in weaker than expected cash flows/returns from theProject
Failure of the HMC offtaker to meet its obligations under the HMC OfftakeAgreement, and in particular, to provide letters of credit on a timeous basis asrequired.
1.1.9 Conclusions and Recommendations
The BFS for the Boonanarring deposit provides a technically sound mining and processingapproach based on conventional technology and mining methods to produce a saleable HMCproduct. The key risk for the Project is the approval of funds to continue the early works programand early commitment for long lead items, as well as cash flow during pre and post financing toproduction. Other risks identified during the BFS review were assessed as a relatively low risk levelor were identified as manageable as part of normal operations.
This Project adopts a low capital approach compared to similar mineral sands projects by relocatingan existing WCP in conjunction with utilising locally available logistics, power and communityinfrastructure.
Based on the financial outcomes of this study it is recommended that Image proceeds withfinancing and development, including obtaining initial funding to meet long lead item
Boonanarring and Atlas Project BFS Page 16
commitments. Long lead items include the thickener, attritioner and high voltage both design andprocurement. Early commitment will minimise delays to implementation of the schedule.
The addition of Atlas at the PFS level demonstrates the potential to extend the Project life by atleast 3 years increasing the financial returns from the investment in the project.
1.2 Reliance on Experts
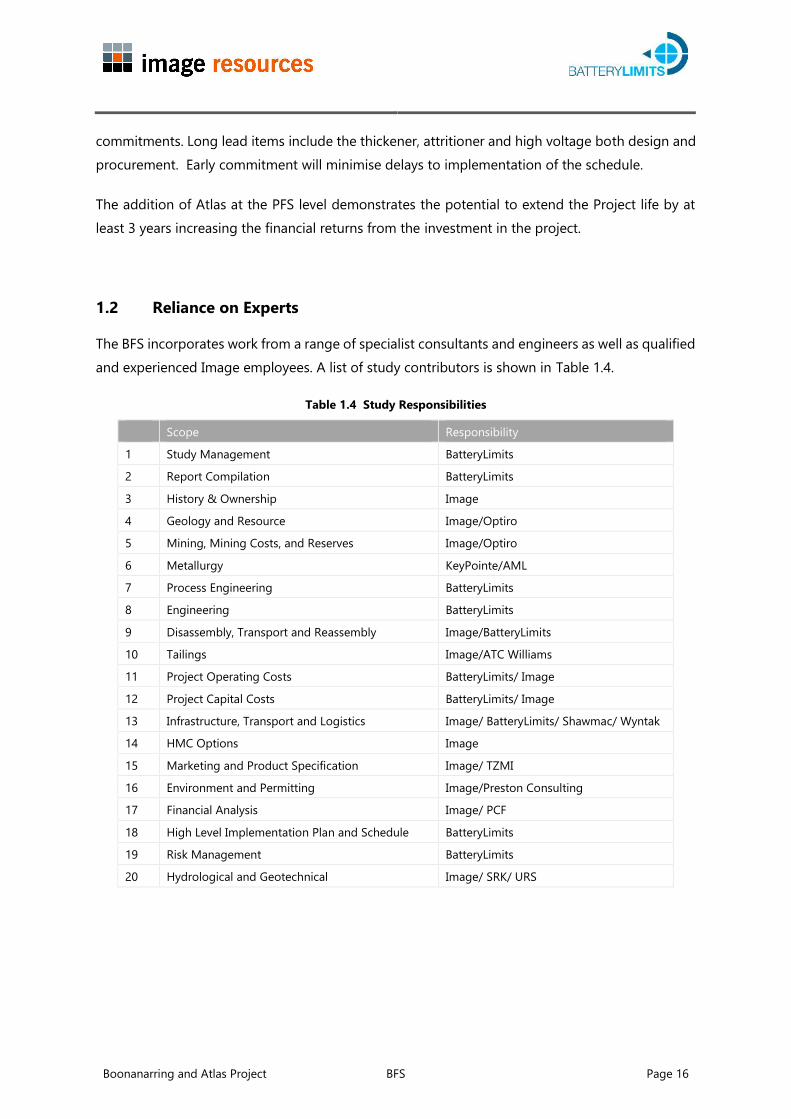
The BFS incorporates work from a range of specialist consultants and engineers as well as qualifiedand experienced Image employees. A list of study contributors is shown in Table 1.4.
Table 1.4 Study Responsibilities
Scope Responsibility
1 Study Management BatteryLimits
2 Report Compilation BatteryLimits
3 History & Ownership Image
4 Geology and Resource Image/Optiro
5 Mining, Mining Costs, and Reserves Image/Optiro
6 Metallurgy KeyPointe/AML
7 Process Engineering BatteryLimits
8 Engineering BatteryLimits
9 Disassembly, Transport and Reassembly Image/BatteryLimits
10 Tailings Image/ATC Williams
11 Project Operating Costs BatteryLimits/ Image
12 Project Capital Costs BatteryLimits/ Image
13 Infrastructure, Transport and Logistics Image/ BatteryLimits/ Shawmac/ Wyntak
14 HMC Options Image
15 Marketing and Product Specification Image/ TZMI
16 Environment and Permitting Image/Preston Consulting
17 Financial Analysis Image/ PCF
18 High Level Implementation Plan and Schedule BatteryLimits
19 Risk Management BatteryLimits
20 Hydrological and Geotechnical Image/ SRK/ URS

Boonanarring and Atlas Project BFS Page 17
1.3 Mineral Resources
1.3.1 Boonanarring
The Boonanarring deposit is located in the NPB, Western Australia, approximately 120 km north ofPerth. In 2013 Image prepared a Base Case Feasibility Study to assess the viability of mining andprocessing of ore from Boonanarring based on a Mineral Resource estimate prepared in 2013. ThisMineral Resource estimate was updated in 2017 by Optiro Pty Ltd (Optiro) in accordance with theJORC Code (2012).
Optiro’s January 2017 Mineral Resource estimate incorporates results from an additional 211 drillholes (for a total 8,300 m) drilled by Image between 2014 and 2016 and an additional 48 compositesamples that were analysed to determine the heavy mineral (HM) assemblage components.
The Mineral Resource estimate for the Boonanarring deposit is reported in Table 1.5 at a 2.0% totalHM cut-off grade. This cut-off grade was selected by Image based on technical and economicassessment carried out during feasibility study.
Table 1.5 Boonanarring Mineral Resource Estimate at a Cut-off Grade of 2.0% Total HM
Classification
OreTonnes
(Millions)
THM
%
Slimes
%
Oversize
%
% of total heavy mineral
Zircon Rutile Leucoxene Ilmenite
Strandline mineralisation
Measured 7.8 8.2 14 6.6 20.1 2.2 1.9 47.3
Indicated 19.5 6.0 17 8.0 21.6 2.4 1.8 50.2
Inferred 6.3 5.2 18 6.8 15.3 3.9 3.2 59.5
Sub-total 33.5 6.3 17 7.5 20.2 2.6 2.0 50.8
Overlying mineralisation
Indicated 6.6 3.2 21 10.7 5.7 2.8 3.2 46.1
Inferred 3.6 3.3 25 12.5 2.7 2.3 4.0 25.5
Sub-total 10.2 3.2 23 11.4 4.6 2.6 3.5 38.5
Combined Strandline and Overlying
Measured 7.8 8.2 14 6.6 20.1 2.2 1.9 47.3
Indicated 26.1 5.3 18 8.7 19.2 2.5 2.0 49.6
Inferred 9.9 4.5 21 8.9 11.9 3.5 3.5 50.3
Total 43.7 5.6 18 8.4 18.1 2.6 2.2 49.1
Table Note: Reported in ASX announcement ‘Tonnage Doubles in Mineral Resources Update for Boonanarring Project’ on 13January 2017.

Boonanarring and Atlas Project BFS Page 18
Ore definition drilling completed March 2017 (assay results pending), will increase MeasuredResources for first 2-3 years of production
1.3.2 Atlas
In 2013, Image prepared a Base Case Feasibility Study to assess the viability of mining andprocessing of ore from its Atlas deposit, using a Mineral Resource estimate prepared in 2011 thatwas classified in accordance with the guidelines of the JORC Code (2004). This Mineral Resourceestimate was updated in 2017 by Optiro in accordance with the JORC Code (2012).
Optiro’s May 2017 Mineral Resource estimate incorporates results from an additional 241 drill holes(for a total 4,682 m) drilled by Image during 2012 and an additional 15 composite samples thatwere analysed to determine the HM assemblage components.
The Mineral Resource Estimate for the Atlas deposit has been reported in Table 1.6 at a 2.0% totalHM cut-off grade.
Table 1.6 Atlas Mineral Resource Estimate at a Cut-off Grade of 2.0% total HM
Classification
OreTonnes
(Millions)
THM
%
Slimes
%
Oversize
%
% of total heavy mineral
Zircon Rutile Leucoxene Ilmenite
Measured 9.9 7.9 16.1 5.8 10.5 7.2 4.2 49.1
Indicated 6.4 3.7 17.3 5.2 6.8 4.7 3.4 41.6
Inferred 1.8 4.0 19.9 7.2 4.8 4.4 3.3 29.0
Total 18.1 6.0 16.9 5.7 9.3 6.4 4.0 46.1
Table Note: Reported in ASX announcement ‘68% Increase in Mineral Resource Resources for Atlas Project’ on 8 May 2017.
1.4 Mining
The mining and support earthmoving activities will be delivered under a Contract MiningAgreement, where the mining contractor will be responsible for all mining and associatedearthworks using a standard Schedule of Rates contract incorporating normal dayworks provisions.Image will be responsible for statutory duties, technical services, potable water, power anddewatering operations.
The mining method will generally follow a typical sequence for mineral sand mining operations(refer to Figure 1.13).

Boonanarring and Atlas Project BFS Page 19
Figure 1.13 Proposed Mining Method
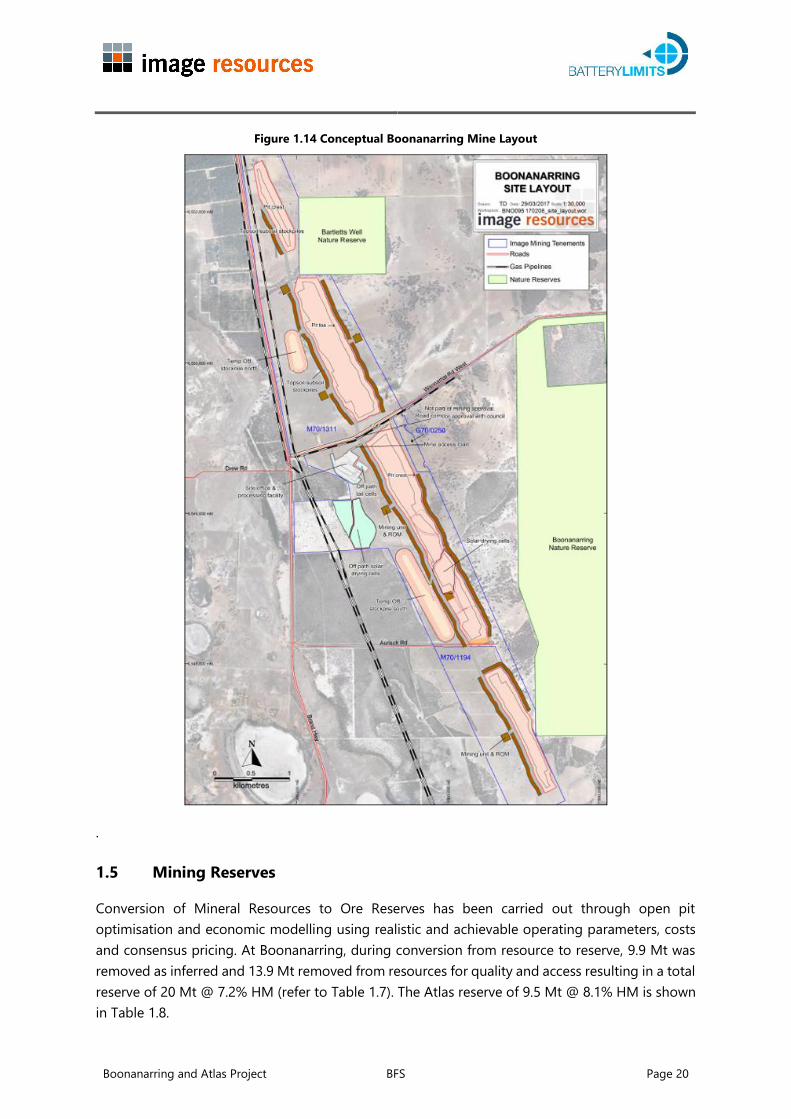
Scrapers and/or excavators and trucks will be employed to mine the ore to a stockpile located atthe SMU. A Cat 988 loader or similar will then feed the SMU from the stockpile at a rate of 500 t/h.Using this type of fleet will give flexibility for ore blending, not only when mined but also off thestockpile at the SMU. In addition, use of this method will mean the SMU can stay in one place forup to 12 months, which will minimise downtime due to SMU relocations. The conceptualBoonanarring mine layout is shown in Figure 1.14.
The Boonanarring deposit is split into two strands; East and West. The eastern strand is generallyhigher in heavy mineral content than the lower grade western strand. To get consistency of thegrade of the ore being fed to the WCP, the eastern and western strands will be blended. Ore feedhas been constrained to a maximum of 500 t/h at 85% utilisation of SMU feed. This will be theprimary production constraint.
Following initial pit establishment, the mine void will be progressively backfilled with overburden,sand tailings and clay fines. Dry clay from solar drying ponds will be mixed into the upper horizonsof the sand tailings to improve soil quality prior to tailings profiling. The surface will then be re-contoured where necessary, in line with pre-mining surface contours or other agreed topography,before replacement of topsoil and subsoil.
Mine closure will involve the removal of all site infrastructure (certain infrastructure, such as bores,may be retained by prior agreement with landholders and the DMP), remediation of anycontaminated soils and ground preparation (topsoil replacement, drainage works and ripping) forrevegetation. Post-closure activities will include monitoring groundwater and the progress ofrehabilitated areas towards agreed completion criteria will be measured.
Boonanarring and Atlas Project BFS Page 20
Figure 1.14 Conceptual Boonanarring Mine Layout
.
1.5 Mining Reserves
Conversion of Mineral Resources to Ore Reserves has been carried out through open pitoptimisation and economic modelling using realistic and achievable operating parameters, costsand consensus pricing. At Boonanarring, during conversion from resource to reserve, 9.9 Mt wasremoved as inferred and 13.9 Mt removed from resources for quality and access resulting in a totalreserve of 20 Mt @ 7.2% HM (refer to Table 1.7). The Atlas reserve of 9.5 Mt @ 8.1% HM is shownin Table 1.8.

Boonanarring and Atlas Project BFS Page 21
Table 1.7 2017 Boonanarring Ore Reserves Summary
Classification
OreTonnes
(Millions)
THM%
Slimes%
Oversize%
% of total heavy mineral
Zircon Rutile Leucoxene Ilmenite
Strandline mineralisation
Proved 5.8 9.1 14.2 6.6 21.6 2.2 1.9 48.5
Probable 11.9 7.0 16.8 7.8 24.0 2.5 1.6 51.4
Sub-total 17.8 7.7 16.0 7.4 23.0 2.4 1.7 50.3
Overlying mineralisation
Probable 2.2 3.0 20.3 7.3 8.6 4.1 2.7 61.8
Sub-total 2.2 3.0 20.3 7.3 8.6 4.1 2.7 61.8
Combined Strandline and Overlaying mineralisation
Proved 5.8 9.1 14.2 6.6 21.6 2.2 1.9 48.5
Probable 14.2 6.4 17.7 7.7 22.8 2.6 1.7 52.2
Total 20.0 7.2 16.7 7.4 22.4 2.4 1.8 50.8
Table Notes:
(1) Reported in ASX announcement ‘Updated Ore Reserves for Boonanarring Project increases ore tonnes by 39%’on 10 April 2017.
(2) Ore Reserves are based upon a cut-off grade of 2% total heavy minerals (THM).
(3) The Ore Reserves are based upon an FX rate US$0.73:A$1.00; and the following commodity prices: ilmenite -$US144, leucoxene - $US522, rutile - $US936 and zircon - $US1,126.
Ore definition drilling completed for Boonanarring in March 2017 (assay results pending) willincrease Proven Reserves tonnes for first 2-3 years of production
Table 1.8 2017 Atlas Ore Reserve Summary
Classification
OreTonnes
(Millions)
THM
%
Slimes
%
Oversize
%
% of total heavy mineral
Zircon Rutile Leucoxene Ilmenite
Probable 9.5 8.1 15.5 5.2 10.6 7.5 4.5 50.7
Total 9.5 8.1 15.5 5.2 10.6 7.5 4.5 50.7
Table Notes:
(1) Reported in ASX announcement ‘Ore Reserves update for 100% owned Atlas Project’ on 30 May 2017.
(2) Ore Reserves are based upon a cut-off grade of 2% total heavy minerals (THM).
(3) The Ore Reserves are based upon an FX rate US$0.73:A$1.00; and the following commodity prices: ilmenite -$US171, leucoxene - $US522, rutile - $US936 and zircon - $US1,126.
Boonanarring and Atlas Project BFS Page 22
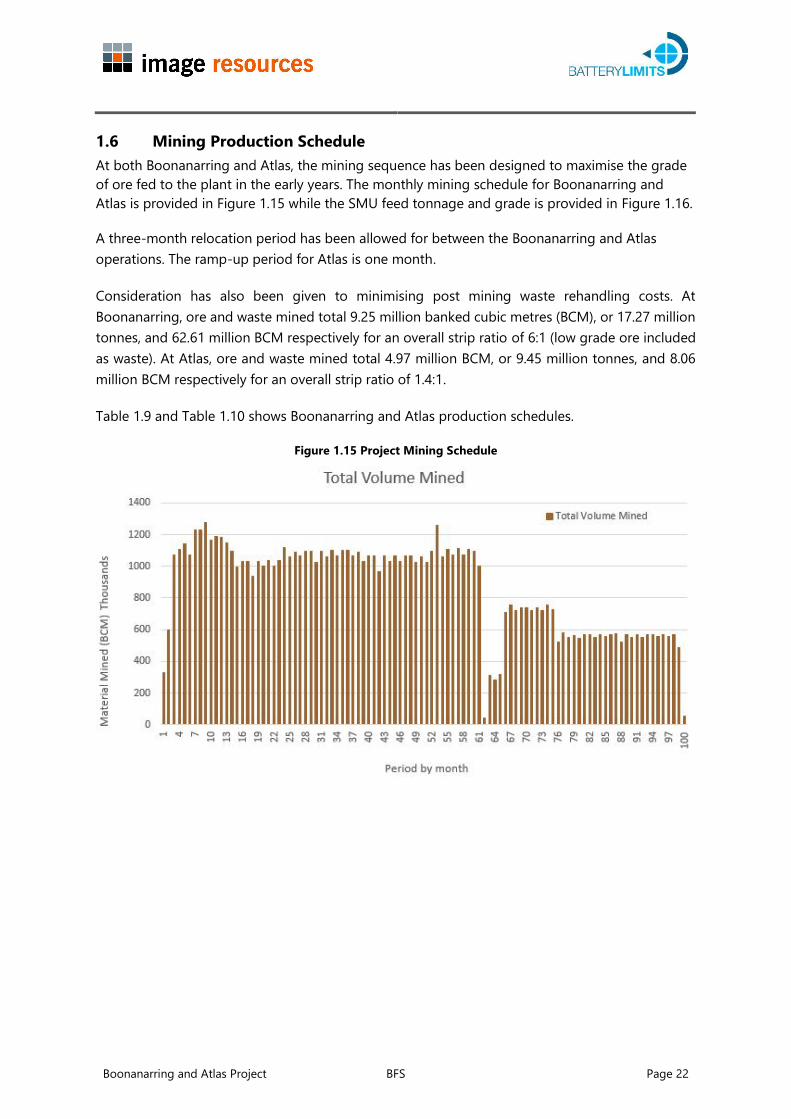
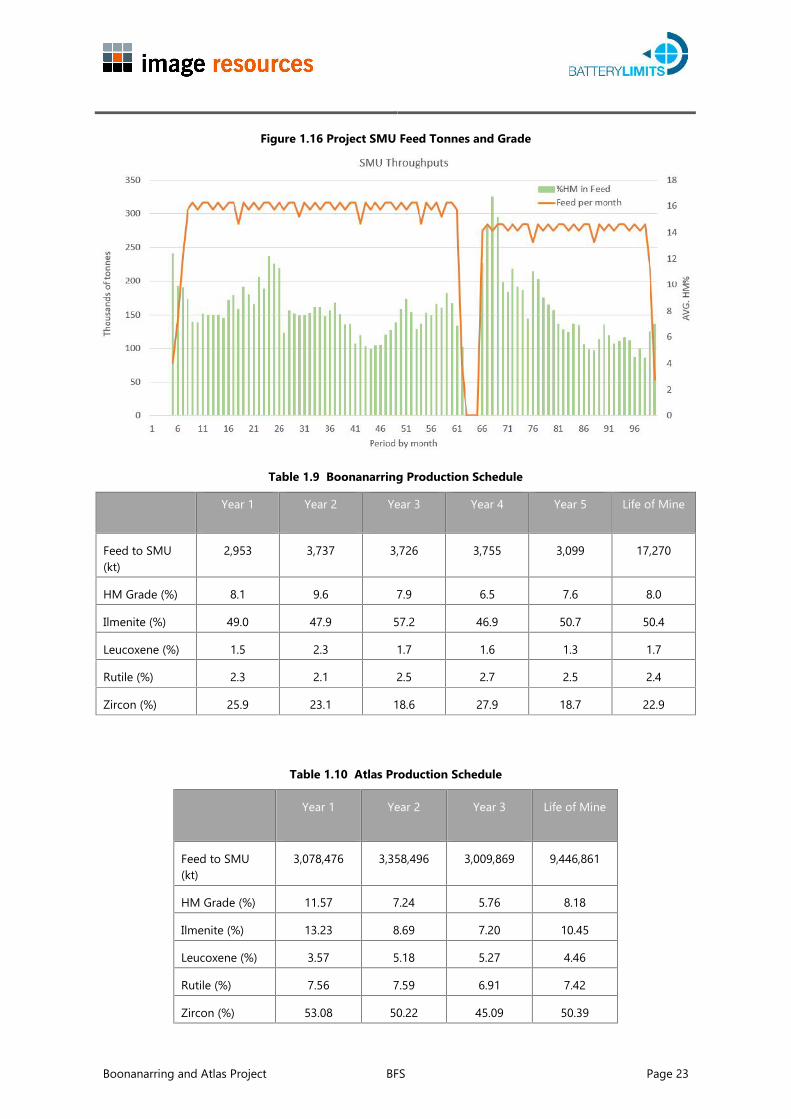
1.6 Mining Production ScheduleAt both Boonanarring and Atlas, the mining sequence has been designed to maximise the gradeof ore fed to the plant in the early years. The monthly mining schedule for Boonanarring andAtlas is provided in Figure 1.15 while the SMU feed tonnage and grade is provided in Figure 1.16.
A three-month relocation period has been allowed for between the Boonanarring and Atlasoperations. The ramp-up period for Atlas is one month.
Consideration has also been given to minimising post mining waste rehandling costs. AtBoonanarring, ore and waste mined total 9.25 million banked cubic metres (BCM), or 17.27 milliontonnes, and 62.61 million BCM respectively for an overall strip ratio of 6:1 (low grade ore includedas waste). At Atlas, ore and waste mined total 4.97 million BCM, or 9.45 million tonnes, and 8.06million BCM respectively for an overall strip ratio of 1.4:1.
Table 1.9 and Table 1.10 shows Boonanarring and Atlas production schedules.
Figure 1.15 Project Mining Schedule
Boonanarring and Atlas Project BFS Page 23
Figure 1.16 Project SMU Feed Tonnes and Grade
Table 1.9 Boonanarring Production Schedule
Year 1 Year 2 Year 3 Year 4 Year 5 Life of Mine
Feed to SMU(kt)
2,953 3,737 3,726 3,755 3,099 17,270
HM Grade (%) 8.1 9.6 7.9 6.5 7.6 8.0
Ilmenite (%) 49.0 47.9 57.2 46.9 50.7 50.4
Leucoxene (%) 1.5 2.3 1.7 1.6 1.3 1.7
Rutile (%) 2.3 2.1 2.5 2.7 2.5 2.4
Zircon (%) 25.9 23.1 18.6 27.9 18.7 22.9
Table 1.10 Atlas Production Schedule
Year 1 Year 2 Year 3 Life of Mine
Feed to SMU(kt)
3,078,476 3,358,496 3,009,869 9,446,861
HM Grade (%) 11.57 7.24 5.76 8.18
Ilmenite (%) 13.23 8.69 7.20 10.45
Leucoxene (%) 3.57 5.18 5.27 4.46
Rutile (%) 7.56 7.59 6.91 7.42
Zircon (%) 53.08 50.22 45.09 50.39
Boonanarring and Atlas Project BFS Page 24
The combined Life of Mine (LoM) production from Boonanarring and Atlas is estimated at 1.83 Mtof HMC over 8 years.
1.7 Metallurgy
This section describes the results of the metallurgical testwork completed on the Boonanarringdeposit. In addition, preliminary results from metallurgical testwork on Atlas have been includedin the following Tables. A more detailed testwork program will be conducted on Atlas during afuture BFS phase. The metallurgical study comprised two sections:
testwork for the confirmation of a wet gravity circuit metallurgical flowsheet toproduce a HMC, and
testwork for the confirmation of a Drymill circuit metallurgical flowsheet to producesaleable ilmenite, zircon, rutile and leucoxene products.
The objective of the wet gravity testwork was to develop the circuit for processing the Boonanarringore by utilising the existing equipment from the WCP acquired in 2016.
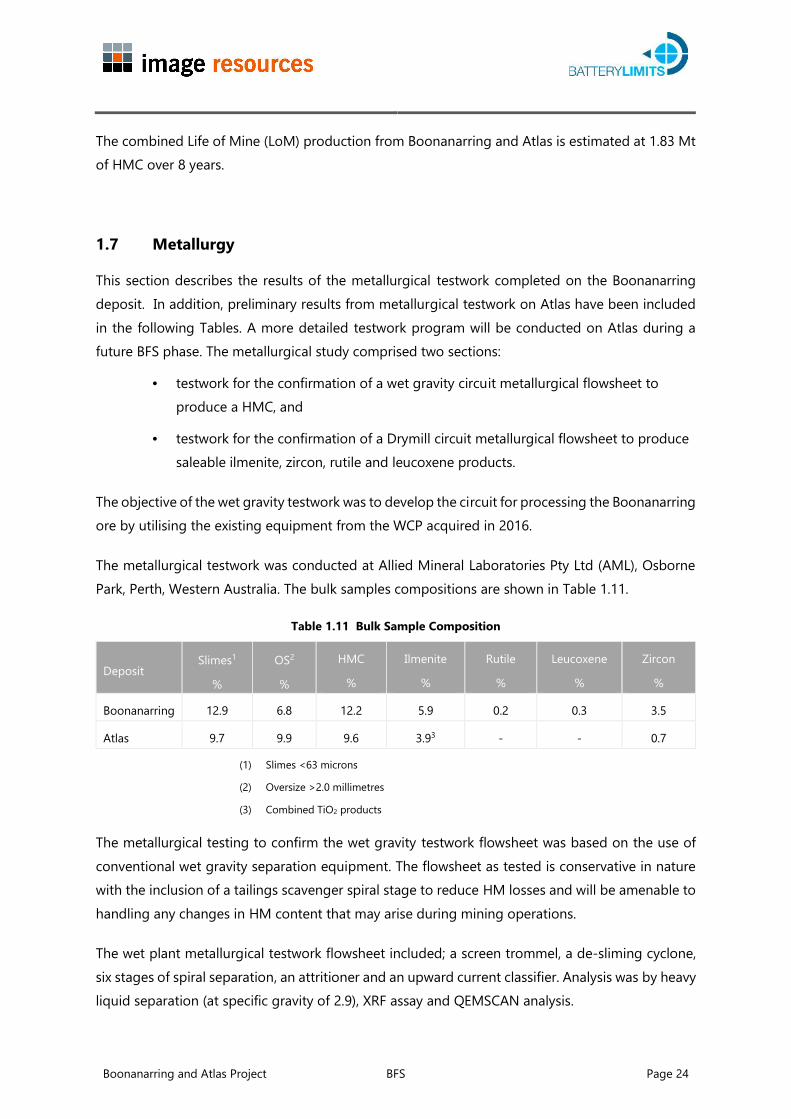
The metallurgical testwork was conducted at Allied Mineral Laboratories Pty Ltd (AML), OsbornePark, Perth, Western Australia. The bulk samples compositions are shown in Table 1.11.
Table 1.11 Bulk Sample Composition
DepositSlimes1
%
OS2
%
HMC
%
Ilmenite
%
Rutile
%
Leucoxene
%
Zircon
%
Boonanarring 12.9 6.8 12.2 5.9 0.2 0.3 3.5
Atlas 9.7 9.9 9.6 3.93 - - 0.7
(1) Slimes <63 microns
(2) Oversize >2.0 millimetres
(3) Combined TiO2 products
The metallurgical testing to confirm the wet gravity testwork flowsheet was based on the use ofconventional wet gravity separation equipment. The flowsheet as tested is conservative in naturewith the inclusion of a tailings scavenger spiral stage to reduce HM losses and will be amenable tohandling any changes in HM content that may arise during mining operations.
The wet plant metallurgical testwork flowsheet included; a screen trommel, a de-sliming cyclone,six stages of spiral separation, an attritioner and an upward current classifier. Analysis was by heavyliquid separation (at specific gravity of 2.9), XRF assay and QEMSCAN analysis.
Boonanarring and Atlas Project BFS Page 25
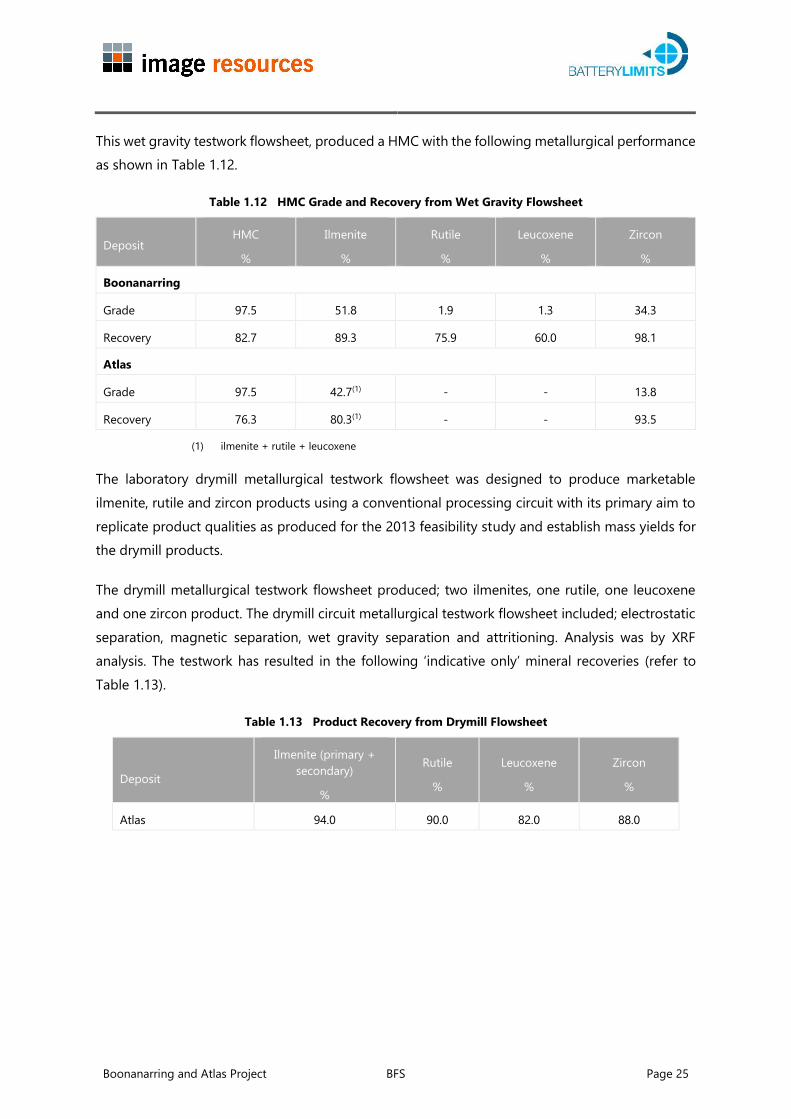
This wet gravity testwork flowsheet, produced a HMC with the following metallurgical performanceas shown in Table 1.12.
Table 1.12 HMC Grade and Recovery from Wet Gravity Flowsheet
DepositHMC
%
Ilmenite
%
Rutile
%
Leucoxene
%
Zircon
%
Boonanarring
Grade 97.5 51.8 1.9 1.3 34.3
Recovery 82.7 89.3 75.9 60.0 98.1
Atlas
Grade 97.5 42.7(1) - - 13.8
Recovery 76.3 80.3(1) - - 93.5
(1) ilmenite + rutile + leucoxene
The laboratory drymill metallurgical testwork flowsheet was designed to produce marketableilmenite, rutile and zircon products using a conventional processing circuit with its primary aim toreplicate product qualities as produced for the 2013 feasibility study and establish mass yields forthe drymill products.
The drymill metallurgical testwork flowsheet produced; two ilmenites, one rutile, one leucoxeneand one zircon product. The drymill circuit metallurgical testwork flowsheet included; electrostaticseparation, magnetic separation, wet gravity separation and attritioning. Analysis was by XRFanalysis. The testwork has resulted in the following ‘indicative only’ mineral recoveries (refer toTable 1.13).
Table 1.13 Product Recovery from Drymill Flowsheet
Deposit
Ilmenite (primary +secondary)
%
Rutile
%
Leucoxene
%
Zircon
%
Atlas 94.0 90.0 82.0 88.0

Boonanarring and Atlas Project BFS Page 26
1.8 Process Plant
The BFS is based on the acquisition of the Mindarie WCP and ancillary equipment shown in Figure1.17. The existing plant will be relocated to WA and it will undergo a fit-for-purpose modificationto treat the Boonanarring ore. The utilisation of existing equipment will be maximised and the plantwill be reconfigured by re-purposing and re-sequencing the order the equipment as required. Newequipment will include an attritioner and an upward current classifier.
Figure 1.17 Mindarie WCP
The mineral processing operation will consist of two main sections:
Slurry mining unit (SMU)
Wet concentrating plant (WCP).
Selection of the key process stages and parameters were based upon the metallurgical testworkconducted by AML. The SMU primarily consists of:
feed bin, vibrating grizzly feeder
scrubber feed conveyor
a rotating drum scrubber with trommel screen, and pumping system
supporting equipment on a transformer skid.
The function of the SMU is to screened for oversize material, de-agglomerate the ore and to pumpa slurry feed to the WCP. The SMU will be semi-mobile and will be relocated annually as miningprogresses, thus minimising the haul distance to and from the mining area.

Boonanarring and Atlas Project BFS Page 27
The WCP receives slurry which is further screened for oversize and de-agglomerated in the planttrommel scrubber and deslimed by cyclones. The slurry density is controlled in the Constant Densitytank before being pumped to the spiral circuit. The spiral circuit consists of rougher, cleaner andscavenger stacks producing sand tails and a concentrate stream. The concentrate stream isdewatered by cyclones and further cleaned in an attritioner. An upward current classifier in a closedcircuit with a dewatering cyclone and a stack of spirals provides the final stages of HMC cleaning.The HMC from the upward current classifier underflow is pumped to stacker cyclones anddeposited to stockpiles located on the dewatering HMC pad.
The processing facility will produce two types of tailings; a coarse sand tails and a fine slimes tails.The sand tails from the WCP is concentrated by a skid-mounted dewatering cyclone and theunderflow is used as backfill for the mining void. The slimes stream is thickened and thickenerunderflow is transferred to paste cells solar drying ponds. Dry slimes will be carted and/or spreadacross the top of the deposited sand tails and ploughed in to achieve the required composition ofslimes and sand prior to final top soil rehabilitation.
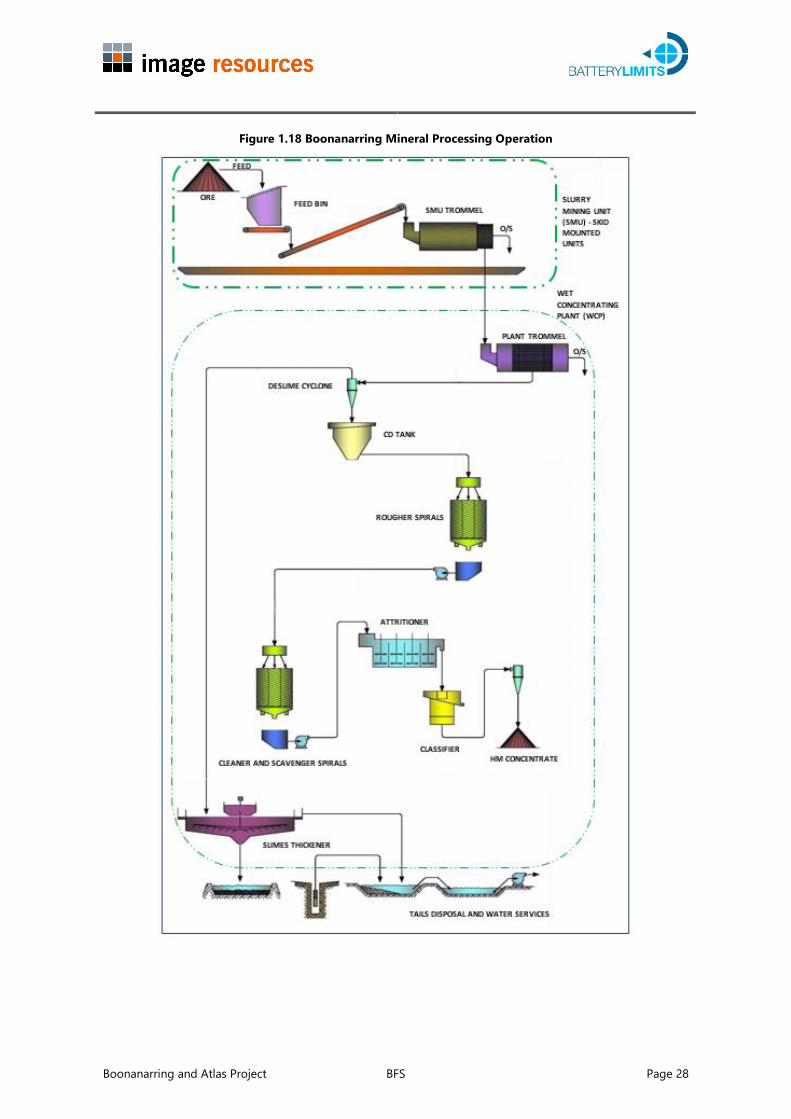
Process water is recovered from the sand tails stacker dewatering cyclone overflow, thickeneroverflow, paste cells decant and WCP dewatering cyclones overflow. Any surplus water decantedfrom the paste cells is pumped directly to the SMU water tank for recycling. Recycled process waterfrom other units is discharged to the settling pond and pumped back to the plant via the processwater pond. Make-up water is supplied from bore pumps. Figure 1.18 illustrates a simplified blockflow diagram of the Boonanarring plant with tails disposal and water facilities.
Boonanarring and Atlas Project BFS Page 28
Figure 1.18 Boonanarring Mineral Processing Operation
Boonanarring and Atlas Project BFS Page 29
1.9 Infrastructure, Power, Water and Logistics
The Plant and Infrastructure are shown in Figure 1.19 and consist of:
Process plant and associated equipment, offices and maintenance facilities
Power supply and reticulation system including a new HV substation
Process water dams
Mine area and waste dumps
Water bores and pipe routes
Modifications to access roads to the plant, mine and plant access roads and otherfacilities.

Boonanarring and Atlas Project BFS Page 30
Figure 1.19 Proposed Boonanarring Site Infrastructure Layout

Boonanarring and Atlas Project BFS Page 31
1.10 Power
The power requirements for the main process plant and mining have been calculated at a totalconnected load of 7.4 MW including all duty and standby equipment with an estimated maximumrunning load in the final years of Boonanarring of 4.5 MW. A 22kV HV connection from the localWestern Power grid will be used to supply the Boonanarring site power.
The main incoming 22kV HV Western Power supply will be converted and feed a 22/11KV 8.5 MVAtransformer to provide the site power requirements suitable for connection to match the existingequipment acquired in 2016.
1.11 Water
A simplified process water balance was developed for Boonanarring using a steady-state massbalance to determine the water consumption requirements. No allowance was made for potableand wash water in the water balance.
The following water conservation factors are included in the water balance:
The use of a thickener in the process plant to limit water contents in the clay finesdisposed to solar drying cells;
Decantation of excess water from the surface of the solar drying cells;
Sand tailing water recycle through a cyclone and return of excess sand cell water tothe process;
Passive in-pit dewatering via temporary drains and sumps; and
Interception of water shed from HMC stockpiles.
The base case scenario resulted in demand of 1.86 giga-litres per year (GL/y). The Project hassecured a water abstraction licence of 2 GL/y from the Perth - Yarragadee North aquifer for mineralsands ore processing and mining operations.
1.12 Logistics and Site Access
The Boonanarring area is adjacent to the Brand Highway, one of the major transport routes to thenorth of Western Australia. The proposed site for the processing plant adjacent to the orebodywill be accessed from Wannamal Road West and Brand Highway within approximately 500 metresfrom the intersection of these roads.
Boonanarring and Atlas Project BFS Page 32
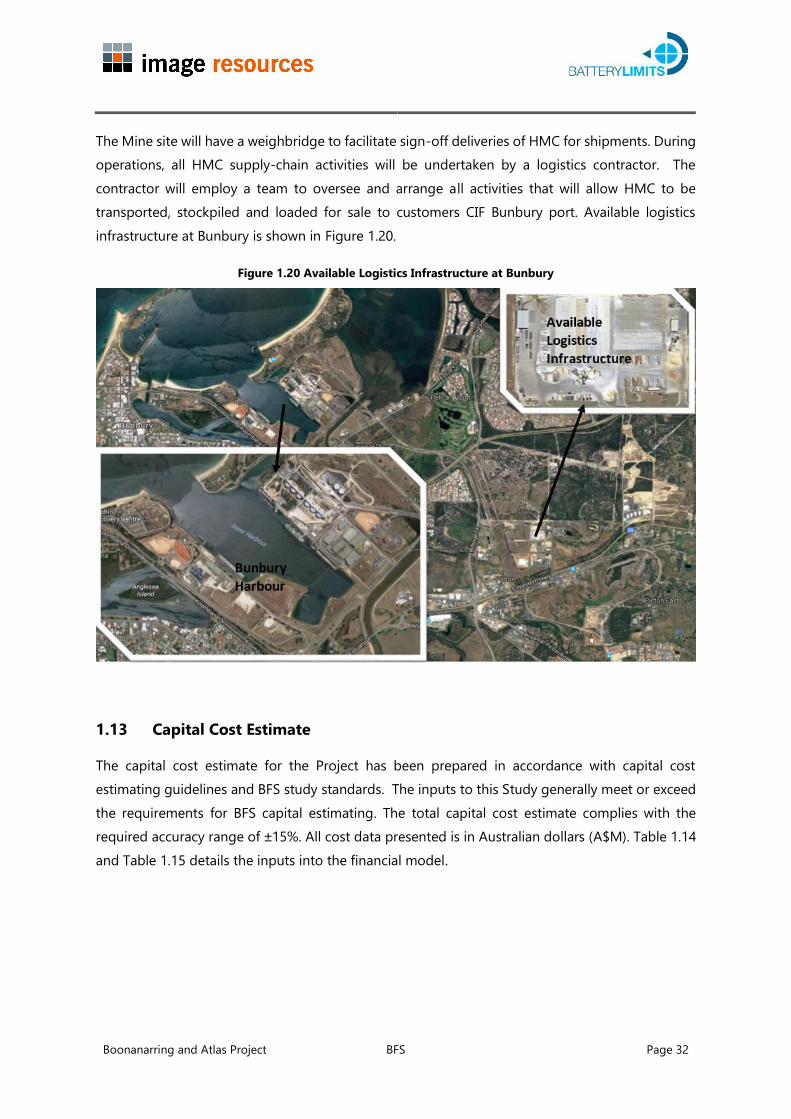
The Mine site will have a weighbridge to facilitate sign-off deliveries of HMC for shipments. Duringoperations, all HMC supply-chain activities will be undertaken by a logistics contractor. Thecontractor will employ a team to oversee and arrange all activities that will allow HMC to betransported, stockpiled and loaded for sale to customers CIF Bunbury port. Available logisticsinfrastructure at Bunbury is shown in Figure 1.20.
Figure 1.20 Available Logistics Infrastructure at Bunbury
1.13 Capital Cost Estimate
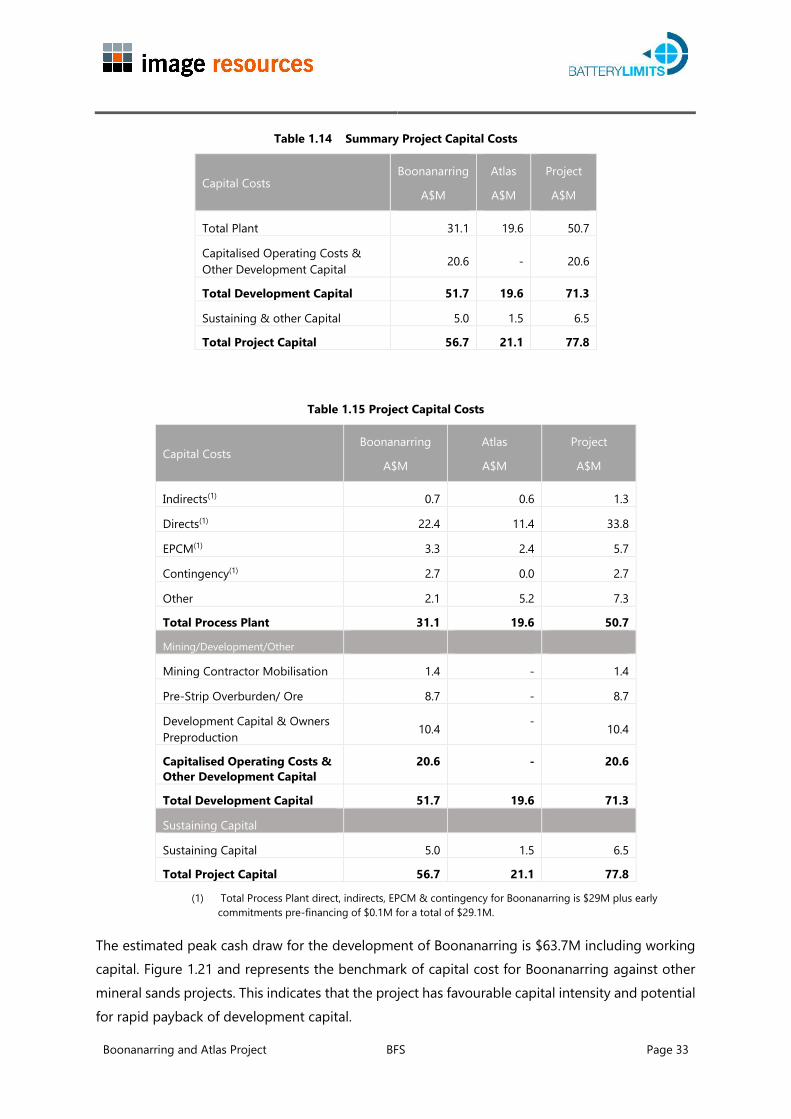
The capital cost estimate for the Project has been prepared in accordance with capital costestimating guidelines and BFS study standards. The inputs to this Study generally meet or exceedthe requirements for BFS capital estimating. The total capital cost estimate complies with therequired accuracy range of 15%. All cost data presented is in Australian dollars (A$M). Table 1.14and Table 1.15 details the inputs into the financial model.
Boonanarring and Atlas Project BFS Page 33
Table 1.14 Summary Project Capital Costs
Capital CostsBoonanarring
A$M
Atlas
A$M
Project
A$M
Total Plant 31.1 19.6 50.7
Capitalised Operating Costs &Other Development Capital 20.6 - 20.6
Total Development Capital 51.7 19.6 71.3
Sustaining & other Capital 5.0 1.5 6.5
Total Project Capital 56.7 21.1 77.8
Table 1.15 Project Capital Costs
Capital CostsBoonanarring
A$M
Atlas
A$M
Project
A$M
Indirects(1) 0.7 0.6 1.3
Directs(1) 22.4 11.4 33.8
EPCM(1) 3.3 2.4 5.7
Contingency(1) 2.7 0.0 2.7
Other 2.1 5.2 7.3
Total Process Plant 31.1 19.6 50.7
Mining/Development/Other
Mining Contractor Mobilisation 1.4 - 1.4
Pre-Strip Overburden/ Ore 8.7 - 8.7
Development Capital & OwnersPreproduction 10.4 - 10.4
Capitalised Operating Costs &Other Development Capital
20.6 - 20.6
Total Development Capital 51.7 19.6 71.3
Sustaining Capital
Sustaining Capital 5.0 1.5 6.5
Total Project Capital 56.7 21.1 77.8
(1) Total Process Plant direct, indirects, EPCM & contingency for Boonanarring is $29M plus earlycommitments pre-financing of $0.1M for a total of $29.1M.
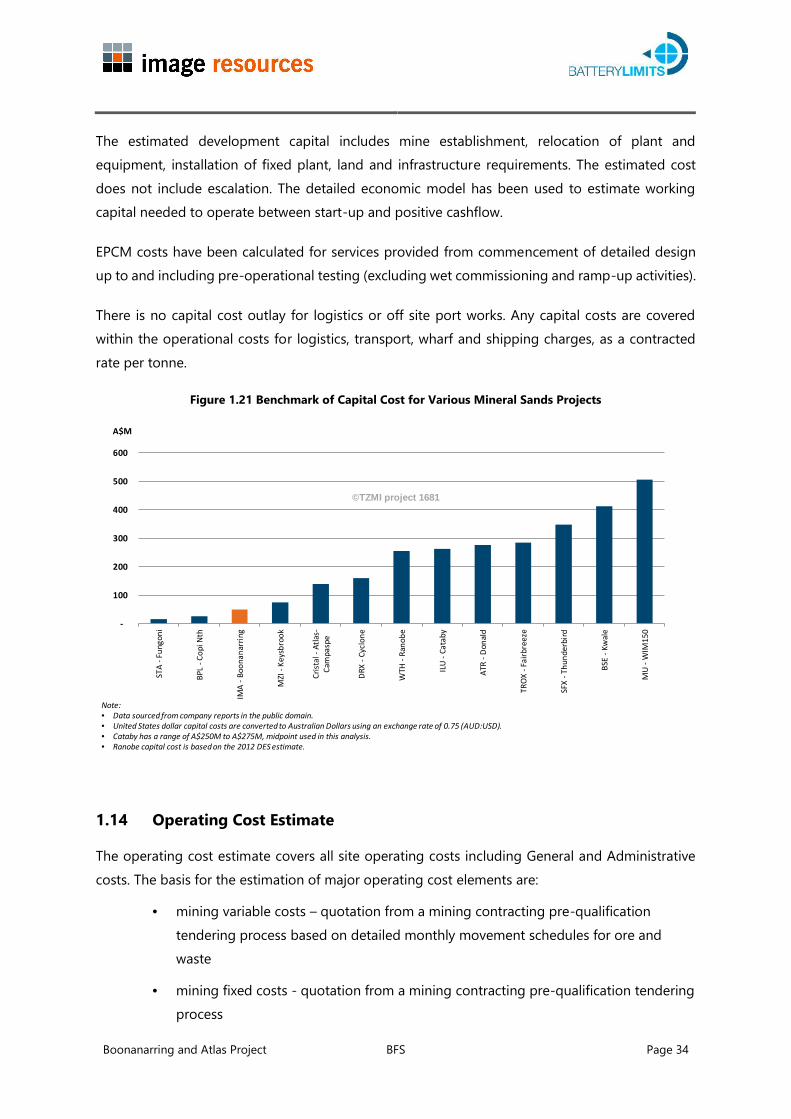
The estimated peak cash draw for the development of Boonanarring is $63.7M including workingcapital. Figure 1.21 and represents the benchmark of capital cost for Boonanarring against othermineral sands projects. This indicates that the project has favourable capital intensity and potentialfor rapid payback of development capital.
Boonanarring and Atlas Project BFS Page 34
The estimated development capital includes mine establishment, relocation of plant andequipment, installation of fixed plant, land and infrastructure requirements. The estimated costdoes not include escalation. The detailed economic model has been used to estimate workingcapital needed to operate between start-up and positive cashflow.
EPCM costs have been calculated for services provided from commencement of detailed designup to and including pre-operational testing (excluding wet commissioning and ramp-up activities).
There is no capital cost outlay for logistics or off site port works. Any capital costs are coveredwithin the operational costs for logistics, transport, wharf and shipping charges, as a contractedrate per tonne.
Figure 1.21 Benchmark of Capital Cost for Various Mineral Sands Projects
1.14 Operating Cost Estimate
The operating cost estimate covers all site operating costs including General and Administrativecosts. The basis for the estimation of major operating cost elements are:
mining variable costs – quotation from a mining contracting pre-qualificationtendering process based on detailed monthly movement schedules for ore andwaste
mining fixed costs - quotation from a mining contracting pre-qualification tenderingprocess
-
100
200
300
400
500
600
STA
- Fun
goni
BPL
- Cop
i Nth
IMA
- Boo
nana
rrin
g
MZI
- Ke
ysbr
ook
Crist
al -
Atla
s-Ca
mpa
spe
DRX
- Cyc
lone
WTH
- Ra
nobe
ILU
- Cat
aby
ATR
- Don
ald
TROX
- Fa
irbre
eze
SFX
- Thu
nder
bird
BSE
- Kw
ale
MU
- WIM
150
A$M
Note:• Data sourced from company reports in the public domain.• United States dollar capital costs are converted to Australian Dollars using an exchange rate of 0.75 (AUD:USD).• Cataby has a range of A$250M to A$275M, midpoint used in this analysis.• Ranobe capital cost is based on the 2012 DES estimate.
©TZMI project 1681

Boonanarring and Atlas Project BFS Page 35
dayworks costs – estimate by Project team based on recent similar projectexperience and pre-qualification mining rates
processing variable costs including supplier quotations where possible, andotherwise using recent experience from similar projects
solar drying pond and booster pumping costs – estimate by BatteryLimits withexpert consultancy input based on recent similar project experience
owner’s fixed and labour costs – Project team and BatteryLimits with expertconsultancy input based on detailed manning schedules and recent similar projectexperience
logistics costs – Wyntak logistics consultancy based on detailed analysis of optimumhaulage configurations and quotations from major contractors
The operating cost estimates and key metrics are summarised in Table 1.16.
Table 1.16 Project Operating Cost Summary
ItemBoonanarring Atlas
A$M A$/t HMC(1) A$M A$/t HMC (1)
Mining $206.8 $185.5 $62.5 $87.80
Processing $34.3 $30.7 $19.7 $27.7
Direct cost $241.1 $216.2 $82.2 $115.5
Land Access $0.6 $0.5 $0.5 $0.6
Native Title Payments - - $1.5 $2.2
Site Admin $19.8 $17.8 $18.9 $26.6
Logistics(2) $73.9 $66.3 $50.9 $71.6
Subtotal Operating Cost $335.4 $300.8 $154.0 $216.5
Royalties (3) $26.0 $23.4 $10.9 $15.4
MRF Levy (4) $0.1 $0.1 $0.1 $0.1
Total Operating Costs (5) $361.5 $324.2 $165.0 $232.0
(1) Based on total HMC production of 1,115kt for Boonanarring and 711kt for Atlas
(2) Includes road transport, port charges and shipping
(3) Royalties are charged on the value of HMC sold at 5%.
(4) Mineral Rehabilitation Fund Levy is charged at an average rate per hectare of disturbance.
(5) Excluding capitalised prestrip of A$7.5 million included in initial development capital

Boonanarring and Atlas Project BFS Page 36
1.14.1 Mining Operating Cost
Mining costs have been derived from the 2016 prequalification mining contract tender whereshortlisted mining companies presented their cost assumptions based on the monthly productionschedule.
A summary of the rates used for financial modelling are shown in Table 1.17. The fixed mining costsare shown in Table 1.18.
The Atlas PFS applies the same cost per unit mined and the same fixed costs as the BoonanarringBFS.
Table 1.17 Variable Mining Cost Assumptions
Variable mining costs Units Rate
Waste A$/bcm 2.23
Ore A$/bcm 2.25
SMU Feed & Grade Control A$/t ore 1.06
Table 1.18 Fixed Mining Overhead Cost Assumptions
Fixed mining costs Unit Rate
Fixed Mining Costs A$Mpa 6.61
Owner’s Mining Labour Costs A$Mpa 0.54
1.14.2 Plant Operating and Administration Cost
The operating cost estimate includes five major costs – process plant power, reagents, labour,maintenance supplies and SMU moves - as direct processing costs, as shown in Table 1.19 andTable 1.20. The Atlas PFS uses the same operating cost per unit as the Boonanarring BFS.
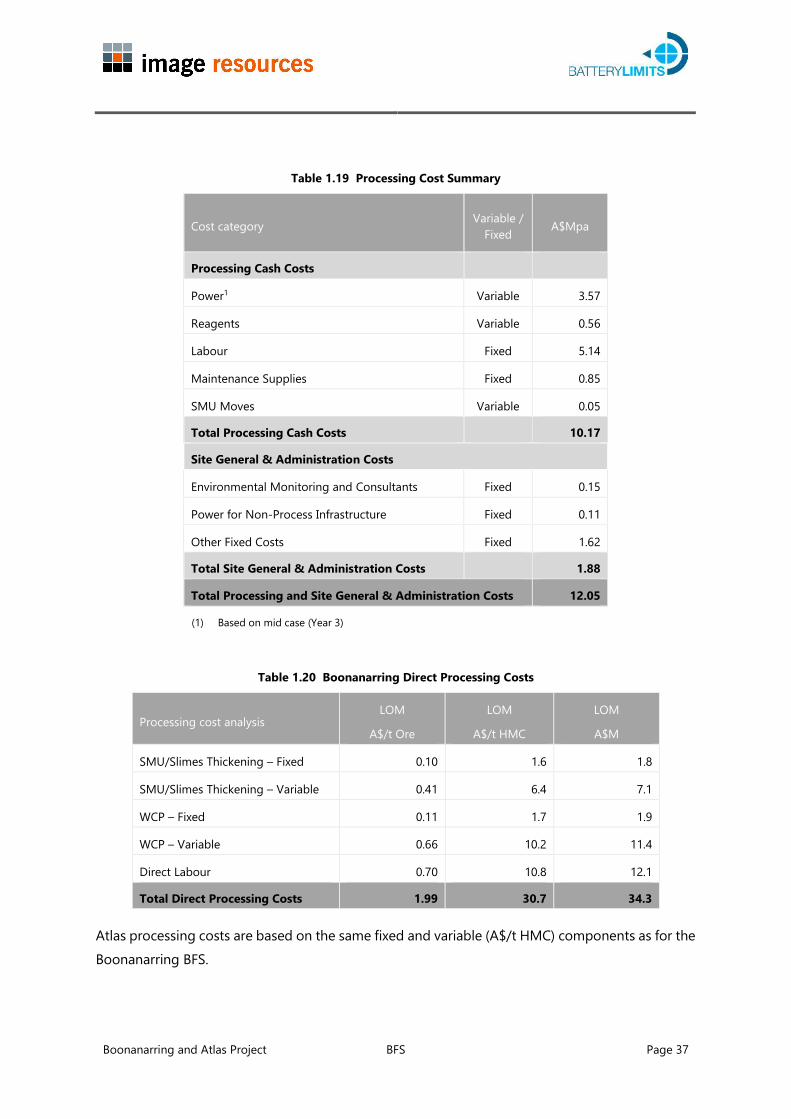
Boonanarring and Atlas Project BFS Page 37
Table 1.19 Processing Cost Summary
Cost category Variable /Fixed A$Mpa
Processing Cash Costs
Power1 Variable 3.57
Reagents Variable 0.56
Labour Fixed 5.14
Maintenance Supplies Fixed 0.85
SMU Moves Variable 0.05
Total Processing Cash Costs 10.17
Site General & Administration Costs
Environmental Monitoring and Consultants Fixed 0.15
Power for Non-Process Infrastructure Fixed 0.11
Other Fixed Costs Fixed 1.62
Total Site General & Administration Costs 1.88
Total Processing and Site General & Administration Costs 12.05
(1) Based on mid case (Year 3)
Table 1.20 Boonanarring Direct Processing Costs
Processing cost analysisLOM
A$/t Ore
LOM
A$/t HMC
LOM
A$M
SMU/Slimes Thickening – Fixed 0.10 1.6 1.8
SMU/Slimes Thickening – Variable 0.41 6.4 7.1
WCP – Fixed 0.11 1.7 1.9
WCP – Variable 0.66 10.2 11.4
Direct Labour 0.70 10.8 12.1
Total Direct Processing Costs 1.99 30.7 34.3
Atlas processing costs are based on the same fixed and variable (A$/t HMC) components as for theBoonanarring BFS.
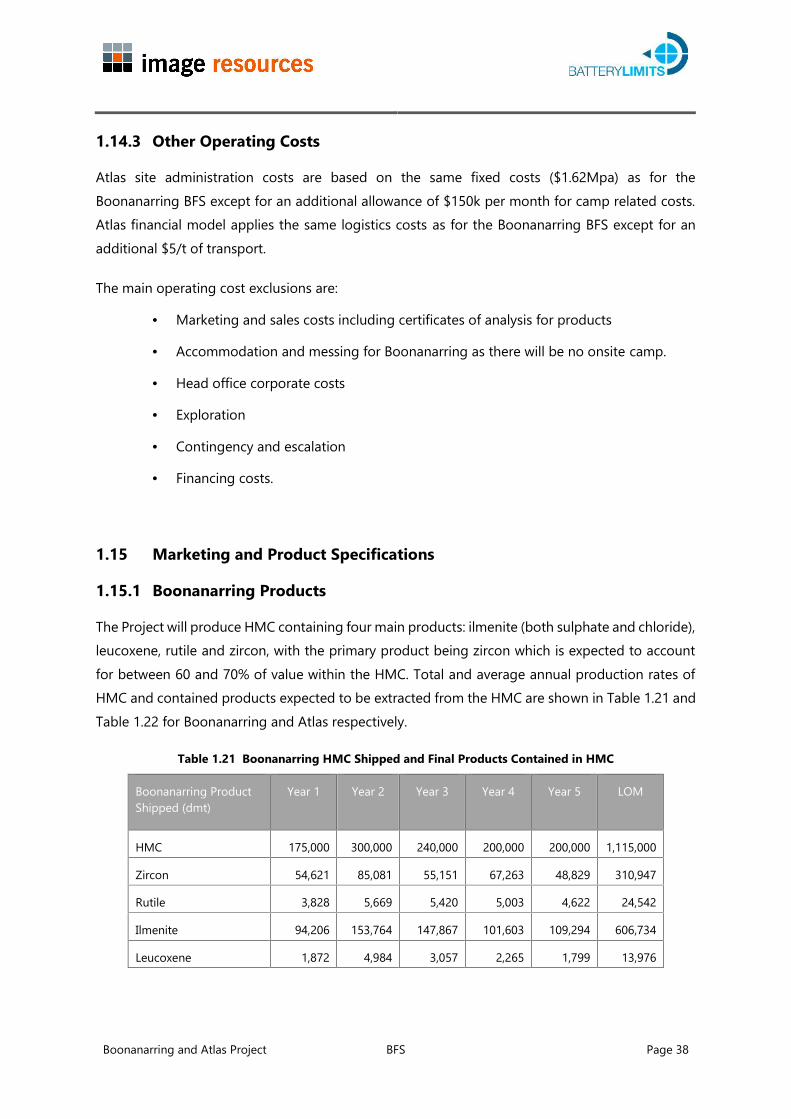
Boonanarring and Atlas Project BFS Page 38
1.14.3 Other Operating Costs
Atlas site administration costs are based on the same fixed costs ($1.62Mpa) as for theBoonanarring BFS except for an additional allowance of $150k per month for camp related costs.Atlas financial model applies the same logistics costs as for the Boonanarring BFS except for anadditional $5/t of transport.
The main operating cost exclusions are:
Marketing and sales costs including certificates of analysis for products
Accommodation and messing for Boonanarring as there will be no onsite camp.
Head office corporate costs
Exploration
Contingency and escalation
Financing costs.
1.15 Marketing and Product Specifications
1.15.1 Boonanarring Products
The Project will produce HMC containing four main products: ilmenite (both sulphate and chloride),leucoxene, rutile and zircon, with the primary product being zircon which is expected to accountfor between 60 and 70% of value within the HMC. Total and average annual production rates ofHMC and contained products expected to be extracted from the HMC are shown in Table 1.21 andTable 1.22 for Boonanarring and Atlas respectively.
Table 1.21 Boonanarring HMC Shipped and Final Products Contained in HMC
Boonanarring ProductShipped (dmt)
Year 1 Year 2 Year 3 Year 4 Year 5 LOM
HMC 175,000 300,000 240,000 200,000 200,000 1,115,000
Zircon 54,621 85,081 55,151 67,263 48,829 310,947
Rutile 3,828 5,669 5,420 5,003 4,622 24,542
Ilmenite 94,206 153,764 147,867 101,603 109,294 606,734
Leucoxene 1,872 4,984 3,057 2,265 1,799 13,976

Boonanarring and Atlas Project BFS Page 39
Table 1.22 Atlas HMC Shipped and Final Products Contained in HMC
Atlas Product Shipped(dmt)
Year 1 Year 2 Year 3 Year 4 LOM
HMC 190,000 220,000 220,000 81,288 711,288
Zircon 26,496 19,927 16,168 4,131 66,722
Rutile 13,953 16,604 15,181 4,625 50,365
Ilmenite 98,779 109,469 99,234 31,683 339,165
Leucoxene 5,293 9,275 9,563 2,886 27,017
1.15.2 Product Grades and Specifications
Samples of final product quality products were produced in testwork.
Four different TiO2 products are expected to be produced from the Boonanarring HMC:
Rutile TiO2~95.5% Fe2O3~0.85%
Leucoxene TiO2>69%, Fe2O3~24%
Chloride Ilmenite TiO2~60%, Fe2O3~33%
Sulphate Ilmenite TiO2~54.5%, Fe2O3~27.4%
In addition, Boonanarring HMC will contain a significant quantity of zircon. The Zirconsubsequently extracted is expected to be sold as the equivalent of standard grade but there ispotential for some premium grade product.
Zircon (Premium) ZrO2>66%, Fe2O3~0.08
Zircon (Standard) ZrO2~65%, Fe2O3~0.20
1.15.3 Estimated Value of Final Products Contained in HMC
Table 1.23 and Table 1.24 show the forecast FOB price of the heavy minerals within the HMC ofproduction in $US/dmt over the life of the Project.

Boonanarring and Atlas Project BFS Page 40
Table 1.23 Boonanarring – Forecast FOB Value of Final Products Contained in HMC
Boonanarring Pricing(US$/dmt) 2018 2019 2020 2021 2022 Long
Term
Ilmenite (Sulphate)(1) 150 165 172 174 174 167
Ilmenite (Chloride)(2) 171 191 215 234 250 258
Leucoxene(3) 527 606 729 754 750 750
Rutile(2) 753 865 1,041 1,077 1,071 1,070
Zircon (standard)(4) 854 924 1,009 1,112 1,206 1,330
(1) Price forecast for primary ilmenite assumes 10% discount to the market consultant sulphate ilmenite priceforecast.
(2) Price forecast for Chloride ilmenite and rutile are in line with the market consultant price forecast for theseproducts.
(3) Price forecast for leucoxene is based on a 30% discount to rutile prices
(4) Standard grade zircon prices applied to Boonanarring product are based on premium zircon less a US$75 pertonne discount.
Table 1.24 Atlas – Forecast FOB Value of Final Products Contained in HMC
Atlas Pricing (US$/dmt)2023 2024 2025 2026 Long
Term
Ilmenite (Sulphate) 185 185 185 185 185
Ilmenite (Chloride) 258 258 258 258 258
Leucoxene 750 750 750 750 750
Rutile 1,070 1,070 1,070 1,070 1,070
Zircon (standard) 1,405 1,405 1,405 1,405 1,405
The basis of the HMC offtake is for the HMC to be priced based on Delivery to China (CIF). Shippingcosts are estimated at US$20 per tonne.
1.15.4 HMC and Zircon Off-Take Agreements
The BFS base case is for sale of HMC CIF Bunbury and for downstream processing into finalproducts in China by the buyer, with zircon being on-sold by the processor to Orient ZirconicScience and Technology Industry Co. Ltd. (OZC). OZC has agreed to suspend the current zirconofftake agreement with Image in order to allow Image to sell HMC to Natfort. In return, Natforthas committed to suppling the resulting zircon products to OZC.

Boonanarring and Atlas Project BFS Page 41
Image has entered into a life-of-mine binding offtake agreement for HMC produced from Image’sNorth Perth Basin tenements, including Boonanarring and Atlas, with a China based company(Natfort - Natfort Zirconium and Titanium Co Ltd) that has an existing dry plant facility in China.Natfort is a privately owned company engaged in the processing of HMC purchased from mineralssands producers and/or brokers for separation into final TiO2 and zircon products. Natfort hasprocessed material from Murray Zircon in the past and has sold zircon to OZC. The offtakeagreement is based on testwork carried out by the Natfort using samples of HMC fromBoonanarring.
HMC will be sold based on an agreed estimate of value of contained HM products and CIF marketprices for those products less an allowance for port handling and transport to the drymill in China(A$11.50/dmt), processing costs (A$50/dmt), estimated recoveries (estimated at 3-4% less forzircon and for TiO2 products) less a 5% profit margin; HMC sales will be supported by a Letter ofCredit to be based on an agreed estimate of value of the HMC; andall the resulting zirconproduction will be sold to OZC.
Additional key terms of the offtake agreement are:
Image may terminate or change the agreement:
○ in the event it finds, or receives an offer from, an alternative off-taker at a higherprice or longer term basis and Natfort is unwilling or unable to match thealternative.
○ if Image changes from offering to sell HMC, to offering to sell Non-MagneticConcentrates.
○ if Images processes its HMC into final products in Australia, at any point afterfive years from receipt by Natfort of first HMC shipment.
The key terms of the offtake agreement have been used for the project revenue sensitivities, withmineral sands prices, and in particular zircon, having the greatest impact on project revenue.
Boonanarring and Atlas Project BFS Page 42
1.16 Human Resources
The total operational workforce is estimated to be 123 people, 98 of which will be employed on acontinuous shift based roster. The majority of the proposed workforce (nominally 82) will beemployed by the mining contractor to undertake all earthworks activities and associated services.Image’s proposed workforce includes 41 personnel working across five areas of the operation.
Upon completion of mining at the Boonanarring deposit, the full Image workforce will continuetheir employment at Atlas. As such, the current study proposes similar employee numbers andorganisational structure to that of Boonanarring at Atlas.
It is expected that most of the workforce recruitment for the Project will focus around the GinginShire and surrounding regional areas, along with the northern suburbs of Perth. Employees willcommute to and from site daily. However, temporary overnight accommodation is beinginvestigated as a management strategy to address potential issues arising from fatiguemanagement.
There may be the requirement to recruit professional and specialised employees from otherregions of Western Australia and around Australia. Western Australia has one of the bestestablished mineral sands industries in the world. Image will look to outsource certain otheractivities where industry specific skills and experience are crucial to the ongoing success of theoperation.
Professional and technical skills required on an irregular basis will be provided by consultants basedout of Perth and surrounding areas.
The preferred employment model uses individual employment agreements between individualworkers and the Company. This will depend on prevailing HR/IR regulations and general practice.
The operating workforce will be progressively recruited during the construction period and willparticipate in the mine development, assembly of plant and equipment, commissioning andadministration services. This will have the advantage of providing opportunities for key personnelto become familiar with the plant and to start to ‘take ownership’ ahead of commissioning.
Figure 1.22 illustrates the proposed Boonanarring organisation chart for plant operationalpersonnel working across four areas.

Boonanarring and Atlas Project BFS Page 43
Figure 1.22 Proposed Boonanarring Organisation Chart

Boonanarring and Atlas Project BFS Page 44
1.17 Health, Safety, Environment, Permitting and Community
The Boonanarring deposit is in the Shire of Gingin, a predominantly rural area with a population inthe order of 5,250 residents. Gingin is the main town and administrative centre, locatedapproximately 20 km south of the deposit. The site is on cleared agricultural land, used for broadscale cropping and grazing. Intensive horticulture (turf farms and vegetable growing) exist to thesouth and several commercial tree plantations of mixed success also occur within the area. Theresources are in an established mineral sands province with a history of development exceeding30 years and are secured through tenure granted under the Western Australian (WA) Mining Act1978, which includes several mining leases at Boonanarring.
Whilst the Boonanarring operation will be new, the local community is familiar with thecharacteristics of mineral sands mining, processing and product transport, with Iluka Resourcesoperating the Gingin mine (approximately 10 km south of Boonanarring) from 2005 - 2009. Furthernorth, mineral sands have been mined for many years with large scale operations based atCooljarloo and Eneabba. Impact on social issues have been demonstrated to be adequatelymanaged in the context of the Gingin area by these successful operations. Stakeholder consultationconducted to-date has identified that many stakeholders are supportive of Boonanarring as itpresents an opportunity for local investment and employment, therefore it is not expected toattract any substantial community opposition.
The safety, flora and fauna, groundwater, noise and other environmental risks associated with theBoonanarring deposit have been assessed and are able to be managed such that the Project canbe safely implemented without significant impact to the State’s natural heritage and environmentalassets.
A strong foundation for the environmental management and community endorsement has beenachieved, via the approval process undertaken by the Environmental Protection Authority (EPA).The EPA reported in its assessment report that all impacts could be managed by implementingmanagement actions, complying with conditions and obtaining and complying with appropriatesecondary approvals.
Obtaining all remaining safety and environmental approvals, is well advanced, with key approvalsbeing recently submitted or in the final stages of preparation.
Land assess is covered by several compensation agreements with landholders which are requiredto facilitate mining. In some instances, these agreements will build on existing exploration phaseagreements. Appropriate tenure under the Mining Act 1978 is required. Most of the deposit iscovered by two granted Mining Leases (M70/1194 and M70/1311) and the balance is held underan exploration licence (E70/3041) and a General Purpose Lease G70/250. Application for a third
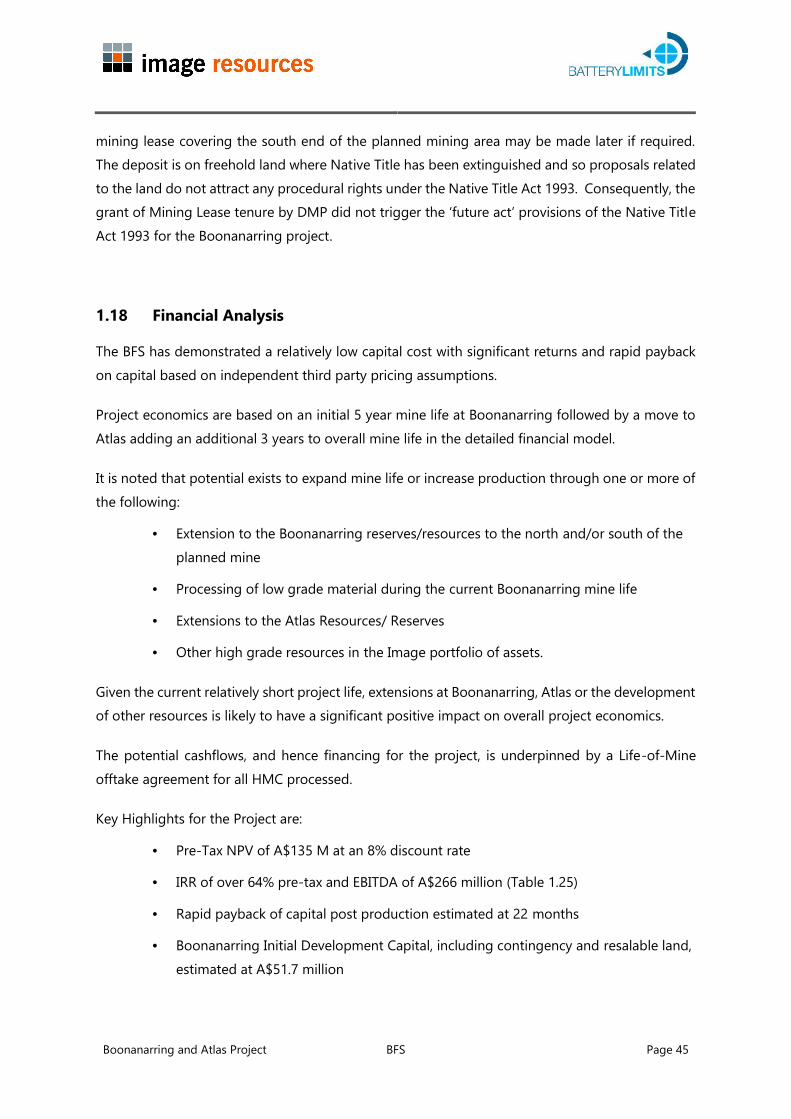
Boonanarring and Atlas Project BFS Page 45
mining lease covering the south end of the planned mining area may be made later if required.The deposit is on freehold land where Native Title has been extinguished and so proposals relatedto the land do not attract any procedural rights under the Native Title Act 1993. Consequently, thegrant of Mining Lease tenure by DMP did not trigger the ‘future act’ provisions of the Native TitleAct 1993 for the Boonanarring project.
1.18 Financial Analysis
The BFS has demonstrated a relatively low capital cost with significant returns and rapid paybackon capital based on independent third party pricing assumptions.
Project economics are based on an initial 5 year mine life at Boonanarring followed by a move toAtlas adding an additional 3 years to overall mine life in the detailed financial model.
It is noted that potential exists to expand mine life or increase production through one or more ofthe following:
Extension to the Boonanarring reserves/resources to the north and/or south of theplanned mine
Processing of low grade material during the current Boonanarring mine life
Extensions to the Atlas Resources/ Reserves
Other high grade resources in the Image portfolio of assets.
Given the current relatively short project life, extensions at Boonanarring, Atlas or the developmentof other resources is likely to have a significant positive impact on overall project economics.
The potential cashflows, and hence financing for the project, is underpinned by a Life-of-Mineofftake agreement for all HMC processed.
Key Highlights for the Project are:
Pre-Tax NPV of A$135 M at an 8% discount rate
IRR of over 64% pre-tax and EBITDA of A$266 million (Table 1.25)
Rapid payback of capital post production estimated at 22 months
Boonanarring Initial Development Capital, including contingency and resalable land,estimated at A$51.7 million
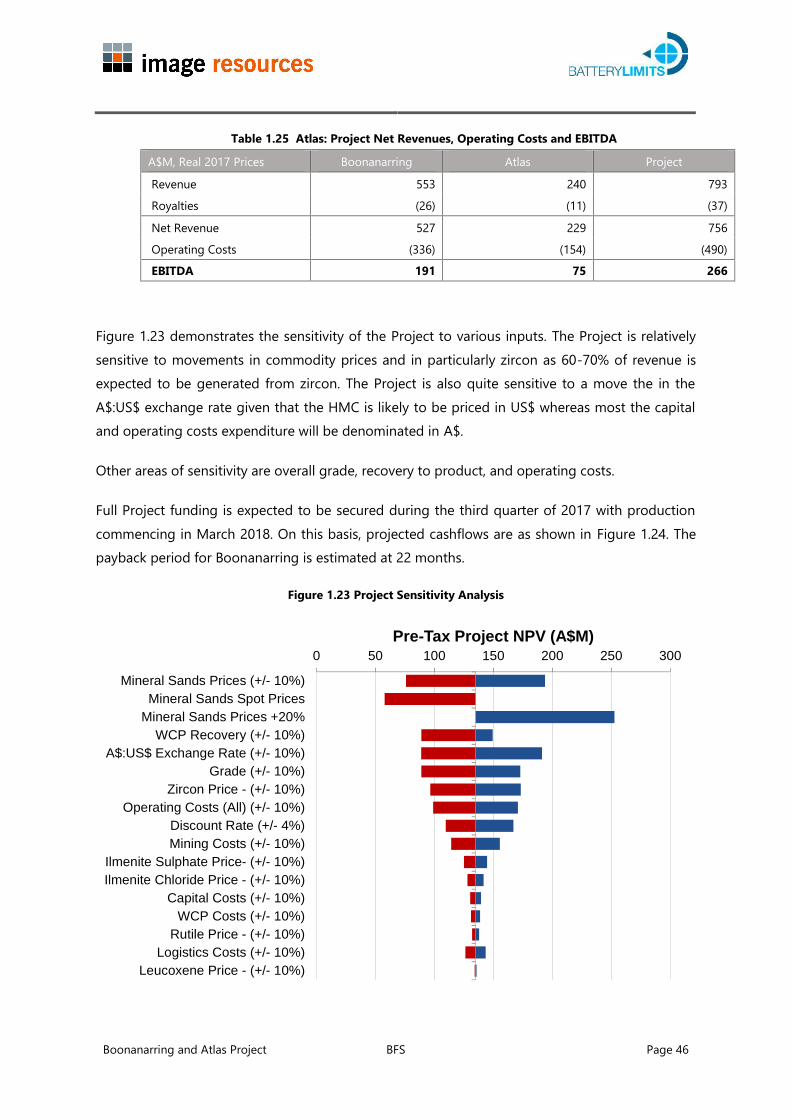
Boonanarring and Atlas Project BFS Page 46
Table 1.25 Atlas: Project Net Revenues, Operating Costs and EBITDA
A$M, Real 2017 Prices Boonanarring Atlas Project
Revenue 553 240 793
Royalties (26) (11) (37)
Net Revenue 527 229 756
Operating Costs (336) (154) (490)
EBITDA 191 75 266
Figure 1.23 demonstrates the sensitivity of the Project to various inputs. The Project is relativelysensitive to movements in commodity prices and in particularly zircon as 60-70% of revenue isexpected to be generated from zircon. The Project is also quite sensitive to a move the in theA$:US$ exchange rate given that the HMC is likely to be priced in US$ whereas most the capitaland operating costs expenditure will be denominated in A$.
Other areas of sensitivity are overall grade, recovery to product, and operating costs.
Full Project funding is expected to be secured during the third quarter of 2017 with productioncommencing in March 2018. On this basis, projected cashflows are as shown in Figure 1.24. Thepayback period for Boonanarring is estimated at 22 months.
Figure 1.23 Project Sensitivity Analysis
0 50 100 150 200 250 300
Mineral Sands Prices (+/- 10%)
Mineral Sands Spot Prices
Mineral Sands Prices +20%
WCP Recovery (+/- 10%)
A$:US$ Exchange Rate (+/- 10%)
Grade (+/- 10%)
Zircon Price - (+/- 10%)
Operating Costs (All) (+/- 10%)
Discount Rate (+/- 4%)
Mining Costs (+/- 10%)
Ilmenite Sulphate Price- (+/- 10%)
Ilmenite Chloride Price - (+/- 10%)
Capital Costs (+/- 10%)
WCP Costs (+/- 10%)
Rutile Price - (+/- 10%)
Logistics Costs (+/- 10%)
Leucoxene Price - (+/- 10%)
Pre-Tax Project NPV (A$M)
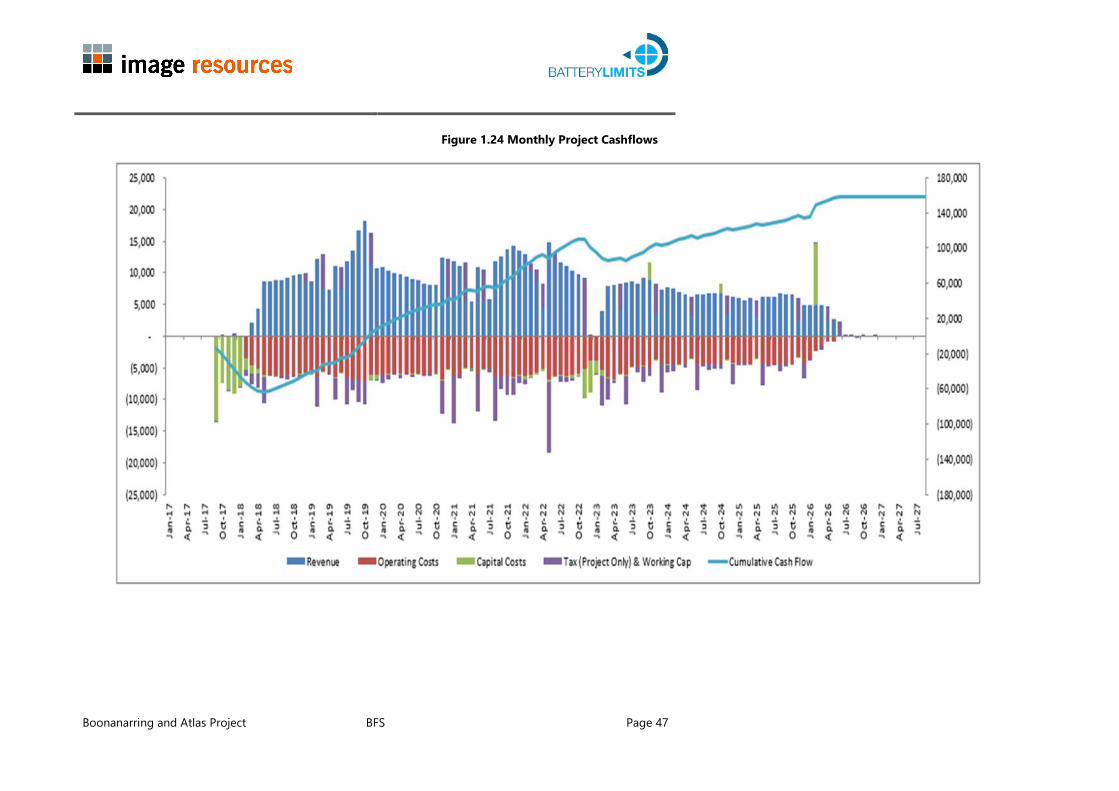
Boonanarring and Atlas Project BFS Page 47
Figure 1.24 Monthly Project Cashflows

Boonanarring and Atlas Project BFS Page 48
1.19 Risk Assessment
A formal risk assessment was undertaken on Boonanarring. Figure 1.25 shows the risks in theirpositions on the risk matrix. The risk matrix contains five high priority risks that need to bemanaged. These risks reflect the current stage of development of Image and the Project, as wellas specific risks associated with the mineral sands market and funding in general.
Specific high priority risks relate to Project funding, cashflow considerations and the associatedimplementation schedule, commodity pricing and HMC off-taker obligations.
Management attention risks (second level risks) relate to a number of Project aspects includingfunding the project, potential cashflow issues before full funding, owners team capacity to managethe project implementation, delays to the completion of the BFS, general permitting and regulatoryissues, achieving sales and offtake agreements, potential capital cost overruns, management ofnoise on site and risks associated with travel to/from site.
Treatment strategies have been developed for each of these priority and management attentionrisks. These risks all need to be managed as the Project develops.
The results of this risk assessment will form the basis of a risk register that will need to bemaintained and regularly reviewed against risk treatment strategies adopted on an ongoing basis,as the Project continues to be developed and moves into production.
No formal risk assessment was performed for Atlas mine and it has been assumed the risks andrisk profile will be similar given the mining and processing are similar. The location may imposehigher environmental risks which will be addressed during the Atlas BFS.
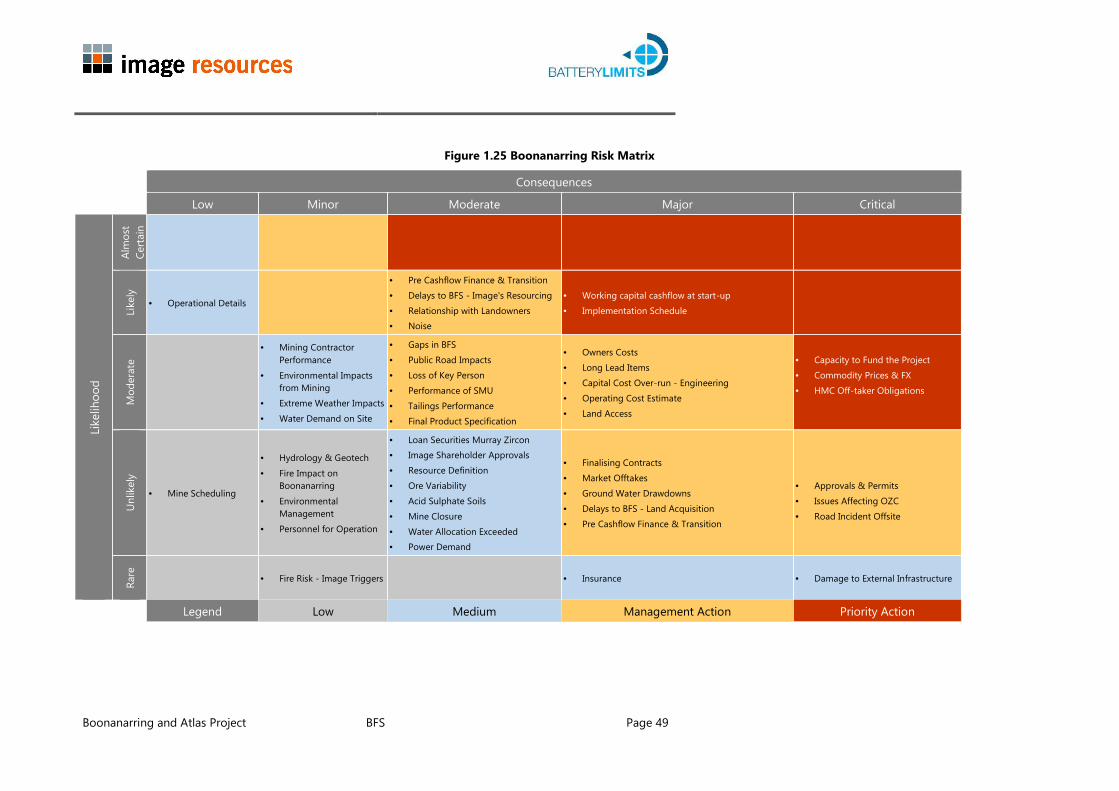
Boonanarring and Atlas Project BFS Page 49
Figure 1.25 Boonanarring Risk Matrix
Consequences
Low Minor Moderate Major Critical
Like
lihoo
d
Alm
ost
Certa
inLi
kely
Operational Details
Pre Cashflow Finance & Transition Delays to BFS - Image's Resourcing Relationship with Landowners Noise
Working capital cashflow at start-up Implementation Schedule
Mod
erat
e
Mining ContractorPerformance
Environmental Impactsfrom Mining
Extreme Weather Impacts Water Demand on Site
Gaps in BFS Public Road Impacts Loss of Key Person Performance of SMU Tailings Performance Final Product Specification
Owners Costs Long Lead Items Capital Cost Over-run - Engineering Operating Cost Estimate Land Access
Capacity to Fund the Project Commodity Prices & FX HMC Off-taker Obligations
Unlik
ely
Mine Scheduling
Hydrology & Geotech Fire Impact on
Boonanarring Environmental
Management Personnel for Operation
Loan Securities Murray Zircon Image Shareholder Approvals Resource Definition Ore Variability Acid Sulphate Soils Mine Closure Water Allocation Exceeded Power Demand
Finalising Contracts Market Offtakes Ground Water Drawdowns Delays to BFS - Land Acquisition Pre Cashflow Finance & Transition
Approvals & Permits Issues Affecting OZC Road Incident Offsite
Rare Fire Risk - Image Triggers Insurance Damage to External Infrastructure
Legend Low Medium Management Action Priority Action
Boonanarring and Atlas Project BFS Page 50
1.19.1 Priority Action Risks Treatment Strategies
Capacity to Fund the Project
The risk is that the Project is unable to secure funding.
Treatment strategies identified are:
Options for different debt/equity ratios and structuring
Alternative debt sources
Adapting to changing market conditions in a timely manner
Working Capital Cashflow at Start-up
The risk is that Image will run short of cash flow from site establishment through to positivecashflow.
Treatment strategies identified are:
Develop additional cash flow options/contingency sources
Identify an alternative finance line if necessary
Strategy to possibly approach shareholders
Detailed planning & implementation schedule.
Implementation Schedule
The risk is that the implementation will take longer than projected in the BFS schedule.
Treatment strategies identified are:
Peer review
Ongoing review of implementation schedule
Early works program/early funding
Manage post-BFS optimisation
Manage change so minimise impact on schedule
Isolate changes as separate projects.
Commodity Prices and FX
The risk is that commodity price fluctuations and exchange rate variations will reduce revenuecompared to financial model projections.

Boonanarring and Atlas Project BFS Page 51
Treatment strategies identified are:
Cost control to maintain low cost producer status
Consider on-site magnetics/non-magnetics separation strategy
Consider hedging of part of A$:US$ Foreign Exchange exposure.
HMC Offtaker Fails to Meet Obligations
The risk is that the HMC offtaker fails to meet its obligations under the HMC Offtake Agreement,and in particular, to provide letters of credit on a timeous basis as required.
Treatment strategies identified are:
Pre-arrange alternate HMC sale mechanisms with another off-taker
Seek alternate buyer on a per shipment basis
TZMI to act as arbitrator for pricing discrepancies
Maintaining the strong long term relationship that OZC/Murray Zircon Pty Ltd have builtwith the off-taker.
1.20 Implementation and Operating Plan
The objectives and implementation methodology for the early works program and Projectexecution includes the following:
Define the scopes of work for major project contracts – EPC/EPCM, mining, logistics,external intersection upgrades, energy supply
Assemble an Owner’s and EPCM team, with a sub team to perform the NPI works.
Establish Project framework and procedures.
Define the scope of the work for the earthworks with new geotechnical data.
Define the scope of the work for the electrical works for the initial HV submissionand subsequent design works to order long lead items and installation contracts.
Define the scope of the work for the concrete works and installation contracts.
Define the scope of the work for the SMP works and installation contracts.
Define the scope of the work for the E&I works and installation contracts.
Image has adopted a seamless approach to its study stages that accommodates change throughthe BFS and into the early works and implementation phase. Under this scenario, the BFS willgenerally still accommodate some minor changes, and the transition from BFS to implementationwill require some work to close any gaps in scope. This form of fast tracking project development
Boonanarring and Atlas Project BFS Page 52
reduces the development schedule, but pushes out more Project risk that is mitigated duringproject execution.
This type of development is driven by:
Uncertainty around product markets and the need to drive the Project developmentand complete the product marketing at the same time
A challenging fund raising environment where it is necessary to provide constantproject updates to the marketplace and to reach milestones both quickly andefficiently
A short ramp up to full production
An owners’ appetite to accept more risk in return for a shorter schedule and moremarket-driven flexibility. (Note that risk in this context does not imply potential fatalproject flaws, but that there may be issues that will need to be solved as the Projectproceeds – perhaps with a cost imposition).
A key will be the process design, so that the final design of the process plant will be based on theproduct requirements, which will satisfy the market. The BFS has resolved the process design andtherefore facilitates transition to early works and execution can be anticipated.
Planning and scheduling, and progress against plan, will be an integral part of the on-goingtransition from BFS - Early Works - Execution phase. The plan will be maintained by the ProjectManager.
The Project implementation plan will be updated during the early works, once all long lead itemsare procured, to provide certainty of strategy and design while ensuring that the project is deliveredto schedule and the ramp up to full production is achieved in an efficient and productive timeframe.
The Project schedule from completion of the BFS to completion of construction completion is 9months. The major influences on the projected schedule are:
Completion of funding activities post BFS and again prior to the commencement ofdetailed design and early works
Front end engineering design (FEED) and early detailed design activities
Procurement of long lead items
The ability for selected contractors to achieve the scheduled delivery time frames
Future detailed scheduling to determine the optimum number of work fronts andwork crews assigned to the mechanical, piping and electrical installations
Duration of commissioning and ramp up which is three months on top ofcompletion of construction
Boonanarring and Atlas Project BFS Page 53
Overburden removal prior to attaining access to the ore
Assumption, forming the basis of the implementation schedule, that the BFS andideally FEED have been completed prior to the award of an EPC contract
Environmental and mine permitting are excluded from the schedule
The fast tracked timeline is subject to early and full financing.
Image has considered contract operation as well as Owner-operator management of the Project.The mining operation and toll processing will be contractor operated, with all other activitiesOwner-operated but this will be further considered during post BFS.
1.21 Further Work
No further study work is planned to support the Boonanarring BFS, except for incorporating resultsfrom ore definition drilling/grade control drilling completed in March 2017 in the Resource modelto upgrade Resources in the first 2-3 years to Measured for conversion to Proved Reserves (highestlevel of knowledge and confidence). The Atlas BFS is scheduled to commence in 2020.
Engagement with long lead equipment suppliers, mining contractors, logistics companies, electricalsuppliers and Western Power for the high voltage submission needs to continue.
Permitting and government approvals process need to continue.
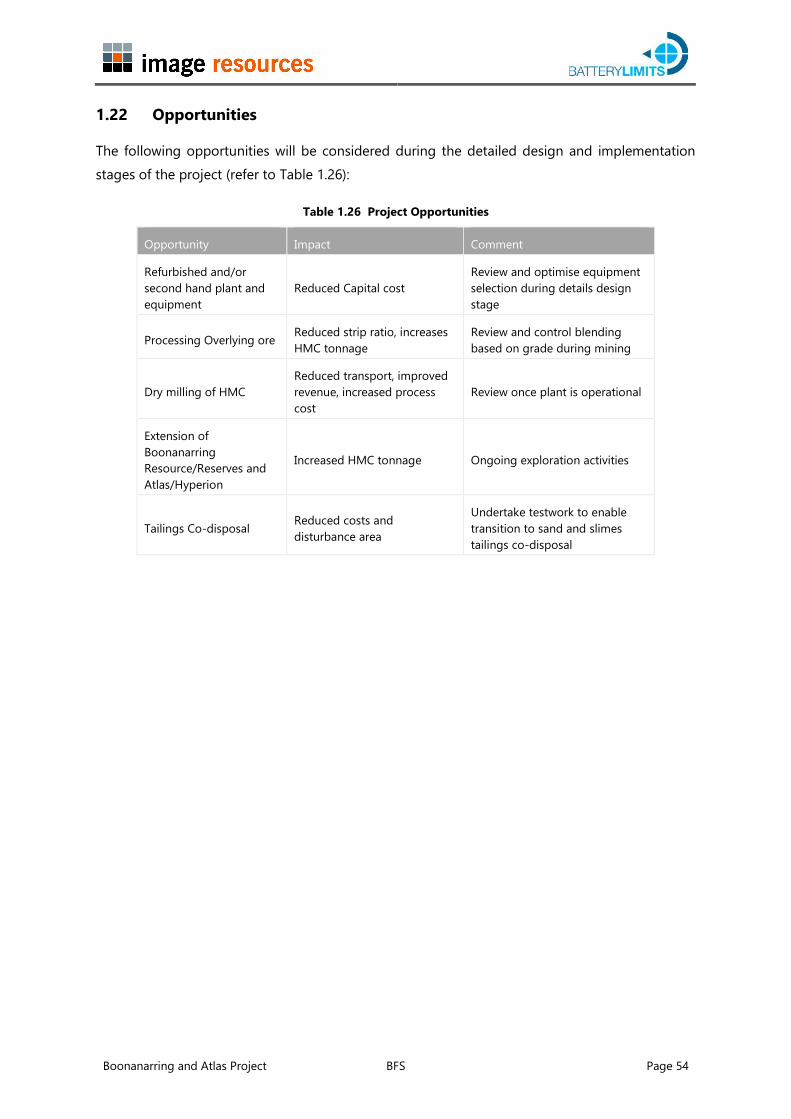
Boonanarring and Atlas Project BFS Page 54
1.22 Opportunities
The following opportunities will be considered during the detailed design and implementationstages of the project (refer to Table 1.26):
Table 1.26 Project Opportunities
Opportunity Impact Comment
Refurbished and/orsecond hand plant andequipment
Reduced Capital costReview and optimise equipmentselection during details designstage
Processing Overlying ore Reduced strip ratio, increasesHMC tonnage
Review and control blendingbased on grade during mining
Dry milling of HMCReduced transport, improvedrevenue, increased processcost
Review once plant is operational
Extension ofBoonanarringResource/Reserves andAtlas/Hyperion
Increased HMC tonnage Ongoing exploration activities
Tailings Co-disposal Reduced costs anddisturbance area
Undertake testwork to enabletransition to sand and slimestailings co-disposal