Stroke and non-compliance with the therapeutic regimen ... · I ABSTRACT The purpose of this study...
222
Stroke and non-compliance with the therapeutic regimen among hypertensive men and women in Gaza Strip Thesis submitted to the University of Bielefeld in fulfillment of the requirement for the degree of Doctor of Public Health (Dr.PH.) at the School of Public Health, University of Bielefeld, Germany Department of Public Health Medicine Submitted by: Yousef Ibrahim ALjeesh Palestine December 2003 Thesis Director: Prof. Dr. Alexander Krämer, M.D., Ph.D. Prof. Dr. Ulrich Laaser, M.D., Ph.D.
Transcript of Stroke and non-compliance with the therapeutic regimen ... · I ABSTRACT The purpose of this study...

Stroke and non-compliance with the therapeutic
regimen among hypertensive men and women
in Gaza Strip
Thesis submitted to the University of Bielefeld in fulfillment of the
requirement for the degree of Doctor of Public Health (Dr.PH.) at the
School of Public Health, University of Bielefeld, Germany
Department of Public Health Medicine
Submitted by:
Yousef Ibrahim ALjeesh
Palestine
December 2003
Thesis Director:
Prof. Dr. Alexander Krämer, M.D., Ph.D. Prof. Dr. Ulrich Laaser, M.D., Ph.D.

DEDICATION
To my mother, for her nurturing and inspiration
To my wife, for her love, support, patience, and understanding
And
To my children, Marah, Assel, Besaan, and Abdullah who have taught us
what really matters.
I
ABSTRACT
The purpose of this study was to ascertain whether an association exists
between non-compliance with the therapeutic regimen (anti-hypertensive
medication, dietary restrictions of sodium, weight reduction, exercise program,
follow-up health care, and smoking), and development of stroke among
hypertensive patients, and to determine the risk factors which contribute to the
development of stroke. Also to evaluate the differences in quality of life among
the patients with stroke and history of hypertension (case group), and
hypertensive patients without stroke (control group) one year before the study,
and to assess the existence of seasonal pattern and the occurrence of stroke.
The study described in this thesis aims: first, to understand the relationship
between non-compliance with the therapeutic regimen and development of
stroke among hypertensive patients in Gaza Strip; second, to provide reliable
information that might help improving the quality of life among hypertensive
patients.
A pair-matched case-control study design was used involving a case group
consisting of 112 subjects, who had been hospitalized for acute stroke with a
history of hypertension in Gaza Strip during a 12 month period in 2001, and a
control group consisting of 224 subjects (116 men and 108 women) who were
matched by age, sex, period of duration of the therapeutic regimen, enrolment
location, and with single history of hypertension (no other physical disease).
A self-reported structured interview was used for data collection. Data and
calculations were assessed using SPSS statistical system and SAS procedure
PHREG. Descriptive statistics and frequency distributions were generated to

II
make a comparison between the case and control group regarding
compliance with the therapeutic regimen, and seasonal pattern. Single logistic
regression models (crude odds ratio), and multiple conditional logistic
regression models were used to determine potential risk factors, which
contribute to the development of stroke (medication not taking as prescribed,
using excessive salt at meals, eating diet high in fat, no involvement in a
regular program of exercise, smoking, and high level of stress). In addition,
the same model was used to determine the interaction between high level of
stress (HLS) and using excessive salt at meals, and smoking and
development of stroke. To investigate differences in quality of life among case
and control groups an analysis of variance one-way ANOVA was carried out.
We found that hypertensive patients who developed stroke (case group) were
less compliant with the therapeutic regimen than the hypertensive patients
who did not develop stroke (control group). Single logistic regression models
(crude odds ratios) showed significant associations for stroke and several risk
factors, such as medication not taken as prescribed (OR=7.13; 95%CI 3.32-
15.32), excessive usage of salt at meals (OR= 6.21; 95%CI 3.75-10.29),
eating diet high in fat (OR=4.66; 95%CI 2.87-7.56), no involvement in a weight
reduction program (OR=4.97; 95%CI 1.72-14.36), no involvement in regular
exercise program (OR=4.94; 95%CI 3.80-8.73), no follow-up physician or
clinic (OR=3.03; 95%CI 1.8-5.1), and smoking (OR=2.20; 95%CI 1.33-3.62).
Multiple conditional logistic regression models showed a significant
association between the development of stroke and medication not taken as
prescribed (OR=6.07; 95%CI 1.53-24.07), using excessive salt at meals
III
(OR=4.51; 95%CI 2.05-9.90), eating diet high in fat (OR=4.67; 95%CI 2.09-
10.40), and high level of stress (OR=2.77; 95%CI 1.43-5.38). On the other
hand no significant association between smoking and the development of
stroke (OR=2.12; 95%CI 0.82-5.51) was found. Regular physical exercise
appeared as a protective factor in our model (OR=0.26; 95%CI 0.12-0.57).
The results of the multiple conditional logistic regression model based upon
the backward selection procedure and considering interaction terms with two
different stress levels showed significant interaction for using excessive salt at
meals interacting with low level of stress (LLS) in relation to the development
of stroke (OR=16.61; 95%CI 4.40-62.80). There was no significant effect of
excessive usage of salt interacting with high level of stress (OR=1.76; 95%CI
0.58-5.33) in relation to the development of stroke. Smoking in interaction with
low level of stress was a significant risk factor for stroke (OR=9.88; 95%CI
2.52-38.78), but a non-significant protective factor in interaction with high level
of stress (OR=0.52; 95%CI 0.14-1.99). These results are discussed further.
The World Health Organization Quality of Life (WHOQOL–BREF) twenty-six
items questionnaire was used in this study to measure the quality of life
(QOL). This version produces a quality of life profile, and it includes four
domain scores (physical, psychological, social relationships, and
environment). The analysis of variance shows that the overall mean quality of
life among the case group is lower than in the control group for both sexes at
all domains as evidence given by F-value and level of significance (p<0.05). In
addition, overall quality of life and in all domains is lower in our study than in
the German general population.

IV
Regarding the seasonal pattern and development of stroke, the data suggest
evidence for winter and autumn as the main seasons associated with
development of stroke.
The study gives clear evidence about the importance of pharmacologic and
non-pharmacologic treatment in reducing the risk of stroke and resulting in an
improvement of quality of life. More attention should be directed towards the
development of an effective health education program in light of conception
and misconception of the patients regarding illness and treatment at
secondary and tertiary health care level based on sound theory. This program
should focus on enhancing patients’ compliance with the therapeutic regimen,
improving health behavior, and modification of risk factors to decrease the
incidence and mortality rate of stroke among hypertensive patients.

V
ACKNOWLDEGMENTS
This thesis would not have been possible without the contribution and help
from a number of people, who have been involved at some point with this
thesis, from the methodology, implementation, analysis, and results of the
study. In particular, I thank Prof. Alexander Krämer, Prof. Ulrich Laaser,
and Dr. Bernhard Th. Baune for their advice, comments, attention to detail,
and un-swerving support and confidence in the thesis. I am particularly
grateful to Dr. Ralf Bender, Dr. Reyad Ezzanoon Minster of Health, Dr.
Yehia Abed, Dr. Mahmoud Mourad, Dr. Mazin Al hendy, Dr. Faisal abu
Shahla, Dr. Mohamed abu Shahla, Mr. Munir Abu Dalal General Director of
the Nursing Department without whose support it would not have been
possible to do this degree, Dr. Nafiz Shalah, Dr. Hammed Abu Mosa, Dr.
Mohamed Al Makadma, Mr. Nahed Alaham and Mr. Ibrahim Younis for
their kind help during the period of data collection. I would like to express
my appreciation to all faculty members of the nursing college at Islamic
University in Gaza Strip, mainly Mr. Atef Ismail, Mr. Nasser abu Noor, Mr.
Basheer Elhajjar, Mr. Ali Alkhateeb, Mr. Imad Haboob, and Mr. Ibrahim
Shamia for their continuous support and encouragement.
Also I owe much to all staff members at Shefa, Nasser, and European
hospital mainly Mr. Merwan Alderawy, Director of Nursing at Shefa
Hospital, Taleb abu Emalla, Deputy Director of Nursing at Shefa Hospital,
Hussan Joda, Director of Nursing at European Hospital and Sameer
Khader, Director of Nursing at Nasser Hospital. My deep appreciation goes

VI
to Mr Ayman Elnems, Moutasem Saleh, and Salem Al Arjany for helping in
data collection. I acknowledge the enormous efforts for all staff members at
the primary health centers in Gaza Strip, especially Shohda Jabalia,
Shohda Beit Lahia, Shohda El-Rimal, Sorane, Deir-El-balah, El-Magazie,
Shohda khan-younis, and Shohda Rafah Health Centers. It is with pleasure
that I acknowledge the invaluable help and support to all staff members of
the research health center in Gaza, and in particular Dr. Riayed Awad.
Yousef Aljeesh
Palestine, December 2003

VII
TABLE OF CONTENTS
ABSTRACT……………………………………………………………………………………………... ¡
ACKNOWLEDGEMENTS……………………………………………………………………………… V
GLOSSARY……………………………………………………………………………………………... XI
LIST OF TABLES...…………………………………………………………………………………..... XIII
LIST OF FIGURES……………………………………………………………………………………… XIV
CHAPTER ONE: INTRODUCTION…………………………………………………………………… 1
CHAPTER TWO: GENERAL BACKGROUND……………………………………......................... 5
2.1 Global burden of the problem………………………………………………………………… 5
2.2 Significance of the problem……………………………………………………………………. 5
2.3 Epidemiological view of the problem………………………………………………………… 7
2.4 Evidence of intervention…………………………………………………................................ 10
CHAPTER THREE: THEORETICAL MODEL…………………………………………………........ 11
Health Belief Model …………………………………………………………………………………. 11
CHAPTER FOUR: REGION OF THE STUDY………………………………………………………. 14
4.1 Country profile and socio-cultural background…………………………………………… 14
4.2 Health situation……………………………………………………………………………………. 17
4.3 Health care system…………………………………………………………............................... 19
CHAPTER FIVE: LITERATURE REVIEW ………………………............................................... 22
5.1 Hypertension and stroke………………………………………………………………………… 22
5.2 Compliance with the therapeutic regimen…………………………………………………… 26
5.2.1 Anti-hypertensive medication………………………………………………………………… 27
5.2.2 Exercise program……………………………………………………………………………… 30
5.2.3 Obesity and weight reduction………………………………………………………………… 35

VIII
5.2.4 Dietary restrictions of sodium……………………………………………………………..... 39
5.2.5 Smoking………………………………………………………………………………………….. 42
5.2.6 Follow-up health care……………………………............................................................... 45
5.3 Seasonal pattern and stroke……………………………………………………………………. 48
5.4 Quality of life……………………………………………………………………………………….. 49
5.5 Summary of the literature review………………………………………….............................. 51
CHAPTER SIX: RESEARCH PROBLEMS, AIMS AND OBJECTIVES………………………….. 55
6.1 Statement of purpose……………………………………………………………………………. 55
6.2 Study hypotheses ……………………………………………………………………………….. 55
6.3 Research questions……………………………………………………………………………... 56
6.4 Aims and objectives……………………………………………………………………………… 57
6.5 Definition of terms……………………………………………………………………………….. 58
CHAPTER SEVEN: METHODOLOGY OF THE STUDY…………………………………………... 59
7.1 Study design……………………………………………………………………………………….. 59
7.2 Period of the study………………………………………………………………………………... 60
7.3 Setting………………………………………………………………………………………………. 60
7.4 Study population………………………………………………………………………………….. 61
7.5 Sample and sampling…………………………………………………………………………….. 61
7.6 Exclusion criteria…………………………………………………………………………………. 63
7.7 Data collection…………………………………………………………………………………….. 63
7.8 Questionnaire……………………………………………………………………………………… 64
7.9 Anthropometric assessment……………………………………………………………………. 67
7.10 Constraints and limitations of the study......................................................................... 67
7.11 Ethical considerations…………………………………………………………………………. 68
IX
7.12 Data analysis……………………………………………………………………………………... 68
CHAPTER EIGHT: RESULTS………………………………………………………………………… 70
8.1 Socio-demographic characteristics among the case and the control groups……….... 70
8.2 Factors of compliance and non-compliance..................................................................... 76
8.3 Seasonal pattern and occurrence of stroke…………………………………………………. 90
8.4 Percentages of quality of life …………………………………………………………………… 92
8.5 Risk factors contributing to stroke development…………………………………………… 120
8.6 Analysis of variance of quality of life domains……………………………………………... 127
CHAPTER NINE: DISCUSSION…………………………………………………………………….... 143
9.1 Non-compliance with the therapeutic regimen and development of stroke…………… 143
9.2 Risk factors which contribute to stroke development……………………………………... 144
9.3 Differences in quality of life among the case and control groups……………………….. 149
9.3.1 Differences in quality of life by using descriptive statistics………………………….... 149
9.3.2 Differences in quality of life by ANOVA and F- test………………………………………. 157
9.4 Existence of seasonal pattern and the occurrence of stroke.......................................... 159
9.5 Methodological considerations………………………………………………………………... 160
9.5.1 Strengths of the study……………………………………………………………………….... 160
9.5.2 Limitations of the study………………………………………………………………………. 161
CHAPTER TEN: CONCLUSIONS……………………………………………………………………. 163
CHAPTER ELEVEN: RECOMMENDATIONS…………………………………………………........ 166
11.1 Policy, management, and future research………………………………………………….. 166
11.2 Implications for future research…………………………………………………………….. 166
11.3 Implications for health promotion………………………………………………………….. 167
CHAPTER TWELVE: BIBLIOGRAPHY……………………………………………………… 171

X
APPENDIXES…………………………………………………………………………………………… 194
List of appendixes…………………………………………………………………………………….. 194

XI
GLOSSARY
ADL Activity of Daily Living
ANOVA Analysis of Variance
BMI Body Mass Index
CDR Crude Death Rate.
CES-D Center for Epidemiological Studies Depression Scale
CI Confidence Interval
CT Computed Tomography Scan CVA
Cerebrovascular Accident
DALYS Disability Adjusted Life Years.
DBP Diastolic Blood Pressure
DF Degree of Freedom
F test Fisher test
GDP Gross Domestic Product
HBM Health Belief Model.
HLS High level of stress
HRA Health Risk Appraisal.
IMR Infant Mortality Rate.
LLS Low level of stress
MMOL Millimole
MOH Ministry of Health
NSAIDS Non Steroid Anti-inflammatory Drugs.
OR Odds Ratio
PA Palestinian Authority

XII
PCBS Palestinian Central Bureau of Statistic
PHC Primary Health Centers.
PICH Primary Intracerebral Hemorrhage.
QOL Quality of Life.
RR Relative Risk
SAH Subarachnoid Hemorrhage
SBP Systolic Blood Pressure
SHEP Systolic Hypertension Elderly Program
SPSS Statistical Package of Social Science
Sq.km² Square Kilometers
SSB Between-groups Sum of Squares
SSW Within-groups Sum of Squares
UNICEF United Nations International Children’s Fund
UNRWA United Nation Relief and Works Agency.
US United State.
WHO World Health Organization
WHOQOL World Health Organization Quality Of Life

XIII
List of tables
Table 1 Manpower in governmental hospitals in Gaza Strip………………………….. 20
Table 2 Body Mass Index…………………………………………………………………. 67
Table 3 Distribution of the study population by the name of hospital among
Case group…………………………………………………………………………
71
Table 4 Distribution of the study population by the location of health centers
among control group………………………………………………………………
72
Table 5 Distribution of the study population by diagnosis…………………………….. 73
Table 6 Distribution of the study population by age.................................................. 73
Table 7 Distribution of the study population by gender……………………………….. 74
Table 8 Body Mass Index among the case and control groups……….…................ 74
Table 9 Distribution of the study population by income……………………………….. 75
Table 10 Frequency and percentages of the factors of compliance and non-
Compliance……………………………………………………………………….
78
Table 11 Quality of life domains………………………………………………….............. 93
Table 12 Potential explanatory factors for stroke………………………………………. 120
Table 13 Risk factors of stroke by crude odds ratio……………………………………. 122
Table 14 Multiple conditional logistic regression model based upon backward
selection..................................................…………………………………......
125
Table 15 multiple conditional logistic regression model containing only the main
effects and no interaction terms………………………………………………..
126
Table 16 Age and Quality of life domains (QOL)………………………………………... 129
Table 17 Fischer test (F) ratio between QOL domains by age……………….............. 131
Table 18 Comparison of mean between Quality of Life in our study and
general standard of German population……………………………………..
133
Table 19 Mean quality of life domains in both groups by diagnosis………….............. 134
Table 20 Mean quality of life domains by diagnosis and age group………………….. 136
Table 21 Fischer test (F) ratio between QOL domains by diagnosis………………….. 138
Table 22 Mean quality of life among the case and control groups by sex……………. 140
Table 23 Fischer test (F) ratio between QOL by sex…………………………………… 142

XIV
LIST OF FIGURES
Figure 1 Health Belief Model…………………………………………………………….. 13
Figure 2 Distribution of population by age and sex in Palestine ............................... 16
Figure 3 Taking the medication as prescribed.......................................................... 79
Figure 4 Taking the medication at proper time……………………………………….. 80
Figure 5 No running out of pills................................................................................. 81
Figure 6 Not using excessive salt at meals ……………………………………........... 82
Figure 7 Family preparing a special low salt diet………………………………........... 83
Figure 8 Not eating diet high in fat……………………………………………….......... 84
Figure 9 Regular program of weight reduction………………………………………... 85
Figure 10 Regular program of exercise…………………………………………………. 86
Figure 11 Regular measurement of blood pressure…………………………………... 87
Figure 12 Follow-up clinic………………………………………………………………... 88
Figure 13 Not smoking.............................................................................................. 89
Figure 14 Seasonal pattern and occurrence of stroke………………………………. 91
Figure 15 Rating your QOL……………………………………………………………... 94
Figure 16 Satisfaction with your health………………………………………………… 95
Figure 17 Pain prevents you from doing what you need to do………………............ 96
Figure 18 Need of medical treatment…………………………………………………… 97
Figure 19 Enjoying your life...................................................................................... 98
Figure 20 Feeling your life to be meaningful ………………………………………….. 99
Figure 21 Ability to concentrate………………………………………………………. 100
Figure 22 Feeling safety in daily life……………………………………………………. 101
Figure 23 Healthy of your physical environment………………………………………. 102

XV
Figure 24 Enough energy for everyday life……………………………………………. 103
Figure 25 Acceptance of your bodily appearance…………………………………….. 104
Figure 26 Enough money to meet your needs……………………………………….... 105
Figure 27 Availability of the information that you need in your daily life……………. 106
Figure 28 Opportunity for leisure activities…………………………………………….. 107
Figure 29 Ability of getting around……………………………………………………… 108
Figure 30 Sleeping satisfactory………………………………………………………… 109
Figure 31 Ability to perform your daily living activities………………………………. 110
Figure 32 Capacity for work.................................................................................... 111
Figure 33 Satisfaction with yourself…………………………………………………… 112
Figure 34 Satisfaction with your personal relationships……………………………… 113
Figure 35 Satisfaction with sexuality …………………………………………………… 114
Figure 36 Satisfaction with the support you get from your friends………………….. 115
Figure 37 Satisfaction with the condition of your living place………………………. 116
Figure 38 Satisfaction with your access to health services…………………………... 117
Figure 39 Satisfaction with your transportation......................................................... 118
Figure 40 Negative feelings like sadness, despair, anxiety or depression………….. 119

1
Chapter 1
Introduction
This dissertation is not intended to be a comprehensive study on stroke, but it
is intended to ascertain whether an association exists between non-
compliance with the therapeutic regimen and development of stroke, and to
determine risk factors, which contribute to the development of stroke. In
addition, I would like to evaluate the differences in quality of life among the
patients with stroke and history of hypertension (case group), and
hypertensive patients without stroke (control group) one year before the study
and to assess the existence of seasonal pattern and occurrence of stroke.
A stroke is "the result of damage to part of the brain caused by an interruption
to its blood supply". There are many words and phrases, which mean the
same as stroke: these include "apoplexy, shock, cerebral infarction, cerebral
thrombosis, cerebral hemorrhage, and cerebrovascular accident or CVA". A
stroke is either caused by bleeding into the brain from rupture of a cerebral
blood vessel or by blockage of an artery caused by blood clot. [1].
Hypertensive patients are more likely to suffer a stroke than those whose
blood pressure is normal, but many people with hypertension do not have
strokes, and other people who suffer a stroke do not have history of
hypertension, so obviously hypertension is not always to blame. Hypertension
is a risk factor for stroke, which is the reason why it is so important for high
blood pressure patients to have antihypertensive medication. There are many
elements such as smoking, overweight, and poor diet may increase the risk of
stroke. Undoubtedly, stroke constitutes the most common disabling and lethal

2
neurological disease of adult life, because it affects the brain, which controls
out thoughts, feelings, memory, and imagination [2]. Non-compliance with the
therapeutic regimen is a significant problem among hypertensive patients. It is
estimated that 51% of the hypertensive patients stop their anti-hypertensive
medication within one year of its initiation [3]. The association between blood
pressure and non-compliance with the therapeutic regimen and development
of stroke has been investigated in several major studies. In addition,
knowledge of life style modifications for stroke development is important in
terms of prevention. For such reasons it is obvious that improved therapeutic
activities such as exercise, weight reduction, stop smoking, and control blood
pressure are required.
Our goal in this thesis is to understand the relationship between non-
compliance with the therapeutic regimen and development of stroke among
hypertensive patients in Gaza Strip; second, to provide reliable information
that help in improving the quality of life among hypertensive patients. This
work will be a useful reference for doctors, nurses, and related health care
professionals who practice their disciplines in this large and expending field.
This thesis emphasizes the importance of compliance with the therapeutic
regimen among hypertensive patients to prevent stroke development and to
use the results and findings of this thesis in clinical practice. We hope this
study will increase awareness of the knowledge for all heath care providers to
facilitate the movement of other study into the mainstream of patients care.
This dissertation is organized into 11 chapters, and the content of these
chapters are designed to assist the importance of compliance with the

3
therapeutic regimen in preventing dangerous disease outcomes. Chapter 1 is
provides an introduction about the important of the subject. Chapter 2
provides knowledge about Global and significance of the problem,
epidemiological view of the problem, and evidence of intervention. Chapter 3
stresses the importance of the Health Belief Model to enhance the patient’s
compliance with the therapeutic regimen. This enhances the understanding of
the severity and seriousness of the consequences, if the problem will be left
untreated. Chapter 4 is designed briefly to introduce socio-cultural
background, health situation, and health system in Gaza strip. Chapter 5
provides a background of the study and summary of the literature review
regarding compliance with the therapeutic regimen, and it is effect on patient
quality of life. Chapter 6 introduces the research problems, aims, objectives,
and hypotheses of the study. Chapter 7 focuses on study design, period of the
study, setting, study population, sample and sampling, exclusion criteria, data
collection, questionnaire, anthropometric assessment, ethical considerations,
and analysis of data. Chapter 8 introduces the results of the study. Chapter 9,
10, and 11 discusses the importance of the study, and provides specific
guidelines, conclusion and recommendations for using the results finding in
clinical area.
This research creates hope among all health care providers that this problem
can be controlled by a comprehensive health education program, and follow-
up health care. One of the major reasons we took on the challenge of doing
this study was to illustrate, provide, and introduce to all health care providers

4
the importance of compliance with the therapeutic regimen in stroke
prevention.

5
Chapter 2
General Background
2.1. Global burden of the problem
According to Disability Adjusted Life Years (DALYS), cerebrovascular disease
in 1990 was the sixth leading cause of DALYS, but they expected to be the
fourth leading cause of DALYS in the year of 2020, after ischemic heart
disease, unipolar major depression, and road traffic accidents. According to
the 15 leading causes of death in the world, cerebrovascular disease was the
second leading cause of death in 1990, but they expected to be the second
leading cause of death in the year of 2020 as well, after ischemic heart
disease. According to Global Burden of Disease, cerebrovascular disease
(first-ever stroke) is classified to be (IIG31) [11].
2.2. Significance of the problem
During the recent years and based on my observation, hospitals and
Palestinian Annual Report, stroke is a serious problem in Palestine, and it
needs a special and extensive care. According to the Palestinian Annual
Report 1997, the mortality rate among cerebrovascular disease between (20-
59) years old is high in comparison with other diseases, and it accounts
10.1%. Also the mortality rate among cerebrovascular disease over 60 years
old is high in comparison with other diseases, it accounts 17.8% [10].
The status of health in Palestine in 1999 showed that the mortality rate among
cerebrovascular disease in males between (15-59) years old is high in

6
comparison with other diseases and it accounts 6.8%. The mortality rate in
females with the same age also is high, and it accounts 10.6%. The mortality
rate among cerebrovascular diseases in both males and females between
(60-75) years old are high and they account 15.6% [4]. Few data exist and no
previous studies have been located in the literature about compliance,
awareness, knowledge, misconception, and management of hypertension and
stroke diseases in Gaza Strip. In addition, there are no previous studies talked
about how hypertension and stroke diseases affect patient's quality of life,
despite the assessing quality of life in people living in Gaza Strip is very
important, because they are at high-risk situation such as political instability,
malnutrition, poverty, and low health resources.
This study is considered the first step to initiate epidemiological data base
necessary for improving health status, increasing life consistency, preventing
complications, providing health prevention, promotion, curative, and
restoration for hypertension and stroke in Palestine. WHO expert committee
(1996) reported that prevention of stroke by anti-hypertensive therapy has
been successful, but more research is required to evaluate the effectiveness
of anti-hypertensive therapy and lifestyle modification in preventing various
types of stroke and recurrent stroke [12].
7
2.3. Epidemiological view of the problem
Hypertension is a major public health problem in the world affecting about
20% of the adult population, which accounts for 25-50% of all deaths [12].
Hypertension alone is responsible for over 70% of stroke in women, and 40%
in men [13]. The relation between the incidence of stroke and blood pressure
is continuous and particularly steep. All types of stroke (hemorrhagic, lacunar
and thrombotic) are associated with hypertension, and anti-hypertensive
agent is effective in decreasing the incidence of stroke by about 40% [12].
WHO and consensus of medical opinion reported that the prevalence of
hypertension is about 25% and 60% among elderly people, but it has been
demonstrated that there will be a decrease of 39% in strokes following anti-
hypertensive medication among elderly people over age of 60 [14].
Currently it is estimated that 50% of white women and 79% of Afro-American
black women over the age of 45 years are hypertensive and the prevalence of
hypertension for all women over 65 years of age is 70% compared with 40%
for men [13]. Higher level of blood pressure and a higher prevalence of
hypertension are more common among people with low socio-economic
status in countries that are in the post-transitional stage of economy. Some
geographical diversity has been noted in industrial countries reporting higher
prevalence rates of hypertension than most developing countries. Differences
between urban and rural areas have been reported in some developing
countries, with higher prevalence estimates in urban communities. Ethnic
differences, such as higher prevalence rates in blacks than whites, have been
reported from some countries [12]. Hypertension is the single most important,

8
common, and potent risk factor for stroke [15, 16, 17, 18, 19], and one of the
main causes which contributes to disability, health care costs, and stroke
mortality [20]. Kuller has said in a recent article in the European Journal of
Epidemiology that "The most important challenge of the new century will be
the prevention of hypertension, and if the people in the world could maintain
their blood pressure within the normal range, it is likely that stroke no longer
would be a major public health problem" [21]. Stroke is still a major and
formidable public health problem, leading to life threatening neurological
disease, death, and disability [16, 22, 23, 24, 25, 26]. Blood pressure should
be maintained within normal level, because subjects with diastolic blood
pressure (DBP) of 105 mmHg have a ten-fold increase in the risk of stroke
compared with those with DBP of 76 mmHg [27]. Untreated hypertension
increases the risk of vascular damage involving both small and large arteries,
which in turn lead to cerebrovascular morbidity and mortality [28]. A major
challenge to epidemiology and prevention research in the 21st century will be
the prevention of neuralgic damage of the brain directly related to stroke [22].
Hypertension is the main risk factor for both primary interacerebral
hemorrhage (PICH) and ischemic stroke. The relative risk for hypertensive
patient suffering PICH is as high as 3.9 compared with normotensive patients,
and 40-60% of patients with PICH have hypertension [29]. Hypertension is
one of the most common medical conditions for which Americans seek health
care, and a large body of evidence shows that decreasing blood pressure to
normal range can effectively lower stroke, coronary artery disease, and over
all mortality [30]. Hypertension affects almost 50 million people and places

9
them at a higher risk for cerebrovascular diseases [31]. Some studies provide
an evidence of a greater increase in stroke risk due to hypertension among
people with additional risk factors such as obesity [32], inactivity [33], current
smoking [34]. Others showed that increased levels of physical activity is a
significant protective factor in men, but not in women [35], The development of
stroke does not only depend on obesity and fat, but is related to the location
of fat (e.g. abdominal obesity, and extremities such as hands and legs) [36].
AS a main cause, hypertension alone is responsible for over 70% of strokes in
women and 40% in men. Compared with normotensive women, hypertensive
women are three times more likely to suffer a stroke. A 7.5mmHg difference in
diastolic blood pressure increases the risk of stroke by 46% in both sexes,
and women aged 35-64 years with systolic blood pressure of >180mmHg
have a five fold increased risk of stroke compared to normotensive women,
and the risk is increased four fold in those over 65 years of age [13].
Cross-Sectional and prospective studies showed that there is a strong and
consistent relationship between weight and blood pressure. [37]. Experimental
as well as observational studies showed that an increase of sodium chloride
intake more than requirements, is associated with increase in blood pressure
[38]. During the period of follow up care, sedentary and unfit normotensive
individuals have a 20-50% increase risk of developing hypertension when
compared with more active and fit peers [39].

10
2.4. Evidence of intervention
Hypertension is a risk factor for initial stroke, but its relation to stroke
recurrence is unclear [40]. In the United States stroke is the third leading
cause of death. Yearly about 600,000 people suffer a new or recurrent stroke,
500,000 of first attacks and 100,000 are recurrent attacks. Every 53 second,
some one in the United States suffers a stroke and every 3.3 minutes
someone dies of one. In addition, 158,448 people died in 1998 due to stroke,
which accounted about one of every 14.8 deaths [41]. In Germany in 1992,
about 12% of all deaths were from cerebrovascular diseases and the crude
incidence of cerebrovascular diseases is not precisely known, but is estimated
to be 150-180 new stroke cases per 100,000 per year, taking in consideration
the transient ischemic attacks were excluded [42].
In western industrialized societies, stroke is the third leading cause of
neurological deficit and death [43]. In Australia, yearly there is more than
40,000 people suffer a stroke [44]. In developing countries, stroke remains
one of the major public health problems, and any intervention, which prevents
the development of stroke, is of a major importance [25]. In Gaza Strip and
West Bank, cerebrovascular disease is considered to be the second leading
cause of death of the total cardiovascular disease mortality and it is more
among female than male. The mortality rate of cerebrovascular disease
among people of 60 years and older is 15.2 in comparison with other diseases
such as hypertension disease 11.3, malignant neoplasm's 9.1, diabetes
mellitus 5.3, and renal failure 3.2 [5].
11
Chapter 3
Theoretical framework of the study
Health Belief Model
Health belief models (HBM) is the most sophisticated model has recently
been used to compliance behavior, and identifying the risk factors for non-
compliance [45]. A group of social psychologists collaborated in the
development of the HBM in the early 1950 [46]. It is the most influential and
intensively researched theory of motivation related health behaviors [47].
This model is frequently used by health educators in health behavior
applications in order to predict, describe, and explain health related
behavior based on person’s perception and belief patterns [48]. It is
successfully used as the theoretical basis for a number of research studies,
with the theory applied to health related areas such as control of
hypertension [49].
HBM included four major dimensions, which are perceived susceptibility,
severity, benefits, and barriers. Perceived susceptibility concerns the
client's subjective perception and understanding the risk of incurring a
health–related problem. Perceived severity concerns the client's belief of
how serious a condition and its consequences are. Perceived benefits
concern the clients outcomes benefit, if he understand the severity of the
problem, and it is very important, to encourage the clients to accept the
health related advice. Perceived barriers concerns the client’s engagement
in a kind of cost-benefit analysis such as perceived benefits must outweigh

12
perceived cost, and whether the change is seen more as expensive,
dangerous, painful, and upsetting [46]. Numerous studies indicate that the
HBM can predict intentions to practice health related behavior [47].
Damrosch in the "general strategies for motivating people to change their
behavior" article said that “Dinicola'' and "Diaatteo" concluded the HBM is
important, because it specifies individual components of global patterns of
belief and focus attention on individual factors that are amenable to
change” [50]. In addition, the health belief and attributions have also been
considered as important determinants of regimen compliance. Krasnegor et
al. in "developmental aspects of health compliance behavior" shows in a
study conducted by (Sanders, Mills, and Horne, 1975) that the health
believes are significant predictors of both regimen compliance and
metabolic control. In addition, those who believed their self-care behaviors
could result in decreased probability of long-term complications were more
likely to engage in appropriate self-care behavior [51].

13
Figure No. (1): Health Belief Model
Perceived
susceptibility Perceived
seriousness
Threats
Causes of action
Perceived barriers Perceived benefits
Change

14
Chapter 4
Region of the study
Gaza Strip
4.1 Region profile and socio-cultural background
The Palestinian territories comprise two areas: the West Bank (consist of ten
provinces in the north) and Gaza Strip (consist of five provinces in the south).
West bank lies within an area of 5,800 square kilometers (sq.km²) west of the
river Jordan. The north provinces are Jenin, Tulkarem, Qualqilya, Salfit,
Nablus, Ramalah, Jerusalem, Jericho, Bethlehem, and Hebron. Gaza strip is
an overcrowded area with an area 360 sq.km² and lies on the coast of the
Mediterranean Sea. The population in Gaza strip is mainly concentrated in the
cities, and it is divided into five governorates: Gaza north, Gaza city, Mid-
zone, Khan-Younis, and Rafah. Within these five governorates, there are
small villages and eight refugee camps.
The population of Palestine in the year of 2000 was estimated at 3,150,056
inhabitants, 1,590,945 (50.5%) are males and 1,559,111 (49.5%) are females.
In Gaza strip, the population size is estimated at 1,138,126 about 36.1% of
total population in Palestine. Out of which 573,853 (50.4%) are males and
564,273 (49.6%) females. More than 16% of the population resides in the
north of Gaza, 52% in the central area and the people in both areas are
mainly treated at Shefa hospital. Nearly 32% of the population resides in the
southern area and they are mainly treated at Nasser, and European hospital [4].

15
Political map of the Gaza strip and West Bank that lies under the control
of the Palestinian authority (PA)
(Annual report, 1999)

16
The density rate in Gaza Strip is very high 3,161 inhabitants per one square
kilometer, compared with West Bank 342 inhabitants per sq.km², and
neighboring countries like Jordan and Lebanon. Some parts of the Gaza land
is still occupied by Israeli settlements, which make the problem of density
more badly. Figure 2 shows the population pyramid in Palestine, it is
estimated that 50.2% from the Palestinian population are less than 15 years
(23.8% male, and 23.1% female). Up to the age of 50 years, there is gender
predominance towards males, then gender predominance towards females.
The ages 60 years and over is constitutes (4.7%) of population and this is
mainly due to short life expectancy [5].
Figure No. (2): Distribution of population by age and sex in Palestine
(Annual Report, 2000)

17
Gaza Strip lies among the poorest countries in the world with a Gross
Domestic Product (GDP) of 1,315,845 $ per capita, while the Gross national
product showed 1,367,9 million in 1998. The unemployed increases and the
number of workers in Israel decreased in the year of 2000 and 2001
compared with year of 1999 due to unstable political situation and
occupation's practices such as closure of Palestinian region and cities. The
economy in West Bank and Gaza Strip has been struggling to recover from
the shock of the collapse of the Israeli bloc, as the industrial and productive
infrastructure had heavily been dependent on the Israeli support [6].
4.2. Health situation
The heath situation of people in the Palestinian territories is deteriorating as
the escalation of the conflict compounded by further border closure and
curfew throughout the West Bank and Gaza Strip. There are too many
restrictions on population movements, which hinder the delivery of health care
services. Many factors affecting the health status in Palestine such as
damage of commercial and social infrastructure, lack of human waste
disposal, damage to water supply, and problems with getting ride of solid
waste materials, may lead to spreading of parasitic infection. Disposal of solid
waste products is still one of the main environmental health problems in Gaza
Strip, and West Bank since September 2001 due to occupation, and improper
handling of solid waste, which can be filtrated to the water pipelines leading to
deterioration of water quality, and air pollution. During the new uprising, the
Palestinian ministry of health (MOH) reports that, its facilities operate at about
30% of capacity because of closures and curfews, and restrictions of access

18
continue to prevent Palestinian requiring medical treatment from accessing
care services. Harlem, G. in the ''health situation of Palestinian people living in
the occupied territory'' reported that two recent surveys carried out by different
organizations showed that half of young children (6-59 months) and women of
childbearing age are anemic. The second survey was carried out by the
Palestinian Central Bureau of Statistic (PCBS) and United Nations
International Children’s Fund (UNICEF) of 3,684 children and 6,204 women
showed that 49.5% of children have a hemoglobin level below 10.9 and
45.4% of non-pregnant women have a hemoglobin level below 11.9. The
Palestinian water resources may be the most crucial environmental problem
facing the Palestinian Authority. The water supply delivered for the Palestinian
people living in the occupied territory is scarce and deteriorated in both quality
and quantity, which will impose a public health hazard due to destruction of
water network and sewage pipelines. Especially the water delivered from
water tankers is unsafe and it is below the standard level set by the world
health organization (WHO). Other key health concerns is an increase number
of injured and disabled people due to Israel and Palestinian conflict, which are
in need for long term care regarding their physical problems [7]. The crude
death rate (CDR) for Palestine declined from 3.6 per 1000 population in 1996
to 3.35 per 1000 population in 1999. In Gaza Strip, it declined from 3.6 per
1000 population in 1996 compared to 3.4 per 1000 population in 1999. The
Infant mortality rate (IMR) in Palestine is about (15.5 per 1000 live births).
Gaza north governorate reported the highest IMR (29.6 per 1000 live births),
but Bethlehem in the West Bank reported the lowest IMR (7.0 per 1000 live
births). In Gaza Strip, 23.8% of infant deaths occurred at governmental
19
hospitals, out of which 32.1% in the first week after delivery. The major
causes of infant’s death are prematurely 18.6%, congenital anomalies 14.9%,
sudden infant death syndrome 8.1%, blood sepsis of the newborn 6.5%, and
pneumonia 6.4%. The highest mortality rate is among elderly people, who are
over 65 years (44.7 per 1000) population, and the lowest mortality rate is
among the people between 5-14 years (0.22 per 1000) population. The main
causes of death among male between the ages of 15-59 years are acute
myocardial infarction 18.7%, cerebrovascular diseases 6.8%, road traffic
accident 6.4% and heart failure 6.4%. The main causes of death among
female between the ages of 15-59 years are cerebrovascular disease 10.6%,
breast cancer 8.4%, acute myocardial infarction 7.7%, heart failure 7.4%,
renal failure 5.9%, and hypertension disease 4.1%. In addition, the main
causes of death over 60 years of old are cerebrovascular disease 15.6 %,
heart failure 12.6%, acute myocardial infarction 12.1%, senility 11.7%,
hypertension 7.6%, diabetes mellitus 4.5%, chronic ischemic heart disease
4.1% and renal failure 3.6% [4].
4.3 Health care system
The health care system during occupation is characterized by the poor and
inadequate delivery distribution of health services in term of quality and
quantity. In 1967, Gaza Strip came under the military occupation of Israel, the
structure of the health system and policies were managed by Israel
government [8]. The infrastructure of the health system was destroyed due to
the Israel government’s lack of interest to perform any investment in the
occupied territories heath system [9]. A great improvement and development

20
of health services such as human resources, infra structures, policies, and
regulations have taken place after Oslo agreement in 1993 between Israel
and Palestinian leaders.
4.3.1. The health services in Gaza strip
Three main health providers today provide the health services in Gaza Strip:
1. The Palestinian Ministry of Health (MOH)
It has the authority of supervision, regulation, licensure, and control for whole
health services. There are 45 health centers in Gaza strip under the
supervision of (MOH), 39 primary health care centers, and 6 hospitals. Table
1 shows the distribution of manpower and the six governmental hospitals in
Gaza strip, which are Shefa Hospital with 461 beds, Khan-Younis (Nasser)
hospital 239 beds, European Gaza Hospital 240 beds, Pediatrics Hospital 126
beds, Ophthalmology Hospital 31 beds, and Psychiatry Hospital 39 beds.
Table (1): Manpower in governmental hospitals in Gaza Strip
Hospital Beds Physicians Nurses Technicians
Shefa 461 272 378 91
Khan-Younis (Nasser) 239 144 216 47
European 240 - - -
Pediatric 126 62 94 26
Ophthalmology 31 13 26 2
Psychiatry 39 7 22 3
(Annual report, 1997)
Note: - European hospital established to work on the year of 2000, but right now, we have 240
beds, 140 physicians, 180 nurses, and 40 technicians are working in this hospital.

21
2. United Nations Relief and Works Agency (UNRWA)
It operates 17 primary health care centers, covering all the eight refugee
camps in Gaza Strip.
3. Non-Governmental Organization (NGO)
It operates many mini primary health care clinic, hospitals, and rehabilitation
centers.
The main goals of primary health centers (PHC), and hospitals in the all
sectors are to provide preventive, curative, and rehabilitative services to
maximize health and well being. The budget for the governmental health
sector increased from 61,976,000 $ in 1993 to 97,934,000 $ in 1997. The
expenditures of the Palestinian MOH were 42% for salaries, 30% for
medications, and disposable materials, 14% for operating expenditure and
14% for treatment a broad [10].

22
Chapter 5
Literature review
Risk factors can be considered as different variables or conditions that play an
important role in the occurrence of disease. Among extensive studies dealing
with risk factors for stroke, there have been conflicts that may be attributed to
different opinions on risk factors or to different methodologies to determine
risk factors. Stroke comprises several potential risk factors, which would be
appropriate to talk and clarify each one of them.
5.1. Hypertension and stroke
Hypertension is a major worldwide public health problem, and the world health
organization (WHO) started to pay more attention to the management and
control of hypertension to reduce the mortality rate from the circulatory system
diseases [57]. The observational and experimental epidemiological data
indicate that 6-mmHg decreasing in diastolic blood pressure associated with
40% decrease in fatal and non-fatal stroke rate in relative terms [15, 58, 59].
The Framingham Heart Disease Epidemiology Study, which is considered the
first and longest running prospective population based study about the
determinants of cardiovascular morbidity and mortality, has provided much of
the epidemiological evidence incriminating hypertension as the most important
modifiable risk factor for stroke [60]. The results of prospective studies and
clinical trials show that the risk of stroke will be decreased by controlling of
mild, moderate, and sever hypertension in all age groups [61]. Changing in
blood pressure can leads to stroke. In case of hypotension, the patient will
have cerebral ischemia and in case of hypertension the patient will have,

23
cerebral hemorrhage. The incidence of stroke among hypertensive patients is
seven times greater than in normotensive patients. Ozer M et al. in the
Management of persons with stroke book shows in a follow up study
conducted about a group of patients with hemiplegia and control blood
pressure (control group), and another group with poor control blood pressure.
A significant lower in developing a second stroke among control blood
pressure group in comparison with poor control (5% versus 28% with poor
control) [62]. Alter et al., 1994 conducted a study about hypertension and risk
of stroke recurrence. A cohort study was used with 662 patients with initial
stroke. Hypertension was determined by history and measuring blood
pressure at each follow-up at 4-to 6 month's intervals for up to 48 months.
History of hypertension, measured blood pressure and its control were
analyzed in relation to stroke recurrence frequency using Kaplan-Meier and
unvaried, multivariate, and time-dependence Cox proportional hazards
models. The result of the study showed, the patients with a history of
hypertension had a significantly higher stroke recurrence rate than those
without such a history (P=.01). Recurrence risk showed a reduction in a
multivariate analysis as quality of diastolic blood pressure control increased
(relative risk=8.4, 3.9, and 2.0 among those with poor, fair, and good control,
respectively, compared with non-hypertensive subjects. The conclusion of the
study was a history of hypertension and elevated measured diastolic pressure
after the initial stroke were associated with an increased risk of second stroke
and Controlling diastolic pressure substantially reduced this risk [40].

24
Prospective Nurses Health conducted a study to show the relation of self-
reported high blood pressure and subsequent development of coronary heart
disease and stroke among 119, 963 women between the age of 30 to 55
years old and who had no previous diagnosis of angina, myocardial infarction,
and stroke. Participants in the Nurses Health Study reported high blood
pressure and other cardiovascular risk factors on baseline questionnaires
mailed in 1976. The results of the study during 6 years of follow-up showed
that, there were 308 incidence cases of coronary heart disease (66 fatal and
242 non-fatal myocardial infarction), and 175 strokes (50 fatal and 125 non-
fatal). Fatal as well as non-fatal coronary heart disease and stroke were all
significantly more frequent among the women who had reported high blood
pressure. After adjusting simultaneously for age and other risk factors, the
relative risk was 3.5 (95%CI 2.8-4.5) for total coronary heart disease and 2.6
(95%CI 1.8-3.5) for total stroke. This association was evident at all levels of
relative weight. The results emphasize the importance of high blood pressure
as an independent predictor of coronary heart disease and stroke in middle-
aged women and suggest that, the increased risk occurs in both lean and
obese women [63].
Teunissen et al. conducted a study about risk factors for subarachnoidal
hemorrhage (SAH). Medline search from 1966 to 1994 and search of the
reference lists of all relevant publications were used to identify relevant
studies. Studies were included only if they fulfilled predefined methodological
criteria. Case-control studies were included if the diagnosis of SAH was
proved by computed tomography scan (CT), angiography, or autopsy in at

25
least 70% of patients. Longitudinal studies were included if the criteria for SAH
were based on a review of the medical records. Nine longitudinal studies and
11 case-control studies were included. The result showed that smoking
(Relative Risk [RR]=1.9; 95%CI 1.5-2.3 for longitudinal studies, Odds Ratio
[OR]=3.5; 95%CI 2.9-4.3 for case-control studies. Hypertension (RR=2.8;
95%CI 2.1-3.6; OR=2.9; 95%CI 2.4-3.7), and drinking 150 gram or more of
alcohol per week (RR=4.7; 95%CI 2.1-10.5; OR=1.5; 95%CI 1.1-1.9). Use of
oral contraceptive, hormone replacement therapy, hypercholesterolemia, and
physical activity were not significantly related to the risk of SAH. We conclude
that smoking, hypertension, and alcohol abuse are important risk factors for
SAH. Reduction of exposure to these risk factors might result in a decrease
incidence of SAH [64].
A blood pressure survey was arranged in the city of Bergen, Norway, to show
the relationship between blood pressure and 20 years of mortality among
52,064 subjects, 21,367 men and 30,697 women between the ages of 30 to
89 year. These subjects were followed from January 1, 1964 until death. Both
systolic and diastolic blood pressures were measured twice and the second
measurement was used in the analyses. The relative risks was calculated by
the ratio of mortality in the group with high blood pressure to that in the group
with lower blood pressure (systolic pressure > 160mmHg vs. Systolic blood
pressure < 160mmHg and diastolic blood pressure > 95mmHg vs. Diastolic
pressure < 95mmHg). The results of the study showed, increased blood
pressure was related to increase in mortality from stroke, and coronary heart
disease at all age groups. Long linear relation was seen between systolic

26
blood pressure and the mortality of both stroke and coronary heart disease
among men and women. More deaths were diagnosed as stroke in
comparison with coronary heart disease among oldest groups of women, and
there was an increase in the mortality rate of stroke with an increasing systolic
blood pressure among men and women [65].
5.2. Compliance with the therapeutic regimen
Compliance with the therapeutic regimen is the main goal of health care
professionals in hypertensive treatment. The treatment of hypertension is
started nowadays with non-pharmacological therapy through a modification of
lifestyle such as weight reduction, increase physical activity, moderation of
dietary sodium and fat, limited alcohol intake and avoidance of stress
[66]. Non-compliance with the therapeutic regimen such as (anti-hypertensive
medication, dietary restrictions of sodium and fat, weight reduction, exercise
program, and smoking) is usually the main cause of hypertensive
complications and mainly stroke. Edward DF, 1999 conducted a study
included 400 patients were randomly assigned either to various compliance
promoting interventions or to no intervention by using the therapeutic regimen.
The result showed the mortality was 75.3% less in the experimental group
than in the control group. The blood pressure was controlled in 65% of the
experimental group compared with only 22% of the control group [67].

27
5.2.1. Anti-hypertensive medication
Nowadays the proper and successful management of hypertension is through
three steps, which are anti-hypertensive medication, sodium restriction, and
weight reduction [68]. Veterans Administration Cooperative Study showed the
treatment of moderate and severs hypertension by anti-hypertensive
medication (thiazide, and reserpine) reduce hypertensive complications in
general, and stroke mortality by 50% [69]. Anti-hypertensive agents have
been clearly shown to prevent both cerebral hemorrhage and cerebral
infarctions [29]. Several clinical trials and recent meta-analysis suggested that
anti-hypertensive medication are directly and clearly evidence reduced the
risk of stroke development [70]. The prevention of stroke by anti-hypertensive
therapy has been successful, but more research is required to evaluate the
effectiveness of anti-hypertensive therapy and life style modification in
preventing previous types of stroke and recurrent stroke [12].
Uncontrolled hypertension continues to be a major unresolved health problem.
Kotchen et al. conducted a study to assess hypertension control, and medical
care use among high-risk African Americans households in Milwaukee’s inner
city. A random sample of 583 subjects from 438 households over the age of
18 was selected. In this study, logistic regression analysis and interview were
used. The interview includes questions to assess history of hypertension, use
of anti-hypertensive medications, use of health care services, and household
income level. Subjects with hypertension were defined as those with systolic
blood pressure of 140 mmHg and/or diastolic blood pressure of 90 mmHg or
higher or who were currently taking anti-hypertensive medications. The results

28
of this study showed that fourty two percent of the respondents were
hypertensive. Blood pressure was uncontrolled in 74% of hypertensive
persons, although 64% of hypertensive persons reported having seen a
physician within the previous three months. Seventy percent of the
hypertensive respondents had previously been informed of their hypertension
by physicians, and 76% of women were aware of their hypertension in
comparison with 60% among men (P<.01). Fifty- five percent of the
hypertensive individuals reported taking anti-hypertensive medication. Sixty
two percent of women were taking anti-hypertensive medication in
comparison with 43% among men (P<.003) [71].
Both systolic and diastolic blood pressure are correlated with age, until age of
50, after that systolic blood pressure continue to increase with age, but
diastolic blood pressure did not increased. Now they believe that isolated
systolic hypertension raises the risk of cardiovascular disease as (coronary
heart disease, left ventricular failure, and stroke) in both middle and old age.
In addition, systolic hypertension is considered to be a predictor for both
morbidity and mortality than diastolic pressure in these age groups. Systolic
Hypertension Elderly program (SHEP) in 1991 conducted a study to
investigate the importance of anti-hypertensive medication in the treatment of
systolic hypertension by using double blind clinical trial design to treat systolic
hypertension. The subjects were divided into two groups. The first group had
anti-hypertensive medication such as chlorthalidone and sometimes atenolol
or reserpine if needed, and the second group had placebo. The subjects
followed for four to five years. The results of the study showed that, there was

29
36% decrease in stroke, 25% decrease in coronary heart disease, and 45%
decrease in left ventricular failure in the participants treated with
chlorthalidone or other drugs [72].
Anti-hypertensive medication is very important in controlling blood pressure,
and it was shown to be significantly decreasing the mortality rate of
hypertensive complications such as stroke [45]. The side effect of anti-
hypertensive medications is the major reason for non-compliance to the
therapeutic regimen, and the price that the patient should pay to normalize his
blood pressure [57].
Recent surveys have shown that fewer than 30% of hypertensive patients
benefit from treatment, because of lack of compliance with medical advice,
despite convincing evidence that anti-hypertensive medication prevents
premature death and suffering from such devastating complications as stroke
and heart attack. The most common problem that faces the health care
provider and lead to dissatisfaction is inability to improve patient's compliance,
and inability to understand why the patient did not comply with the therapeutic
regimen [73]. Phillips, 1988 in "patient compliance (new light on health
delivery system in medicine and psychotherapy)" book said that Addington
(1979) remarked: “Patient compliance with drug therapy for chronic disease is
poor. Poor compliance has been documented in the long term management of
hypertension and diabetes mellitus, in rheumatic fever prophylaxis, as well as
in tuberculosis” [169]. Stunkard says: “Adherence to medical treatment is a
major problem in modern medicine. No more than 50% of the patients adhere

30
to long term programs of diet and drugs” [166]. Azrin and Powel showed that
“A major problem in outpatient treatment has been the extreme irregularity
with which patients use medication prescribed for them” [167]. Stone et al.
“Estimate one- third to one half of patients from different medical regimens fail
to follow fully the treatment prescribed” [168]. Sackett and snow also
observed, “Compliance declines quickly in the treatment course even among
short-term regimens, and only about one-half or fewer patients stay with long
term compliance” [74].
5.2.2. Exercise program
Exercise plays an important, and significant role in controlling blood pressure,
improve lipid (cholesterol, and fat) profile, decrease blood clot formation,
increase clot removal, and decrease obesity [75]. Several studies reported
that physical activity decreases the risk for thromboembolic stroke among
older nonsmoker persons, and reduces the risk of cerebral hemorrhage [76,
77, 78]. Dishman, 1994 in "advances in exercise adherence" book said that
Salonen et al., 1982 reported a statistical significance between low physical
activity and cerebral stroke [79]. Aerobic exercise such as cycling and jogging
play a major role in reducing blood pressure among people with mild and
moderate hypertension [45, 80, 81, 82]. There is a prospective study
conducted by the Honolulu Heart Program about the association between
physical activity and the risk of stroke among 7, 530 men over 22 years of
follow up between the ages of 45 to 68 years. At the time of the study
enrolment, an estimate of current 24-hour habitual physical activity was
collected from each subject. During the 22 years of follow-up period,

31
information about cardiovascular events was obtained through a
comprehensive surveillance of hospital discharge registers, death certificates,
and autopsy records. Based on physical activity, subjects were divided into
three groups, the first one contains inactive subjects, the second one partially
active, and the third one active subjects. Examination of the risk for stroke is
carried out separately among younger middle-aged men between the ages of
45 to 54 years old and older middle aged men between the ages of 55 to 68
years old. Several confounding variables such as age, systolic blood
pressure, serum cholesterol, number of cigarettes smoked per day, monthly
alcohol intake, serum glucose, serum uric acid, haematocrit, and left
ventricular hypertrophy were controlled to know the independent effect of
physical activity on stroke. Subjects, who were enrolled in the study with
hypertension, diabetes mellitus, or left ventricular hypertrophy, were analyzed
separately to know the interactions between these risk factors with stroke. To
examine the independent effect of physical activity on stroke, Proportional
Hazard Regression Model was used. The results of the study showed that,
Inactive or partially active old people were experienced three to four fold
excess incidence of hemorrhagic stroke in comparison with active old people
(P<0.01). Intracerebral hemorrhage occurs two to three fold excess among
men who were inactive or partially active in comparison with people who were
active. Relative risk for hemorrhagic stroke for inactive men versus active men
was 3.7. The relative risk of thrombo-embolic stroke among non-smoker and
inactive men was 2.8 in comparison with non-smoker and active men [33].
32
Another study conducted about the influence of different levels of physical
activity on the risk of stroke in members of the Framingham Study Cohort. In
this study, 1,897 men (their mean age equal 49.7 years) and 2,299 women
(their mean age equal 49.9 years) were involved. A prospective study design,
a structured interview to measure daily activity level of subjects, and Cox
Proportional Hazards Linear Regression was used to examine the association
between physical activity and risk of stroke over a follow-up period up to 32
years. Two separate analyses were done for the subjects, one during midlife
and the other during elderly. Stroke was defined as the first occurrence of
atherothrombotic brain infarction, cerebral embolism, or other type of stroke.
Physical activity was categorized into three levels: low, medium, and high
levels and they were compared to a low level of physical activity, which was
used as a referent group. The results of the study showed, increased levels of
physical activity were protective among men. The strongest effect between
physical activity and the risk of stroke obtained among older subjects with
medium level of activity. Adjusted analyses showed no significant protective
effect in women. These results indicate that medium and high levels of
physical activity among men are protective against stroke, relative to low
levels [35].
National Health Epidemiological Follow up Survey 1 showed a different result
about women in relation to physical activity. They conducted a study to
investigate the relationship between physical activity and the incidence of
stroke among men and women. In this study, 5,852 white and black persons
between the ages of 45 to 74 years old and who met the criteria of the study

33
were involved. Personal interviews and physical examination provided a
baseline data for National Health Epidemiological Follow-up Survey. Persons
with unknown baseline history of physical activity, systolic blood pressure,
number of cigarettes smoked, body mass index, history of heart disease,
educational attainment, cholesterol, history of diabetes, resting pulse rate, and
hemoglobin concentration were excluded from the study. Follow-up data
collected done three times during 1982 to 1984, 1986, and 1987. Participants
were asked about their physical activity and categorized as low, moderate,
and high. Longitudinal cohort design was used in this study. The results
showed that, there were 249 incident cases of stroke in white women, 270 in
white men, and 104 in blacks. There was association between non-
recreational activity and increased stroke risk among white women between
the age of 65 to 74 years after adjusting the baseline risk factors of age,
smoking, history of diabetes, history of heart disease, education, systolic
blood pressure, serum total cholesterol, body mass index, and hemoglobin
concentration (RR=1.82;95%CI 1.10-3.02). Regular physical activity may be
of benefit in preventing stroke in women as well as in men [83].
Not only physical activity and exercising are related to a decrease in the
incidence of stroke, but also, they are related to a decrease in risk factors of
all cardiovascular disease, such as obesity or body mass index, cholesterol
level, and blood pressure [3]. There is a study conducted to assess the
prevalence of cardiovascular disease risk factors, which are (obesity or body
mass index, cholesterol level, blood pressure and blood glucose level) among
a sample of healthy exercising and non-exercising adult women. The

34
researcher was used cross- sectional design with exercising as independent
variables and the other variables which are overweight or body mass index,
blood pressure, cholesterol, and blood glucose level as dependent variables.
The study was conducted at work sites throughout the United States by using
Health Risk Appraisal (HRA), which consists of 62 lifestyle questions, of which
12 were used for analyses to obtain self-reported behavioral data. The sample
consisted of 1412 women, who voluntary participated in the study between the
age of 30 to 59 years old classified into three categories (30 to 39, 40 to 49,
and 50 to 59), who divided into two groups of exercisers and non exercisers.
Blood pressure, weight, body mass index, cholesterol, and blood glucose level
were examined by using HRA. Moderate intensity of physical activity was
used for 30 minutes or more all days of week. The result was exercisers have
acceptable body mass index and 12 pounds body lost than non-exercisers at
all age groups. There is significantly lower level of low-density lipoprotein
cholesterol and triglyceride among the exercisers’ group in comparison with
non-exercisers in all age categories, except the subjects from 40 to 49 years
old. The differences between exercisers and non-exercisers groups were
small, but significant in terms of systolic and diastolic blood pressure. Blood
glucose did not demonstrate significant differences in exercisers and non-
exercisers groups, and feeling of well being and health are higher among
exercisers group in comparison with non-exercisers group [84].
35
5.2.3. Obesity and weight reduction
Obesity is a major public health problem [85, 86, 87, 88] and approximately
27% of woman and 24% of men are 20% or more above desirable weight [85].
Dishman said that The National Institutes of Health Consensus Conference in
1994 reported that obesity is a disease and it is related to an increased risk of
both morbidity and mortality from most of the chronic disease such as
hypertension, coronary heart disease, and stroke [79]. Obesity is associated
with an increased risk of all cause mortality [89], and many specific health
consequences, including hypertension [90]. Obesity is not only associated
with mild and borderline hypertension, but also is a predictor of future
hypertension, and it is considered as an additional risk factor for vascular
disease such as stroke and a well known correlated factor to hypertension
[45]. He, and Qian et al. conducted a cross-sectional study to investigate the
relationship between body mass and blood pressure in three community
based by using random sample in south western China. The first community is
rural Yi farmers (5,023 men, 3,218 women); the second community is Yi
migrants (1,656 men, 919 women); and the third community is Han Chinese
living in an urban setting (2,173 men, 1,516 women). Univariate and
multivariate regression analyses were used to quantify the relation between
body mass index and blood pressure. The result of the study showed both
systolic and diastolic blood pressure were positively and statistically significant
to body mass index after adjustment of age, smoking, alcohol intake, heart
rate, and physical activity [91].

36
Another study conducted in 1986 about the relationship between stroke
Incidence and body mass index and abdominal obesity. A sample of 28,643
United States male health professionals between the ages of 40 to 75 years
old was selected. Men with medical history of cerebrovascular and
cardiovascular disease or stroke caused by infection or neoplasm were
excluded. Cohort and follow up questionnaires were used every two years in
1988, 1990, and 1992. In this study stroke were classified into four
classifications, Ischemia (embolism or thrombosis), subarachnoidal
hemorrhage, intracerebral hemorrhage, and unknown cause according to
National Survey of Stroke. Body mass index and waist/hip ratio were divided
into quintiles; relative risks were adjusted by using the Mantel Extension Test.
Multiple logistic regression was used to adjust other potential risk factors. The
results of this study after five years of follow up showed, there were 118 cases
of stroke (80 strokes were ischemic, 25 as hemorrhagic and 13 cases of
unknown cause). Men in the highest quintile of body mass index had an age
adjusted relative risk of stroke of 1.29 in comparison with men in the lowest
quintile of body mass index, and men in the highest quintile of waist/hip ratio
had an age adjusted relative risk of stroke of 2.33 in comparison with men in
the lowest quintile. In contrast, men in the lowest quintile of body mass index
had higher stroke in comparison with the second quintile, which have more
body mass index. The results of the study suggested that, abdominal obesity,
but not elevated body mass index, predicts risk of stroke in men [32].
In addition, there is another study conducted about the association between
changes in weight and physical activity levels and changes in cardiovascular

37
disease risk factors over approximately a 5 years period among Mexican
Americans in the San Antonio Heart Study in 1992 to 1999. The researchers
used sample of 539 (321 women, and 212 men) Mexican Americans, who
were selected randomly, and they were visited the clinic on two occasions, the
first visit was initial screening phase, and the second occasions approximately
5 years later. Subjects who were diabetes, taking anti-hypertensive and anti-
lipid medication were excluded from the study. Physical examinations,
interviews about life style practice were taken and blood samples were drawn
at each clinic visit. Body mass index calculated as weight divided by height
squared, both systolic and diastolic blood pressure were measured by using
sphygmomanometer, cholesterol and triglyceride concentrations were
measured with Ciba-Corning Express plus clinical chemistry analyzer,
physical activity was measured by structured interview, and glucose was
measured with an Abbott V/P analyzer. The results approximately over 5
years period showed that weight change was correlated with changes in
variety of cardiovascular disease risk factors, including lipids and lipoproteins,
blood pressure, and insulin, and accounted for 2 to 5 percent of the variance
associated with blood pressure change and 2 to 10 percent of the variance
associated with change in lipids and lipoprotein. While changing in physical
activity was associated modesty only with change in low-density lipoprotein
cholesterol [92].
In another trial, Field et al., 1999 conducted a study about the relation
between body mass index, weight gain, repeated intentional weight losses,
and the risk of self-reported hypertension among 46,224 women between the
38
age of 33 to 51 years, who were participants, and responded to mail
questionnaire about their history of diseases, and health behaviors. The
questionnaire was sent to the participants for follow-up three times in 1991,
1993, and in 1995. The researcher divided the subjects into three groups
according to the magnitude of the weight loss required by French, and William
et al. The first group who lost 9 kg > three times between 1989 and 1993 was
classified as sever weight cyclers, the second group who lost 4.5 kg > three
times between 1989 and 1993 was classified as mild weight cyclers, and the
third group was classified as non-weight cyclers, who did not met the criteria
for both sever and mild weight cycling. A cohort study design and logistic
regression as statistical analysis were used. The results of the study showed,
over two years of follow-up, 1,107 women were newly diagnosed with
hypertension between the period of 1993 and 1995. Body mass index and
weight gain, but not weight cycler status, were independently associated with
the development of hypertension. For each 4.5 kg gain in weight, the risk of
hypertension increased 20 percent between the period of 1989 and 1993.
There was a small but not significant relationship between mild and sever
cycling and the risk of hypertension, when body mass index and weight gain
were adjusted. Women with body mass index of 25 were 12 percent more
likely to be diagnosed with hypertension in comparison with women, who had
body mass index of 24. This study supported strong independent predictors
between weight and weight gain and the development of hypertension [85].

39
5.2.4. Dietary restrictions of sodium
Sodium chloride has a greater effect on blood pressure than other salts of
sodium [93], and it holds a unique position among the environmental factors
that are known to affect blood pressure [94]. Not only restriction of sodium
effect blood pressure, but also lead to a reduction in the required dose of
many anti-hypertensive drugs such as beta blockers, angiotensin converting
enzyme inhibitors, and thiazide [95]. Hunt et al., 1996 in changing eating and
exercise behavior book said that the department of health 1994 reported a
strong and causal relationship between sodium consumption and blood
pressure. In addition, a reduction of 50-mmol sodium per day has been
estimated to reduce systolic blood pressure of about 3.5 mmHg [96].
Blanchard et al. said that populations with extremely high sodium or salt
intake have a high incidence of hypertension compared with low sodium or
salt intake populations [80]. Krause et al. said, Dahl suggests that people with
family history of hypertension should decrease sodium intake in their diet, and
restriction of sodium to 500 mg per day is necessary to achieve good
therapeutic results among hypertensive patients [68]. Guesry et al. said that
the International Salt (INTERSALT) study showed an association between
blood pressure and sodium intake among elderly people, and there is
substantial data indicating that sodium intake is related to blood pressure. In
the other hand a reduction of sodium intake will reduce both systolic and
diastolic blood pressure by a few mmHg [97]. INTERSALT Cooperative
Research Group conducted a study by gathering data on blood pressure and
24 hours urinary sodium and potassium excretion for over 10,000 men and
women aged 20-59 years in 52 centers throughout the world. The result

40
showed blood pressure was significantly related of sodium intake, and 10-
mmol rise of sodium intake is related to 0.9 mmHg increases in systolic blood
pressure [98].
Perry et al., 1978 in mild hypertension treat or not to treat said that Dahl has
found the employees of Brook haven National Laboratory, who did not salt
their food had approximately 1% incidence of hypertension in comparison with
12.7% with the employees who did salt their food [45]. Cook et al., 1998 in
effect of change in sodium excretion on change in blood pressure corrected
for measurement error article said that there was a reduction in systolic and
diastolic blood pressure with dietary sodium reduction intervention among
hypertensive persons. He conducted a study to show the effect of change in
sodium excretion on change in blood pressure among 744 subjects, who have
high normal diastolic blood pressure (80 to 89 mmHg). These subjects were
randomly assigned to an active sodium reduction intervention group or a usual
care group, 327 men and women were randomly assigned to active sodium
reduction intervention group and 417 to control group. The researcher used
longitudinal data from the sodium reduction component of the trials of
Hypertension Prevention Phase One, which carried out in 1987 to 1990 with
some statistical correction techniques. Blood pressure and urinary excretion
measurement were obtained during a series of screening visits and follow up
intervals of 6, 12, and 18 months with one 24-hour urine collection at each of
these times. Sodium and potassium excretion and the sodium- potassium
ratio were estimated for both control and intervention groups by using long tail
at higher values statistical test. The results of this study showed that a

41
decrease of 4.4 mmHg in systolic blood pressure (95%CI 0.1-8.8) and 2.8
mmHg in diastolic blood pressure (95%CI 0.2-5.8) is related to 100 mmol/24
hour reductions in sodium [99].
In 1992 the Joint National Committee on Detection, Evaluation, and Treatment
of High Blood Pressure change the term of non pharmacological therapy to
lifestyle modification. It advises the hypertensive patients to be compliant with
lifestyle modifications such as (reduction of sodium intake, weight reduction,
exercise, stop smoking, and low fat diet) for the treatment of hypertension. In
addition, it emphasizes that, if blood pressure remains high with lifestyle
modifications over three to six months, drug therapy should be started [100].
WHO in diet, nutrition, and prevention of chronic diseases book showed a
relationship between types of diet and developing chronic diseases, such as
coronary heart disease, gastrointestinal diseases, cerebrovascular disease
and diabetes mellitus. Also it emphasize that hypertension is considered the
main risk factor of stroke in developing countries with other contributory
factors such as increase salt intake, obesity and alcohol intake.
In another trial, a study involving 52 centers in 32 countries around the world
conducted by a recent large- scale multinational study about the role of
obesity, alcohol and mineral intake in the blood pressure. It founds a strong
relationship between obesity and increase in alcohol intake on blood pressure,
and a weaker, but significant relationship between increase salt diet and the
rise on blood pressure with age [14].

42
5.2.5. Smoking
Cigarette smoking is the largest heath risk that the people face, and the
danger of smoking is greater than any environmental hazards [101]. The
Framingham Heart study showed that smoking is a significant and
independent risk factor for stroke development in general and brain infarction
specifically [102]. Heavy smokers more than 40 cigarette daily were at twice
the risk of stroke in comparison with light smokers less than 10 cigarettes
daily [17, 103]. Cigarette smoking is the second risk factor of stroke
development after hypertension, and black people, who smokes more than 20
cigarettes per day had four times incidence of first attack of stroke than never
smokers [104].
Cigarette smoking is by far the largest health risk that most people face.
Indeed, the magnitude of the lifetime smoking risk is several times greater
than that of many widely regulated consumer and environmental hazards
[101]. Cigarette smoking is a risk factor for stroke, and the priorities for stroke
prevention are control of blood pressure and reduction of smoking [105].There
are three studies supported that. The first one conducted by The Physicians
Health Study to examine the association between cigarette smoking and the
risk of stroke among United States male physicians, their age between 40 to
84 years of age at entry in 1982, and they were free from previous myocardial
infarction, stroke, and transient ischemic attack. A sample of 22071 men was
selected and followed for an average of 9.7 years. A prospective cohort study
design and mailed questionnaire were used. Mailed questionnaire includes
questions about cigarette smoking status, which categorized to never smoked,
43
formally smoked, currently smoking less than 20 cigarettes per day, currently
smoking 20 or more cigarettes per day. Non-fatal strokes were reported on
the annual questionnaire, and deaths were reported by families or postal
authorities. Non-fatal stroke was defined as a typical neuralgic deficit that was
sudden or rapid on onset, lasted more than 24 hours, and was attributable to
a cerebrovascular event and strokes were classified according to probable
cause, ischemic or hemorrhagic stroke. The results of the study showed, 312
non-fatal and 28 fatal strokes occurred (375 ischemic, 56 hemorrhagic, and 9
unknown causes). Physicians currently smoking 20 or more cigarettes per day
had relative risks for both total nonfatal and fatal strokes of 2.52 and 1.24,
respectively after adjustment for age and treatment assignment, and in
multivariate analysis controlling for other risk factors, these relative risks were
2.71 and 1.46, respectively. Ischemic stroke was more strongly related to
current smoking in comparison with hemorrhagic stroke. For total nonfatal
stroke and ischemic stroke, we found linear increases in risk a cross the four
cigarette smoking categories (P<0.0001), and the relative risk among the
participants who never smoke was 1.00 [106].
The second study conducted to investigate the association between ischemic
stroke risk and passive exposure to cigarette smoking. Sample of 452
subjects, who had first episode of ischemic stroke and admitted to Austin and
Repatriation Medical Centre with mean age of 59 years compared with 452
subjects matched with age and sex as a control group. In this study, ischemic
stroke was defined as acute onset of a focal neurological deficit lasting more
than 24 hours, with computed tomography excluding hemorrhage. Passive
smoking was defined as the experience of living with a father, mother, and/or

44
spouses, who ever smoked at least one cigarette daily for at least a year. A
doctor diagnosed hypertension, ischemic heart disease, and diabetes. The
results of the study showed that, the risk of stroke was twice as higher among
the subjects, whose spouses smoked in comparison with those, whose
spouses didn’t smoke (95%CI 1.3 to 3.1), after adjustment for the subjects
own smoking, heart disease, hypertension, diabetes and education level. The
conclusion of this study provides evidence that spousal smoking may be a
significant risk factor for ischemic stroke [107].
The third one conducted by He et al. to investigate the relationship of
prevalence of hypertension and other risk factors with stroke incidence and
mortality. The study was accomplished in twenty-nine provinces among the
people Republic of China (PRC). The result showed, highly statistically
significant correlation between prevalence of hypertension and stroke
incidence (r .838, p <.001), and mortality (r .841, p<.001). Ten percent
increase in the prevalence of hypertension was associated with 2.80 fold
higher incidence and 2.68-fold higher mortality from stroke. In addition, a ten
percent increase in the prevalence of cigarette smoking was associated with
19 percent higher mortality from stroke [108].
Another prospective cohort study among 22,071 men between the ages of 40
to 84 years was conducted in Brigham, and Boston to examine the
association between cigarette smoking and stroke in men. The subjects were
followed for an average of 9.7 years and classified as never smokers, current
smokers, and former smokers. The results of the study showed that there is
no association between never smokers and development of stroke (RR=1.00).

45
An association exist but not significant between former smokers (RR=1.20;
95%CI 0.94-1.53), and development of stroke, but association and significant
relationship was present between current smokers (RR=2.02) and increase
risk of stroke. The conclusion of this study indicates that current but not former
cigarette smoking significantly associated with an increased risk for stroke in
men [109].
5.2.6. Follow-up health care
Perry et al. said that a positive correlation has been found between the
frequency of outpatient visits and compliance to the therapeutic regimen. He
mentioned a study conducted about the importance of follow-up health care
and compliance to the therapeutic regimen. This study involved a regular
home visit to instruct the patient about the nature of disease, taking the
medications, and check blood pressure. After two years of follow-up, the
percentage of compliance with the therapeutic regimen rose from 25% to
86%, and the percentage of blood pressure control rose from 15% to 80%.
After termination of home visit, and leaving patient on their own, the
percentage of compliance to the therapeutic regimen dropped to 55%, and
there are only 29% had blood pressure control [45].
In another study conducted about compliance and knowledge of hypertensive
patients attending Primary Health Care Centers in Al Khobar, Saudi Arabia.
Cross-Sectional study was used with 190 subjects (139 females and 51
males) selected randomly and they have essential hypertension, for at least
one year. Trained interviewers using a structured questionnaire interviewed

46
patients. Compliance was measured by two methods. The first was the
therapeutic outcome method where diastolic blood pressure of < 90 mmHg
was considered indicative of compliance with treatment and the second was
the self-reporting method. The result was a positive family history of
hypertension was found in 94 (49.5%) of the patients. Some 58.9% had other
chronic diseases, and 78.9% were managed on one anti hypertensive drug,
while the rest were using two or more drugs. Cigarette smoking was prevalent
in 7.9% of all patients. On the other hand, the self-reporting method revealed
that 142 (74.7%) were compliant. The compliance rate was significantly higher
among illiterate patients than educated ones and among patients over 55
years of age than those who were younger. There was no significant
difference in compliance rates between males and females, nor between
Saudis and non- Saudis. Patients who were regular on follow-up (82.1%) had
a significantly higher compliance rate than those who were irregular (37.8%
and 17.6% respectively; P<0.02). The presence or absence of difficulty with
compliance, availability of continuity of care, preference for place of care,
number of drugs taken for hypertension, mode of diagnosis of hypertension
and presence or absence of other chronic disease did not significantly affect
the compliance rate. Less than half (41.6%) of patients thought that
hypertension could have a permanent cure and 43.7% that medications could
be stopped once control was achieved. 40.0% of patients thought that
females were more susceptible than males and 56.3% thought that elderly
people were more likely to suffer from the disease than younger ones. Almost
two-third of the patients (66.3%) thought that the main etiologically factor for
hypertension was emotional stress, while only 1.6% acknowledges the role of

47
heredity in causing the disease. About one-third of the patients (31.6%) did
not know the complications of hypertension, while 42.1% knew that it might
lead to neurological complications and 1.6% were aware that the disease
might lead to renal complications. The opinions of the patients reflect poor
management of the disease among the sample studied. The result clearly
reveal the importance of regular follow-up in achieving better compliance,
emphasizing the need for health education to enforce this habit. The
relationship between patient misconceptions about the disease and poor
compliance has been documented. In this regard, our results revealed that a
considerable proportion of the patients had misconception about the treatment
of hypertension, such as believing in a permanent cure for essential
hypertension and discontinuation of drugs once control is achieved. Since
these misconceptions have a considerable impact on compliance, it is
imperative that primary health care physicians correct them through
education. Furthermore, many patients believe that emotional stress is an
important etiological factor for hypertension and are ignorant of other
contributing factors that can be corrected, such as excessive salt intake and
obesity. Although the frequency of positive family history of hypertension was
high (49%) among the sample, only 2% of patients were aware of the role of
heredity in the etiology of the disease. These findings emphasize the
important role of primary health care physicians in educating patients about
hypertension [110].

48
5.3. Seasonal pattern and stroke
The existence of a seasonal pattern in the occurrence of stroke remains
controversial. Schievink et al. reported in 1995 no evidence and relationship
between stroke development and seasonal variation [111], but Alter et al.
Showed that the highest stroke incidence rates occurring during autumn [112].
Giroud et al. reported in his article about stroke in a French prospective
population-based study that the highest rate of stroke incidence rates occurs
during winter [113]. There is a study conducted about the association between
stroke incidence and season of the year among 72,779 Veterans, who had
stroke at any of the 172 Veteran Affairs Medical Facilities in the United States
between the periods of October1, 1986 to September 30, 1995. These
subjects have either hemorrhagic or an ischemic stroke, their mean age was
66 years, approximately 70 percent of the subjects was Caucasian, 24
percent was African American, 4 percent was Hispanic, and the other 20
percent from other ethnic group. The stroke was defined by a clinically
modified version of the International Classification of Diseases. The
researchers used a longitudinal study design and the data was analyzed by
using time series methods to determine the nation wide incidence for both
ischemic and hemorrhagic strokes separately. The results of the study
showed that, there was a clear evidence of seasonal effect in the occurrence
of ischemic stroke, while there is no effect in hemorrhagic stroke [114].

49
5.4. Quality of life
The major consequence of post stroke, which leads to a decrease in quality of
life and patient's sense of loss, is body image disturbance and change in
patient's role. In addition, the side effect of medications such as
antidepressant, anti-cholinergic, and anti-adrenergic agents affect the stroke
patients and lead to sexuality dysfunction such as erection and ejaculatory
problems [62]. Quality of life is very important and it is considered as the key
concept in the contemporary practice of medicine, and delivery of health care
[115, 54, 116, 117]. As a health care provider, we are concerned about the
quality of life (satisfaction and happiness) among patients with chronic
diseases especially hypertension, which are in need to be compliant to some
types of therapeutic regimen for along period of time [115]. One of the most
important barriers that prevent blood pressure control is the side effect of anti
hypertensive medication such as fatigue, dizziness, and sexual dysfunction,
which in turn impaired patient's activity of daily living and quality of life
[118,119,120]. Sexual dysfunction has a high prevalence among hypertensive
men. As sexual function is considered as an important aspect of quality of life
among hypertensive patients, it is important to ensure that the anti
hypertensive drugs have the lowest effect for causing sexual problems. It is
essential to maintain balance between therapeutic efficacy and quality of life
to maintain the compliance to the therapeutic regimen [121].
Another study showed, sexual dysfunction among hypertensive men and
women is usually not caused by compliance to hypertensive drug therapy, but
it is likely due to other factors such as vascular disease [122]. Nearly half of

50
the hypertensive patients are not compliant; however, if we want to improve
therapeutic compliance, we should prevent potential harmful effects of anti
hypertensive medication. A meta-analysis of well-selected and comparable
trials has shown that anti hypertensive medication as a whole has a positive
impact on patient's quality of life [123]. Stein et al. showed that quality of life
among hypertensive patients was judged significantly higher in comparison
with normotensive persons [124]. Grimm et al. showed in a study with
probands suffering from mild hypertension that compliance to anti
hypertensive medication do not impaired the quality of life among mild
hypertensive patients, but it improves the quality of life by reducing blood
pressure [125]. Other study showed that anti hypertensive drug are reduce the
quality of life among hypertensive patients [126]. Life style changes especially
weight loss, play an important role in decreasing the signs and symptoms of
hypertension, which in turn lead to long term benefit and improve patient's
quality of life [127]. Grimm et al. showed that not only weight loss is
associated with an improvement in quality of life among hypertensive patients,
but also a physical activity as well [125]. The main goal of treating
hypertensive patients was to maintain or reduce the blood pressure within
normal range without looking to the other aspects of patient's lives. Other
studies and aims should be taken into consideration to understand the impact
and effect of compliance to the therapeutic regimen, mainly anti-hypertensive
medication, which may result in lower patient's quality of life [123].
51
5.5. Summary of the literature review
Hypertension is a major risk factor for ischemic and hemorrhagic stroke, and
modern anti-hypertensive treatment is one of the major benefits afforded for
stroke prevention. Several epidemiological studies indicate that the frequency
of stroke in hypertension is increased considerably as compared with
normotensive persons. In addition, correlation was found between blood
pressure, both systolic and diastolic, and the incidence of stroke. Other
studies has demonstrated that there is no relation between blood pressure,
and the incidence of stroke at low pressure levels, but an exponential increase
of stroke at high pressure levels. Also several studies conducted in different
parts of the world have confirmed that hypertension is the most important
modifiable risk factor for stroke. The foregoing literature review highlights the
importance of behavioral factors in the management of hypertension. Much
less work has been carried out on the interaction between lack of compliance
with the therapeutic regimen such as anti-hypertensive medication, dietary
restrictions of sodium, weight reduction, exercise program, follow up health
care, and smoking and development of stroke. The behavioral factors play a
major role in the development of hypertension and stroke. Several
epidemiological studies showed that people who are slim, physically active,
and eat low salt diet have lower blood pressure and low incidence rate of
stroke compared with obese and inactive people.
Clinical trials have provided a firm knowledge base for controlling
hypertension to achieve substantial public health benefits. The effectiveness
of pharmacologic treatment in reducing systolic and diastolic hypertension is

52
well established, which shows a major reduction in the risk of cerebrovascular
morbidity and mortality, especially for stroke. Dietary salt restriction is very
important and it is included in all national and international guidelines for
treating hypertension as part of a non-pharmacological strategy. The
INTERSALT study provides a positive data on the relationship between salt
and blood pressure. In contrast, other studies showed a weakly positive
correlation between blood pressure and sodium intake when adjusted for body
mass index and alcohol consumption. Also hypertension scarcely exists in
populations with extremely high salt intake compared with low salt intake.
Exercise is an important non-pharmacological tool in both prevention and
treatment of mild to moderate hypertension. Aerobic exercise had been found
to be effective in lowering blood pressure among hypertensive individuals.
Studies have shown that in sedentary patients with mild to moderate
hypertension, regular exercise has resulted in long term lowering of blood
pressure. Bicycling, jogging, swimming, and brisk walking are all acceptable
forms of exercise, depending on patient tolerance. Long-term physical activity
can result in blood pressure reduction, and it appears to have a greater effect
on blood pressure in hypertensive than normotensive. In contrast other
studies showed that, increased levels of physical activity were protective
among men, but not a protective significant among women.
Obesity is a problem that requires serious attention in patients with
hypertension. Many studies have demonstrated that weight loss is associated
with decrease levels of blood pressure, and the association between obesity
and hypertension has been well recognized and documented in many studies,
53
but controversy has surrounded among the location (such as abdominal
obesity, increased waist to hip ratio), and distribution of fat and development
of hypertension. Smoking is an independent risk factor for both cerebral
hemorrhage and cerebral infarction. The risk of stroke has been found to
increase as the number of cigarettes smoked increases. Stop smoking, or at
least reducing the number of cigarettes smoked per day, is therefore strongly
indicated for the patient with hypertension. The association of smoking and
stroke is evident and many studies reported that smoking cessation
significantly reduced the excess risk attributed to stroke. Epidemiological
studies showed a correlation between frequency of follow-up health care, and
compliance with the therapeutic regimen, and patients who were regular on
follow-up had a significantly higher compliance rate than those who were
irregular. On the other hand, some studies have mentioned the importance of
follow-up care in improving the compliance with the therapeutic regimen, and
they show how the termination of follow-ups decreases the compliance. The
existence of a seasonal pattern in the occurrence of stroke remains
controversial. Several investigations conducted in different countries report an
association, and identify the highest stroke incidence rates as occurring during
autumn, while others find that the highest rates occurring either in winter or in
spring, however, other investigations find no evidence. Many epidemiological
studies showed that compliance to ant-hypertensive medication impaired
patient's activity of daily living, and quality of life. In contrast, other studies
showed that anti-hypertensive medication as a whole has a positive impact on
patients’ quality of life, and sexual dysfunction, and impaired quality of life is

54
usually not caused by compliance to anti-hypertensive drug therapy, but it is
likely due to other factors such as vascular disease.

55
Chapter 6
Research problems, aims and objectives
In light of the background and introduction to the present research (chap.1, 2,
3, 4 and 5), this chapter formulates the research study problems, aims,
objectives, and hypotheses.
6.1 Statement of purpose
The main purpose of this study is to examine the association between non-
compliance with the therapeutic regimen and development of stroke among
hypertensive patients in Gaza Strip.
6.2. Study Hypotheses
The operation research can be broken down into four hypotheses
6.2.1. Null hypothesis (statistical hypothesis)
There is no relationship between non-compliance with the therapeutic regimen
and development of stroke among hypertensive patients in Gaza Strip.
6.2.2. Alternative hypothesis
Hypertensive patients who developed stroke are less likely to be compliant
with the therapeutic regimen than the hypertensive patients who did not
develop stroke.

56
6.2.3. Null hypothesis (statistical hypothesis)
There is no relationship between non-compliance with the therapeutic regimen
and quality of life among hypertensive patients.
6.2.4. Alternative hypothesis
Hypertensive patients who are more compliant with the therapeutic regimen
show greater increase in quality of life than those who are less compliant
6.3. Research questions
1. Does non-compliance with the therapeutic regimen affect the
development of stroke among hypertensive patients?
2. What are the risk factors associated with the development of stroke
among hypertensive patients?
3. What are the differences in quality of life among hypertensive patients
in terms of compliance and non-compliance with the therapeutic
regimen?
4. Does seasonal pattern affect the occurrence of stroke?

57
6.4 Aims and objectives
The study described in this thesis aims: first, to understand the relationship
between non-compliance with the therapeutic regimen and development of
stroke among hypertensive patients in Gaza Strip; second, to provide reliable
information that help in improving the quality of life among hypertensive
patients.
The study was undertaken to achieve the following four objectives:
1. To ascertain whether an association exists between non-compliance with
the therapeutic regimen / life style (anti-hypertensive medication, dietary
restrictions of sodium, weight reduction, exercise program, follow-up health
care, and smoking), and development of stroke among hypertensive patients.
2. To determine the risk factors which contribute to the development of stroke.
3. To evaluate the differences in quality of life among patients with stroke and
history of hypertension (case group), and hypertensive patients without stroke
(control group) one year before the study.
4. To assess the existence of seasonal pattern with the occurrence of stroke.

58
6.5. Definition of the terms
In the present study, the definitions of the following terms were applied:
Compliance “The extent to which patients follows medical advice” [52].
Stroke A registered hypertensive patient without history of other diseases,
who has a sudden loss of brain function and treated by therapeutic regimen
for more than one year before stroke onset, and the diagnosis of stroke
confirmed by physician and computed tomography scan.
Hypertension A registered hypertensive patient without history of other
diseases, who has an elevated blood pressure confirmed by physician and
treated by therapeutic regimen for more than one year.
Quality of life “A sense of personal satisfaction with the areas of life that is
more than just pleasure or happiness” [53]. According to Lerner, and Grant
(1994 and 1998) these areas are categorized into many dimensions: physical
function, sexual, cognitive, sensory, energy, mental health, social activity,
spiritual, and role function [54, 55].
Therapeutic regimen “A plan that deals with different methods of treatment
and healing, particularly the use of drugs, diet restrictions, weight loss or
reduction, exercise program, and follow-up health care in the cure of disease”
[56].

59
Chapter 7
Methodology of the study
This chapter presents the study design, period of the study, ethical
considerations, setting, study population, sample and sampling method,
exclusion criteria, instruments, anthropometric measurement scale,
constraints and limitations of the study, and analysis. A greater understanding
of the study methodology in stroke research may help or develop a critically
balanced review of the substantive content of the growing body of stroke
literature. Two major components were emphasized during this study: (1) the
information from population-based stroke data was summarized and
interpreted in a meaningful way; and (2) the case control study was used to
understand compliance with the therapeutic regimen, risk factors, seasonal
pattern, and development of stroke.
7.1. Study design
For the purpose of the present research, a paired matched case-control study
design was used in which some present phenomena were linked with other
phenomena that occurred in the past [170]. This design is a common and an
important method to study etiology and clinical questions. It is sometimes
referred to as a retrospective study because data on the factor of interest are
collected retrospectively, and used to investigate factors that may prevent or
cause disease. The method involves two groups, the cases (patients), and the
controls (comparison), which did not have the disease. Patients with stroke
and history of hypertension were selected for comparison with hypertensive
patients without stroke. The comparison was aimed to assess factors that may

60
differ in both the case and control groups, and to clarify the risk factors
associated with each factor individually, and in combination.
7.2. Period of the study
The study started in 1 January and ended 31st of December in 2001, including
administrative preparations such as permission from the Ministry of Health,
and ethical approval (appendix No.2).
7.3. Setting
This study conducted at the three main governmental hospitals in Gaza Strip,
which are AL-Shefa, Khan-Younis (Nasser), and European hospitals, and the
primary health care centers where the subjects with stroke and history of
hypertension used to make a follow-up health care before developing stroke.
These primary health care clinics are (Shohda Jabalia, Shohda Beit Lahia,
Shohda El-Rimal, Sorane, Deir-El-balah, El-Magazie, Shohda khan-younis,
and Shohda Rafah health centers). Interviewing subjects took place in the
hospitals, primary health care centers (clinic), and at home. The provinces of
Gaza Strip are (North, Gaza, Mid Zone, Khan-Younis, and Rafah). According
to 1997 census, the population in Gaza Strip is estimated to be 1,000,175
inhabitants. More than 16% of the population resides in the north of Gaza,
52% in the central area and the people in both areas are mainly treated at
Shefa hospital. Thirty-two percent of the population resides in the southern
area and they are mainly treated at Khan-Younis (Nasser) and European
hospitals [10].

61
7.4. Study population
The study population is the entire aggregation of cases that meet designated
set of criteria, in this study; the population consists of two groups: mainly a
sample of case group who had stroke and history of hypertension, and
another sample of control group who had hypertension without stroke. The
mean age was 55 years (standard deviation 6.6). The sample was restricted
to those aged 40-69 years to focus on the groups at greatest risk for stroke.
Fifty-eight percent of the participants were from Shefa Hospital, sixteen
percent from Nasser Hospital, and twenty six percent from European Hospital.
There were no differences between male and female participants in the case
group in comparison with the control group regarding age, sex, period of
duration of the therapeutic regimen, and enrollment location.
7.5. Sample and sampling method
Three different teams collected the data simultaneously over a three months
period. Prior to data collection process, the instruments were piloted to
examine the research tools in terms of acceptability, applicability, and the time
frame. All available discharge data of patients from the Disease Registry
Office, and the three main hospitals in Gaza Strip (Shefa, Nasser (Khan-
Younis), and European Hospital) were screened for cases. Patients who had
been hospitalized for acute stroke and history of hypertension between 1st
January and 31st December 2001 were defined as cases.
62
A non-probability purposive sampling methods was used to select subjects for
the study. Matching, homogeneity, and blocking were used to control
extraneous variables. The sample size was determined by the number of
patients fulfilling the inclusion criteria for cases during the sampling period in
2001. According to the paired 1:2 matching procedures, a certain number of
controls were recruited. The case group included 112 subjects (58 men and
54 women) with stroke and history of hypertension only. The control group
consisted of 224 subjects (116 men and 108 women) matched with age, sex,
period of duration with the therapeutic regimen, enrolment location, and with
single history of hypertension (no other physical disease). The control group
was selected from the same places, where the cases subjects used to make a
follow-up in the primary health care centers before the development of stroke.
These primary health centers are (Shohda Jabalia, Shohda Beit Lahia,
Shohda El-Rimal, Sorane, Deir-El-balah, El-Magazie, Shohda khan-younis,
and Shohda Rafah health centers). This type of control selection is called non-
hospitalized community, geographic area, community controls or population
controls from which the cases arose [128, 129]. Subjects in both groups, who
were over 69 years old, deaths, with history of other diseases for an elevated
risk for the development of stroke (e.g. diabetes, myocardial infarction, atrial
fibrillation, pulmonary edema, asthma), with the duration of their therapeutic
regimen less than one year, with second attack of stroke, and without
computed tomography scan were excluded from the study.

63
7.6. Exclusion criteria
The total number of cases was 180 subjects with stroke and history of
hypertension (107 from Shefa, 34 from Khan-Younis (Nasser), and 39 from
European hospital) during the sampling period 1st January and 31st December
2001. Sixty-eight patients were excluded from the study, seven subjects over
69 years old, 19 death, 7 did not have computed tomography scan of the
head, 4 refused to participate in the study, 18 had a second attack of stroke, 3
subjects started their therapeutic regimen less than one year, and 10 subjects
participated in the pilot study. The main reason for exclusion of the subjects,
who participated in the pilot study, was to prevent both interviewer and
respondent bias due to asking, and repeating the same questionnaire. In
addition, we asked the subjects about their reactions and impressions
regarding the questionnaire. The exclusion criteria for the cases applied to the
controls as well subsequently to the matching process. According to
Palestinian Central Bureau of Statistics (PCBS) the average life expectancy of
the Palestinian population is 71.82 in the year of 2000, because of that I
choose the age span between the ages of 40-69 years [130], In addition,
these subjects between this age group are at risk for development of stroke.
7.7. Data collection
Face to face structured interviews were used by trained interviewers to collect
data from both family and patients especially in stroke patients (case group),
who were unable to communicate verbally with the interviewers. The interview
was done in three settings, which are hospitals, primary health centers, and at
home. Arrangements of data collection started on 1st of January until 31st of

64
December 2001. The trained interviewers explained to the subjects in both
groups about the important, aim, and purposes of the research study. We are
living in a conservative society with some private ethics, moral, and rules, so a
qualified female who had knowledge and experience assisted the researcher
during data collection especially with the female subjects.
7.8. Questionnaire
Using a questionnaire is by far the quickest, cheapest, and relatively
confidential method of collecting large amounts of information in social and
health research. In addition, it is efficient in the measurement of concepts and
construct as quality of life. A structured interview (closed ended questions)
was used in this study to provide opportunity to the respondents to seek
clarification by helping them, where necessary, and to understand the
question well. Also all the questions are ideally asked in the same way during
the data collection to achieve a high degree of validity and reliability. The
instrument in this operational research included four parts. We developed the
first part ourselves, which deals with personal data, medical, socio-economic
status, and knowledge and misconception of disease. The second part, which
deals with compliance to the therapeutic regimen, has been taken from
Medical-Surgical Nursing Textbook with modifications [3]. The third one, which
deals with psychological and environmental stressors, has been taken partly
from SCL-90-R (Psychosomatic questionnaire) [131], and the fourth part
(quality of life) of the questionnaire was adopted from the World Health
Organization (WHO) short version with some modifications [132].

65
Certified translations of the questionnaires from German into Arabic language,
and from English into Arabic language were carried out, and the translation
was performed twice independently and the results were checked for
inconsistencies.
Testing the instrument a small-scale feasibility study (pilot study) was done by
using a small sample consisting of 10 cases of stroke with history of
hypertension (5 males and 5 females), and 20 patients as a control group.
This gave us a fair idea about the length of the questionnaire, and whether all
the respondents understand the questions in the same way. In addition, the
pilot study was important for directing and guiding the qualified interviewers to
adjust, and improve performance in data collection. The questionnaire
included issues about personnel information (age, sex, address, marital
status, number of children, weight, and height). In addition, it included medical
information, socio-economic information, compliance with the therapeutic
regimen (Anti-hypertensive medication, dietary restrictions of sodium and fat,
weight reduction, exercise program, follow-up health care, and smoking),
knowledge and misconception of disease and quality of life questionnaire,
which included issues about satisfaction, happiness, and several aspect of
daily life.
Some changes were done after the collection and the pre-test results
regarding the length of the instrument. To enhance the validity of the
instrument, tests for face and content validity were carried out, and the
questionnaire was submitted to experts and knowledgeable persons to make

66
suggestions for the adequacy and relevance of the questions. The main
reasons for validity tests are to ensure the instrument answers the research
questions, and adequately represent the different aspects of the issues being
studied. To enhance the reliability of the instrument, ''test-re-test'' was done
and the questionnaire administered to a small sample consisting of 10 cases
of stroke with history of hypertension (5 males and 5 females), and 20 patients
as a control group. After three weeks, the same questionnaire was re-
administered to the same group and the result showed similar answers and
responses. The main reason for reliability test is to ensure the questions clear
and unambiguous, and all respondents interpret the instructions given by the
same way.
Rational for using World Health Organization Quality Of Life (WHOQOL)
questionnaire
1. Designed to be a universal instrument to measure the quality of life and
used throughout the world in order to facilitate the translation and adaptation
procedures [133, 54, 134].
2. It included health as a major component and it had many dimensions such
as physical function (activity of daily living), sexual, cognitive, sensory, energy,
mental health, social activity, spiritual and role function [54, 55].

67
7.9. Anthropometric assessment
Height (in meters) and current weight (in kilograms) have been taken from
patients files and self reported during the interviews. Body mass index (BMI)
was calculated as weight divided by height squared (weight (kg)/height (m²)
[135, 136, 171, 172, 173, 174]. The validity of the anthropometric
measurements was assessed during the small-scale feasibility study (pilot
test). Table 2 shows the classification of the degree of obesity (BMI) by
Garrow ,1981, and Webster, 1985.
Table (2): Body Mass Index
Degree of obesity Value index Comprehensive
Zero (0) 20.0 -24.9 Acceptable
1 25 –29.9 Overweight
11 30 –40 Obesity
111 Over 40 Sever obesity
(Garrow, 1981, and Webster, 1985)
7.10. Constraints and limitations of the study We faced many difficulties during the collection of data, but the main
constraints of this study was due to political situation such as the border are
mostly closed between the area of Gaza Strip, and it was difficult to pass from
one area to another to do the interviews with the patients. In addition, lack of
arrangement of discharge papers, and limited resources are other constraints.
Some of the patients were living near the settlements, and it was dangerous
for the interviewers to be near these places. Some of the family and patients
were not cooperative, due to political situation. There is a little information
about the morbidity rate among the governmental hospital in Gaza strip, and
68
there were some cultural constraints regarding the permission to enter the
house. Other limitations were some of the patients refused to participate in the
study, did not have computed tomography scan due to economical or
technical problems.
7.11. Ethical considerations
Patients were asked to give informed consent, which permitted the
researchers to review the previous patient’s records. Before the interview, the
researcher emphasized the confidentiality of the study, and all subjects in both
groups had an opportunity to accept or refuse to participate in the study.
7.12. Data analysis
Data and calculations were assessed using SPSS statistical system [137],
and SAS procedure PHREG [138]. Descriptive statistic and frequency
distributions were generated to make a comparison between case group with
stroke and history of hypertension and control group with history of
hypertension regarding compliance with the therapeutic regimen, and
seasonal pattern and development of stroke. A conditional logistic regression
analysis was used to determine the risk factors, which contribute to the
development of stroke (Medication not taken as prescribed, using excessive
salt at meals, eating diet high in fat, involvement in a regular program of
exercise, smoking, and high level of stress) as independent variables and
development of stroke as dependent variable. This model is an important
analytical techniques, which used to determine how likely the observed
response is with respect to all possible responses [175, 176]. Also to obtain

69
conditional logistic regression estimates for 1:m and n:m matched studies
using SAS, the PROC PHREG procedure should be used. The most essential
step in using PROC PHREG is the variables representing cases and controls
must be redefined or a new variable is created [177]. In addition, the same
model was used to determine the interaction between high-level of stress and
using excessive salt in meals, and smoking and development of stroke.
Analysis of variance (ANOVA) was used to evaluate the differences in quality
of life among case, and control groups. It used to test the significance of
differences between means. The statistics computed in an ANOVA-procedure
is the F-ratio test, because the statistics is based on more than two groups
[178, 179].

70
Chapter 8
Results of the study
This chapter is the core of the study presenting the results of the work carried
out in Gaza Strip. Our study population composed of 112 individuals (case
group), and 224 subjects as a (control group). The mean age was 55 years
(standard deviation 6.6). Approximately 58 percent of the participants in the
case group were treated at Shefa hospital, 16 percent at Nasser hospital, and
26 percent at European hospital. The sources of results were by administered
a structured questionnaire (closed ended questions). Interviewing was done to
the patients and/or family, speaking with the team caring for the patient, and
reviewing the medical record in the department in which the patient was
hospitalized. Systematic reviews of documents in the medical record
departments, primary health centers and emergency wards of the hospitals
were made concomitantly to detect any missed cases. This chapter composed
of three parts. The first part provides descriptive statistic and frequency
distributions about the socio-demographic characteristic among the case and
control group. The second part focuses on the factors of compliance and non-
compliance with the therapeutic regimen, and the relationship between
seasonal pattern and development of stroke. The third part introduces the
percentages of quality of life among the case and control group.
8.1 Socio-demographic characteristics among the case and control groups
Socio-demographic and medical characteristic in this study composed of
several parts, such as age, gender, income diagnosis, weight, height,
treatment facilities, health care facilities, hospital, health centers, health care

71
programs, factors of compliance/non-compliance with the therapeutic regimen
and quality of life. Because hypertension is the most important risk factor in
the development of stroke [18], it is important to understand the relationship
between these socio-demographic variables, and health outcomes, including
quality of life in this disease.
8.1.1 Distribution of the study population by the name of hospital
Table 3 shows the distribution of the study population among the case group
in the three main governmental hospitals in Gaza strip. The study population
shows 58% of the participants were from Shefa hospital (the biggest hospital
in Gaza Strip), 16% from Nasser hospital, and 26% from European hospital.
Approximately 68 % of the population in Gaza Strip is treated at Shefa
hospital compared with 32 % treated at Nasser hospital and European
hospitals. Mainly people living in (Gaza North, Gaza City, and Mid Zone area)
are treated at Shefa hospital, and people who are living in Khan-Younis and
Rafah city are treated at Nasser and European hospitals.
Table (3): Distribution of the study population by the name of hospital among case group
The name of the hospital Frequency
(N) Valid percent
(%) Total
Shefa hospital 65 58.0 65 (58%)
Khan-Younis (Nasser) hospital 18 16.1 18 (16.1%)
European hospital 29 25.9 29 (25.9)
Total 112 100 112 (100%)

72
8.1.2 Distribution of the study population by location of health centers
among control group
As shown in table 4 the control group was selected from the same places,
where the case subjects used to make a follow-up in the primary health
centers before the development of stroke. These primary health centers are
Shohada Jabalia, Shohda Beit Lahia, Shohda El-Rimal, Sorane, Deir-El-
balah, El-Magazie (located in Gaza North, Gaza City, and Mid Zone area),
Shohda Khan-Younis, and Shohda Rafah health centers (located in Khan-
Younis, and Rafah city). This type of selection is called non-hospitalized
community, geographic area, community controls or population controls from
which the cases arose [128].
Table (4): Distribution of the study population by the location of health centers among control group
Location of the health centers
Frequency (N)
Valid Percent
(%) Total
Gaza North, Gaza City, and Mid- Zone Health centers 130 58.0 130 (58%)
Khan-Younis health center 36 16.1 36 (16.1%)
Rafah health center 58 25.9 58 (25.9%)
Total 224 100 112 (100%)
8.1.3 Frequency of the diagnosis among the case and control groups
Table 5 includes the frequency and percentage of the diagnosis in the case
and control groups. The diagnoses are summarized in two groups:

73
Hypertension and stroke 112 subjects (case group), and hypertension 224
subjects (control group).
Table (5): Distribution of the study population by diagnosis among the case and control groups
Diagnosis Frequency (N)
Percentage (%)
Hypertension and stroke (case group)
112
33.3
Hypertension (control group)
224
66.7
Total 336 100.0
8.1.4 Distribution of the study population by age
The study population shows 57% of the subjects among the case and control
groups were between the ages of 52-63 years, 24% between the ages of 64-
69 years, 16% between the ages of 46-51 years, and 3% between the ages of
40-45 years. Approximately two third of the patients among the case and
control groups were between the ages of 52-63 years.
Table (6): Age distribution of the study Population among the case and
control groups
Case group Control group
Age in years Frequency (N)
Valid percent(%)
Frequency
(N) Valid percent
(%) Total
40-45 3 2.7 6 2.7 9 (2.7%)
46-51 18 16.1 36 16.1 54 (16.1%)
52-57 32 28.6 64 28.6 96 (28.6%)
58-63 32 28.6 64 28.6 96 (28.6%)
64-69 27 24.1 54 24.1 81 (24.1%)
Total 112 100.0 224 100.0 336 (100%)
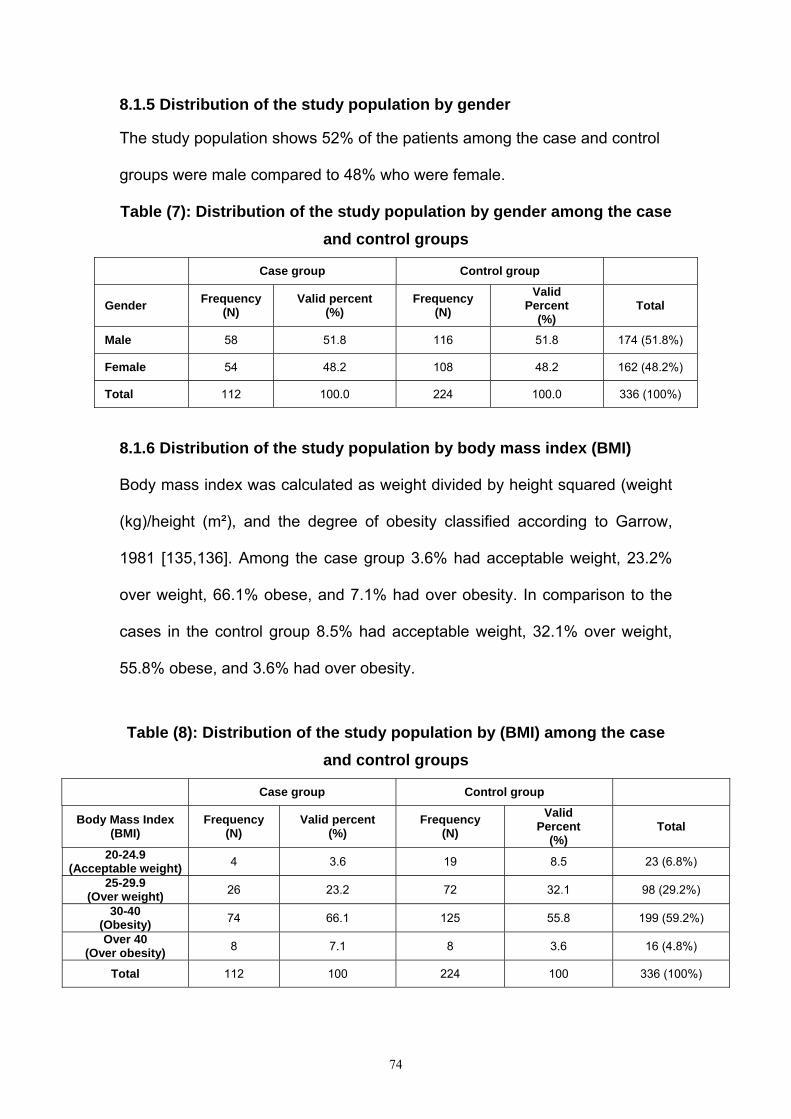
74
8.1.5 Distribution of the study population by gender The study population shows 52% of the patients among the case and control
groups were male compared to 48% who were female.
Table (7): Distribution of the study population by gender among the case and control groups
Case group Control group
Gender Frequency (N)
Valid percent (%)
Frequency (N)
Valid Percent
(%) Total
Male 58 51.8 116 51.8 174 (51.8%)
Female 54 48.2 108 48.2 162 (48.2%)
Total 112 100.0 224 100.0 336 (100%)
8.1.6 Distribution of the study population by body mass index (BMI)
Body mass index was calculated as weight divided by height squared (weight
(kg)/height (m²), and the degree of obesity classified according to Garrow,
1981 [135,136]. Among the case group 3.6% had acceptable weight, 23.2%
over weight, 66.1% obese, and 7.1% had over obesity. In comparison to the
cases in the control group 8.5% had acceptable weight, 32.1% over weight,
55.8% obese, and 3.6% had over obesity.
Table (8): Distribution of the study population by (BMI) among the case
and control groups
Case group Control group
Body Mass Index (BMI)
Frequency (N)
Valid percent (%)
Frequency (N)
Valid Percent
(%) Total
20-24.9 (Acceptable weight) 4 3.6 19 8.5 23 (6.8%)
25-29.9 (Over weight) 26 23.2 72 32.1 98 (29.2%)
30-40 (Obesity) 74 66.1 125 55.8 199 (59.2%)
Over 40 (Over obesity) 8 7.1 8 3.6 16 (4.8%)
Total 112 100 224 100 336 (100%)
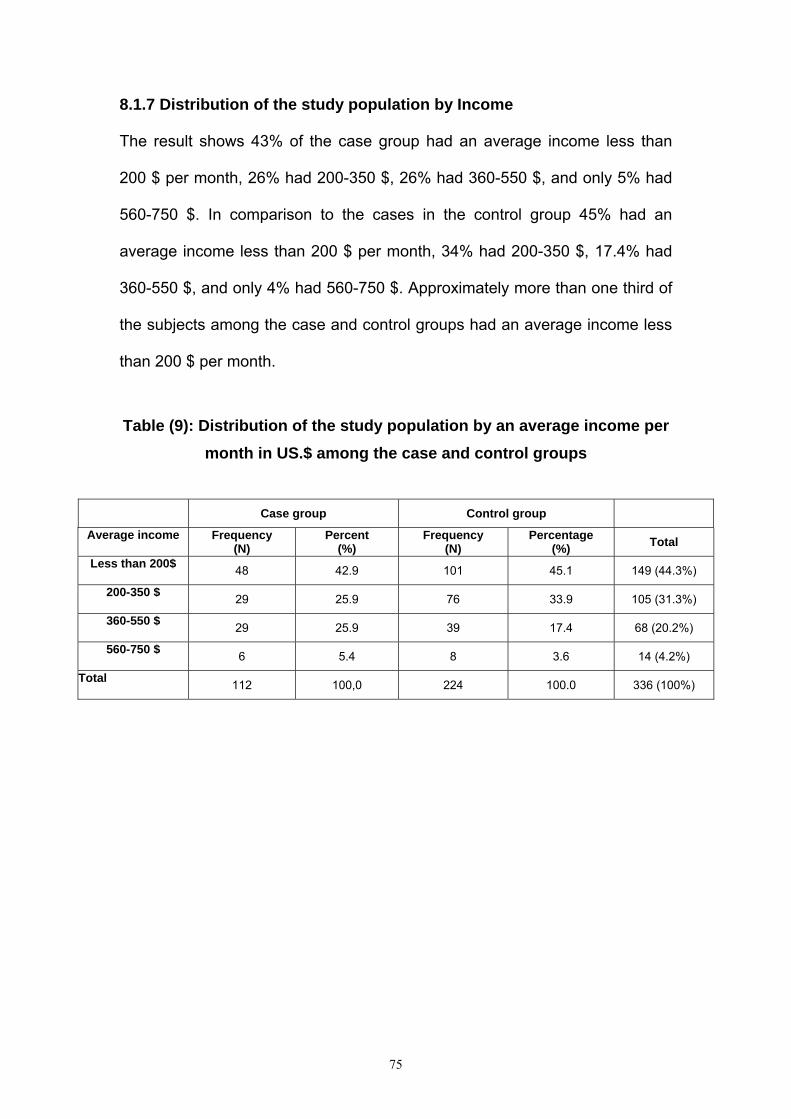
75
8.1.7 Distribution of the study population by Income
The result shows 43% of the case group had an average income less than
200 $ per month, 26% had 200-350 $, 26% had 360-550 $, and only 5% had
560-750 $. In comparison to the cases in the control group 45% had an
average income less than 200 $ per month, 34% had 200-350 $, 17.4% had
360-550 $, and only 4% had 560-750 $. Approximately more than one third of
the subjects among the case and control groups had an average income less
than 200 $ per month.
Table (9): Distribution of the study population by an average income per
month in US.$ among the case and control groups
Case group Control group
Average income Frequency (N)
Percent (%)
Frequency (N)
Percentage (%) Total
Less than 200$ 48 42.9 101 45.1 149 (44.3%)
200-350 $ 29 25.9 76 33.9 105 (31.3%)
360-550 $ 29 25.9 39 17.4 68 (20.2%)
560-750 $ 6 5.4 8 3.6 14 (4.2%)
Total 112 100,0 224 100.0 336 (100%)
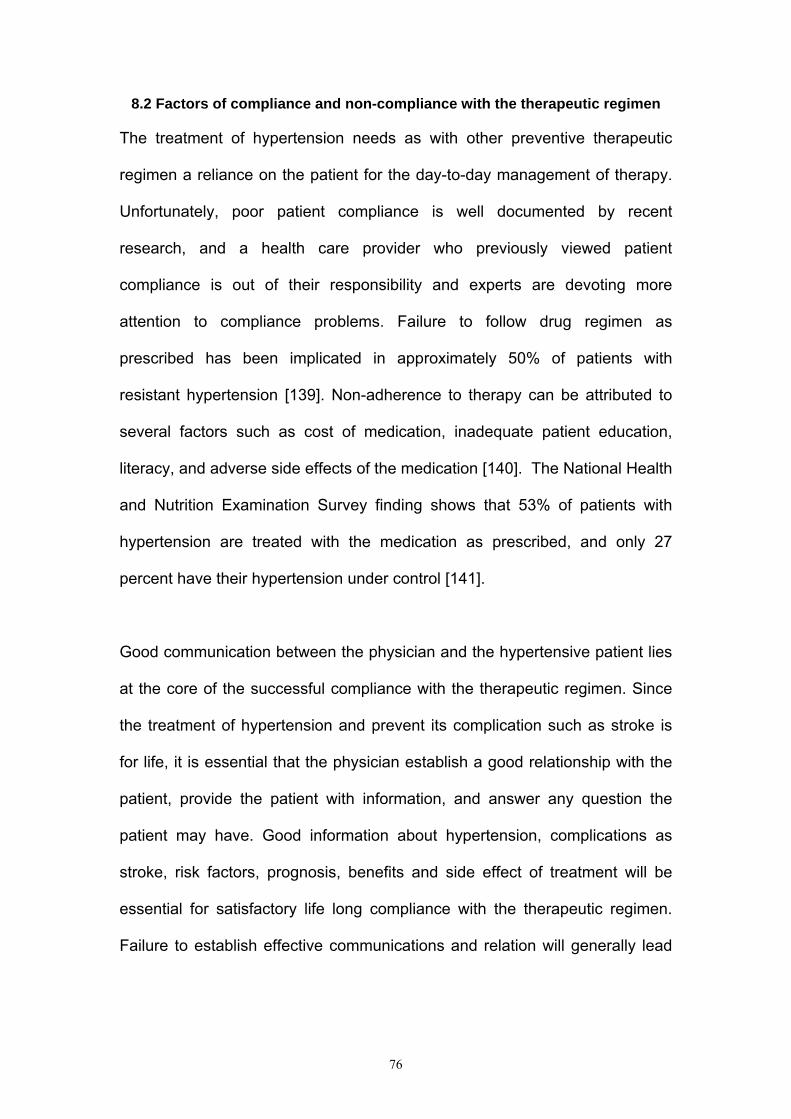
76
8.2 Factors of compliance and non-compliance with the therapeutic regimen
The treatment of hypertension needs as with other preventive therapeutic
regimen a reliance on the patient for the day-to-day management of therapy.
Unfortunately, poor patient compliance is well documented by recent
research, and a health care provider who previously viewed patient
compliance is out of their responsibility and experts are devoting more
attention to compliance problems. Failure to follow drug regimen as
prescribed has been implicated in approximately 50% of patients with
resistant hypertension [139]. Non-adherence to therapy can be attributed to
several factors such as cost of medication, inadequate patient education,
literacy, and adverse side effects of the medication [140]. The National Health
and Nutrition Examination Survey finding shows that 53% of patients with
hypertension are treated with the medication as prescribed, and only 27
percent have their hypertension under control [141].
Good communication between the physician and the hypertensive patient lies
at the core of the successful compliance with the therapeutic regimen. Since
the treatment of hypertension and prevent its complication such as stroke is
for life, it is essential that the physician establish a good relationship with the
patient, provide the patient with information, and answer any question the
patient may have. Good information about hypertension, complications as
stroke, risk factors, prognosis, benefits and side effect of treatment will be
essential for satisfactory life long compliance with the therapeutic regimen.
Failure to establish effective communications and relation will generally lead

77
to poor compliance with the therapeutic regimen, and unsatisfactory control of
the raised blood pressure [142].
Table 10 includes the frequencies of the factors of compliance and non-
compliance in the case and control group. The factors are summarized into 6
groups: anti-hypertensive medication, dietary restrictions of sodium and fat,
weight reduction, exercise program, follow-up health care, and smoking. The
patients in the case group showed a high percentage rate of compliance to
anti-hypertensive medication [taking the medication as prescribed (75.0%),
and at proper time (69.6%)], keeping follow-up clinic (62.5%), regular
measurement of blood pressure (54.5%), and not smoking (64.3%). This high
percentage rate of compliance to these factors in comparison to other
therapeutic regimen among case group could be culturally reasoned, because
the Palestinian community used to be lived in extended family, and every
member of the family tried to give the medication as prescribed and at proper
time or even an advice regarding the importance of follow-up, and stop
smoking to his mother or father.
In contrast to that the patients in case and control groups have shown low
percentage rate of compliance to weight reduction [case (3.6%), and control
(15.6%)], and exercise program [case (16.1%) and control (48.7%)]. This low
percentage rate of compliance to weight reduction and exercise program in
comparison to other therapeutic regimen could be due to unstable political
and economical situation in Gaza Strip. As shown in table 10 the patients in
control group with history of hypertension were more compliant with the

78
therapeutic regimen (anti hypertensive medication, dietary restrictions of
sodium and fat, weight reduction, exercise program, follow-up health care,
and smoking with the comparison of case group with stroke and history of
hypertension).
Table 10
Table (10): Frequency and percentages of the factors of compliance and non- compliance with the therapeutic regimen among the case and
control groups
Case group (N=112) Control group (N=224)
Therapeutic regimen (Life style)
Yes
(Compliance)
No
(Non- compliance)
Yes
(Compliance)
No (Non-compliance)
Anti-hypertensive medication
Taking the medication as prescribed 75.0% (N = 84) 25.0% (N= 28) 95.5% (N=214) 4.5% (N= 10)
Taking the medication at Proper time 69.6% (N = 78) 30.4% (N=34) 93.3% (N = 209) 6.7% (N = 15)
No running out of pills even for a single day 38.4% (N= 43) 61.6% (N = 69) 60.7% (N = 136) 39.3% (N= 88)
Dietary restrictions of sodium And fat
Not using excessive salt in Cooking or at meals 41.1% (N = 46) 58.9% (N = 66) 81.3% (N = 182) 18.8% (N = 42)
Family preparing a special low Low salt diet 33% (N = 37) 67% (N = 75) 51.8% (N= 116) 48.2% (N= 108)
Not eating diet high in fat 37.5% (N= 42) 62.5% (N= 70) 73.7% (N= 165) 26.3% (N = 59)
Weight reduction
Involvement in regular program of weight reduction 3.6% (N = 4) 96.4% (N = 108) 15.6% (N= 35) 84.4% (N= 189)
Exercise program
Involvement in regular program of exercise 16.1% (N = 18) 83.9% (N = 94) 48.7% (N = 109) 51.3% (N = 115)
Follow-up health care
Regular measurement of blood pressure 54.5% (N = 61) 45.5% (N = 51) 79% (N = 177) 21% (N= 47)
Keeping follow-up clinic or Physician appointment 62.5% (N = 70) 37.5% (N = 42) 83.5% (N = 187) 16.5% (N = 37)
Smoking
Not smoking 64.3% (N = 72) 35.7% (N = 40) 78.6%( N = 176) 21.4% (N = 48)

79
8.2.1 Taking the medication as prescribed among the case and control
groups
This diagram shows that both case and control groups are mainly complaint
as most families in Gaza Strip are extended, so patients will have family
members reminding them of taking the medication. On the other hand, we see
some variation, which could be due to political reason. As we know people in
Gaza Strip are living under sewage and very bad human circumstances.
Patients may not able to attain their medication at time.
Figure No. (3)
Taking the medication as prescribed
ControlCase
Perc
ent
100
90
80
70
60
50
40
30
20
10
0
Yes
No
9675
25
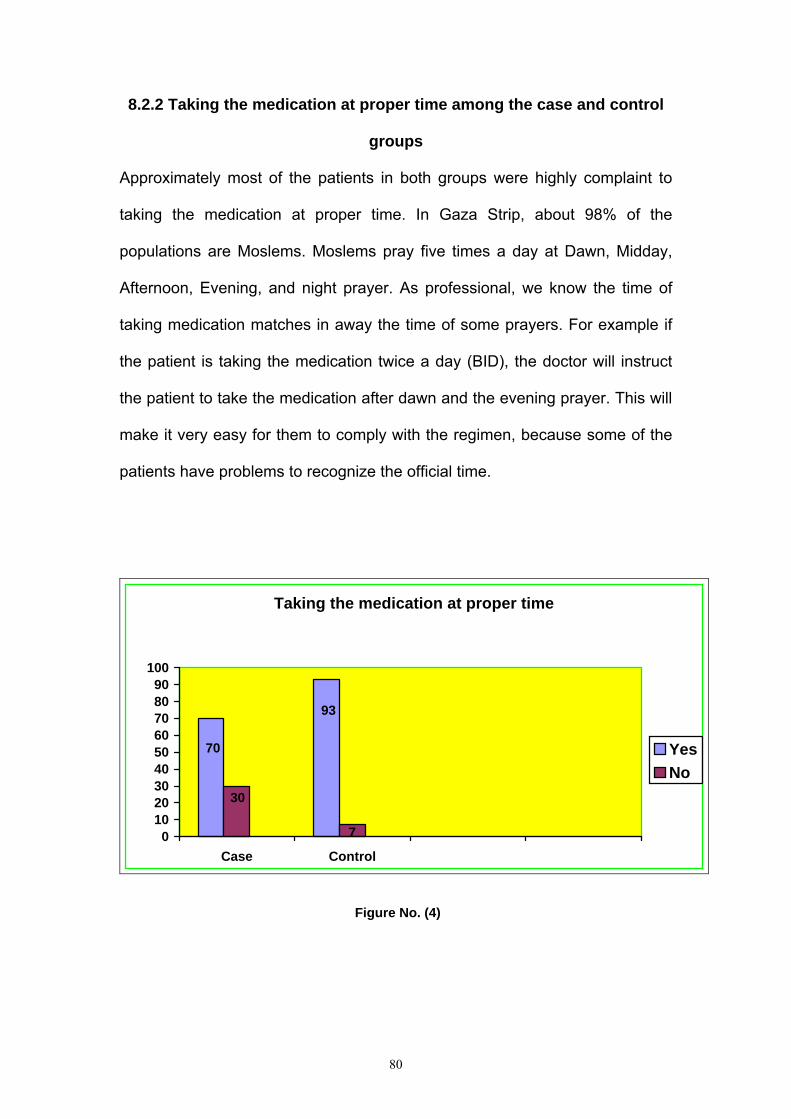
80
8.2.2 Taking the medication at proper time among the case and control
groups
Approximately most of the patients in both groups were highly complaint to
taking the medication at proper time. In Gaza Strip, about 98% of the
populations are Moslems. Moslems pray five times a day at Dawn, Midday,
Afternoon, Evening, and night prayer. As professional, we know the time of
taking medication matches in away the time of some prayers. For example if
the patient is taking the medication twice a day (BID), the doctor will instruct
the patient to take the medication after dawn and the evening prayer. This will
make it very easy for them to comply with the regimen, because some of the
patients have problems to recognize the official time.
Taking the medication at proper time
93
70
30
70102030405060708090
100
Case Control
YesNo
Figure No. (4)

81
8.2.3 No running out of pills even for a single day of the case and control
groups
Normally the chronic patient takes the medication from the governmental clinic
monthly. The medication in the clinics will be available for few days, and then
it will finish. Some patients take the whole amount of medication for the
month; other patients may not be able to reach the clinic at proper time to take
the whole amount of medication due to incursion and closure in their area.
These people may take two third of the amount which is not enough for the
whole month. On the other hand sixty one percent among the control group is
living in the same situation of the case group, but some of them are able to
buy the missing amount of medication and some of them are not under curfew
and can reach their clinic at time.
No running out of pills even for a single day
38
6162
39
010203040506070
Case Control
YesNo
Figure No. (5)

82
8.2.4 Not using excessive salt in cooking or at meals among the case and
control groups
Fourty one percent of the case group was compliant to not using excessive
salt in cooking or at meals and 59% showed non-compliant. In comparison to
the cases in the control group 81% was compliant and 19% non-compliant to
not using excessive salt in cooking or at meals. People of Gaza are known of
eating salty and spicy food even in comparison to people of west bank. The
low percentage of compliance rate among the case group is back to the way
the people used to cook, as low salt diet is not preferable, and ignorance and
carelessness as well. In the opposite side, we see the high compliance rate
among the control group, as these people may be more educated and aware
of the undesired outcomes of salty food.
41
59
81
19
0102030405060708090
Case Control
Not using excessive salt in cooking or at meals
YesNo
Figure No. (6)

83
8.2.5 Family preparing a special low salt diet among the case and control
groups
Families in Gaza Strip are extended and mostly over eight members in each
family. Our families used to eat together from the same types of food. As we
see, this is implemented obviously in figure No. (7), as almost two third of the
case group was non-complaint. Patients feel like abundant if they eat alone.
Emotionally they prefer to eat regular food with their family rather than eating
a special diet. Even in control group, almost half of it is non-complaint due to
the same reason. Another reason of non-compliance is lack of education
among family members, and patients.
Figure No. (7)
Family preparing a special low salt diet
ControlCase
Per
cent
100
90
80
70
60
50
40
30
20
10
0
Yes
No
5233
48
67

84
8.2.6 Not eating diet high in fat among the case and control groups
Although we have a high percentage of health education personnel in Gaza,
but these health practionners are not enough to educate the patients of the
danger of the high fat diet. Lack of health education and misconception of
knowledge among patients are playing a major role in non-compliance.
Patients may know that salty foods are not healthy for them, but they are
unaware of the dangers of fatty foods as it could lead to atherosclerosis,
which is the main predisposing factor of hypertension. Culturally it is
unacceptable to refuse any food served to you if you were invited to meal.
Some patients will feel embarrassed to refuse the foods served to them in any
occasion even if it is harmful to them in order to satisfy their friends and
relatives.
6226
3874
0
20
40
60
80
Case Control
Yes
No
Not eating diet high in fat
YesNo
Figure No. (8)
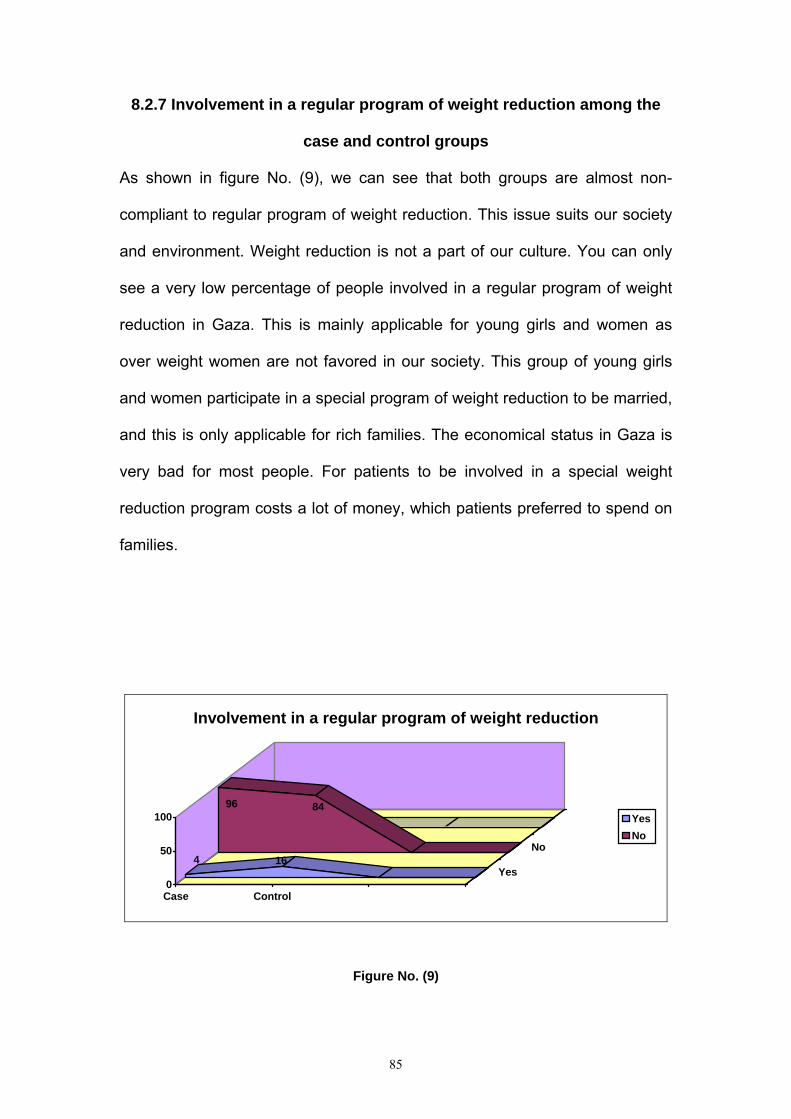
85
8.2.7 Involvement in a regular program of weight reduction among the
case and control groups
As shown in figure No. (9), we can see that both groups are almost non-
compliant to regular program of weight reduction. This issue suits our society
and environment. Weight reduction is not a part of our culture. You can only
see a very low percentage of people involved in a regular program of weight
reduction in Gaza. This is mainly applicable for young girls and women as
over weight women are not favored in our society. This group of young girls
and women participate in a special program of weight reduction to be married,
and this is only applicable for rich families. The economical status in Gaza is
very bad for most people. For patients to be involved in a special weight
reduction program costs a lot of money, which patients preferred to spend on
families.
96 84
4 16
0
50
100
Case Control
Yes
No
Involvement in a regular program of weight reduction
YesNo
Figure No. (9)
86
8.2.8 Involvement in a regular program of exercise among the case and
control groups
Most of the patients among the case group were non-compliant. We are living
in a conservative society with some private ethics, rules and moral. It is
strange and unacceptable to see people running in the street especially for
women and old people. There are no specialized centers (gymnasium) in
Gaza. Patients did not know that exercises are helpful in reducing systolic and
diastolic blood pressure. On the other hand, we can see that more than half of
the control group was non-complaint for the same reasons.
Figure No. (10)
Involvement in a regular program of exercise
ControlCase
Per
cent
100
90
80
70
60
50
40
30
20
10
0
Yes
No
4916
51
84

87
8.2.9 Regular measurement of blood pressure among the case and
control groups
Fifty four percent of the case group was compliant to regular measurement of
blood pressure and 46% showed non-compliant. In comparison to the cases
in the control group 79% was compliant and 21% showed non-compliant to
regular measurement of blood pressure. The high compliance rate among the
control group 79% in comparison to the case group 54% might be due to more
knowledge of the importance of regular measurement of blood pressure in
preventing hypertensive complications. More than half of both groups were
complaint in comparison to weight reduction and exercise program because it
is easy to measure blood pressure in the primary health clinic during the
follow-up visits, and blood pressure machines are available in our markets
with cheap price.
Figure No. (11)
Regular measurement of blood pressure
ControlCase
Per
cent
100
90
80
70
60
50
40
30
20
10
0
Yes
No
7954
21
46

88
8.2.10 Keeping follow-up clinic or physician appointment among the
case and control groups
The majority of patients in the two groups were complaint. Generally, we have
governmental clinics all over Gaza Strip. These clinics provide services and
medication freely for chronic patients. This high compliance rate present in
both groups is due to patients having to follow-up physician in order to take
medication. Keeping in mind the security situation is the reason for the non-
compliance rate of both groups. Most of the people in Gaza Strip did not visit
any clinic unless they have a problem; they do not do preventive check up as
in developed countries. Also the patients follow-up physician more when they
face any undesired side effect of medication especially impotence in order to
change their medication.
62
38
83
17
0102030405060708090
Case Control
Keeping follow-up clinic or physician appointment
YesNo
Figure No. (12)

89
8.2.11 Not smoking among the case and control groups
Approximately more than half of the study population showed compliance to
not smoking in both groups. The strange outcome shown in figure No. (13)
was amazing, because the Palestinian society is known to be a smoking
society. We must keep in mind that half of the sample was female patients,
and it is a strange and unacceptable for females to smoke in our culture. Also
the Palestinian society is a religious one, and smoking is considered to be a
sin and forbidden in Islam. This is mainly the reason for the low rate of non-
compliance in both groups.
79 21
62 38
0% 20% 40% 60% 80% 100%
Control
Case
Not smoking
Yes
No
Figure No. (13)

90
8.3 Seasonal pattern and occurrence of stroke among the case group
This study discusses the relationship between seasonal pattern and
development of stroke. Figure No. (14) shows time distribution of stroke
among the case group. Thirty three percent of the case group developed
stroke in wintertime, 28% in autumn, 24% in summer, and 15% in spring.
Approximately two-third of the subjects among the case group developed
stroke during winter and autumn time. As we know, the mentalities of
individual differ during the four seasons. In winter and autumn people are
more limited and isolated in their daily life activities, meanwhile in summer and
spring people tends to be more active and out going. When the sunrise the
people feel happy, optimistic, and more active, but at sunset, some people
have negative feelings like sadness, pessimistic, and depression. Figure No.
(40) shows that 91% among the case group was depressed, frustrated,
desperate, and anxious. This result matches with other previous studies that
found a significant association between increasing scores on the modified
version of the Center for Epidemiological Studies Depression Scale (CES-D)
and the incidence of stroke (RR=1.04;95% CI 1.01-1.09) [143]. Also Ohira et
al. showed that persons with Self-Rating Depression Scale (SDS) scores in
the high tertile had twice the age and sex adjusted relative risk of total stroke
as those with scores in the low tertile (RR= 1.9; 95% CI 1.1-3.5) [144].
As we see in figure No. (14), most of the cases developed stroke in winter
and autumn, which are known to be more depressive. In addition, this result
matched with other studies, which found an evidence relationship between
winter [113] and autumn [112] and development of stroke. However, other

91
investigations found no evidence supporting seasonal variation in stroke rates
[111]. In summer, we found that 24% of the cases developed stroke, this
might be due to exposure to stressful situations related to more activity during
day life, and high temperature and humidity. Stress increases blood pressure,
which in turn leads to developing of stroke as proven by other literatures [66,
3]. On the other hand, it differed with other literatures, which have reported
that there is little medical evidence that stress causes stroke [1].
15
2428
33
05
101520253035
Spring Summer Autumn Winter
Time of stroke development
Figure No. (14)
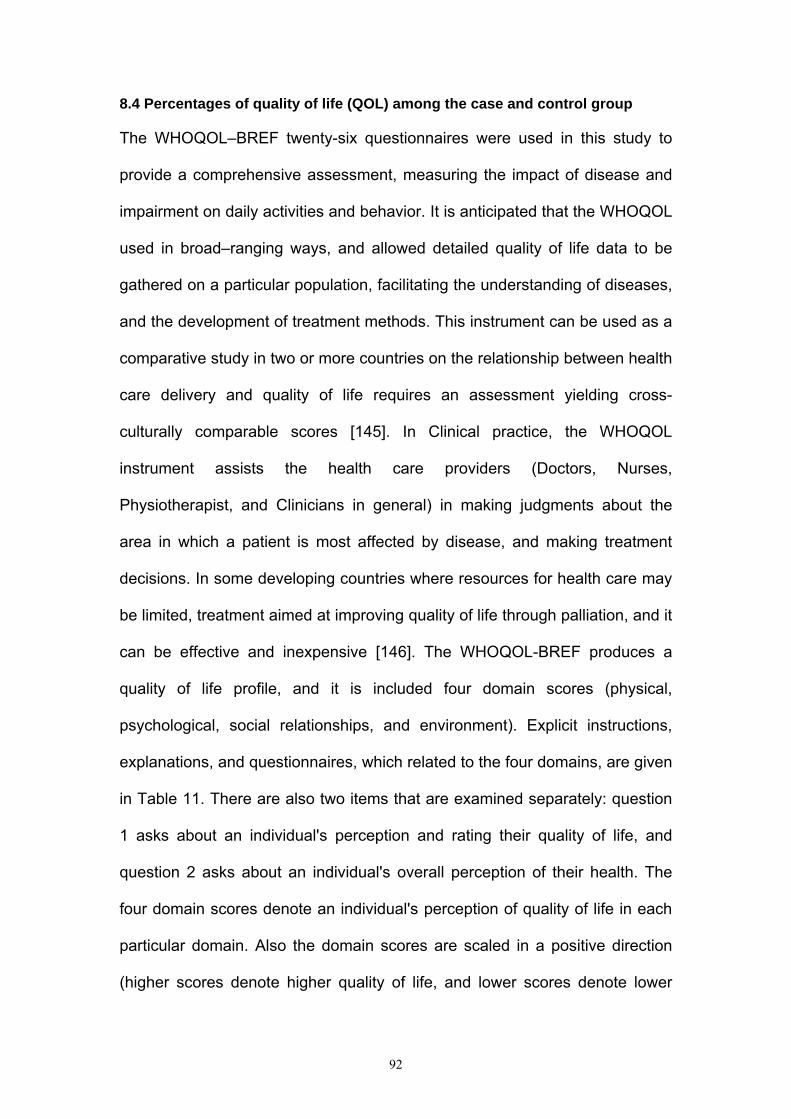
92
8.4 Percentages of quality of life (QOL) among the case and control group
The WHOQOL–BREF twenty-six questionnaires were used in this study to
provide a comprehensive assessment, measuring the impact of disease and
impairment on daily activities and behavior. It is anticipated that the WHOQOL
used in broad–ranging ways, and allowed detailed quality of life data to be
gathered on a particular population, facilitating the understanding of diseases,
and the development of treatment methods. This instrument can be used as a
comparative study in two or more countries on the relationship between health
care delivery and quality of life requires an assessment yielding cross-
culturally comparable scores [145]. In Clinical practice, the WHOQOL
instrument assists the health care providers (Doctors, Nurses,
Physiotherapist, and Clinicians in general) in making judgments about the
area in which a patient is most affected by disease, and making treatment
decisions. In some developing countries where resources for health care may
be limited, treatment aimed at improving quality of life through palliation, and it
can be effective and inexpensive [146]. The WHOQOL-BREF produces a
quality of life profile, and it is included four domain scores (physical,
psychological, social relationships, and environment). Explicit instructions,
explanations, and questionnaires, which related to the four domains, are given
in Table 11. There are also two items that are examined separately: question
1 asks about an individual's perception and rating their quality of life, and
question 2 asks about an individual's overall perception of their health. The
four domain scores denote an individual's perception of quality of life in each
particular domain. Also the domain scores are scaled in a positive direction
(higher scores denote higher quality of life, and lower scores denote lower

93
quality of life). The mean score of items within each domain is used to
calculate the domain score [145].
Table 11 Quality of life domains
Domain Facets incorporated within domains
1. Physical health a. Activities of daily living
b. Dependence on medicinal substances and medical aids
c. Energy and fatigue
d. Mobility
e. Pain and discomfort
f. Sleep and rest
g. Work capacity
2. Psychological a. Bodily image and appearance
b. Negative feeling
c. Positive feelings
d. Self-esteem
e. Spirituality/ Religion/ Personal beliefs
f. Thinking, learning, memory and concentration
3. Social relationships a. Personal relationships
b. Social support
c. Sexual activity
4. Environment a. Financial resources
b. Freedom, physical safety and security
c. Health and social care: accessibility and quality
d. Home environment
e. Opportunities for acquiring new information and skills
f. Participation in and opportunities for recreation/ leisure activities
g. Physical environment (pollution/ noise/ traffic/ climate)
h. Transport
(WHO, 1996)
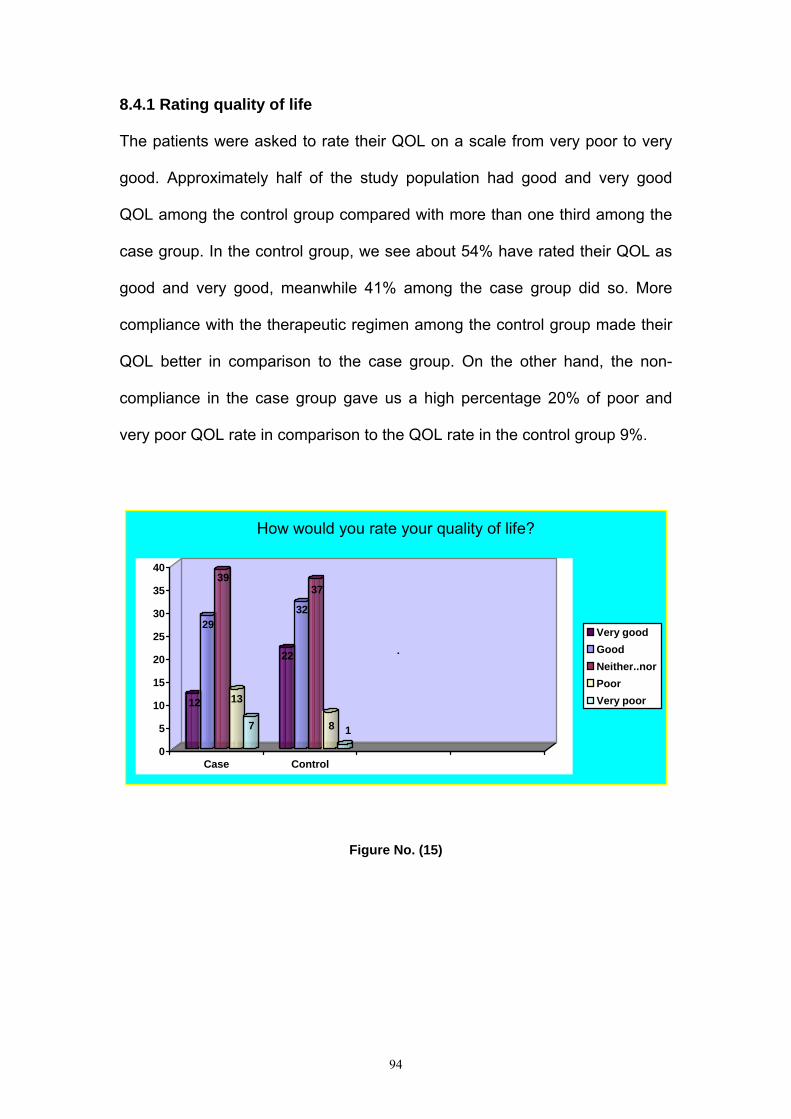
94
8.4.1 Rating quality of life
The patients were asked to rate their QOL on a scale from very poor to very
good. Approximately half of the study population had good and very good
QOL among the control group compared with more than one third among the
case group. In the control group, we see about 54% have rated their QOL as
good and very good, meanwhile 41% among the case group did so. More
compliance with the therapeutic regimen among the control group made their
QOL better in comparison to the case group. On the other hand, the non-
compliance in the case group gave us a high percentage 20% of poor and
very poor QOL rate in comparison to the QOL rate in the control group 9%.
12
29
39
13
7
22
32
37
8 1
0
5
10
15
20
25
30
35
40
Case Control
How would you rate your quality of life?
Very goodGoodNeither..norPoorVery poor
.
Figure No. (15)

95
8.4.2 Satisfaction with health
The patients were asked to rate their satisfaction with health on a scale from
very dissatisfied to very satisfied. More than two third of the control group was
satisfied and very satisfied with their health, meanwhile less than one third of
the case group was so. Commitment to the therapeutic regimen gave us the
high percentage of satisfaction with health status among the control group. On
the other hand, we see the opposite ranges of dissatisfaction regarding health
status about 63% was dissatisfied with their health among the case group
compared to 20% of dissatisfaction in control group.
Figure No. (16)
How satisfied are you with your health?
ControlCase
Perc
ent
100
90
80
70
60
50
40
30
20
10
0
Very satisfied
Satisfied
Neither ....nor
Dissatisfied
Very dissatisfied
14
54
23
12
10
14
33
6
30

96
8.4.3 Physical pain that prevents you from doing your needs
The patients were asked to rate how much they have experienced a physical
pain that prevents them from doing their needs on a scale from not at all to an
extreme amount. Hypertension is a serious problem, which can cause some
signs and symptoms such as headache, tinnitus, general weakness, and
dizziness. These signs and symptoms can impair the activity of daily living for
patients. As proven before, compliance to taking the medication as prescribed
(figure No. (3) and at proper time (figure No. (4)) among the control group
made the pain disappear, so 63% of the control group patients had no
impairment or a little in their activity of daily living compared to 19% of the
case group. Less compliance to take the medication as prescribed and at
proper time made 68% among the case group have physical pain, which
prevented them from practicing their ADL compared to 20% of the control
group.
To what extent do you feel that physical pain prevents you from doing what you need to do?
33
3
16
30
1317
38
19
30
10
5
10
15
20
25
30
35
40
Case Control
Not at allA littleModerateVery muchExtremely
Figure NO. (17)

97
8.4.4 Medical treatment to function in daily life
The patients were asked to rate how much they have experienced a need of
medical treatment to function their daily life on a scale from not at all to an
extreme amount. Almost half of the control group found their self of a little or
no need of medical treatment to function in their daily life in comparison to
14% among the case group. As we know, people seek medical treatment
when they face any medical problem. Since the control group has proven to
be more complaint with the therapeutic regimen than the case group, this
made them less asking for medical treatment in order to function in daily life.
Low percentage of compliance with the therapeutic regimen among the case
group made their function in daily life impaired and 60% of them to seek
medical treatment.
How much do you need any medical treament to function in your daily life?
3
29
1118
26 2629
2531
205
101520253035
Case Control
Not at allA littleModerateVery muchExtremely
Figure No. (18)

98
8.4.5 Enjoying life
The patients were asked to rate how much they have experienced an
enjoyment of life on a scale from not at all to an extreme amount. For more
than 2 years, the Palestinian people in Gaza and West Bank are living under
extremely stressful and inhuman circumstances. Incursion, curfew, closure,
assassination, demolition of houses, and destruction of infrastructure become
the major aspect of daily life, so enjoying life was unattainable. As we see in
figure No. (19), there were no big differences in the way of enjoying life
between both groups except the 25% of the control group who said that they
extremely enjoying their life. This could be due to some special circumstances
such as they have the ability and permission to pass through the checkpoints,
travel a broad, and going to the seashore. The seashore is the only
recreational place in Gaza Strip. Some areas in Gaza Strip mainly southern
sector are forbidden for Palestinian, because of the Jewish settlements.
19
27 2624
4 3
22 22
2825
0
5
10
15
20
25
30
Case Control
How much do you enjoy life?
Not at allA littleModerateVery muchExtremely
.
Figure No. (19)

99
8.4.6 Meaningful of life
The patients were asked to rate their meaningful of life on a scale from not at
all to an extreme amount. Perception of chronic disease differs from person to
person. Accepting the disease and living with it plays an important role in the
coping process. Figure No. (20) shows the majority of the case group feels
that their life is unmeaning in away or another. The society looks to the
chronic disease patients as disabled persons, which affect the way the
patients feel about their existence and value. This implemented mainly over
the female patients who feel threatened of being divorced or their husbands
could get married to another healthy woman as this allowed in Islam. More
than half of the control group feels their lives are meaningful because they feel
that they are still productive and socially involved in public life and decision-
making.
Figure No. (20)
To what extent do you feel your life to be meaningful?
ControlCase
Per
cent
100
90
80
70
60
50
40
30
20
10
0
An extrem amount
Very much
A moderate amount
A little
Not at all
12
42
20
25
18
17
25
35

100
8.4.7 Ability to concentrate
The patients were asked to rate their ability of concentration on a scale from
not at all to extremely. Uncontrolled blood pressure and its symptoms affect
patient's life in general. Patients who are taking antihypertensive medication
maintain their blood pressure in normal range, which will help them avoid the
complications of sever hypertension which will improve their level of
concentration. About half of the control group experiences a very good level of
concentration because they were more compliant to antihypertensive
medication than the case group. The low percentage of concentration among
the control group could be due to the adverse reaction of antihypertensive
treatment such as dizziness and fatigue.
117 33 36 13
11 30 32 20 7
0% 20% 40% 60% 80% 100%
Control
Case
How well are you able to concentrate?
Not at allA littleModerateVery muchExtremely
.
Figure No. (21)

101
8.4.8 Feeling safety in daily life
The patients were asked to rate their feeling of safety in daily life on a scale
from not at all to extremely. Among the case group, 9% was extremely feel
safe in their daily life, 30% very much, 31% a moderate amount, 22% a little,
and 8% not at all feel safe in their daily life. In comparison to the cases in the
control group 13% was extremely feel safe in their daily life, 38% very much,
33% a moderate amount, 13% a little, and 3% not at all feel safe in their daily
life. As people in Gaza Strip are living under very stressful situation for more
than two years, people exposed to physical or emotional trauma at any time.
As we see in figure No. (22), there are no big differences between the case
and control groups about their feeling of safety in their daily life. Taking
antihypertensive medication will not prevent completely a sudden increase or
decrease in blood pressure due to a sudden emotional trauma. The low
percentage of feeling unsafely in both groups could be due to the aging
process.
9 1330 38
31 3322 13
83
0
10
20
30
40
Case Control
How safe do you feel in your daily life?
Not at allA littleModerateVery muchExtremely
.
Figure No. (22)

102
8.4.9 Healthy of physical environment The patients were asked to rate how much they have experienced a healthy
physical environment on a scale from not at all to extremely. Gaza Strip
considered the highest density rate of population all over the world. The
environment of Gaza Strip is unhealthy for every body because of air
pollution, noise pollution, unhealthy sewage system, and over population.
There are eight refugee camps in Gaza Strip, and these camps do not meet
the lowest healthy standard for human. As we see in figure No. (23) a
considerable amount of patients in both groups felt that their physical
environment is unhealthy, because of the previously mentioned reasons. Also
this result was expected because UNRWA built most houses a long time ago.
Crowded houses and bad ventilation decrease the health status of physical
environment. On the other hand we see that a good amount of patients in
both groups have a better physical environment because they live in the city,
and had the ability to improve their physical environment by building a healthy
houses.
13 13 17 26
2627 17 19 28 9
0% 10% 20% 30% 40% 50% 60% 70% 80% 90% 100%
Control
Case
How healthy is your physical environment?
Not at all A little Moderate Very much Extremely
.
31
Figure No. (23)

103
8.4.10 Energy for daily life
The patients were asked to rate how completely they have experienced
enough energy for everyday life on a scale from not at all to completely.
Human being is mentally, socially, and physically unique. The result in figure
No. (24) shows how different patients cope with the disease and how different
the disease affects their practice of life. Almost one third of the case group felt
that they not at all had enough energy to function their life. Meanwhile only 3
% of the control group felt the same. On the contrary almost two third of the
control group had mostly and completely the energy to function normally in
comparison to the case group (20%). This is due to the high compliance rate
to some parts of the therapeutic regimen.
34
19
16 22
4
3
14
20
41
22
0
20
40
60
80
100
Case Control
Do you have enough energy for daily life?Not at all A little Moderate Mostly Completely
27
Figure No. (24)
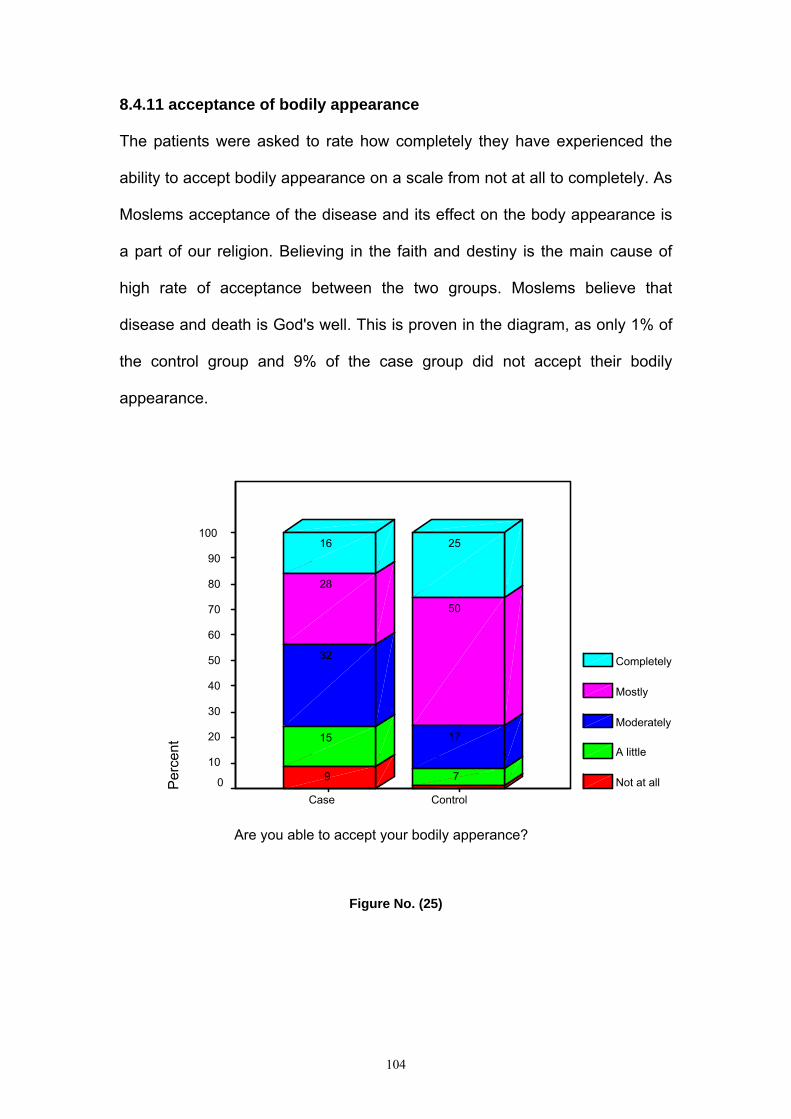
104
8.4.11 acceptance of bodily appearance
The patients were asked to rate how completely they have experienced the
ability to accept bodily appearance on a scale from not at all to completely. As
Moslems acceptance of the disease and its effect on the body appearance is
a part of our religion. Believing in the faith and destiny is the main cause of
high rate of acceptance between the two groups. Moslems believe that
disease and death is God's well. This is proven in the diagram, as only 1% of
the control group and 9% of the case group did not accept their bodily
appearance.
Figure No. (25)
Are you able to accept your bodily apperance?
ControlCase
Perc
ent
100
90
80
70
60
50
40
30
20
10
0
Completely
Mostly
Moderately
A little
Not at all
2516
50
28
17
32
7
15
9
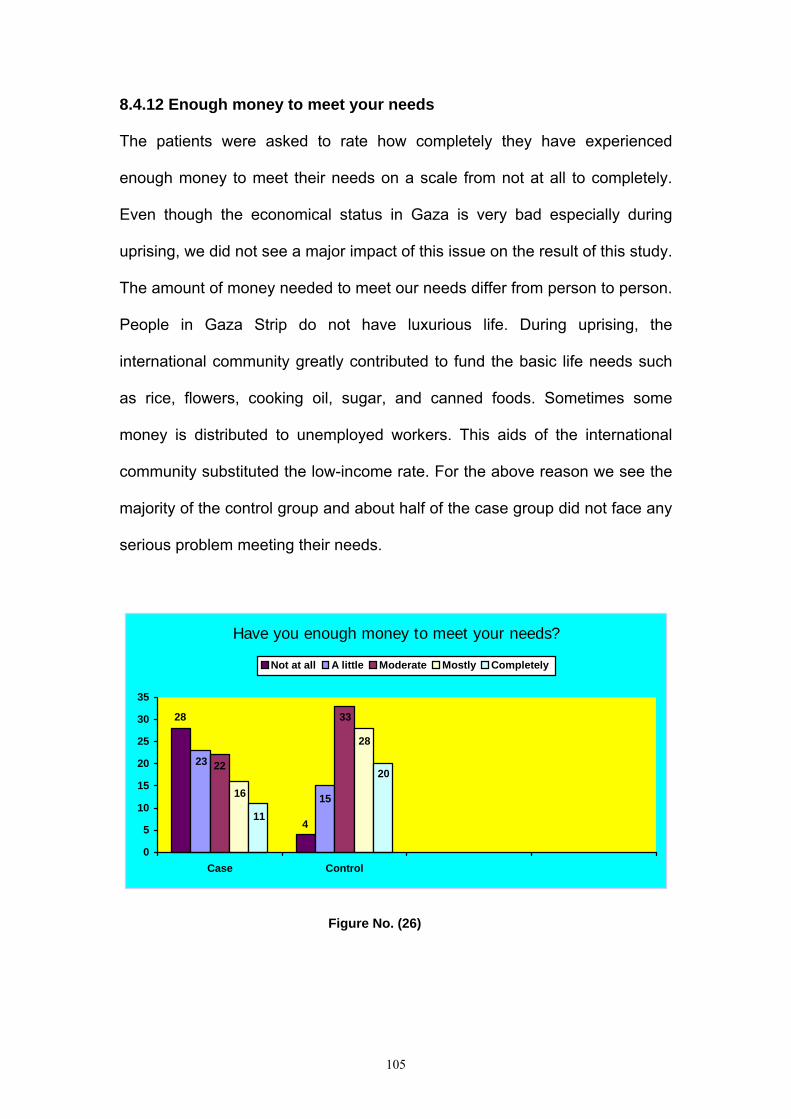
105
8.4.12 Enough money to meet your needs
The patients were asked to rate how completely they have experienced
enough money to meet their needs on a scale from not at all to completely.
Even though the economical status in Gaza is very bad especially during
uprising, we did not see a major impact of this issue on the result of this study.
The amount of money needed to meet our needs differ from person to person.
People in Gaza Strip do not have luxurious life. During uprising, the
international community greatly contributed to fund the basic life needs such
as rice, flowers, cooking oil, sugar, and canned foods. Sometimes some
money is distributed to unemployed workers. This aids of the international
community substituted the low-income rate. For the above reason we see the
majority of the control group and about half of the case group did not face any
serious problem meeting their needs.
Have you enough money to meet your needs?
4
28
23
15
22
33
16
28
11
20
0
5
10
15
20
25
30
35
Case Control
Not at all A little Moderate Mostly Completely
Figure No. (26)

106
8.4.13 Availability of daily life information
The patients were asked to rate how completely they have experienced the
availability of information they need in their daily life on a scale from not at all
to completely. Eighty three percent of the control group and 64% of the case
group stated that they could get enough information in day-to-day life
regarding their disease. Even though there were some difficulties to move
around during uprising, we still see high rate of well-informed patients. This
does not reflect a high level of health education standard in our society, but
because our society is considered to be socially attached. Patients in both
groups could get information from relative or neighboring health professional
personnel. We still have some leaflet regarding the disease and its
complications, but these publications are not enough or may not reach every
single one of the groups. This is the main reason of having the low rate of
misinformed patients between the two groups.
314 48 22 13
630 35 17 12
0 20 40 60 80 100
Control
Case
How available to you is the information that you need in your day to day life?
Not at all A little Moderate Mostly Completely
Figure No. (27)

107
8.4.14 Opportunity for leisure activities
The patients were asked to rate how completely they have experienced the
opportunity for leisure activities on a scale from not at all to completely. High
compliance rate with the therapeutic regimen among the control group in
comparison to the case group especially taking the medication as prescribed
and at proper time made it easy for them to avoid blood pressure
complications such as dizziness, fatigue and headache. This gave them an
opportunity and motivation to enjoy some leisure activities like going to the
café shops, seashore, and traditional games like cards, chess, and dominos.
Some patients felt isolated because their way of accepting the disease which
inhibited them from performing the leisure activities. This is seen mainly
among the case group 37% in comparison to control group 22%.
.
37
30
16
107
22181616
28
05
10152025303540
Case Control
To what extent do you have the opportunity for leisure activities?
Not at all A little Moderate Mostly Completely
Figure No. (28)
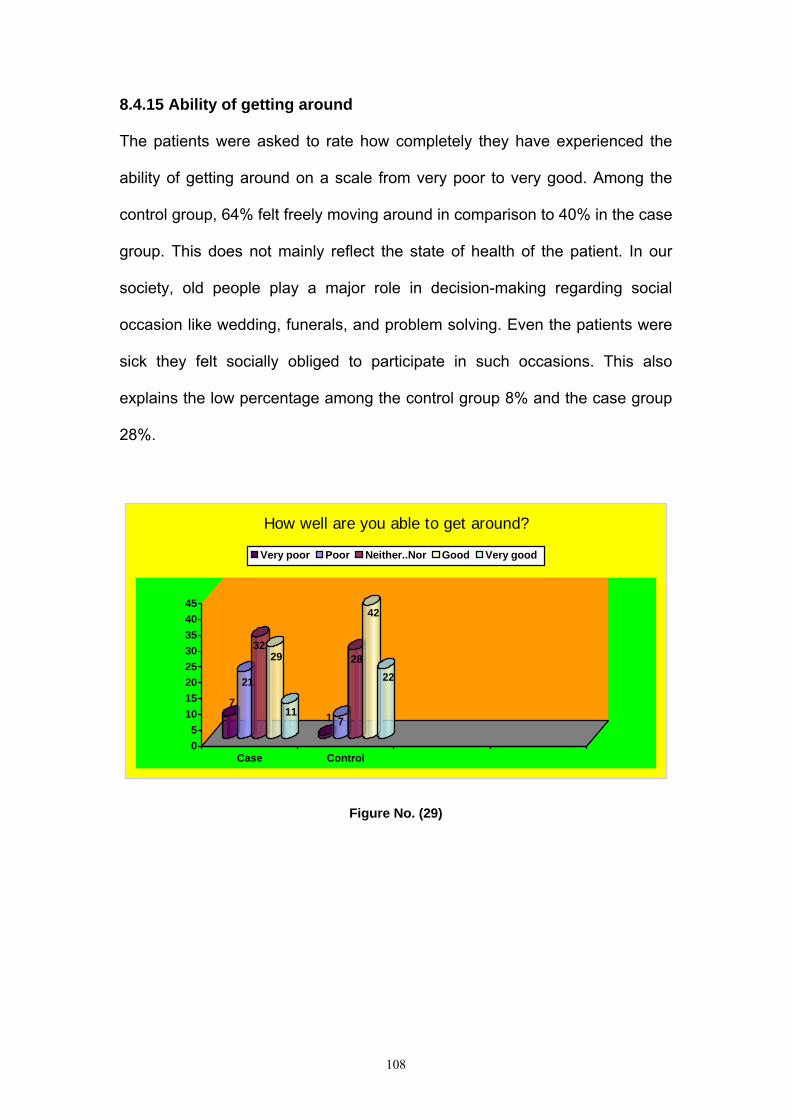
108
8.4.15 Ability of getting around
The patients were asked to rate how completely they have experienced the
ability of getting around on a scale from very poor to very good. Among the
control group, 64% felt freely moving around in comparison to 40% in the case
group. This does not mainly reflect the state of health of the patient. In our
society, old people play a major role in decision-making regarding social
occasion like wedding, funerals, and problem solving. Even the patients were
sick they felt socially obliged to participate in such occasions. This also
explains the low percentage among the control group 8% and the case group
28%.
7
21
3229
11 1 7
28
42
22
05
1015202530354045
Case Control
How well are you able to get around?
Very poor Poor Neither..Nor Good Very good
Figure No. (29)
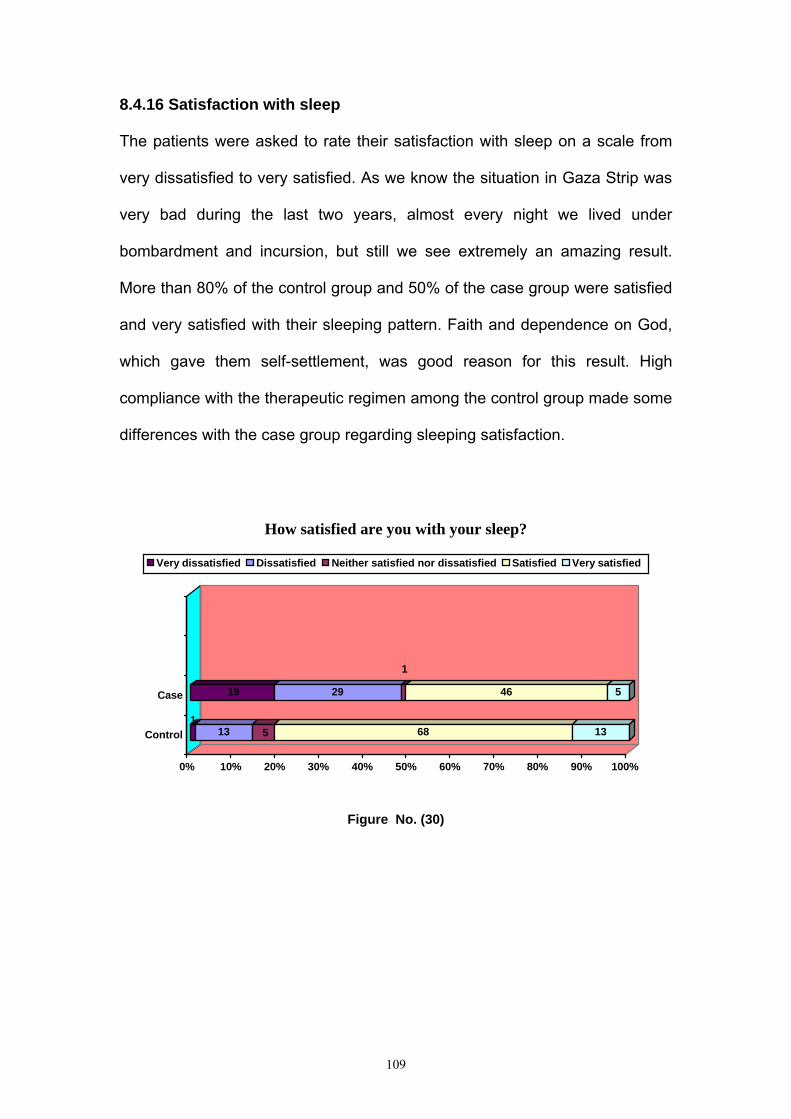
109
8.4.16 Satisfaction with sleep
The patients were asked to rate their satisfaction with sleep on a scale from
very dissatisfied to very satisfied. As we know the situation in Gaza Strip was
very bad during the last two years, almost every night we lived under
bombardment and incursion, but still we see extremely an amazing result.
More than 80% of the control group and 50% of the case group were satisfied
and very satisfied with their sleeping pattern. Faith and dependence on God,
which gave them self-settlement, was good reason for this result. High
compliance with the therapeutic regimen among the control group made some
differences with the case group regarding sleeping satisfaction.
113 5 68 13
19 29
1
46 5
0% 10% 20% 30% 40% 50% 60% 70% 80% 90% 100%
Control
Case
How satisfied are you with your sleep?
Very dissatisfied Dissatisfied Neither satisfied nor dissatisfied Satisfied Very satisfied
Figure No. (30)

110
8.4.17 Ability to perform ADL
The patients were asked to rate their satisfaction with the ability to perform
ADL on a scale from very dissatisfied to very satisfied. The majority of the
control group 78% was completely satisfied with their performance of daily life
activities, and none was very unsatisfied. Meanwhile a minority of about 13%
was unsatisfied. This might be because of their high compliance rate with the
therapeutic regimen, which decreased the hazards of the disease. On the
other hand, almost half of the case group was satisfied and the other half was
unsatisfied with 9% who was very unsatisfied. The reason for this result was a
low compliance rate with the therapeutic regimen.
Figure No. (31)
Satisfaction with your ability to perform your daily living activities
ControlCase
Perc
ent
100
90
80
70
60
50
40
30
20
10
0
Very satisfied
Satisfied
Neither....nor
Dissatisfied
Very dissatisfied
11
67
44
9
9
13
36
9

111
8.4.18 Satisfaction with the capacity for work
The patients were asked to rate their satisfaction with the capacity for work on
a scale from very dissatisfied to very satisfied. As we see in figure No. (17)
physical pain, which prevents you from doing what you need to do, we can
imagine the relation between pain and capacity for work. In the control group,
the ratios for the two aspects were relatively close. As pain had no influence
on their activity of daily life that made it better for their capability of performing
their jobs. This can be seen obviously in this figure as 71% of the control
group was satisfied with their capacity for work. If we look at figure No. (21),
we can see that 41% of the case group was unable to concentrate properly
which negatively affected their capacity of work as we see figure No. (32).
How satisfied are you with your capacity for work?
1
1216
43
13 12
51
29
20
30
10
20
30
40
50
60
Case Control
Very dissatisfied Dissatisfied Neither satisfied nor dissatisfied Satisfied Very satisfied
Figure No. (32)

112
8.4.19 Satisfaction with yourself
The patients were asked to rate their satisfaction with themselves on a scale
from very dissatisfied to very satisfied. Patients differ from healthy people of
how they understand self-satisfaction. Chronic patients will feel self satisfied if
they could perform activity of daily life properly such as (eating, bathing,
visiting friends, working and ext…), they will not ask for luxurious life to
achieve self-satisfaction. This is proven by the result in figure No. (33), as
88% of the control group was completely satisfied with their self, even in the
case group more than half was satisfied. The differences between the two
groups are due to the way individual accept the disease, live and cope with it,
and how they manage to live normally with the disease.
6
29
9
52
1 74
71
17
0
10
20
30
40
50
60
70
80
Case Control
How satisfied are you with yourself?
Very dissatisfied Dissatisfied Neither satisfied nor dissatisfied Satisfied Very satisfied
4
Figure NO. (33)

113
8.4.20 Satisfaction with personal relationships
The patients were asked to rate their satisfaction with personal relationships
on a scale from very dissatisfied to very satisfied. As we mentioned before, we
are living in a well-related society. Social relationships are highly appreciated
in our society, even patients feel obliged to relate with others. This is the
reason for the high rates of satisfaction with personal relationships among the
two groups. Nevertheless, we still see a small rate of unsatisfied patients; this
might be due to individual reasons like depression, frustration, and withdrawal.
4
13
5
65
13 2 4 2
70
22
0
10
20
30
40
50
60
70
Case Control
How satisfied are you with your personal relationships?
Very dissatisfied Dissatisfied Neither satisfied nor dissatisfied Satisfied Very satisfied
Figure No. (34)
8.4.21 Satisfaction with sexuality
The patients were asked to rate their satisfaction with sex life on a scale from
very dissatisfied to very satisfied. Human sexual activity serves a complex
need for personal expression and gratification with numerous psychological,
social, and esthetic implications. In general, people have an idea that
antihypertensive drugs cause sexual impairment. In fact, some

114
antihypertensive medication may cause impotence as undesired side effect.
We expected the result of this study to match with the previous idea, but
amazingly, it did not. We expected the patients in case group who were less
compliant to taking antihypertensive medication as prescribed and at proper
time to be more satisfied with their sexual life, but the study showed that 28%
of the case group was satisfied with their sexual life. Meanwhile the control
group who had antihypertensive medication as prescribed and at proper time
had a better rate of satisfaction of sexual life. The results of this scientific
study motivate us to provide health educators and physician a new idea about
how compliance with the therapeutic regimen is helpful to improve patient's
quality of life in general and specifically sexual life. Health educators and
physicians have to transform this idea to the patients and people in general.
1820
34
23
54
9
38 35
14
0
5
10
15
20
25
30
35
40
Case Control
How satisfied are you with your sex life?
Very dissatisfied Dissatisfied Neither satisfied nor dissatisfied Satisfied Very satisfied
Figure No. (35)

115
8.4.22 Satisfaction with the support of your friends
The patients were asked to rate their satisfaction with the support they got
from friends on a scale from very dissatisfied to very satisfied. Our society
depends mostly on social and individual relationships. Friendship relations are
very strong among all society segments. Generally, people support each other
especially when some body is sick, they would visit each other and give
emotional and even financial support if possible. This was seen obviously in
figure No. (36), as 91% of the control group were satisfied with their friends.
On the other hand, we see unexpected result as 51% among the case group
were unsatisfied with their friends. This is due to the state of depression, as
we see in figure No. (40). Non-acceptance of the disease, low self-esteem,
feeling of isolation, and despair are other reasons.
21
30
17
29
3
63
75
16
0
20
40
60
80
100
Case Control
How satisfied are you with the support you get from your friends?
Very dissatisfied Dissatisfied Neither satisfied nor dissatisfied Satisfied Very satisfied
Figure No. (36)

116
8.4.23 Satisfaction with living place
The patients were asked to rate their satisfaction with the living places on a
scale from very dissatisfied to very satisfied. Even though a considerable
amount of both groups were unsatisfied with their physical environment as
shown in figure No. (23). Figure No. (37) shows considerable amounts of both
groups which are satisfied with the conditions of their living place. This result
was unexpected, but I believe that people are trying to accept the conditions
of their living place, because they are unable to change, and they have to
cope and modify their life to meet their needs. The rate of un-satisfaction in
both groups is understandable as we think people may have problems with
their neighbors, location of the living places (risky areas), and crowdedness of
the neighborhood.
912
3
60 16
10 19
2
56 13
0 20 40 60 80 100
Control
Case
How satisfied are you with the conditions of your living place?
Very dissatisfied Dissatisfied Neither satisfied nor dissatisfied Satisfied Very satisfied
Figure No. (37)
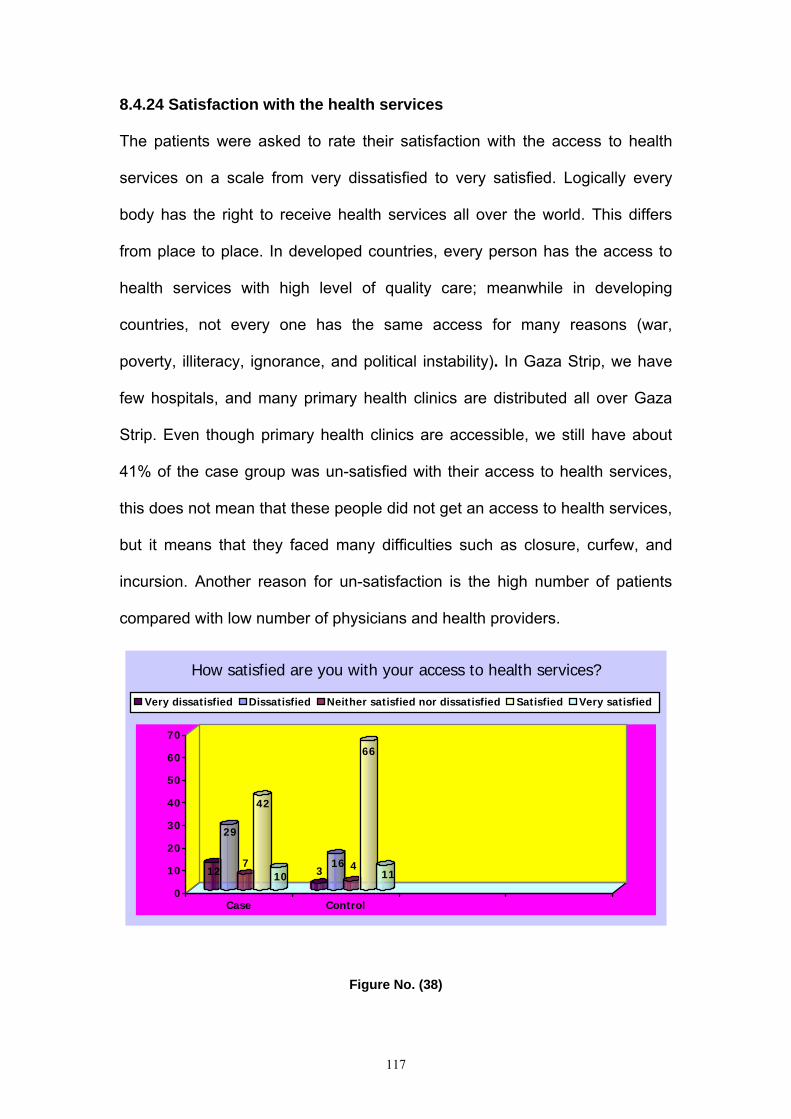
117
8.4.24 Satisfaction with the health services
The patients were asked to rate their satisfaction with the access to health
services on a scale from very dissatisfied to very satisfied. Logically every
body has the right to receive health services all over the world. This differs
from place to place. In developed countries, every person has the access to
health services with high level of quality care; meanwhile in developing
countries, not every one has the same access for many reasons (war,
poverty, illiteracy, ignorance, and political instability). In Gaza Strip, we have
few hospitals, and many primary health clinics are distributed all over Gaza
Strip. Even though primary health clinics are accessible, we still have about
41% of the case group was un-satisfied with their access to health services,
this does not mean that these people did not get an access to health services,
but it means that they faced many difficulties such as closure, curfew, and
incursion. Another reason for un-satisfaction is the high number of patients
compared with low number of physicians and health providers.
12
29
7
42
10 316 4
66
11
0
10
20
30
40
50
60
70
Case Control
How satisfied are you with your access to health services?
Very dissatisfied Dissatisfied Neither satisfied nor dissatisfied Satisfied Very satisfied
Figure No. (38)

118
8.4.25 Satisfaction with transportation
The patients were asked to rate their satisfaction with transportation on a
scale from very dissatisfied to very satisfied. The majority of the control group
78% was satisfied with their transport; meanwhile about one third of the case
group was satisfied. Both groups had the ability to reach health services in a
way or another. Seventy-eight percent of the control group had easier
transport system because they might have private cars, meanwhile 56% of the
case group had some difficulties might made them feel un-satisfied for
example they did not have private cars, and they had to walk some distances
to reach the transport station. Some people had very bad financial situation
made them unable to afford transport fees.
How satisfied are you with your transport?
3
29
11
27
9 8
65
2913
60
10
20
30
40
50
60
70
Case Control
Very dissatisfied Dissatisfied Neither satisfied nor dissatisfied Satisfied Very satisfied
Figure No. (39)

119
8.4.26 Experienced of negative feelings
The patients were asked to rate how often they have experienced a negative
feeling such as blue mood, despair, anxiety, and depression on a scale from
never to always. Depression and depressive symptoms are significant health
care problems and it occurs frequently in the elderly medically ill [147]. A long
the study we have seen that the quality of life among the control group is
relatively high in physical, psychological, social, and environmental domains
compared to the case group. Ninety one percent of the case group had the
negative feeling of blue mood, despair, anxiety, and depression. This gave us
a clue to why they had low QOL rate. As we know, depression affects daily life
activities such as sleeping, walking, eating, concentration, leisure activities,
and social relationships.
9
26
65
27
12
35
17
9
0
10
20
30
40
50
60
70
Case Control
How often do you have negative feelings such as blue mood, despair, anxiety, and depression?
Never Seldom Sometimes Often Always
Figure No. (40)
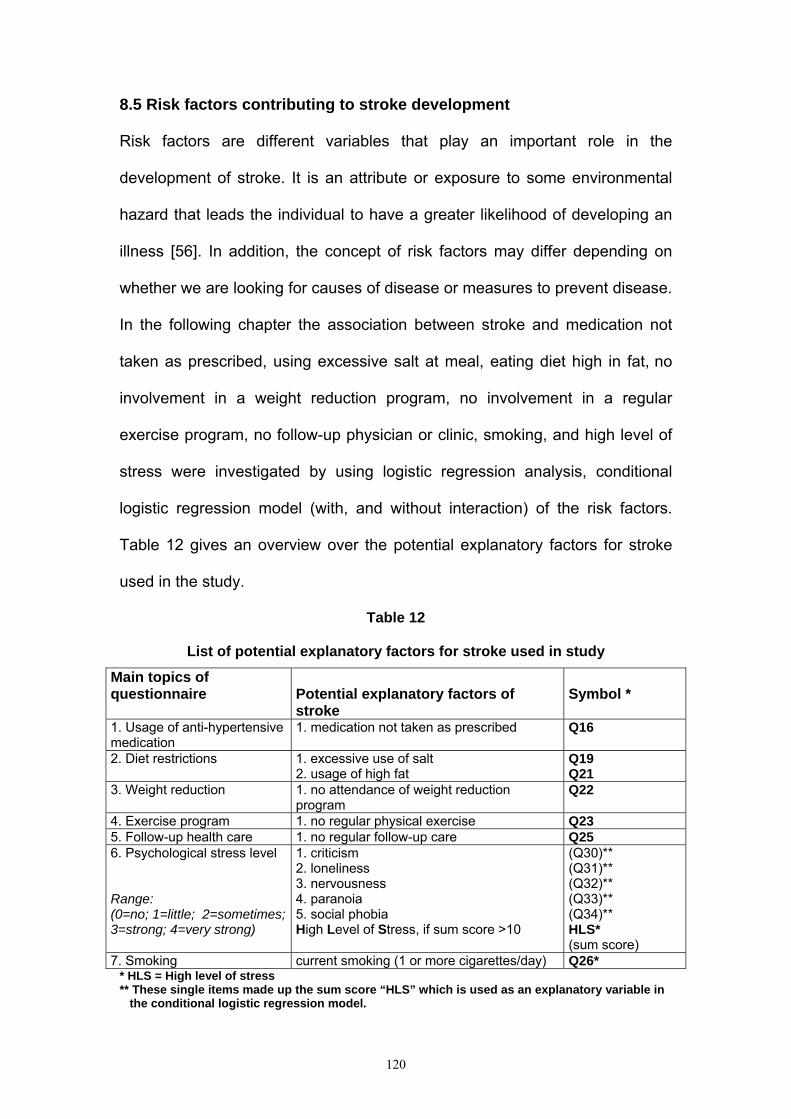
120
8.5 Risk factors contributing to stroke development
Risk factors are different variables that play an important role in the
development of stroke. It is an attribute or exposure to some environmental
hazard that leads the individual to have a greater likelihood of developing an
illness [56]. In addition, the concept of risk factors may differ depending on
whether we are looking for causes of disease or measures to prevent disease.
In the following chapter the association between stroke and medication not
taken as prescribed, using excessive salt at meal, eating diet high in fat, no
involvement in a weight reduction program, no involvement in a regular
exercise program, no follow-up physician or clinic, smoking, and high level of
stress were investigated by using logistic regression analysis, conditional
logistic regression model (with, and without interaction) of the risk factors.
Table 12 gives an overview over the potential explanatory factors for stroke
used in the study.
Table 12
List of potential explanatory factors for stroke used in study Main topics of questionnaire
Potential explanatory factors of stroke
Symbol *
1. Usage of anti-hypertensive medication
1. medication not taken as prescribed
Q16
2. Diet restrictions 1. excessive use of salt 2. usage of high fat
Q19 Q21
3. Weight reduction 1. no attendance of weight reduction program
Q22
4. Exercise program 1. no regular physical exercise Q23 5. Follow-up health care 1. no regular follow-up care Q25 6. Psychological stress level Range: (0=no; 1=little; 2=sometimes; 3=strong; 4=very strong)
1. criticism 2. loneliness 3. nervousness 4. paranoia 5. social phobia High Level of Stress, if sum score >10
(Q30)** (Q31)** (Q32)** (Q33)** (Q34)** HLS* (sum score)
7. Smoking current smoking (1 or more cigarettes/day) Q26* * HLS = High level of stress ** These single items made up the sum score “HLS” which is used as an explanatory variable in the conditional logistic regression model.

121
8.5.1 Logistic regression analysis (crude odds ratio)
Logistic regression is used to analyze the relationship between multiple
independent variables and dependent variable that is categorical. In addition,
it transforms the probability of an event occurring into its odds, and shows the
ratio probability of one event relative to the probability of a second event. Also,
this test helps us to generate odds ratio that can be meaningfully interpreted,
and therefore may promote better understanding of the underlying
relationships of the variables [180, 181, 182]. The results of this analysis are
not based on a conditional logistic regression model, but it depends on the
crude odds ratio.
Basic potential risk factors for stroke development are shown in table 13.
Logistic regression analysis was used to determine the risk factors, which
contribute to the development of stroke. There are significant associations
between stroke and medication not taken as prescribed (OR=7.13;95%CI
3.32-15.32), using excessive salt at meal (OR=6.21;95%CI 3.75-10.29), and
eating diet high in fat (OR=4.66;95%CI 2.87-7.56). Also an association was
found between stroke and no involvement in a weight reduction program
(OR=4.97;95% CI 1.72-14.36), no involvement in a regular exercise program
(OR=4.94;95%CI 2.80-8.73), irregular measurement of blood pressure
(OR=3.14;95%CI 1.92-5.14), no follow-up physician or clinic (OR=3.03;95%CI
1.802-5.102), and smoking (OR=2.20;95% CI 1.33-3.62).
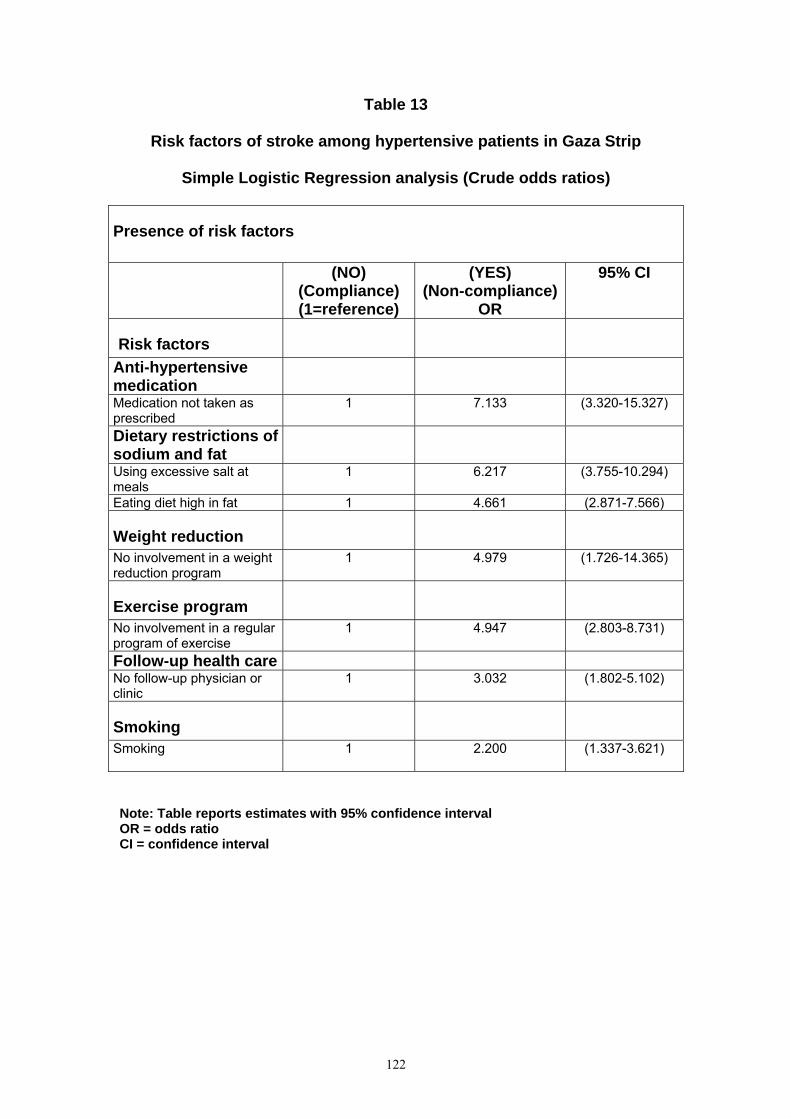
122
Table 13
Risk factors of stroke among hypertensive patients in Gaza Strip
Simple Logistic Regression analysis (Crude odds ratios)
Presence of risk factors
(NO)
(Compliance) (1=reference)
(YES) (Non-compliance)
OR
95% CI
Risk factors
Anti-hypertensive medication
Medication not taken as prescribed
1 7.133 (3.320-15.327)
Dietary restrictions of sodium and fat
Using excessive salt at meals
1 6.217 (3.755-10.294)
Eating diet high in fat 1 4.661 (2.871-7.566)
Weight reduction
No involvement in a weight reduction program
1 4.979 (1.726-14.365)
Exercise program
No involvement in a regular program of exercise
1 4.947 (2.803-8.731)
Follow-up health care No follow-up physician or clinic
1 3.032 (1.802-5.102)
Smoking
Smoking 1
2.200 (1.337-3.621)
Note: Table reports estimates with 95% confidence interval OR = odds ratio CI = confidence interval

123
8.5.2 Conditional logistic regression for 1:2 matched case-control data
(considering interaction terms)
A conditional logistic regression analysis model was used to determine the
risk factors, which contribute to the development of stroke. This model is an
important analytical techniques, which used to determine how likely the
observed response is with respect to all possible responses [175, 176]. The
most essential step in using PROC PHREG is the variables representing
cases and controls must be redefined or a new variable created [177]. In
addition, a conditional logistic regression is used to investigate the relationship
between an outcome and a set of prognostic factors in matched case-control
studies. If there is only one case and one control, the matching is 1:m. The
m:n matching refers to the situation in which there is a varying number of
cases and controls in the matched sets. Conditional logistic regression model
can be performed with the PHREG procedure by using the discrete logistic
model and forming a stratum for each matched set. In addition, you need to
create dummy survival times so that all the cases in matched set have the
same event time value, and the corresponding controls are examined later
times [183].
The results of the final conditional logistic regression model based upon the
backward selection procedure are shown in (Table 14). Two potential risk
factors as weight reduction and irregular follow-up health care were excluded
from the conditional logistic regression model due to backward selection with
a significance level for removing an explanatory variable from the model
α=0.05. Therefore these two factors were not considered in the final
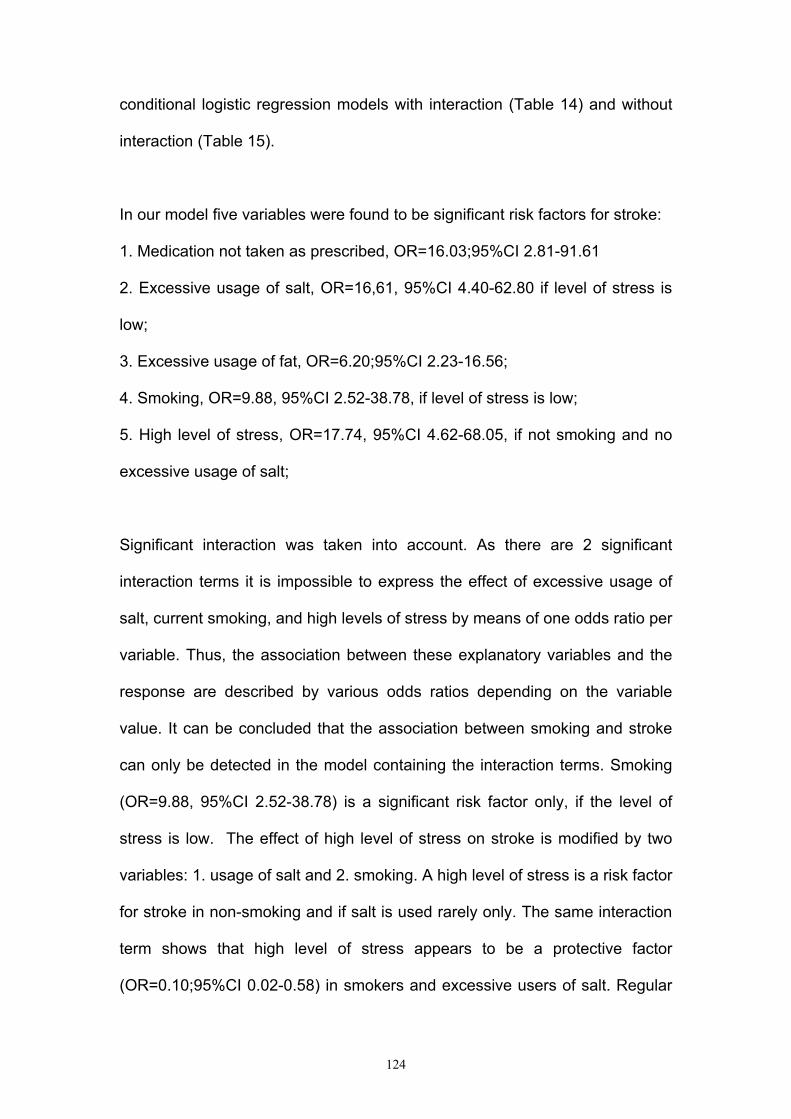
124
conditional logistic regression models with interaction (Table 14) and without
interaction (Table 15).
In our model five variables were found to be significant risk factors for stroke:
1. Medication not taken as prescribed, OR=16.03;95%CI 2.81-91.61
2. Excessive usage of salt, OR=16,61, 95%CI 4.40-62.80 if level of stress is
low;
3. Excessive usage of fat, OR=6.20;95%CI 2.23-16.56;
4. Smoking, OR=9.88, 95%CI 2.52-38.78, if level of stress is low;
5. High level of stress, OR=17.74, 95%CI 4.62-68.05, if not smoking and no
excessive usage of salt;
Significant interaction was taken into account. As there are 2 significant
interaction terms it is impossible to express the effect of excessive usage of
salt, current smoking, and high levels of stress by means of one odds ratio per
variable. Thus, the association between these explanatory variables and the
response are described by various odds ratios depending on the variable
value. It can be concluded that the association between smoking and stroke
can only be detected in the model containing the interaction terms. Smoking
(OR=9.88, 95%CI 2.52-38.78) is a significant risk factor only, if the level of
stress is low. The effect of high level of stress on stroke is modified by two
variables: 1. usage of salt and 2. smoking. A high level of stress is a risk factor
for stroke in non-smoking and if salt is used rarely only. The same interaction
term shows that high level of stress appears to be a protective factor
(OR=0.10;95%CI 0.02-0.58) in smokers and excessive users of salt. Regular

125
exercise can be considered as a significant protective factor (OR=0.20;
95%CI 0.09-0.49) for stroke. Thus, our conclusions are mainly based on this
model.
Table 14
Results of the multiple conditional logistic regression model
based upon backward selection
Risk factors β SE P-value OR 95% CI
Medication not taken as
prescribed 2.77462 0.88923 0.0018 16.03 2.81-91.61
Using excessive salt at
meals 2.81029 0.67837 <.0001
16.61
1.76
4.40-62.80 if HLS=0
0.58-5.33 if HLS=1
Eating diet high in fat 1.82466 0.50122 0.0003 6.20 2.23-16.56
Involvement in a regular
program of exercise -1.58582 0.44690 0.0004 0.20
0.09-0.49
Smoking 2.29022 0.69779 0.0010 9.88
0.52
2.52-38.78 if HLS=0
0.14-1.99 if HLS=1
High level of stress
(HLS) 2.87562 0.68601 <.0001
17.74
1.88
0.10
4.62- 68.05 if Q19=Q26=0
0.58- 6.05 if Q19=1, Q26=0
0.02-0.58 if Q19=Q26=1
Interaction between
high level stress and
using excessive salt in
meal
-2.24391 0.85458 0.0086
Interaction between
high level stress and
smoking
-2.93735 0.88694 0.0009
Note: - Table reports estimates with 95% confidence interval OR = odds ratio; CI = confidence interval
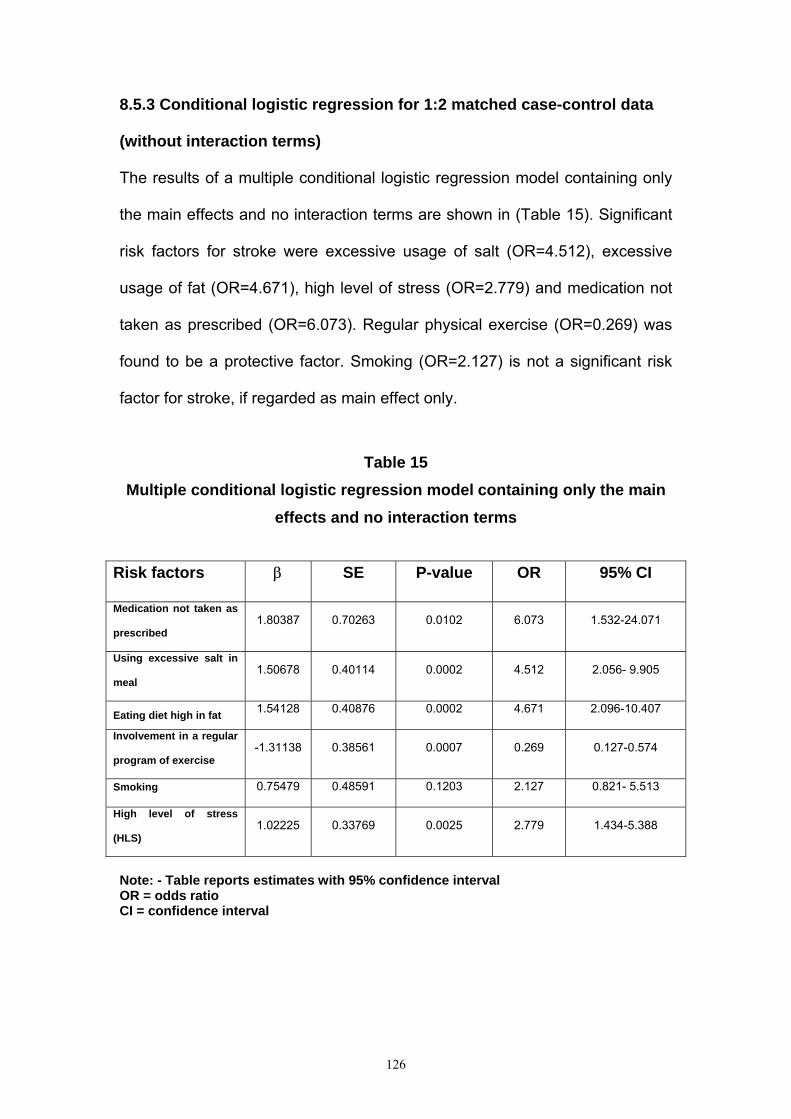
126
8.5.3 Conditional logistic regression for 1:2 matched case-control data
(without interaction terms)
The results of a multiple conditional logistic regression model containing only
the main effects and no interaction terms are shown in (Table 15). Significant
risk factors for stroke were excessive usage of salt (OR=4.512), excessive
usage of fat (OR=4.671), high level of stress (OR=2.779) and medication not
taken as prescribed (OR=6.073). Regular physical exercise (OR=0.269) was
found to be a protective factor. Smoking (OR=2.127) is not a significant risk
factor for stroke, if regarded as main effect only.
Table 15
Multiple conditional logistic regression model containing only the main effects and no interaction terms
Risk factors β SE P-value OR 95% CI
Medication not taken as
prescribed 1.80387 0.70263 0.0102 6.073 1.532-24.071
Using excessive salt in
meal 1.50678 0.40114 0.0002 4.512 2.056- 9.905
Eating diet high in fat 1.54128 0.40876 0.0002 4.671 2.096-10.407 Involvement in a regular
program of exercise -1.31138 0.38561 0.0007 0.269 0.127-0.574
Smoking 0.75479 0.48591 0.1203 2.127 0.821- 5.513 High level of stress
(HLS) 1.02225 0.33769 0.0025 2.779 1.434-5.388
Note: - Table reports estimates with 95% confidence interval OR = odds ratio CI = confidence interval

127
8.6 Analysis of variance of quality of life (QOL) among the case and
control groups
Analysis of variance (ANOVA) is an appropriate technique for analyzing the
effect of a group of independent variables on one dependent variable and
used to examine differences among two or more groups by comparing the
variability between and within the group. In our study, we concern about the
testing mean differences among the case and control groups by F-ratio
statistic. We calculated a quantity known as between groups variance, which
is the variability of the group means around the grand mean of all the data.
Also we calculated another quantity called within-groups variance, which is
the variability of the scores within each group around its own mean. The ratio
of between-groups variance and within-groups variance is known as the (F)
ratio. The degree of freedom (DF) corresponding to between-groups variance,
which is the numerator of the (F) ratio, is equal to K-1, where K is the number
of groups. The degree of freedom corresponding to the denominator of the (F)
ratio, which is the within-groups variance, is equal to K x (n-1), that is, the
number of groups times the number of scores in each group minus one. In the
case of obtaining F distribution value less than or equal the critical value, we
can then reject the hypothesis of no difference (“null hypothesis”). The
important point of ANOVA test is to run out the risk of making a type one error
to conclude that there is effect, but in fact, it has no effect. In our analysis, the
mean square is the sum of squares divided by the degree of freedom. For
between-groups, it is the variation of the group means around the grand
mean, while for within-groups it is the pooled estimate of the variation of the
individual scores around their respective group means [149].

128
8.6.1 Age and Quality of life domains among the case and control
groups by comparison of mean
The study population shows 57% of the subjects among the case and control
groups were between the ages of 52-63 years. One way ANOVA, means,
standard deviation, and 95%CI were used to compare differences of mean
and relationship within different age groups and quality of life domains
(physical, psychological, social, and environmental). Table 16 shows the
quality of life domains (physical, psychological, social, and environmental
domains) by comparison of means and age group. The mean quality of life of
physical domain is 56.15 between the ages of (46-51) Compared with 60.19
between the ages of (52-57). In addition, the quality of life in psychological,
social, and environmental domains is 55.77, 64.40, and 56.08 for the ages
(52-57) compared with 60.67, 66.05, and 58.20 for the ages of (58-63). Global
value among the QOL domains is quit similar, but we have some differences
in the QOL domains. As we know the QOL is decreased with aging process,
but in this study, we see some times contradictory result especially between
the age group (52-57), and (58-63), also between the age group (40-45), and
(58-63). It shows a direct relation between age and QOL as increasing age
will lead to increase QOL. The best QOL among physical domain is between
the ages of (40-45). This result is expected mainly in this study because
normally physical heath decreased with aging process. In our society old
people plays an important role in decision-making, and problem solving in
comparison with young people. This explains the reason that the best QOL
among psychological, and social domain is between the age group (58-63).

129
As shown in table 16, there is no perfect correlation between quality of life
domains and age group among the case and control groups.
Table 16
Age and Quality of life domains among the case and control groups by
comparison of mean
Age in years WHOQOl physical
domain
WHOQOL
psychological
domain
WHOQOL
social domain
WHOQOL
environmental
domain
WHOQOL global
Value
40-45 Mean 62.3016 60.6481 61.1111 56.5972 54.1667
N 9 9 9 9 9
SD 18.5672 26.3615 19.9826 15.5030 25.7694
46-51 Mean 56.1508 51.6975 62.1914 54.4560 57.8704
N 54 54 54 54 54
SD 18.1766 20.4047 18.1504 15.8719 22.6874
52-57 Mean 60.1935 55.7726 64.4097 56.0872 56.3802
N 96 96 96 96 96
SD 19.8205 20.9459 17.2901 19.2658 24.8015
58-63 Mean 60.5283 60.6771 66.0590 58.2031 62.1094
N 96 96 96 96 96
SD 21.1090 18.2855 19.1273 17.5800 20.5559
64-69 Mean 56.2169 55.8128 64.7119 56.2500 58.4877
N 81 81 81 81 81
SD 19.8188 19.8921 19.3322 17.1448 20.6181
Total Mean 58.7372 56.6592 64.5089 56.4825 58.7054
N 336 336 336 336 336
SD 19.9136 20.1399 18.4745 17.6142 22.3297
8.6.2 Comparison of mean between QOL domains and age by using F- test
F-test is fundamentally the ratio of two independent variance estimates of the
same population variance. The characteristic of F distribution is positively
skewed, has no negative values, and has a median approximately equal to

130
one. The analysis of variance or ANOVA allows us to make an overall
comparison that tells whether there is a significant difference between the
means of the groups [149]. Table 17 shows an existence of variance between-
groups sum squares (SSB) which estimate increases with the effect of the
independent variable and within–groups sum of squares (SSW) which
remains constant. The variances of mean square, F-value, and level of
significance between and within groups indicate no significant effects between
QOL domains and age as given evidence for physical domain (F 0.94, α
0.43), psychological domain (F 1.96, α 0.09), social domain (0.45, α 0.76),
environmental domain (F 0.42, α 0.79) and global value (F 0.93, α 0.44). It is
obvious that age (independent variable) has no real effect on the QOL
(dependent variable).

131
Table 17
Comparison of mean between QOL domains and age by using (F) test (One-way ANOVA)
WHOQOL domains *age in years
Combination between and within group
variance
Sum of square
Degree of freedom (DF) Mean square F Significance
Physical domain Between-group 1501.616 4 375.404 .946 .437
Within-group 131343.227 331 396.807
Total 132844.843 335
Psychological domain Between-group 3155.852 4 788.963 1.968 .099
Within-group 132725.380 331 400.983
Total 135881.231 335
Social domain Between-group 628.900 4 157.225 .458 .767
Within-group 113709.518 331 343.533
Total 114338.418 335
Environmental domain Between group 525.466 4 131.366 .420 .794
Within-group 103411.447 331 312.421
Total 103936.913 335
Global value Between-group 1858.276 4 464.569 .931 .446
Within-group 165178.554 331 499.029
Total 167036.830 335

132
8.6.3 Comparison of mean between QOL results in our study population to the German standard population Table 18 shows the quality of life domains by age, sex, mean and standard
deviation among the case and control groups. The mean quality of life in the
case and control among males is better than females in all domains and age
groups. This result suits our culture and society regarding females, because
we are living in a conservative society with some private ethics, rules and
moral. Also the physiological structure of females may affect their QOL such
as menstruation, pregnancy, hormonal changes, breast-feeding, and
menopause. In addition, this result is convenient with the general standard of
German population (appendix 4), which shows that the QOL among male is
better than females in all domains. The mean QOL in physical domain is
64.28, psychological domain 72.22, social domain 66.66, and 64.58 in
environmental domain compared with 82.30 in physical domain, 75.28 in
psychological domain, 73.17 in social domain, and 69.36 in environmental
domain in the general standard of German population among males between
the age of (40-45) years. Also our study shows the mean quality of life is
56.54 in physical domain, 59.02 in psychological domain, 64.08 in social
domain, and 53.05 in environmental domain compared with 71.03 in physical
domain, 70.65 in psychological domain, 68.77 in social domain, and 68.96 in
environmental domain in the general standard of German population among
females between the ages of (58-63) years. This result is expected because
we are living in completely different situation such as instability of political
situation, incursion, curfew unhealthy sewage system and environment, and
over population. In general, overall quality of life and in all domains in our
study is lower than in the German general population. The main reason of a

133
comparison of our study results with the German general population is due to
unavailability of standardized Palestinian QOL.
Table 18 Comparison of mean between QOL results in our study population to
general standard of German population
Age in years Sex Mean physical domain psychological domain social domain Environmental
domain Global value
40-45 Male Mean 64.2857 72.2222 66.6667 64.5833 62.5000
N 3 3 3 3 3 SD 14.2857 26.7879 16.6667 14.4338 25.0000 Female Mean 61.3095 54.8611 58.3333 52.6042 50.0000 N 6 6 6 6 6 SD 21.5966 26.5383 22.3607 15.6146 27.3861 Total Mean 62.3016 60.6481 61.1111 56.5972 54.1667 N 9 9 9 9 9 SD 18.5672 26.3615 19.9826 15.5030 25.7694
46-51 Male Mean 59.7619 56.5278 67.7778 55.8333 63.7500 N 30 30 30 30 30 SD 17.3432 20.7522 16.7717 16.2221 20.5920 Female Mean 51.6369 45.6597 55.2083 52.7344 50.5208 N 24 24 24 24 24 SD 18.5421 18.6533 17.6883 15.5927 23.4518 Total Mean 56.1508 51.6975 62.1914 54.4560 57.8704 N 54 54 54 54 54 SD 18.1766 20.4047 18.1504 15.8719 22.6874
52-57 Male Mean 63.8655 62.7451 68.1373 61.5809 57.8431 N 51 51 51 51 51 SD 19.2280 18.7345 15.8733 19.0834 24.1040 Female Mean 56.0317 47.8704 60.1852 49.8611 54.7222 N 45 45 45 45 45 SD 19.8677 20.6931 18.0215 17.6897 25.7403 Total Mean 60.1935 55.7726 64.4097 56.0872 56.3802 N 96 96 96 96 96 SD 19.8205 20.9459 17.2901 19.2658 24.8015
58-63 Male Mean 63.6243 61.9599 67.5926 62.2106 65.0463 N 54 54 54 54 54 SD 21.9399 20.1385 20.0671 17.9802 21.0821 Female Mean 56.5476 59.0278 64.0873 53.0506 58.3333 N 42 42 42 42 42 SD 19.5284 15.6693 17.8908 15.8067 19.4565 Total Mean 60.5283 60.6771 66.0590 58.2031 62.1094 N 96 96 96 96 96 SD 21.1090 18.2855 19.1273 17.5800 20.5559
64-69 Male Mean 58.5317 60.3009 69.4444 59.2014 63.5417 N 36 36 36 36 36 SD 17.6473 20.5694 19.4161 17.5818 18.7500 Female Mean 54.3651 52.2222 60.9259 53.8889 54.4444 N 45 45 45 45 45 SD 21.4135 18.7941 18.6188 16.6050 21.3460 Total Mean 56.2169 55.8128 64.7119 56.2500 58.4877 N 81 81 81 81 81 SD 19.8188 19.8921 19.3322 17.1448 20.6181
Total Male Mean 61.9869 61.0872 68.1513 60.3448 62. 3563 N 174 174 174 174 174 SD 19.3758 19.9675 17.9813 17.8607 21.5037 Female Mean 55.2469 51.9033 60.5967 52.3341 54.7840 N 162 162 162 162 162 SD 19.9512 19.2773 18.2485 16.4119 22.5997 Total Mean 58.7372 56.6592 64.5089 56.4825 58.7054 N 336 336 336 336 336 SD 19.9136 20.1399 18.4745 17.6142 22.3297
134
8.6.4 Mean quality of life domains among case and control groups
by diagnosis
Table 19 shows the quality of life domains by diagnoses, mean and standard
deviation among the case and control group. The mean quality of life in
physical domain is 41.2628, psychological domain 40.4762, social domain
51.0417, and environmental domain is 46.0379 among the case group. In
comparison to the cases, in the control group 67.4745 in physical domain,
64.7507 in psychological domain, 71.2426 in social domain, and 61.7048 in
environmental domain. Overall, mean quality of life domains among the case
group is less than the control group. The best QOL is among social domain in
both groups, because we are living in a well-related society, and the person
feels obliged to relate with others.
Table 19 Mean quality of life domains among the case and control group
by diagnosis
Diagnosis Mean Physical
domain
Psychological
domain
Social
domain
Environmental
domain Global value
Case Mean 41.2628 40.4762 51.0417 46.0379 45.2009
N 112 112 112 112 112
SD 15.4960 15.3111 17.3697 17.4118 23.1431
control Mean 67.4745 64.7507 71.2426 61.7048 65.4576
N 224 224 224 224 224
SD 15.6891 17.1856 15.0305 15.2642 18.5756
Total Mean 58.7372 56.6592 64.5089 56.4825 58.7054
N 336 336 336 336 336
SD 19.9136 20.1399 18.4745 17.6142 22.3297
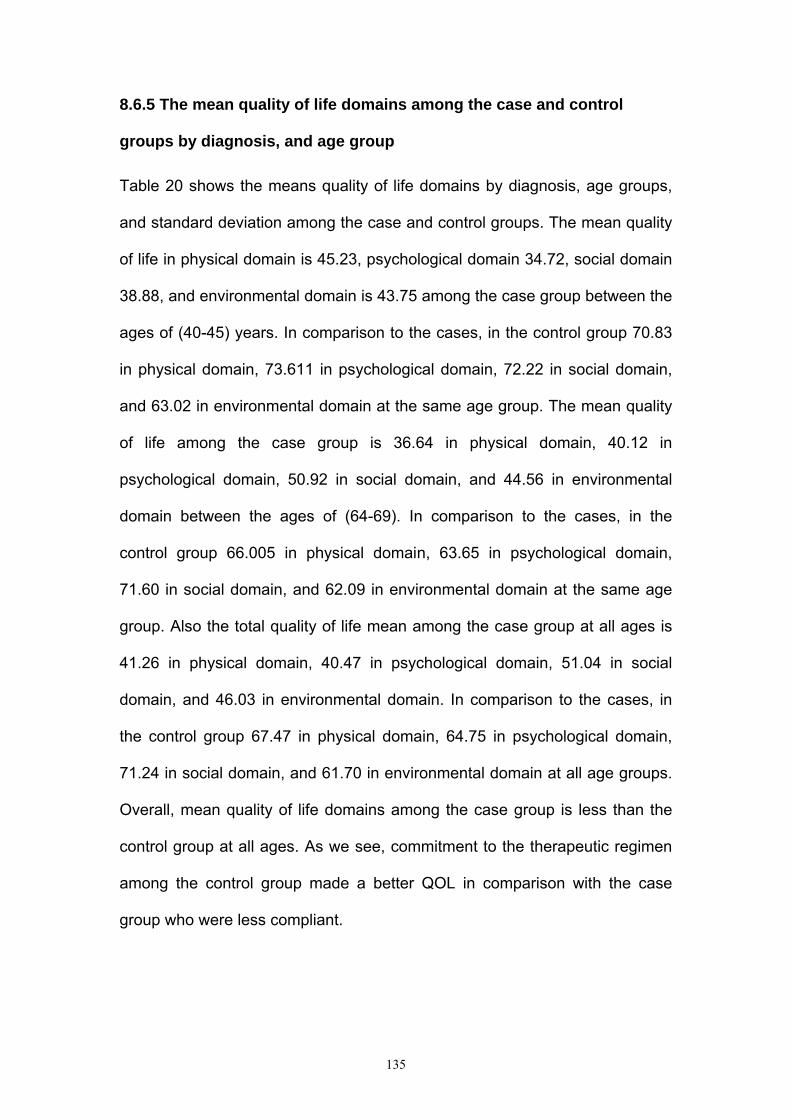
135
8.6.5 The mean quality of life domains among the case and control
groups by diagnosis, and age group
Table 20 shows the means quality of life domains by diagnosis, age groups,
and standard deviation among the case and control groups. The mean quality
of life in physical domain is 45.23, psychological domain 34.72, social domain
38.88, and environmental domain is 43.75 among the case group between the
ages of (40-45) years. In comparison to the cases, in the control group 70.83
in physical domain, 73.611 in psychological domain, 72.22 in social domain,
and 63.02 in environmental domain at the same age group. The mean quality
of life among the case group is 36.64 in physical domain, 40.12 in
psychological domain, 50.92 in social domain, and 44.56 in environmental
domain between the ages of (64-69). In comparison to the cases, in the
control group 66.005 in physical domain, 63.65 in psychological domain,
71.60 in social domain, and 62.09 in environmental domain at the same age
group. Also the total quality of life mean among the case group at all ages is
41.26 in physical domain, 40.47 in psychological domain, 51.04 in social
domain, and 46.03 in environmental domain. In comparison to the cases, in
the control group 67.47 in physical domain, 64.75 in psychological domain,
71.24 in social domain, and 61.70 in environmental domain at all age groups.
Overall, mean quality of life domains among the case group is less than the
control group at all ages. As we see, commitment to the therapeutic regimen
among the control group made a better QOL in comparison with the case
group who were less compliant.
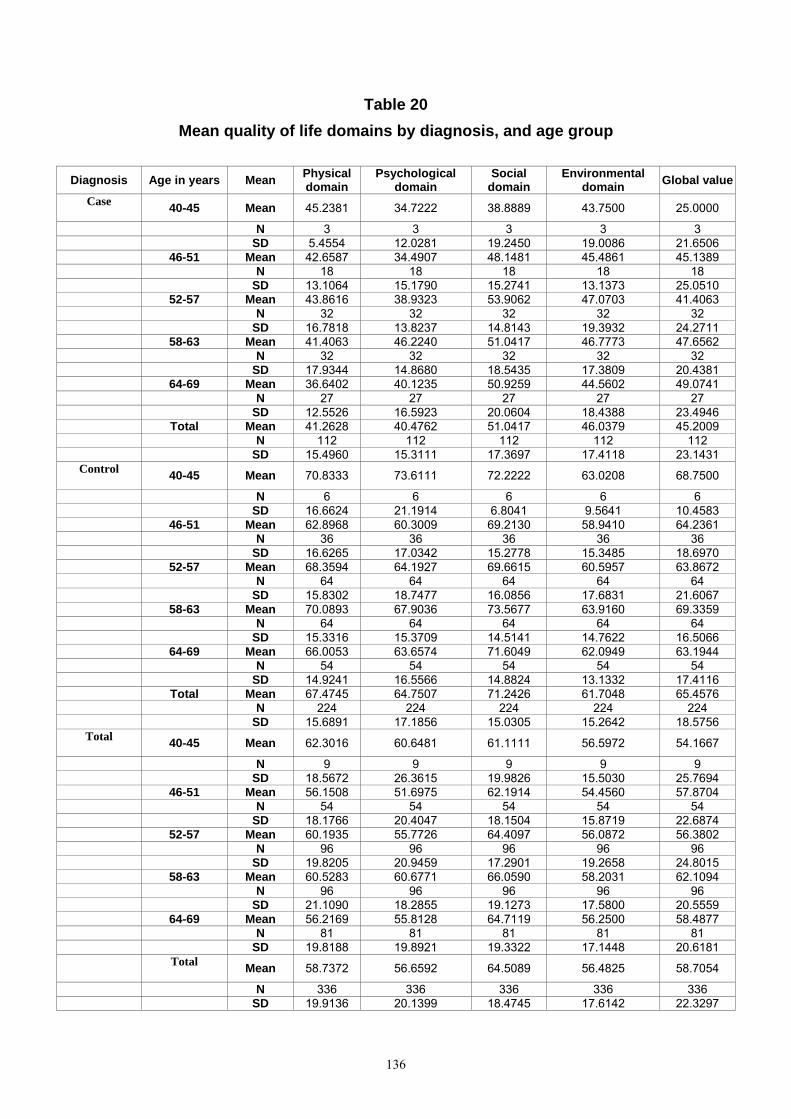
136
Table 20 Mean quality of life domains by diagnosis, and age group
Diagnosis Age in years Mean Physical
domain Psychological
domain Social
domain Environmental
domain Global value
Case 40-45 Mean 45.2381 34.7222 38.8889 43.7500 25.0000
N 3 3 3 3 3 SD 5.4554 12.0281 19.2450 19.0086 21.6506 46-51 Mean 42.6587 34.4907 48.1481 45.4861 45.1389 N 18 18 18 18 18 SD 13.1064 15.1790 15.2741 13.1373 25.0510 52-57 Mean 43.8616 38.9323 53.9062 47.0703 41.4063 N 32 32 32 32 32 SD 16.7818 13.8237 14.8143 19.3932 24.2711 58-63 Mean 41.4063 46.2240 51.0417 46.7773 47.6562 N 32 32 32 32 32 SD 17.9344 14.8680 18.5435 17.3809 20.4381 64-69 Mean 36.6402 40.1235 50.9259 44.5602 49.0741 N 27 27 27 27 27 SD 12.5526 16.5923 20.0604 18.4388 23.4946 Total Mean 41.2628 40.4762 51.0417 46.0379 45.2009 N 112 112 112 112 112 SD 15.4960 15.3111 17.3697 17.4118 23.1431
Control 40-45 Mean 70.8333 73.6111 72.2222 63.0208 68.7500
N 6 6 6 6 6 SD 16.6624 21.1914 6.8041 9.5641 10.4583 46-51 Mean 62.8968 60.3009 69.2130 58.9410 64.2361 N 36 36 36 36 36 SD 16.6265 17.0342 15.2778 15.3485 18.6970 52-57 Mean 68.3594 64.1927 69.6615 60.5957 63.8672 N 64 64 64 64 64 SD 15.8302 18.7477 16.0856 17.6831 21.6067 58-63 Mean 70.0893 67.9036 73.5677 63.9160 69.3359 N 64 64 64 64 64 SD 15.3316 15.3709 14.5141 14.7622 16.5066 64-69 Mean 66.0053 63.6574 71.6049 62.0949 63.1944 N 54 54 54 54 54 SD 14.9241 16.5566 14.8824 13.1332 17.4116 Total Mean 67.4745 64.7507 71.2426 61.7048 65.4576 N 224 224 224 224 224 SD 15.6891 17.1856 15.0305 15.2642 18.5756
Total 40-45 Mean 62.3016 60.6481 61.1111 56.5972 54.1667
N 9 9 9 9 9 SD 18.5672 26.3615 19.9826 15.5030 25.7694 46-51 Mean 56.1508 51.6975 62.1914 54.4560 57.8704 N 54 54 54 54 54 SD 18.1766 20.4047 18.1504 15.8719 22.6874 52-57 Mean 60.1935 55.7726 64.4097 56.0872 56.3802 N 96 96 96 96 96 SD 19.8205 20.9459 17.2901 19.2658 24.8015 58-63 Mean 60.5283 60.6771 66.0590 58.2031 62.1094 N 96 96 96 96 96 SD 21.1090 18.2855 19.1273 17.5800 20.5559 64-69 Mean 56.2169 55.8128 64.7119 56.2500 58.4877 N 81 81 81 81 81 SD 19.8188 19.8921 19.3322 17.1448 20.6181
Total Mean 58.7372 56.6592 64.5089 56.4825 58.7054
N 336 336 336 336 336 SD 19.9136 20.1399 18.4745 17.6142 22.3297

137
8.6.6 Comparison of QOL domains and diagnosis by using (F) test
Table 21 shows an existence of variance between-groups sum squares (SSB)
which estimates increases with the effect of the independent variable and
within–groups sum of squares (SSW) which remains constant. The variances
of mean square, F-value, and level of significance between and within group
indicate a significant effect between QOL domains and diagnosis as evidence
is given by physical domain (F 210.12, α .000), psychological domain (F
159.93, α .000), social domain (F 121.34, α .000), environmental domain (F
71.50, α .000) and global value (F 75.02, α .000). It is obvious that diagnosis
(independent variable) has had a real effect on the QOL (dependent variable)
and SSB is really an estimation of the same population variance (sigma) plus
the effects of the independent variable, while SSW is just an estimate of the
same population variance (sigma). We can immediately conclude a rejection
of null hypothesis, which indicates no effect.

138
Table 21
Comparison of QOL domains and diagnosis by using (F) test
(One-way ANOVA)
WHOQOL domains *diagnosis
Combination between and within group
variance Sum of square Degree of
freedom (DF) Mean square F Significance
Physical domain Between-group 51300.109 1 51300.109 210.121 .000
Within-group 81544.734 334 244.146
Total 132844.84 335
Psychological domain Between-group 43997.628 1 43997.628 159.933 .000
Within-group 91883.603 334 275.101
Total 135881.23 335
Social domain Between-group 30469.680 1 30469.680 121.343 .000
Within-group 83868.738 334 251.104
Total 14338.42 335
Environmental domain Between group 18326.954 1 18326.954 71.501 .000
Within-group 85609.959 334 256.317
Total 103936.91 335
Global value Between-group 30638.253 1 30638.253 75.024 .000
Within-group 136398.58 334 408.379
Total 167036.83 335
Level of significance = .05

139
8.6.7 The mean quality of life domains among the case and control
groups by sex
Table 22 shows that the mean quality of life in physical domain is 44.3350,
psychological domain 42.2414, social domain 54.3103, and environmental
domain is 49.7845 among the males in the case group. In comparison to the
male cases, in the control group 70.8128 in physical domain, 70.5101 in
psychological domain, 75.0718 in social domain, and 65.6250 in
environmental domain. The mean quality of life in physical domain is 37.9630,
psychological domain 38.5802, social domain 47.5309, and environmental
domain is 42.0139 among females in the case group. In comparison to female
cases, in the control group 63.8889 in physical domain, 58.5648 in
psychological domain, 67.1296 in social domain, and 57.4942 in
environmental domain. In addition, the total quality of life means among males
in the case and control group at all domains is higher than the total quality of
life means among females in both groups. Overall, mean quality of life in
males and females among the case group is less than the control group in
both sexes at all domains. Families in Gaza Strip are extended, so at least
each married woman has six or seven children. Culturally our society is a
conservative society, and normally women are staying at home working,
looking for children, cooking, washing, ironing, and looking for her husband.
All of that will lead to over stress or pressure, which in turn leads to less QOL
in comparison to men. On the other hand female patients among the control
group not only do better than female patients among the case group, but also
are doing better than males, and this is due to more compliance to the
therapeutic regimen among the control group. The best QOL in the case and

140
control group and in both sexes is among social domain and this is convenient
with our society in the way of respecting the old people.
Table 22
Mean quality of life domains among the case and control groups by sex
Diagnosis Sex Mean Physical domain
Psychological domain
Social domain
Environmental domain Global value
Case Male Mean 44.3350 42.2414 54.3103 49.7845 48.9224 N 58 58 58 58 58 SD 16.9643 16.4542 17.1879 17.8115 22.7357 Female Mean 37.9630 38.5802 47.5309 42.0139 41.2037 N 54 54 54 54 54 SD 13.1139 13.8828 17.0267 16.1830 23.1165 Total Mean 41.2628 40.4762 51.0417 46.0379 45.2009 N 112 112 112 112 112 SD 15.4960 15.3111 17.3697 17.4118 23.1431
Control Male Mean 70.8128 70.5101 75.0718 65.6250 69.0733 N 116 116 116 116 116 SD 13.6527 14.0323 13.9658 15.4364 17.4036 Female Mean 63.8889 58.5648 67.1296 57.4942 61.5741 N 108 108 108 108 108 SD 16.9589 18.1472 15.1075 13.9620 19.0841 Total Mean 67.4745 64.7507 71.2426 61.7048 65.4576 N 224 224 224 224 224 SD 15.6891 17.1856 15.0305 15.2642 18.5756
Total Male Mean 61.9869 61.0872 68.1513 60.3448 62.3563 N 174 174 174 174 174 SD 19.3758 19.9675 17.9813 17.8607 21.5037 Female Mean 55.2469 51.9033 60.5967 52.3341 54.7840 N 162 162 162 162 162 SD 19.9512 19.2773 18.2485 16.4119 22.5997 Total Mean 58.7372 56.6592 64.5089 56.4825 58.7054 N 336 336 336 336 336 SD 19.9136 20.1399 18.4745 17.6142 22.3297

141
8.6.8 Comparison of QOL domains and sex by using (F) test
Table 23 shows an existence of variance between-groups sum squares (SSB)
which estimates increases with the effect of the independent variable and
within–groups sum of squares (SSW) which remains constant. The variances
of mean square, F value, and level of significance between and within group
indicate a significant effect between QOL domains and sex as evidence by
physical domain (F 9.86, α .002), psychological domain (F 18.34, α .000),
social domain (14.59, α .000), environmental domain (F18.24, α .000) and
global value (F 9.904, α .002). It is obvious that sex (independent variable)
has had a real effect on the QOL (dependent variable) and SSB is really an
estimation of the same population variance (sigma) plus the effects of the
independent variable, while SSW is just an estimate of the same population
variance (sigma). We can immediately conclude a rejection of null
hypothesis, which indicate no effect.

142
Table 23
Comparison of QOL domains and sex by using (F) test
(0ne-way ANOVA)
WHOQOL domains *sex
Combination between and within group
variance Sum of square Degree of
freedom (DF) Mean square F Significance
Physical domain Between-group 3810.995 1 51300.109 9.865 .002
Within-group 129033.85 334 244.146
Total 132844.84 335
Psychological domain Between-group 7075.818 1 43997.628 18.348 .000
Within-group 128805.41 334 275.101
Total 135881.23 335
Social domain Between-group 4787.974 1 30469.680 14.598 .000
Within-group 109550.44 334 251.104
Total 114338.42 335
Environmental domain Between group 5383.545 1 18326.954 18.245 .000
Within-group 98553,368 334 256.317
Total 103936.91 335
Global value Between-group 30638.253 1 30638.253 9.904 .002
Within-group 136398.58 334 408.379
Total 167036.83 335

143
Chapter 9
Discussion
The foregoing discussion highlights the importance of compliance with the
therapeutic regimen in the management of hypertension, and prevention of
stroke and reduction of the incidence of stroke. As illustrated in our present
research work, the case-control study has indicated a relation between non-
compliance with the therapeutic regimen and development of stroke.
9.1 Non-compliance with the therapeutic regimen and development of
stroke
In our case-control study, we found evidence of non-compliance with the
therapeutic regimen (anti-hypertensive medication, dietary restrictions of
sodium and fat, weight reduction, exercise program, follow-up health care and
smoking) and development of stroke by logistic regression analysis, and
percentages and frequency distributions as shown in table 10 and 13. The
results of the study were similar to other studies and previous literature
reviews, which have reported that the treatment of hypertension is started
nowadays with non-pharmacological therapy through a modification of lifestyle
such as weight reduction, increase physical activity, moderation of dietary
sodium and fat, limited alcohol intake and avoidance of stress [66]. In
addition, non-compliance with the therapeutic regimen such as anti-
hypertensive medication, dietary restrictions of sodium and fat, weight
reduction, exercise program, and smoking is usually the main cause of
hypertensive complications, mainly stroke [67]. Bronner et al., and Gorelick et
al. show that modification of risk factors is known to decrease the incidence of

144
stroke in asymptomatic people [197, 198] Also Krause and Mahanl show the
proper and successful management of hypertension is going through three
steps, which are anti-hypertensive medication, sodium restriction, and weight
reduction [68]. Other studies regarding anti-hypertensive medication show
that the treatment of moderate and severe hypertension by anti-hypertensive
medication reduces hypertensive complications in general, and stroke
mortality by 50% [69]. MacWalter et al. reported that anti-hypertensive agents
have been clearly shown to prevent both cerebral hemorrhage and cerebral
infarctions [29]. On the other hand the WHO states that the prevention of
stroke by anti-hypertensive therapy has been successful, but more research is
required to evaluate the effectiveness of anti-hypertensive therapy and life
style modification in preventing previous types of stroke and recurrent stroke
[12]. In this regard, our results revealed that patients who developed stroke
were less likely to be compliant with the therapeutic regimen than the
hypertensive patients who did not develop stroke.
9.2 Risk factors which contribute to stroke development
To determine the risk factors which contribute to the development of stroke,
simple logistic regression models, multiple conditional logistic regression
model considering main effects only (no interactions), and multiple conditional
logistic regression model based upon backward selection were used.
9.2.1 Logistic regression analysis In the simple logistic regression analysis we found significant associations
between stroke and medications not taken as prescribed (OR=7.13;95%CI
3.32-15.32), using excessive salt in meals (OR=6.21;95%CI 3.75-10.29),

145
eating diet high in fat (OR=4.66;95%CI 2.87-7.56), no involvement of weight
reduction program (OR=4.97;95%CI 1.72-14.36), no involvement in a regular
program of exercise (OR=4.94;95%CI 2.80-8.73) no follow-up physician
(OR=3.03;95%CI 1.80-5.10), and smoking (OR=2.20;95%CI 1.33-3.62). The
results of this study are matched with other studies in some findings and
differed in others. These results support previous studies, which have
reported direct evidence for obesity [32], inactivity [33] and development of
stroke. Collins and MacMahon have reported that 5-6 mmHg mean decline in
diastolic blood pressure for 5 years led to 38% to 42% reductions in stroke
incidence respectively [150, 151]. In addition, anti-hypertensive medication is
very important in controlling blood pressure, and it was shown to be significant
in decreasing the mortality rate of hypertensive complications such as stroke
[45].
Recent surveys have shown fewer than 30% of hypertensive patients benefit
from treatment, because of non-compliance with medical advice, despite
convincing evidence that anti-hypertensive medication prevents premature
death and suffering from such devastating complications as stroke and heart
attack [73]. Several studies reported that physical activity decreases the risk
for thromboembolic stroke among older non-smokers, and it reduces the risk
of cerebral haemorrhage [76, 77, 78]. Dishman says in the book “Advances in
exercise adherence" that Salonen et al. reported a statistical significant
association between low physical activity and cerebral stroke [79]. Abbott et
al. showed that inactive or partially active old people experienced three to four
fold excess incidence of haemorrhagic stroke in comparison with active old

146
people (p< 0.01) [33]. On the other hand, Kiely and Wolf indicated medium
and high levels of physical activity among men are protective against stroke,
relative to low levels [35]. Another study showed regular physical activity may
be of benefit in preventing stroke in women as well as in men [83].
The WHO stated an important relationship between types of diet and
developing chronic diseases, such as cerebrovascular disease, and
emphasize that hypertension is considered as the main risk factor of stroke in
developing countries with other contributory factors such as increase salt
intake, obesity and alcohol intake [14]. The Framingham Heart study showed
that smoking is a significant and independent risk factor for stroke in general,
and brain infarction in particular [102]. In addition, cohort studies have shown
that cigarette smoking is an independent risk factor for ischemic stroke in both
men [195], and women [196]. Another study shows, current but not former
cigarette smoking is to be significantly associated with an increased risk for
stroke in men [109]. In addition, other studies reported that a compliance with
follow-up treatment guidelines for hypertension could significantly reduce the
risk of stroke [152, 153]. On the other hand, O’Brien et al. showed that the
evidence of anti-hypertensive treatment in the prevention of stroke is less
clear [18].
A WHO expert committee (1996) reported that more studies are required to
evaluate the effectiveness of anti-hypertensive medication in preventing
different types of stroke [12]. The inconsistency of these results may be due to
inappropriate sample size, and lack of controlling of confounding variables. In
our investigation, we considered the limitations of other studies in order to

147
control the confounding variables. We utilized all patients who were
hospitalized during the year of 2001 with stroke and history of hypertension
only, and they were compliant with the therapeutic regimen more than one
year.
9.2.2 Multiple conditional logistic regression model considering main
effects only (no interactions)
In this model we found an association between involvement in regular
program of exercise and development of stroke (OR=0.269; 95%CI 0.127-
0.574) which appeared to be protective. This result is different from the simple
logistic regression analysis, but matches with other studies that show medium
and high levels of physical activity among men are protective against stroke,
relative to low levels [35]. Also regular physical activity may be of benefit in
preventing stroke in women as well as in men [83].
We also found no significant association between smoking and development
of stroke (OR=2.127; 95%CI 0.821-5.513). This result is different from the
simple logistic regression analysis, which indicates a significant association
between smoking and development of stroke (OR=2.200; 95%CI 1.337-
3.621). In addition, Donnan et al. found in a case-control study an odds ratio
of 5.2 for smokers compared to non-smokers for the presence of transient
ischemic attack [154]. Furthermore, we found a significant association
between high level stress (HLS) and development of stroke (OR=2.779;
95%CI 1.434-5.388). This result matches with previous literature reviews,
which have reported that the treatment of hypertension is started today with

148
non-pharmacological therapy through a modification of lifestyle, which
includes a reduction or avoidance of stress [66]. On the other hand, this result
is different from the literature, where little medical evidence is reported that
stress causes stroke; and most strokes occur in people who are not under
great stress [1]. Also Isaacs stated that some stroke patients and their families
think their illness was caused by stress, strain, and emotion such as anger. At
the same time, many people live with stress, but mercifully, these do not end
in strokes [2].
9.2.3 Multiple conditional logistic regression model considering
interaction terms
The results of this model showed a significant association between using
excessive salt in meals and development of stroke with low level of stress
(OR=16.61; 95%CI 4.40-62.80), but this association was completely not
significant with high level of stress (HLS) (OR=1.76; 95%CI 0.58-5.33). This
indicates that using excessive salt in meals is a significant risk factor for
stroke in interaction with low level of stress only. Table 14 shows a protective
factor between regular physical exercise and development of stroke
(OR=0.20; 95%CI 0.09-0.49). This result is similar to the multiple conditional
logistic regression model considering main effects only without interaction
(OR=0.269; 95%CI 0.127-0.574). Also smoking is a significant risk factor for
stroke (OR=9.88; 95%CI 2.52-38.78) with low level of stress. In contrast to
this, smoking is a non-significant protective factor with HLS (OR=0.52; 95%CI
0.14-1.99). This result is different from the multiple conditional logistic
regression model considering main effects only (no interactions), which shows

149
no statistical significant association between smoking and development of
stroke (OR=2.127; 95%CI 0.821-5.513). High level of stress is a significant
risk factor for stroke development (OR=17.74; 95%CI 4.62-68.05) and this is a
similar result to the multiple conditional logistic regression model considering
main effects only without interactions (OR=2.779; 95%CI 1.434-5.388). In
addition, the interaction between smoking and HLS turns out to be a
protective factor for stroke (OR=0.10; 95%CI 0.02-0.58). This indicates that
smokers may benefit from cigarettes in stressful situations. There is also no
significant association between stroke and the interaction term of HLS and
excessive using of salt (OR=1.88; 95%CI 0.58-6.05).
9.3 Differences in quality of life among the case and control groups.
9.3.1 Differences in quality of life using descriptive statistics
Figure 15 shows approximately half of the study population (54%) rating their
quality of life as good and very good among the control group compared with
41% of the case group. More compliance with the therapeutic regimen (anti-
hypertensive medication, dietary restrictions of sodium and fat, weight
reduction, exercise program, follow-up health care and smoking) among the
control group made their quality of life better in comparison to the case group.
The results of this study compared with other studies show that there was
some evidence for beneficial effects of antihypertensive drugs on quality of life
[155]. On the other hand, analysis of interview questionnaires and reports of
dropouts and side effects rates of anti-hypertensive medication among elderly
people show that there are no significant negative effects on quality of life
[156, 157, 190]. At the same time, another study shows that the treatment of

150
systolic hypertension has positive impact on improving the quality of life
among older aged people [192]. In addition, another study shows that active
treatment of the systolic hypertension trial in Europe was associated with
some adverse impacts on quality of life [191], and hypertensive patients
receiving antihypertensive medication have more symptoms and lower health
related quality of life. Differences were detected by both a brief, general health
related quality of life instrument and a detailed, disease-specific instrument
[193]. Figure 16 shows approximately two third of the study population were
satisfied or very satisfied with the state of health among the control group
compared with one fourth among the case group. The high percentage of
satisfaction with the health status among the control group is due to more
commitment to the therapeutic regimen in comparison to the case group. On
the other hand, may be the low income and poverty explains the low
satisfaction rate among the case group. This result matches with the
Palestinian Red Crescent Society report, which shows that the unemployment
rate in the West Bank and Gaza Strip is estimated to 53%, and the
percentage of Palestinians living below the poverty line to 64%. In contrast,
21.1% of the population was below the poverty line prior to the outbreak of the
Intifida in September 2000 [194]. In addition Raphael D, 2003 said that “one of
the greatest determinants of health is income. In other words, if you are poor,
you are more likely to have heart disease." Also Sandeman G, 2003 said that
"we need to understand that health care is not only about building hospitals
and hiring doctors. If we can reduce poverty, we can reduce ill health" [199],
and if the country as a whole was more wealthy then there ought to less
poverty [200]. Figure No. (17) shows approximately two third of the study
151
population among the control group were not at all or a little had pain which
impaired the ADL compared to about one fourth among the case group. In
addition, approximately two third of the study population among the case
group were very much and extremely had pain impaired the ADL compared to
one fourth among the control group. This variation between the case and
control group is due to a higher compliance rate at taking the medication as
prescribed and at proper time among the control group. Figure No. (18) shows
that two third of the study population among the case group are very much
and extremely in need for medical treatment to manage their daily life
compared with the control group 27%. There were no big differences in the
way of enjoying life among the case and control group. This could be due to
political reasons and some circumstances such as incursion, curfew, closure,
assassination, demolition of houses, and destruction of infrastructure as
shown in figure No. (19). The society looks to the chronic disease patients as
disabled persons, which affect the way the patients feel about their existence
and values. In comparison to the control group the majority of the cases as
shown in figure No. (20) feel that their life is unmeaning in a way or another
and this is due to the extent of perceiving and coping with the chronic disease.
Figure No. (21) shows approximately half of the control group has very much
and extremely the ability to work with concentration and this could be due to
low negative feelings such as depression and despair as shown in figure 40
than the case group. This result matched with another study, which showed
that depressed stroke patients experienced more impairment of concentration
and memory function than non-depressed stroke patients [158]. The low
percentage of working with concentration among the control group could be

152
due to the adverse reaction of antihypertensive drugs such as dizziness and
fatigue. This result matched with other literature review, which showed
antihypertensive drugs are often blamed for numerous nonspecific symptoms,
such as fatigue, dizziness, and sexual function, and drugs to lower blood
pressure are commonly believed to reduce quality of life [159]. There are no
big differences in both groups regarding feeling of safety in their daily life as
shown in figure No. (22). The main reason of that could be physical or
emotional trauma that most people face in Gaza Strip due to unstable political
situation. As we see in figure No. (23) a considerable amount of patients in
both groups felt their physical environment is unhealthy. This could be due to
high-density rate of population in Gaza Strip. Also air pollution, noise pollution,
crowded houses, bad ventilation and unhealthy sewage system make the
problem of physical environment more worse. On the other hand, many
people in Gaza Strip are living in urban area, which make a good amount of
patients in both groups have a better physical environment. In addition, the
location and residency of patients (urban or rural) affect the health in their
physical environment. Approximately one-third among the case group were
not at all had enough energy for every day life in comparison to 3% of the
control group as shown in figure No. (24). This difference between the two
groups is due to the way the patient cope with chronic disease, because each
human being is mentally, socially, and physically unique. Figure No. (25)
shows a high rate of accepting body appearance. Religious background such
as faith and destiny is the main cause of this issue between both groups. This
result matches with other studies, which found a significant relation between
religious attendance, religious feelings, and health [160, 161]. The economical
153
status in Gaza Strip is very bad especially during uprising. The result of figure
No. (26) shows that the majority of the control group and about half of the
case group did not face any serious economical problem in meeting their
needs. This result does not reflect the bad economical status in Gaza, but the
aids of the international community substituted the low-income rate by
providing the basic needs for the people such as (flour, rice, sugar, and oil).
As shown in figure No. (27) the high rate of the available information that the
patients need in their daily life does not reflect a high level of health education
standard in our society, but because our society is considered to be socially
attached and patients in both groups could get information from relative or
neighboring health professional personnel. Figure No. (28) shows two third
among the control group had moderately, mostly, and completely the
opportunity of leisure activities in comparison to about one third among the
case group. High compliance rate with the therapeutic regimen among the
control group in comparison to the case group gave them the opportunity and
the motivation to enjoying some leisure activities. Figure No. (29) shows
approximately more than two third among the control group and one-third
among the case group were good and very good of the ability of getting
around. This high rate of getting around does not reflect good and very good
state of health and QOL in both groups, but old people in our society play a
major role in decision making regarding social occasion like wedding,
funerals, and problem solving even the patients were sick they felt socially
obliged to participate in such occasions. Approximately More than 80% of the
control group and 50% of the case group were satisfied and very satisfied with
their sleeping pattern as shown in figure No. (30). This high rate of sleeping

154
satisfaction between both groups does not reflect the state of health, safely
environment, and very good QOL, but Faith and dependence on God play
major role. Also more compliance with the therapeutic regimen among the
control group made some differences with the case group regarding sleeping
satisfaction. Figure No. (31) shows 78% were completely satisfied with their
performance of daily life activities in comparison with 46% among the case
group. Differences between the two groups might be due to the high rate of
depression 91% among the case group as shown in figure No. (40). This
result is not surprising because depression has been associated with poorer
physical function [162]. Figure No. (32) shows approximately more than two
third 71% of the control group were satisfied with their capacity for work. This
high rate of satisfaction is related to the absence or a little of physical pain
which influence patients activity of daily living as shown in figure No. (17), and
made it better for their capability of performing their jobs. Also about one third
of the case group was satisfied with their capacity for work, this low rate of
satisfaction is due to inability to concentrate as 41% of the case group was
unable to concentrate properly which negatively affected their capacity of
work as shown in figure No. (21). Figure No. (33) shows that 88% of the
control group were completely satisfied with their self in comparison with 56%
of the case group. The difference between the two groups is due to the way
individual accept, cope and live with the disease. Figure No. (34) shows a
high rate of satisfaction with personal relationships among the case and
control group because we are living in a well-related society and the patients
feel obliged to relate with others. Nevertheless, we still see a small rate of
unsatisfied patients; this might be due to personality characteristic such as

155
loneliness, isolation, and depression. Approximately about half of the study
population was satisfied with their sex life among the control group compared
with one third among the case group as shown in figure No. (35). We see
unexpected results because the hypertensive patients in Gaza Strip have an
idea that antihypertensive drugs cause sexual impairment, but in fact, some
antihypertensive drugs may cause impotence as undesired side effect. In
figure No. (35), we expected the case group who were less compliant to
antihypertensive drugs to be more satisfied with their sexual life, but the study
showed 28% of the case group subjects were satisfied with their sexual life.
Meanwhile the subjects in the control group who were more compliant to
antihypertensive drugs had a better satisfaction rate of sexual life. This result
differed from other literature review, which showed antihypertensive drugs are
often blamed for numerous nonspecific symptoms, such as fatigue, dizziness,
and sexual function, and drugs to lower blood pressure are commonly
believed to reduce quality of life [159]. The results of this scientific study
motivate us to build a health education program at secondary and tertiary
health prevention about how compliance to the therapeutic regimen is helpful
to improve patient's quality and sex life. Figure No. (36) shows that 91% of the
control group were satisfied with the support of their friends, because
friendship relations are very strong among all society sectors. On the other
hand, about 51% of the case group were unsatisfied with the support of their
friends. This is due to the state of depression they feel as shown in figure No.
(40). Non-acceptance of the disease, low self-esteem, feeling isolated, and
despair are other reasons. This result is matched with other studies, which
showed that lack of social support has been associated with increased

156
mortality risk [163] and delayed recovery from disease [164]. Considerable
amounts of the case and control group are satisfied with the conditions of their
living place as shown in figure No. (37). This result was unexpected, but
people in both groups are trying to accept the conditions of their living place,
because they are unable to change, and they have to cope and modify their
life to meet their needs. Figure No. (38) shows that 41% of the case group
was unsatisfied with their access to health services, but this does not mean
that these people did not get an access to health services, but it means that
they faced many difficulties such as closure, and incursion. The mean
problem is not the access of health services, but the problem is, whether
these patients receiving a good quality of care or not because of the high
number of patients compared with low number of physicians and health
providers. Figure No. (39) shows 56% of the case group had some difficulties
might made them feel unsatisfied for example they did not have private cars,
and they had to walk some distances to reach the transport station. Some
people had very bad financial situation made them unable to afford transport
fees. As shown in figure No. (40), ninety-one percent of the case group had
the negative feeling of blue mood, despair, anxiety, and depression compared
with 26% among the control group. This gave us a clue to why they had low
QOL rate, because as we know depressed stroke patients experienced more
impairment of concentration and memory function than non-depressed stroke
patients [158]. Also this result is not surprising because depressive symptoms
have been reported to be associated with many medical conditions [165].

157
9.3.2 Differences in quality of life by ANOVA and F-test
Table 16 shows the global value among the QOL domains is quite similar, but
we have some differences in QOL domains. The best QOL is among
psychological and social domains in general between the ages group (58-63),
because in our society old people play an important role in decision-making,
and problem solving in comparison with young people. In general, there is no
perfect correlation between quality of life domains and age group. Also table
17 shows the variances of mean square, F value, and level of significance
between and within group indicate no significant effect between QOL domains
and age as evidence by physical domain (F 0.94, α 0.43), psychological
domain (F 1.96, α 0.09), social domain (F 0.45, α 0.76), and environmental
domain (F 0.42, α 0.79). It is obvious that age (independent variable) has no
real effect on the QOL (dependent variable). Meanwhile table 18 shows the
mean quality of life in the case and control groups among males is better than
females in all domains and age groups. This result is expected because we
are living in a conservative society, and physiological structure of females
may affect their QOL such as menstruation, and menopause [184, 185, 186].
In addition, quality of life and in all domains in our study is lower than in the
German general population due to unsafely, less quality and quantity of water,
inadequate food hygiene, and municipal services [10]. Table 19 and 20 show
that the overall mean quality of life domains among the case group is less
than in the control group regarding diagnosis and age group. More
commitment with the therapeutic regimen among the control group made a
better QOL in comparison with the case group who were less compliant.
Table 21 shows the variances of mean square, F value, and level of

158
significance between and within group indicate a significant effect between
QOL domains and diagnosis as evidence by physical domain (F 210.12, α
.000), psychological domain (F 159.93, α .000), social domain (F 121.34, α
.000), and environmental domain (F 71.50, α .000). It is obvious that the
diagnosis (independent variable) has had a real effect on the QOL (dependent
variable). This provides evidence that patients who developed stroke had
less QOL than the hypertensive patients who did not develop stroke. Table 22
shows the mean quality of life among males in the case and control groups at
all domains is higher than the total quality of life mean among females in both
groups. In my point of view, we are living in extended family, and normally
women are staying at home working, and looking after children, that may lead
to over pressure that in turn leads to less QOL in comparison to males who
have more freedom. Overall, mean quality of life in males and females among
the control group is higher than the case group due to more compliance rate
with the therapeutic regimen. Table 23 shows the variances of mean square,
F value, and level of significance between and within group indicate a
significant effect between QOL domains and sex as evidence by physical
domain (F 9.86, α .002), psychological domain (F 18.34, α .000), social
domain (14.59, α .000), and environmental domain (F18.24, α .000). It is
obvious that sex (independent variable) has had a real effect on the QOL
(dependent variable). In general, we can say the detailed quality of life data in
our study has shown significant differences between men and women in all
aspects of quality of life domains. Our available data showed a clear, and
statistically significant gender differences regarding quality of life. Men
reported a significant improvement in general well-being (physical,
159
psychological, social, and environmental) in both case and control groups.
Also men and women among control group reported a significant
improvement in all domains compared with case group in both sexes. Overall,
mean quality of life domains among the case group is less than the control
group at all ages. These results differ with other previous studies, which have
reported that the most important barriers which prevent blood pressure control
is the side effect of anti hypertensive medication such as fatigue, dizziness,
and sexual function, which in turn impaired patients activity of daily living and
quality of life [118, 119,120].
9.4 Existence of seasonal pattern and the occurrence of stroke
In our study, we found clear evidence of a seasonal pattern for the
development of stroke. The highest peak of occurrence was during autumn,
and winter. These results support results of previous studies, which have
reported the highest stroke incidence rates occurring during autumn [112],
and winter [113]. However, other studies do not report evidence supporting
seasonal variation in stroke rates [111].

160
9.5 Methodological considerations
9.5.1 Strengths of the study
This study is an epidemiological, a pair matched case-control study, which is
the strengthen type of retrospective design and the most appropriate method
to study etiology and clinical questions (187, 188).
An important strength of this study is the similarity between cases and
controls with regard to extraneous variables, which enhanced the presumed
cause of the disease.
Sophisticated statistical procedure (conditional logistic regression analysis)
was used to test a hypothesized causal chain among a set of independent
variables and stroke.
The sample size was adequate to carry out this study. The choice of a larger
sample size and the potential inclusion of all registered cases in a certain area
ensures a higher degree of confidence that the sample represents partly the
population under study, decreases type II error (beta error), and increases the
power of statistical tests (189).
Exclusion of some cases due to exclusion criteria has a powerful and positive
impact on the study results. Seven subjects over 69 years old were excluded
from the study to prevent a negative effect of age as a confounding variable
on the quality of life (QOL). Ten subjects, who participated in the pilot study
were excluded to prevent testing effect (the effects of taking pre-test on the
161
scores of post test) as a threat to internal validity [170]. Computer tomography
scan of the brain is the main diagnostic procedure in case of stroke [3].
Excluding of subjects, who did not do computer tomography scan of the brain
had a positive impact on the study results by preventing any confounding
variables such as aneurysm, which may affect the dependent variable
(stroke). High rate of inclusion of cases, and excluding certain subjects, who
had a second attack of stroke, helped that only factors of non-compliance with
the therapeutic regimen were regarded as potential independent variables
with an effect on stroke as dependent variable. Exclusion criteria provided a
method to control confounding factors.
9.5.2 Limitations of the study
Despite its strengths, the study has also some limitations such as:
1. Recall bias: The capacity of the memory 1 year before stroke might be
affected by the stroke itself and this may lead to higher or poorer scores in the
quality of life. We tried to minimize and overcome such problems by obtaining
the information from both family and patients especially in stroke patients who
had problems or were unable to communicate verbally with the interviewers.
In addition, we used the patients’ file or chart in case of ambiguous
information.
2. Information bias: Structured interviews were used by trained interviewers to
collect data, so the information is self-reported regarding fat, and salt diet,
medication, health-care-follow-up, exercise, and smoking. We tried to
minimize and overcome such problem by assessing the quality of data in the

162
early stage by test-retest methods to ensure the reliability of the information.
Also the data values for key variables were examined to determine any
anomalies, such as limited variability, extreme skew, or the presence of
ceiling or floor effects.
3. Selection bias: Cases have been selected from the wards and via medical
records. To minimizes and overcome a selection bias the patients’ names
were obtained twice independently from the Disease Registry Office, and from
the ward where the patients were admitted. In addition, during the study, we
always compared the background characteristics of the case and control
groups to check for selection bias. Also other methods were used such as
matching, homogeneity, and blocking to control extraneous variables.
163
Chapter 10
Conclusion
Managing hypertensive individuals at risk of stroke requires sustained
enthusiasm by physician, nurse, patient, and family. There are many areas
where intervention matters most such as smoking, hypertension, obesity, lack
of exercise, psychological and environmental stressors, and dietary
restrictions. These should be addressed energetically, explaining that life-long
therapy will be required, with regular checks as necessary. Awareness that
multiple drug therapy may be required is an area for education for both patient
and physician. Putting into practice these ideas should be our daily work.
A pair matched case-control design was undertaken at the three main
governmental hospitals, and administratively related primary health care
clinics in Gaza Strip. All available discharge data of patients from the three
main hospitals in Gaza Strip were screened for cases, and Controls derived
from the same primary health care clinics where cases used to receive follow-
up appointments before the development of stroke. The total sample of the
case group was 112 subjects (58 men and 54 women) with stroke and history
of hypertension, and the control group composed of 224 subjects (116 men
and 108 women) matched with age, sex, period of duration with the
therapeutic regimen, enrolment location, and with single history of
hypertension. The main objectives of the study were to ascertain whether an
association exists between non-compliance with the therapeutic regimen (Anti
hypertensive medication, dietary restrictions of sodium, weight reduction,
exercise program, follow-up health care, and smoking), and the development

164
of stroke among hypertensive patients, and to determine the risk factors which
contribute to the development of stroke. Also we need to evaluate the
differences in quality of life among case, and control groups one year before
the study, and to assess the existence of seasonal pattern and the occurrence
of stroke.
It was observed that lowering of blood pressure by lifestyle modifications and
medication prevents hypertensive arteriolar stroke. Our study provided a firm
knowledge base for controlling hypertension in order to decrease the
incidence and risk of stroke. In addition, it provides a clear evidence of the
effectiveness of pharmacologic (anti-hypertensive medication) and non-
pharmacologic (weight reduction, exercise program, low salt diet, follow-up
care and stop smoking) treatment in reducing the risk of stroke. There is a
significant relationship between non-compliance to medication and
development of stroke. A similar relationship is found between using
excessive salt in meal, eating diet high in fat and development of stroke.
While there is a clear and significant association between HLS and
development of stroke considering the main effects without interaction terms.
In addition, the same association present between HLS and development of
stroke, but conditioned by not smoking and usage of excessive salt
considering an interaction terms based upon backward selection. On the other
hand, the analysis of variance shows no significant effect between the age
and quality of life domains, but the significant association is present between
sex and quality of life. In addition, the patients, who developed stroke, had
less quality of life than the hypertensive patients, who did not develop stroke.

165
Overall quality of life and at all domains is less than in the German general
population at the same domains. Also evidence was found between stroke
development and seasonal pattern.

166
Chapter 11
Recommendations
11. 1 Policy and management
Stroke is a public health problem; it causes high morbidity, invalidism, and
death. In addition, it can be prevented easily by controlling of hypertension
through life style modifications. This thesis provides an outline of the existing
state of compliance with the therapeutic regimen, and it makes suggestions
for a community approach to prevent and control hypertension in order to
prevent stroke development. Many major issues will be addressed: First,
more attention must be directed toward development of an effective health
education program at secondary and tertiary care facilities, based on sound
theory by enhancing patient compliance to be with respect to their health
behavior, and to have adequate knowledge concerning illness and treatment
regimens. A second concern, shared by all, is the delineation of future
directions for compliance research, along with the potential for application of
these findings in clinical practice. A third concern is to provide the basis for
appropriate public health intervention, epidemiological estimates of the
prevalence of stroke and the level of risk factors leading to brain attack.
11.2 Implications for future research
More research studies are needed for a deeper understanding of the
determinants of compliance with the therapeutic regimen mainly physical
activity, obesity, over weight, stress, and smoking in order to prevent
hypertensive complications such as stroke.
167
Due to some limitation and weakness of the study such as recall, and
information biases, further research studies and recommendations are
needed to:-
a. Examine the association between cigarette smoking and development of
stroke.
b. Examine the relation between the level of physical activity and
development of stroke.
c. Evaluate the effectiveness of antihypertensive therapy in preventing various
types of stroke.
d. Evaluate the quality of life among compliance and non-compliance with the
therapeutic regimen especially medication and life style modifications.
e. Determine the association between body size/weight (BMI) and fat
distribution as predictors of stroke.
f. Determine the association between level of stress and development of
stroke.
11.3 Implications for health promotion
The last part of this study focuses on recommendations and implications for
health promotion that may have immediate or long term effect on the
compliance with the therapeutic regimen among the Palestinian
community in general. A health belief model, and behavior modification
strategies, and social and psychological support should be involved in a large
scale of any health education program. Much work remains to be done to
identify elements of the client-provider relationship that is associated with

168
compliant behavior. Patient education, family counseling, and use of social
support networks should be involved in any health education program to
improve more compliance with the therapeutic regimen. Investment in
program which aims to promote more compliance with the therapeutic
regimen implies a long term cost-effective and not a too heavy burden on the
Palestinian health system. Early detection and prevention of hypertensive
complications implies early intervention at low cost comparing to the cost of
hypertension related complications such as, the cost of treating stroke, renal
failure, ischemic heart disease and its implications. New preventive public
health strategies must be applied to prevent these costly health conditions.
Improving and increasing compliance with the therapeutic regimen in
Palestine is not the responsibility of the physicians, nurses, pharmacist, and
dietitian, but it is the responsibility of the whole community including, patient,
family, and media and information. All of them should play effective role and
cooperate with each others in order to achieve an optimal outcome. The
health education department in the Ministry of Health should take the leading
role and initiate coordination between the different ministries, and community
institutions in order to setup a national hypertensive health education program
which aims at improving compliance with antihypertensive medication, healthy
behavior, and life style to maintain well being of hypertensive patients.
Also adequate number of the qualified doctors, nurses, psychologist, and
sociologist which should be involved in health education due to the crowded,
which happens in the primary health care clinic. Because of high prevalence
169
of hypertension among population in Gaza strip, there should be justifiable
concern about the knowledge and misconceptions of the disease in order to
control blood pressure and prevent the incidence of stroke and side effect of
medication by less cost. In addition, preventive and general therapeutic
measures must be forthcoming by ascertaining more precisely the role of
weight control, dietary factors modifications (salt and fat), stop smoking, and
performance of exercise.
Other suggestions for increasing patient compliance with antihypertensive
medication should be involved in a health education program such as
patients’ education about the importance of following drug regimen as
prescribed, reconfirmation of follow-up appointment by telephone, and asking
for compliance obstacles. However, other concerns should be taken regarding
lifestyle counseling, because it is effective for some patients especially in mild
and moderate hypertension, and it is probably not desirable to maintain
hundreds and thousand of people in Gaza Strip on decades of drug treatment,
if there are safe and inexpensive alternatives treatments. It is suggested that,
once an individual with hypertension is identified, evaluated clinically, and
treated, the control of the problem and the compliance of the patient will be
ensured only by a clear understanding of the patient about his disease, and
by continuing interest of the physician and allied health personal in the patient
and his condition. It is recommended that studies must be initiated to facilitate
better understanding of the problems of compliance. Successful and long-
term prevention strategies of stroke using a control of hypertension in Gaza
Strip should be based on an effective community health program. This

170
requires a full cooperation, and involvement of all individuals such as health
personal, patients, family, volunteer, and helpers.
The main implication for health promotion is to activate, and expand the
nurses' role in the management of the hypertensive patient to have greater
impact in patient care management, because the nurses see the patient for
the longest periods and act as coordinators of their care. As resource
persons, we answer the patients' questions; identify their problems, and
performing nursing diagnosis. We are assessing, planning, implementing, and
evaluating compliance with therapeutic regimen as well as response to it. Also
in developing countries especially in Gaza Strip, where a major an increased
incidence rates of cerebrovascular disease are projected to occur, the
prevention of hypertension through population-based measures to improve life
style is strongly recommended.

171
CHAPTER 12
BIBLIOGRAPHY
1. Mulley G. (1993). Stroke (A handbook for the patient's family).
London, UK.
2. Isaacs B. (1985). Understanding stroke Illness. Glasgow, London.
3. Smeltzer SC, Bare BG. (1996). Bruner and Suddarth's textbook of
medical-surgical nursing-8th ed./. Lippencott Company, USA.
4. The Status of Health in Palestine (1999). Annual Report of the
Ministry of Health, the Palestinian National Authority, Palestine.
5. The Status of Health in Palestine (2000). Annual Report of the
Ministry of Health, the Palestinian National Authority, Palestine.
6. Palestinian National Authority (2000). Palestinian Monetary
Authority. Statistical bulletin.
7. Harlem G. (2002). Health situation of Palestinian people living in the
occupied territory. Report of World Health Organization.
8. Developing the occupied territories: An investment in peace (1993).
Report of the Word Bank, vol.6, human resources and social policy,
Washington, USA.
9. The interim action plan: addressing immediate health needs for
Palestinians (1994). Report of the Palestinian Council of Health, MOH,
Palestine.
172
10. The Status of Health in Palestine (1997). Annual Report of the
Ministry of Health, the Palestinian National Authority, Palestine.
11. Christopher M, and Lopez A. (1996). Global Burden of Disease.
12. World Health Organization Expert Committee (1996). Hypertension
control. Geneva, Switzerland.
13. Jackson G. (1996). Hypertension in women. London, UK.
14. WHO (1990). Diet, nutrition, and prevention of chronic diseases.
Technical Report Series 797, Geneva.
15. Lopez A, Caselli G, and Valkonen T. (1995). Adult mortality in
developing countries. Oxford University Press. New York, USA.
16. Hayes M. (1991). A preventive approach to stroke. Nursing Clinic of
North America (Stroke), 26 (4): 931-942.
17. Gehr E. (1991). Etiology of stroke subtypes. Nursing Clinic of North
America (Stroke), 26 (4): 943-956.
18. O'Brien AA, Rajkumar C, and Bulpitt CJ. (1999). Blood pressure
lowering for the primary and secondary prevention of stroke: treatment
of hypertension reduces the risk of stroke. J Cardiovascular Risk, 6
(4): 203- 205.
19. Pearson BJ, Bath PM, and Spence JD. (2000). Hypertension in
patient presenting with stroke. Current Hypertension Report, 2(6):
551-557.
173
20. Stein A, Stoyanovsky V, et al. (2000). Prevalence, awareness,
treatment, and control of hypertension in a working Bulgarian
population. European Journal of Epidemiology, 16: 265-270.
21. Kuller L. (2000). Epidemiology and prevention of stroke, now and in
the future. European Journal of Epidemiology, 22 (1): 14-16.
22. Leathy N. (1991). Complications in acute stage of stroke. Nursing
Clinic of North America (Stroke), 26 (4): 971-983.
23. Bronstein K. (1991). Psychological components in stroke
(Implication for adaptation). Nursing Clinic of North America (Stroke),
26 (4): 1007-1017.
24. Langhorne P. (1999). Measures to improve recovery in the acute
phase of stroke. Official Journal of the European Stroke Council,
9 (suppl 5): 2-5.
25. Soucek M. (2001). Hypertension and cerebrovascular strokes. Vnitr
Lek, 47 (12): 868-874.
26. De Freitas GR, and Bogousslavsky J. (2001). Primary stroke
prevention. Eur J Neurol, 8 (1): 1-15.
27. MacMahon S, et al. (1990). Blood pressure, stroke, and coronary
heart disease. Lancet, 335: 765-774.
28. Zanchetti A, Sleight P, Birkenhager WH. (1993). Evaluation of
organ damage in hypertension. Journal of hypertension, 11: 875-882.

174
29. Macwalter R, Ersoy Y, and wolson R. (2001). Cerebral
hemorrhage. Gerontology, 47: 119-130.
30. Stephenson K. (1999). Hypertension management: Incorporating
the JNC-V1. Recommendation in clinical practice. JNC-V1.
31. Sacks F, Svetkey L, et al. (2001). Effect on blood pressure of
reduced dietary sodium and the dietary approaches to stop
hypertension (DAASH ) diet. Journal of Medicine, 344 (1): 3-9.
32. Walker S, Rimm E, et al. (1996). Body size and fat distribution as
predictors for stroke among United State men. American Journal of
Epidemiology, 144 (12): 1143- 1150.
33. Abbott R, Rodriguez B, et al. (1994). Physical activity in older
middle-aged men and reduce risk of stroke: The Honolulu Heart
Program. American Journal of Epidemiology, 139 (9): 881-893.
34. Amanda G, Thrift J, et al. (1998). Three important subgroups of
hypertensive persons at great risk of intracerebral hemorrhage.
Hypertension, 31: 1223-1229.
35. Kiely D, Wolf P, et al. (1994). Physical activity and stroke: The
Framingham Study. American Journal of Epidemiology, 140 (7): 608-
620.
36. Emery E, Schmid T, Kahn H, and Filozof P. (1993). A review of the
association between abdominal fat distribution, health outcome
measures, and modifiable risk factors. American Journal of Health
Promotion, 7 (5): 342-353.

175
37. MacMahon S, et al. (1987). Obesity and hypertension:
epidemiological and clinical issues. European Heart Journal, 8: 57-70.
38. Elliott P. (1991). Observational studies of salt and blood pressure.
Hypertension, 17: 103-108.
39. Paffenbarger RS, et al. (1983). Physical activity and incidence of
hypertension in college alumni. American Journal of epidemiology,
117:245-257.
40. Alter M, Friday G, Lai SM, Connel JO, and Sobel E. (1994).
Hypertension and risk of stroke recurrence. American Heart
Association, 25 (8): 1605-1610.
41. American Heart Associations (2001). Heart and Stroke Statistical
Update, stroke, ICD/9 430-438.
42. Statistisches Bundesamt (1994). Statistical year book for the
Federal Republic of Germany. Stuttgart, Germany.
43. Udea K, Omae T, Hirota Y, et al. (1981). Decreasing trend in
incidence and mortality from stroke in Hisayama residents, Stroke,
Japan, 12: 154-160.
44. Australian Institute of Health and Welfare (1999). Heart, stroke, and
vascular diseases. Heart Foundation of Australia, AIHW catalogue No.
CVD 7.
45. Perry H, and Smith W. (1978). Mild hypertension: To treat or not to
treat. New York academy of science, USA.

176
46. Janz N, Becker M. (1984). The health believe model: A decade
later. Health Education, 11: 1-47.
47. Taylor S. (1986). The modification of health behaviors. Internal
Health Psychology, New York, pp 68-103.
48. Dictionary of public health promotion and education (terms and
concept) (1996). London, UK.
49. DeVon H, Powers M. (1984). Health beliefs, adjustment to illness,
and control of hypertension. Research Nursing Health, 7: 10-12.
50. Damrosch S. (1991). General strategies for motivating people to
change their behavior. Nursing Clinics of North America (Health
Promotion), 26 (4):833-843.
51. Krasnergor N, Epsten L, Johnson S, and Yaffe S. (1993).
Development aspects of health compliance behavior. Lawrence
Erlbaum Association, New Jersy, USA.
52. Fletcher R, Fletcher S, and wanger E. (1996). Clinical epidemiology
(the essential). Williams and Wilkins, USA.
53. Raphael D, Brown I, Renwick R, and Rootman I. (1996). Quality of
life indicators and health: current status and emerging conceptions.
Toronto, Canada.
54. Lerner D, and Levine S. (1994). Health related quality of life
(origins, gaps, and directions). Advances in Medical Sociology, 5: 43-
65.

177
55. Grant M, and Rivera L. (1998). Evolution of quality of life in
oncology and oncology nursing (quality of life from nursing and patient
perspective). Jones and Bartlett, London, UK.
56. Fergusson and Martin (1991). Minidictionary for nurses (2nd
edition). Oxford, UK.
57. Strasser T, and Wilhelmsen L. (1993). Assessing hypertension
control and management (European series, N0. 47). WHO Regional
Publications, Copenhagen.
58. Hill M. (2000). Comprehensive hypertension care in young urban
black men. Nursing Clinics of North America (Clinical Genetic), 35 (3):
773-793.
59. Kozuch J. (2000). Non Steroid Anti-Inflammatory Drugs (NSAIDs)
and antihypertensives: An unhappy union. American Journal of
Nursing, 100 (6): 40-42.
60. Dawber TR. (1980). The Framingham Study: The Epidemiology of
Atherosclerotic Disease. Harvard University Press, Cambridge.
61. Hock N. (1991). Brain attack (the stroke continuum). Nursing
Clinics of North America, 34 (3): 689-714.
62. Ozer M, Materson R, and Caplan L. (1994). Management of
persons with stroke. Mosby, USA.
63. Fiebach, N, Hebert, P, et al. (1989). A prospective study of high
blood pressure and cardiovascular disease in women. American
Journal of Epidemiology, 130 (4): 646-654.

178
64. Teunissen L, Rinkel G, Algra A, et al. (1996). Risk factors for
subarachnoid hemorrhage (A systematic review). American Heart
association, 27: 544-549.
65. Selmer R. (1992). Blood pressure and twenty-year mortality in the
city of Bergen, Norway. American Journal of Epidemiology, 136 (4):
428-440.
66. Lahdenpera TS, and Kyngäs HA. (2000). Levels of compliance
shown by hypertensive patients and their attitude toward their illness.
Issues and Innovations in Nursing Practice, 34 (2): 189-195.
67. Edward DF. (1999). Improving treatment effectiveness in
hypertension. Internal Medicine, 159: 22-27.
68. Krause M, and Mahan L. (1979). Food, Nutrition, and Diet Therapy
(sixth edition). Saunders Company, USA.
69. Hockenberry B. (1991). Multiple drug therapy in the treatment of
essential hypertension. Nursing Clinics of North America, 26(2): 417-
436.
70. Johannesson M. (1991). Economic evaluation of hypertension
treatment. Linköping Studies in Arts and Science, Sweden.
71. Kotchen JM, Moore RW, et al. (1986). Impact of a rural high blood
pressure control program on hypertension control and cardiovascular
disease mortality. JAMA, 255: 2177-2182.
72. Trottier D, Kochar M. (1991). Managing Isolated systolic
hypertension. American Journal of Nursing, 93 (10): 51-53.
179
73. Stuart R. (1982). Adherence, compliance, and generalization in
behavioral medicine. New York, USA.
74. Sackett DL, and Snow JC. (1979). Magnitude of compliance and
noncompliance. Baltimore: Johns Hopkins University Press, USA.
75. Klug G. (1992). Wellness: Exercise and physical fitness. Dushkin
Publishing Group, Guilford, USA.
76. Agnarsson U, Thorgeirsson G, Sigvadason H, and Sigfusson N.
(1999). Effects of leisure-time physical activity and ventilatory function
on risk for stroke in men. Annals of Internal Medicine, 130 (12): 987-
990.
77. Abbott RD, Rodriguez BL, Burchfiel CM, and Crub JD. (1994).
Physical activity in older middle aged men and reduced risk of stroke:
The Honolulu Heart Program. American Journal of Epidemiology, 139:
881-893.
78. Strachan DP. (1991). Ventilatory function as a predictor of fatal
stroke. BMJ, 302: 84-87.
79. Dishman R. (1994). Advances in exercise adherence. Library of
Congress Cataloging, USA.
80. Blanchard E, Martin J, and Dubbert P. (1988). Non-drug treatment
for essential hypertension. Pergamon Press, New York, USA.
81. Weinberg R, and Gould D. (1995). Foundations of sport and
exercise psychology. Human Kinetics, USA.

180
82. Wilmore J, and Costill D. (1994). Physiology of sport and exercise.
Human Kinetics, USA.
83. Gillum R, Mussolino M, and Ingram D. (1996). Physical activity and
stroke incidence in women and men. American Journal of
Epidemiology, 143 (9): 860-872.
84. Anspaugh D, and Tucker L. (1996). Risk factors for cardiovascular
disease among exercising versus non-exercising women. American
Journal of Health promotion, 10 (3): 171-174.
85. Field A, Byers T, et al. (1999). Weight cycling, weight gain, and risk
of hypertension women. American Journal of Epidemiology, 150 (6):
573-579.
86. Folsom AR, Kaye SA, Sellers TA, et al. (1993). Body fat distribution
and 5 year risk of death in older women. JAMA, 269: 483-487.
87. Manson JE, Stampfer MJ, Hennekens CH, et al. (1987). Body
weight and longevity (A reassessment). JAMA, 257: 353-358.
88. Stamler J, Farinaro E, Mojonnier LM, et al. (1980). Prevention and
control of hypertension by nutritional hygienic means. JAMA, 243:
1819-1823.
89. Lapidus L, Bengtsson C, Larson B, et al. (1984). Distribution of
adipose tissue and risk of cardiovascular disease and death: a 12 year
follow-up of participants in the population study of women in
Gothenburg, Sweden. Br Med J, 289: 1257-1261.

181
90. Pamuk ER, Williamson DF, Madans J, et al. (1992). Weight loss
and mortality in a national cohort of adults, 1971-1987. American
Journal of Epidemiology, 136: 686-697.
91. He J, Chen J, Qian M, et al. (1994). Body mass and blood
pressure in a lean population in southwestern China. American Journal
of Epidemiology, 139 (4): 380-389.
92. Rainwater D, Mitchell B, et al. (2000). Association among 5 year
changes in weight, physical activity, and cardiovascular disease risk
factors in Mexican Americans. American Journal of Epidemiology, 152
(1): 974-982.
93. Boegehold MA, Kotchen TA. (1991). Hypertension. 17 (Suppl 1):
1.158-1.161.
94. Simpson O. (1995). Blood pressure and sodium intake. Raven
Press Ltd., USA.
95. Singer DRJ, Markandu ND, Sugden AL, et al. (1991). Hypertension.
17: 798-803.
96. Hunt P, and Hillsdon M. (1996). Changing eating and exercise
behavior. Hartnolls Ltd., Cornwall, UK.
97. Guesry P, Hennerici M, and Sitzer G. (1997). Nutrition and Stroke.
Nestec Ltd. and Loppincott-Raven Publishers, Philadelphia, USA.
98. Intersalt Cooperative Research Group (1988). Br Med J., 297:
319-328.

182
99. Cook N, Kumanyik S, and Cutler J. (1998). Effect of change in
sodium excretion on change in blood pressure corrected for
measurement error. American Journal of Epidemiology, 148 (5): 431-
441.
100. Johannsen J. (1993). Update guidelines for treating hypertension.
American Journal of Nursing, 93 (3): 42-49.
101. Viscusi W. (2000). Smoking risk policy. Journal of risk and
uncertainly, 21 (1): 159-160.
102. Wolf PA, Agostin RB, Kannel WB, Bonita R, and Belanger AJ.
(1988). Cigarette smoking as a risk factor for stroke. The Framingham
Heart Study. JAMSA, 259 (7): 1025-1029.
103. Bonita R, Scragg R, et al. (1986). Cigarette smoke and risk of
premature stroke in men and women. BMJ, 293: 6338-6340.
104. Gillum R. (1999). Risk factors for stroke in blacks: A critical
review. American Journal of Epidemiology, 150 (12): 1266-1274.
105. Marmot M, and Poulter N. (1992). Primary prevention of stroke.
Lancet, 339: 344-347.
106. Robbins A, Manson J, et al. (1994). Cigarette smoking and stroke
in cohort of United State (U.S) male physicians, Annals of Internal
Medicine, 120 (6): 458-462.
107. You R, Thrift A, et al. (1999). Ischemic stroke risk and passive
exposure to spouses, cigarette smoking. American Journal of Public
Health, 89 (4): 572-575.

183
108. He J, Klag M, Wu Z, and Whelton P. (1995). Stroke in the peoples
Republic of China (geographic variations in incidence and risk factors).
Stroke, 26 (12): 2222-2227.
109. Robbins AS, Manson JE, Lee IM, Satterfield S, and Hennekens
CH. (1994). Cigarette smoking and stroke in a cohort of US male
physicians. Annual International physician, 120 (6): 458-462.
110. AL-Sowielem LS, Elzubier AG. (1998). Compliance and
knowledge of hypertensive patients attending primary health centers
(PHC) in AL-Khobar, Saudi Arabia. Centers in AL-Khobar, Saudi
Arabia, 4 (2) 301-307.
111. Schievink WA, Wijdicks EFM, Meyer FB, et al. (1995). Seasons,
Snow, and subarachnoid hemorrhage: Lack of association in
Rochester, Minnesota. J Neurosurg, 82: 912-913.
112. Alter M, Christoferson L, Resch J, et al. (1970). Cerebrovascular
disease: frequency and population selectivity in an upper mid-western
community. Stroke, 1: 454-465.
113. Giroud M, Beuriat P, Vion P, et al. (1989). Stroke in a French
prospective population study. Neuroepidemiology, 8: 97-104.
114. Oberg A, Ferguson J, Mclntyre L, and Horner R. (2000). Incidence
of stroke and season of the year: Evidence of an association. American
Journal of Epidemiology, 152 (6): 558-564.
115. Nordenfelt L. (1994). Concepts and measurement of quality of life
in health care. Dordrecht, Netherlands.

184
116. Avis N, and Smith K. (1994). Conceptual and methodological
issues in selecting and developing quality of life measures. Advances
in Medical Sociology, 5: 255-280.
117. Vallerand A, Breckenridge D, Hodgson N. (1998). Theories and
conceptual models to guide quality of life related research (Quality of
Life from Nursing and Patient Perspective). Jones and Bartlett, London,
UK.
118. Cella D, Wiklund I, Shumaker S, and Aaronson N. (1995).
Integrating health-related quality of life into cross-national clinical trials
(International Assessment of Health-Related Quality of Life).
Communications of Oxford Ltd., UK.
119. Duncan L, and Bateman DN. (1993). Sexual function in women.
Do anti- hypertensive drugs have an impact?. Regional drug and
therapeutic center, 8 (3): 225-234.
120. Weiss RJ. (1991). Effects of anti-hypertensive agents on sexual
function. American Family Physician, 44 (6): 2075-2082.
121. Fogari R, and Zoppi A. (2002). Effects of anti-hypertensive
therapy on sexual activity in hypertensive men. Curr Hypetens, 4 (3):
202-210.
122. Grimm Rh, et al. (1997). Long-term effect on sexual function of
five anti-hypertensive drugs and nutritional hygienic treatment in
hypertensive men, and women. Hypertension, 29: 8-14.
185
123. Leonetti G, Comerio G, and Cuspidi C. (1994). Evaluating quality
of life in hypertensive patients. J Cardiovasc Pharmacol, 23 suppl 5:
S 54-58.
124. Stein JD, Brown GC, Brown MM, Sharma S, Hollands H, and
Stein HD. (2002). The Quality of life of patients with hypertension. J
Clin Hypertens, 4 (3): 181-188.
125. Grimm RH, et al. (1997). Relationships of quality of life measures
to long term lifestyle and drug treatment in the treatment of mild
hypertension study. Arch Intern Med, 157: 638-648.
126. http://www.ncbi.nlm.nih.gov/entrez/query.fcgi?cmd=Retrieve&db=
PubMed&list_uids=7 [Treatment of hypertension in elderly patients and
quality of life]
127. Elmer PJ, et al. (1995). Lifestyle intervention: results of the
treatment of mild hypertensive study (TOMHS). Preventive Medicine,
24: 378-388.
128. Schlesselman J, and Stolley P. (1982). Case-Control Studies
(design, conduct, analysis). Oxford University, USA.
129. Wacholder S, Silverman DT, McLaughlin JK, and Mandel JS.
(1992). Selection of controls in case-control studies. American Journal
of Epidemiology, 135: 1029-1041.
130. Palestinian Central Bureau of Statistics (PCBS), Population in
Palestinian territory, 1997-2025.
186
131. Derogatis LR. (1980). Symptoms Checklist – 90 – Revised
(SCL-90-R).
132. Angermeyer MC, Kilian R, and Matschinger H. (2000). WHOQOL-
100 und WHOQOL-BREF. Handbuch für die Deutschsprachige version
der WHO Instrument zur Erfassung von Lebensqualität. Hogrefe-Verlag
Göttingen, Bern, Toronto, Seattle.
133. Leplege A, and Verdier A. (1995). The adaptation of health status
measures: methodological aspects of the translation procedure. Rapid
Communication of Oxford Ltd. UK.
134. Bullinger M. (1995). International validation and testing of quality
of life scales in relation to Germany (quality of life and health)
(concepts, methods, and applications). Blackwell Wissenschafts,
Edinburgh, Germany.
135. UNRWA health department (2000). Prevention and control of non-
communicable diseases (Technical instruction series No. HD/ DC/ 01/
revision No.2 November 2000). WHO, Geneva.
136. Garrow JS. (1981). Treat obesity seriously (a clinical manual).
London, Churchill Living Stone.
137. Bühl A, Zöfel P. (1998) SPSS Version 8.0: Einführung in die
moderne Datenanalyse unter Windows. Addison-Wesley-Longman
138. SAS (1991): SAS Technical Report P-217, SAS/STAT Software:
The PHREG Procedure, Version 6. SAS Institute Inc., Cary, NC.

187
139. Sackett DL, Haynes RB, Gibson ES, et al. (1975). Randomized
clinical trial of strategies for improving medication compliance in
primary hypertension. Lancet, 1 (7918): 1205-1207
140. Setaro Jf, Black HR. (1992). Refractory hypertension. N Engl J
Med, 327: 543-547.
141. The Sixth Report of the Joint National Committee on Prevention,
Detection, Evaluation, and Treatment of High Blood Pressure (1997).
Arch Intern Med, 157: 2413-2446.
142.www.lifeclinic.com/physicianlinfo/TopicsView.asp?MessageID=649
[Hypertension management: Linking communication compliance]
143. Ostir GV, Markides KS, Peek MK, Goodwin JS. (2001). The
association between emotional well-being and the incidence of stroke
in older adult. Psychosom Med, 63 (2): 210-215.
144. Ohira T, Iso H, Satoh S, et al. (2001). Prospective study of
depressive symptoms and risk of stroke among Japanese. Stroke, 32
(4): 903-908.
145. WHO (1996). WHOQOL-BREF (Introduction, administration,
scoring, and generic version of the assessment). Geneva.
146. Olweny, C.L.M. (1992). Quality of life in developing countries.
Journal of palliative care, 8: 25-30.
147. Okimoto JT, Barnes RF, Veith RC, et al. (1982). Screening for
depression in geriatric medical patients. American Journal of
Psychiatry, 139: 799-802.
188
148. DeMaris A. (1991): A framework for the interpretation of first-
order interaction in logit modeling. Psychol. Bull. 110, 557-570.
149. Walpole R. (1974). Introduction to statistic (second edition). New
York, USA.
150. Collins R, MacMahon S. (1994). Blood pressure, antihypertensive
drug treatment and the risks of stroke and coronary heart disease. Br
Med Bull, 50: 272-298.
151. Collins R, Peto R, MackMahon S, et al. (1994). Blood pressure,
stroke, and coronary heart disease. Part 2, short-term reductions in
blood pressure: overview of randomized drug trials in their
epidemiological context. Lancet, 335: 827-838.
152. Perry H, Davis B, and price T. (2000). Effect of treating isolated
systolic hypertension on the risk of developing various types and
subtypes of stroke: the Systolic Hypertension in the Elderly Program
(SHEP). JAMA, 284 (4): 465-417.
153. BBC News. You are in: health. Thursday, 27 June 2002, 13:25
GMT 14:25 UK.
154. Donnan GA, Adena MA, O'Malley HM, et al. (1989). Smoking as a
risk factor for cerebral ischemia. Lancet, 2: 643-647.
155. Betto JA, Bansal VK. (1992). Quality of life in treatment of
hypertension: a meta analysis of clinical trials. Am J Hypertens, 5 :
125-133.
156. James MA, Potter JF. (1993). The effect of antihypertensive
treatment on the quality of later years. Drugs Aging, 3: 26-39.

189
157. Killer ME. (1993). Elderly hypertensives and quality of life: some
methodological considerations. European Heart Journal, 14: 113-121.
158. Dam H. (2001). Depression in stroke patients 7 years following
stroke. Acta Psychiater Scand, 103 (4): 287-293.
159. www.cmeprograms.umn.edu/bestpractice/tomhs/html/other/side
effects.html [Treatment of hypertension (side effects and quality of life)]
160. Levin JS, Vanderpool HY. (1987). Is frequent religious attendance
really conductive to better health?: Toward an epidemiology of religion.
Social Science of Medicine, 24: 589-600.
161. Zuckerman DM, Kasl SV, Ostfeld AM. (1984). Psychosocial
predictors of mortality among the elderly poor. The role of religion, well-
being, and social contacts. American Journal of Epidemiology, 119:
410-423.
162. Wells KB, Stewart A, Hays RD, et al. (1989). The functioning and
well-being of depressed patients. JAMA, 262: 914-919.
163. Berkman LF, Syme SL. (1979). Social networks, host resistance,
and mortality: a nine-year follow-up study of Alameda Country
residents. American Journal of Epidemiology, 109: 186-204.
164. Broadhead WE, Kaplan BH, James SA, et al. (1983). The
epidemiologic evidence for a relationship between social support and
health. American Journal of Epidemiology, 117: 521-537.
165. Rodin G, Voshart K. (1986). Depression in the medically ill: an
overview. American Journal of Psychiatry, 143: 696-705.

190
166. Stunkard AJ. (1981). Adherence to medical treatment: Over-view
and lessons from behavioral weight control. J. of Psychosom. Res, 25:
187-197.
167. Azrin NH, and Powell J. (1969). Behavioral engineering: The use
of response priming to improve prescribed self –medication. J. of Appl.
Beh. Analysis, 2: 39-42.
168. Stone et al. (1979). Health psychology: A Handbook. San
Francisco: Jossey-Bass.
169. Phillips E. (1988). Patient compliance. New light on health delivery
system in medicine and psychotherapy. George Washington University,
USA.
170. Polit DF, Hungler BP. (1995). Nursing research (principles and
methods 5th ed.). Lippincott Company, USA.
171. Garrow JS, and Webster J. (1985). Quetelet’s index (W/H²) as a
measure of fatness. International Journal of Obesity, 9: 147-153.
172. Gallagher D et al. (1996). How useful is BMI for comparison of
body fatness across age, sex, and ethnic groups? American Journal of
Epidemiology, 143: 228-239.
173. WHO. (1995). Physical status: The use and interpretation of
anthropometry (Technical Report Series). Geneva, Switzerland.
174. Calle EE et al. (1999). BMI and mortality in prospective cohort of
U.S. adults. New England Journal of Medicine, 341: 1097-1105.

191
175. Hiriji, KF et al. (1998). A comparison of tests for trends.
Communications in Statistics-Theory and Methods, 27: 943-963.
176. Stokes ME et al. (1995). Categorical data analysis using SAS
system. Cary, NC: SAS institute Inc.
177. Hirji KF et al (1989).Median unbiased estimation for binary data.
American Statistician, 43: 7-11.
178. A baham IL, Nadzam DM, Fitzpatric JJ. (1989). Statistics and
quantitative methods in nursing. W.B. Saunders, Philadelphia.
179. Hays WL. (1988). Statistics for the social sciences (4th ed.). Holt,
Rinehart and Winstone, New York.
180. Cleary PD, and Angel R. (1984). The analysis of relationships
involving dichotomous dependent variables. Journal of Health and
Social Behavior, 25: 334-348.
181. Cohen J, and Cohen P. (1993). Applied multiple regression:
Correlation analysis for behavioral science ( 2nd ed.). Halsted Press,
New York.
182. Aranoson LS. (1989). A cautionary note on the use of stepwise
regression. Nursing Research, 38: 309-311.
183. SAS (1999). Conditional logistic regression for m:n matching (the
PHREG procedure). SAS Institute Inc.,Cary, NC., USA.
184. Horton J. (1992). The women's health data book. Washington,
DC, USA.

192
185. Bernhard L, and Sheppard L. (1993). Health, symptoms, self-care
and dyadic adjustment in menopausal women. J Obstet Gynecol
Neonatal Nurs, 22 (5): 456-461.
186. Fishbein E. (1992). Women at midlife: The transition to
menopause. Nurs Clin North Am, 27 (4): 951-957.
187. Nieswiadomy R. (1993). Foundation of nursing research 2nd ed.
Appleton-Lange, New York.
188. Polit D, and hungler B. (1993). Nursing research, methods,
appraisal and utilization 3rd edi. Lippincott Company, USA.
189. Robson C. (1993). Real world research: A resource for social
scientists and practioner-researchres. Oxford, UK.
190. Croog SH, Kong BW, et al. (1990). Hypertensive black men and
women. Quality of life and effects of antihypertensive medications.
Black hypertension quality of life multicenter trial group. Internal
Medicine, 150 (8): 1108—1115.
191. Fletcher AE, Bulpitt CJ, et al. (2002). Quality of life on randomized
treatment for isolated systolic hypertension: results from the Systolic
European Trial. J Hypertens, 20 (10): 2069-2079.
192. Zhou Y, Zhu Z, Zhong S. (1998). A study in the relationship of
primary hypertension in elderly and their quality of life in Changsha
City. 19 (1): 24-26.
193
193. Erickson SR, Williams BC, and Gruppen LD. (2001). Perceived
symptoms and health-related quality of life reports by uncomplicated
hypertensive patients compared to normal control. J Hum Hypertens,
15 (8): 539-548.
194. PRCS. (2000). Fact sheet. In: Palestine Red Crescent Society.
195. Abbott R, Yin Y, Reed D, Yano K. (1986). Risk of stroke in male
cigarette smokers. N Engl J Med, 315: 717-720.
196. Colditz G, Bonita R, Stampfer M, et al. (1988). Cigarette smoking
and risk of stroke in middle-aged women, N Engl J Med, 318: 937-941.
197. Bronner L, Kanter D, Manson J. (1995). Primary prevention of
stroke. N Engl J Med, 333: 1392-1400.
198. Gorelick P, Sacco R, Smith D, Alberts M, et al. (1999). Prevention
of first stroke. A review of guidelines and a multidisciplinary consensus
statement from the National Stroke Association. JAMA, 281: 1112-
1120.
199. www.peacefhlcommunities.ca/2003/June/jun16.htm.
(Speaker will discuss poverty, quality of life….June 16,2003)
200. www.nuff.ox.ac.uk/projects/ChangeQual/esri.asp.
(Reduce income poverty)

APPENDIXES
List of Appendixes
1. The questionnaire
2. Witness Form
3. A form of authorization to conduct the study
4. General standard of quality of life among German population

Appendix 1
Questionnaire
Stroke and non-compliance with the therapeutic Regimen among hypertensive patients
In Gaza governorates 1/1/2001-31/12/2001
(Part one) I- Personal information:
1- Diagnosis: stroke and history of hypertension Hypertension
2- The name of the hospital / clinic:
Shefa hospital Nasser hospital European hospital
3- Age in years: 40-45 46-51 52-57 58-63 64-69
4- Address: Gaza Mid-zone South
5- Sex: Male Female
6- Weight: (Last year)
7- Height:
8-Marital status: Married Single Divorce widow
9- Number of children: 0 1-3 4-6 7-9 10 or over
II-Medical information: 10 - How long do you have a history of hypertension?
2-7 8-13 14-19 20-25 26-31
11- When did you start your therapeutic regimen: ------------------------------ 12- Do you have history of other diseases?
Yes No 13- If yes, please explain:
----------------------------------------------------------------------------------------------

III- Socio-economic information
14- Level of education Nil Primary school Preparatory school Secondary school University degree more than that
15- Average income per month in US. $
Less than 200 $ 200-350$ 360-550$ 560-750$ over 750$
IV- Compliance to therapeutic regimen
How have you experienced these things in the last year?
a) Anti – hypertensive medication: 16- Did you take your medication as prescribed?
Yes No
17- Did you take your medication at proper time? Yes No
18- Did you run out of pills even for a single day? Yes No
b) Dietary restrictions of sodium and fat:
19- Did you use excessive salt in cooking or at meals? Yes No
20- Did your family prepare a special diet for you, which is low in salt? Yes No
21- Did you eat diet high in fat such as milk, butter, margarine, cream, eggs, cheese and meat?
Yes No

c) Weight reduction:
22- Did you involve in a regular program of weight reduction? Yes No
d) Exercise program 23- Did you involve in a regular program of exercise such as walking?
Yes No
e) Follow-up health care: 24- Did you check your blood pressure regularly?
Yes No
25- Did you keep follow-up clinic or physician appointment?
Yes No
f) Smoking: 26- Do or did you smoke?
Yes No
27- If yes, how many cigarettes per day?
1-10 11-20 21-30 31-40 over 40 cigarette
28- How long did you smoke?
1-4 years 5-8 years 9-12 years 13-16 years 17-20years over 20 years
29- If no, did you ever smoke?
Yes No

g) Psychological and environmental stressors
How much did you suffer in the last year?
Key values
0= No 1= Little 2= Sometimes 3= Strong 4= Very strong
30- Criticize everything too much 0 1 2 3 4
31- Feeling loneliness 0 1 2 3 4
32- Nervousness or sleeping disturbances 0 1 2 3 4
33- Uncomfortable feeling when 0 1 2 3 4
People are watching you
34- Feeling that, you did not like to eat or 0 1 2 3 4
drink in public
V- Knowledge and misconception of disease
According to your knowledge in the last year…. 35-Could you explain the causes of hypertension?
Unknown, but heredity plays an important role bacteria
Virus I do not know
36-Could you explain the complications of hypertension?
Stroke Tuberculosis No complications I do not know
37- Did your knowledge change about the causes of hypertension right now? Unknown, but heredity plays an important role bacteria Virus I do not know

38- Did your knowledge change about the complications of hypertension right now?
Stroke Tuberculosis No complications I do not know
39- Is there a possibility of total cure for hypertension?
Yes No
40- Could the treatment be stopped, if blood pressure was controlled?
Yes No
VI- Time distribution of stroke:
41- Do you know the time of onset of stroke?
Yes No
42- If yes, is it in
*Autumn *Winter *Spring *Summer
VII) Body mass index (calculated by physician) 43- Body mass index:
20-24.9 25-29.9 30-40 Over 40

WHOQOL Questionnaire
(Part 2) Instructions
This assessment asks how you feel about your quality of life, health or other
areas of your life. Please answer all the questions. If you are unsure about
which response to give to a question, please choose the one that appears
most appropriate. This can often be your first response.
Please keep in mind your standards, hopes, pleasures, and concerns. We ask
that you think about your life in the last year.

Please read each question, assess your feelings, and circle the number on the scale for each question that gives the best answer for you.
Very poor Poor Neither poor nor good
Good Very good
1- How would you rate your quality of life?
1 2 3 4 5
Very dissatisfied Dissatisfied Neither satisfied nor dissatisfied
Satisfied Very Satisfied
2- How satisfied are you with your health?
1 2 3 4 5
The following questions ask about how much you have experienced certain things in the last year.
Not at all
A little A moderate amount
Very much An extreme amount
3- To what extent do you feel that physical pain prevents you from doing what you need to do?
1 2 3 4 5
4- How much do you need any medical treatment to function in your daily life?
1 2 3 4 5
5- How much do you enjoy life?
1 2 3 4 5
6- To what extent do you feel your life to be meaningful?
1 2 3 4 5
Nat at all
A little A moderate amount
Very much Extremely
7- How well are you able to concentrate?
1 2 3 4 5
8- How safe do you feel in your daily life?
1 2 3 4 5
9- How healthy is your physical environment?
1 2 3 4 5
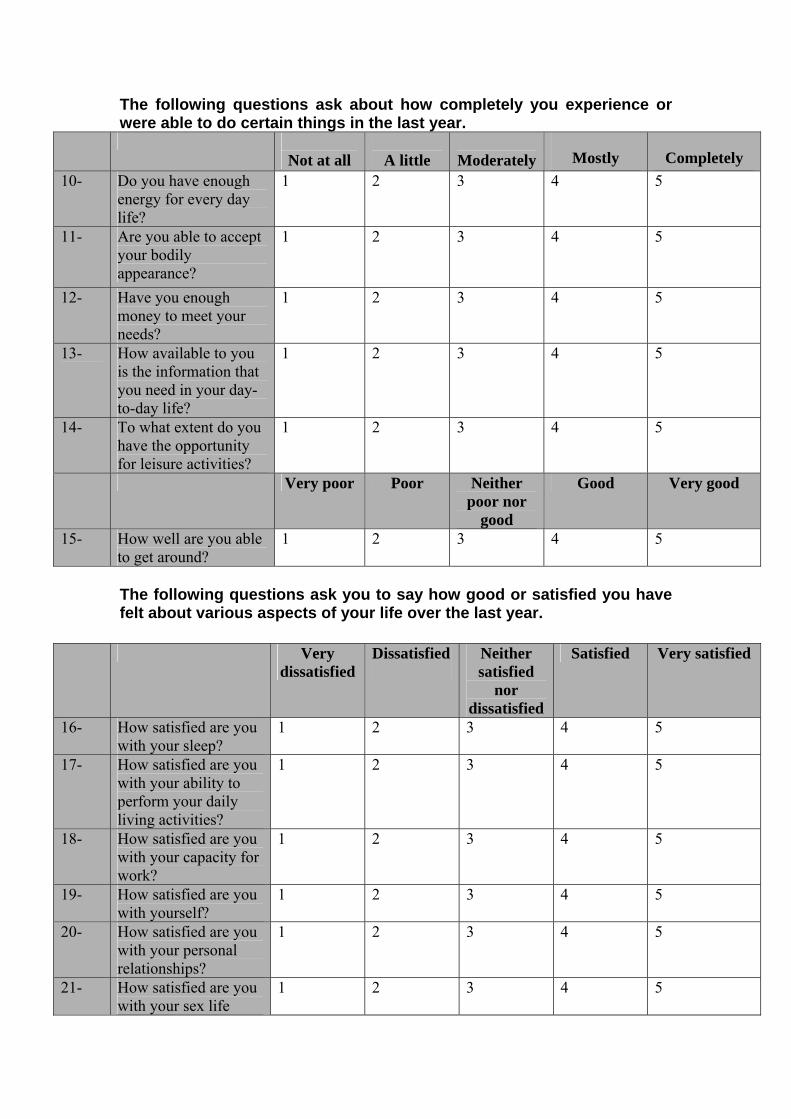
The following questions ask about how completely you experience or were able to do certain things in the last year.
Not at all
A little
Moderately Mostly Completely
10- Do you have enough energy for every day life?
1 2 3 4 5
11- Are you able to accept your bodily appearance?
1 2 3 4 5
12- Have you enough money to meet your needs?
1 2 3 4 5
13- How available to you is the information that you need in your day-to-day life?
1 2 3 4 5
14- To what extent do you have the opportunity for leisure activities?
1 2 3 4 5
Very poor Poor Neither poor nor
good
Good Very good
15- How well are you able to get around?
1 2 3 4 5
The following questions ask you to say how good or satisfied you have felt about various aspects of your life over the last year.
Very dissatisfied
Dissatisfied Neither satisfied
nor dissatisfied
Satisfied Very satisfied
16- How satisfied are you with your sleep?
1 2 3 4 5
17- How satisfied are you with your ability to perform your daily living activities?
1 2 3 4 5
18- How satisfied are you with your capacity for work?
1 2 3 4 5
19- How satisfied are you with yourself?
1 2 3 4 5
20- How satisfied are you with your personal relationships?
1 2 3 4 5
21- How satisfied are you with your sex life
1 2 3 4 5

Very dissatisfied
Dissatisfied Neither satisfied
nor dissatisfied
Satisfied Very satisfied
22- How satisfied are you with the support you get from your friends?
1 2 3 4 5
23- How satisfied are you with the conditions of your living place?
1 2 3 4 5
24- How satisfied are you with your access to health services?
1 2 3 4 5
25- How satisfied are you with your transport?
1 2 3 4 5
The following question refers to how often you have felt or experienced
certain things in the last year.
Never
Seldom
Quit often Very Often
Always
26- How often do you have negative feelings such as blue mood, despair, anxiety, depression?
1 2 3 4 5
Did someone help you to fill out this form?
Yes No
How long did it take to fill this form out? __________________ Did you have any comments about the assessment?
…………………………………………………………………………………………………………………………………………………………..
THANK YOU FOR YOUR HELP

Appendix 2
Witness form
Stroke and non-compliance with the therapeutic Regimen among hypertensive patients
In Gaza governorates
1/1/2001-31/12/2001
This questionnaire consists of many questions that measure compliance and non- compliance with the therapeutic regimen in patients with stroke and hypertensive patients without stroke. In addition, it measures the quality of life in hypertensive patients with stroke and hypertensive patients without stroke one year before the study.
Dear Patient: 1- This study is undertaken to ascertain whether an association exists between non-compliance with the therapeutic regimen and development of stroke among hypertensive patients, to determine the risk factors which contribute to the development of stroke, to evaluate the differences in quality of life among the patients with stroke and history of hypertension (case group), and hypertensive patients without stroke (control group) one year before the study, and to assess the existent of seasonal pattern and the occurrence of stroke.
2- This study will benefit in improving the health condition in hypertensive patients through emphasizing their quality of life, compliance with the therapeutic regimen, and avoidance of the disease complications, especially stroke.
3- Participation in this study will not expose the patient to any danger or complications that may affect his health condition negatively. ▪ The information that is collected with this questionnaire will be used only for scientific study purposes ▪ Confidentiality will be guaranteed.
▪ I hope you will express your answer honestly.
Researcher
Yousef Aljeesh Patient’s Signature