Striving for a Healthier Buffalo
118
A COMMUNITY HEALTH NEEDS ASSESSMENT FOR THE GREATER BUFFALO UNITED MINISTRIES DECEMBER 2014 FINAL REPORT Striving for a Healthier Buffalo
Transcript of Striving for a Healthier Buffalo

A Community HeAltH needs Assessment for tHe GreAter BuffAlo united ministries
deCemBer 2014finAl report
Striving for a Healthier Buffalo

i Comunity HealtH needs assessment
The University at Buffalo Center for Urban Studies, in partnership with the Greater Buffalo United Ministries (GRUM), has conducted a Community Health Needs Assessment to inform the design and implementation of a neighborhood and faith based health care delivery system for Medicaid eligible residents in GRUM neighborhoods. The purpose of this Community Health Needs Assessment is to identify the unmet health challenges for the Greater Buffalo United Ministries (GRUM) communities in Erie and Niagara Counties. It will outline a strategy for addressing those needs for developing a set of health indicators and metrics to monitor progress in meeting those needs. This assessment, then, will provide GRUM and its prime partner, the Greater Buffalo United Affordable Healthcare Network (GBUAHN) with the framework needed to forge an implementation strategy to address the unmet health needs of the GRUM community.
Center for Urban Studies

ii Comunity HealtH needs assessment
ACkNowledGemeNtsA project like this does not happen without the support and assistance of many individuals and organizations. I want to especially thank the Board of Directors of the Greater Buffalo United Ministries (GRUM) for getting the UB Center for Urban Studies involved in this important initiative.
In particular, we want to give special recognition to Pastor Kinzer Pointer, President and Chief Executive Officer of GRUM. Pastor Pointer served as the point person for GRUM on this project and played a critical role in coordinating many of the activities associated with this project, including the extremely successful two-day seminar “Towards a Healthy Buffalo: Faith-Based Symposium” (September 24 and September 25, 2014), which brought scholars from across Erie County and the United States together to discuss the health disparities facing the black and Latino population in Greater Buffalo and share best practices that can be used to improve the health outcomes of these populations. I also want to highlight the effort of the GRUM Second Vice-President, Pastor Darnell Donaldson. Pastor Donaldson was closely involved with all of the public meetings and was very active in having surveys completed by church members who were unable to attend the public meetings.
The GRUM churches played a critical role in this project. Over a six week period, we held 11 public meetings across Buffalo and Lackawanna. This effort was anchored by eleven churches that hosted the meetings and cooked dinner for the attendees. We would also like to acknowledge their role: Pastor Frank Bostic (Pilgrim Missionary Baptist Church); Pastor Alan R. Core (First Centennial Baptist Church); Pastor Dennis Lee Jr. (Hopewell Baptist Church); Pastor Ivery Daniels (White Rock Baptist Church); Pastor George F. Nicholas (Lincoln Memorial United Methodist Church); Pastor Gentre L. Garmon (Nazareth Baptist Church); Pastor T. Anthony Bronner (Elim Christian Fellowship); Pastor Samuel Rivera (Asamblea Iglesias de Cristianas); Pastor Gauthier (Revival Church of Buffalo); Pastor Tommie L. Babbs (Thankful Missionary Baptist Church); and Pastor Keith Mobley (Mount Olive Baptist Church - Lackawanna, New York). We also give a special thank you to the staff at each of these churches for taking the time to prepare and serve dinner.
We also extend our appreciation to Pastor William Gillison and everyone at Mount Olive Baptist Church (Buffalo, New York) for hosting the two-day “Towards a Healthy Buffalo: Faith-Based Symposium” on September 24 and September 25, 2014. Mount Olive was the perfect facility for the symposium and had all of the amenities necessary to conduct a first class event.
We would like to acknowledge Darryl Gaiter for putting together the team that was responsible for coordinating flyer drops promoting the public meetings in the 31 GRUM church neighborhoods in cities of Buffalo and Lackawanna. This assistance was critical to getting individuals to participate in the meetings where the collection of data utilized to inform the GRUM Community Needs Health Assessment took place.
Dr. John Ruffin, the Founding Director of the National Institute on Minority Health and Health Disparities – National Institute of Health, provided invaluable expertise on the subject matter to the project team throughout the project. Dr. Ruffin not only made himself available to offer feedback on the work as it progressed, but also helped to shape the focus of the two-day Faith-Based Symposium by recruiting a team of scholars from across the country to come to Buffalo to participate in the symposium.
We also want to thank the scholars who participated in the Symposium and agreed to serve as an ad-hoc advisory committee to the project. They include Dr. Laurene Berhalter (Associate Professor and Director of Community Translational Research, University at Buffalo Department of Family Medicine); Dr. Chalres Corprew

iii Comunity HealtH needs assessment
III (Assistant Professor of Psychological Science, Loyola University New Orleans); Dr. John Estrada (Associate Professor of Pediatrics, Louisiana State University); Dr. Carla Boutin-Foster (Associate Professor of Medicine, Weill Cornell Medical College); Dr. Warachal Faison (Medical Director, U.S. Medicial Affairs, Pain and Neuroscience Pfizer, Inc.); Dr. Walter Fluker (Martin Luther King Chair of Ethical Leadership, Boston University School of Theology, The Religion and Conflict Transformation Program); Dr. Carol Horowitz (Associate Professor of Population Health, Science and Policy Associate Professor of Medicine, Mount Sinai School of Medicine); Ms. Charmaine Ruddock (Project Director, Bronx Health REACH); and Dr. Stephen Thomas (Professor - Health Services Administration, Founding Director – Center for Health Equity, University at Maryland, School of Public Health). We thank all of them for taking time to assist with this endeavor.
The UB Center for Urban Studies assembled a great team to work on this project. Dr. Henry Durand, Senior Associate Vice Provost of Undergraduate Education at the University at Buffalo, Executive Director of the Cora P. Maloney College, and Clinical Associate Professor at the UB Graduate School of Education, assisted with the design of the Community Health Needs survey, developed the survey codebook, oversaw the data entry process and then analyzed the survey data. Mita Ray, a graduate of the UB Department of Urban Regional Planning and Research Fellow at the UB Center did a virtual analysis of neighborhood conditions in the GRUM neighborhoods.
A team of UB graduate, students mostly in urban and regional planning also assisted in all aspects of the project. Kevin Stout, a Ph.D. student in Political Science, was responsible for census data collection and analysis. Laiyun Wu was our point person for Geographic Information Systems and produced all of the maps that appear in this report. The public meetings would not have been possible without the participation of Samantha Axberg, Kimberly Burley, Rashad Dismute, William Frantz, Rebecca Johnstone, Ana Marmolejos, Jared Parylo, Kathryn Whalen, Cassandra Yochum, and Hao Zhang. Rebecca Johnstone and Cassandra Yochum also inputted the data from each survey.
I also want to single out the efforts of UB Center for Urban Studies personnel. Mr. Jeffrey Kujawa, Assistant Director, served as Project Manager for the project, while Ms. Frida Ferrer, Executive Assistant to the UB CENTER Director, managed project logistics and providing support for all aspects of the work. Nathan Aldrich, a graduate assistant in the Department of Urban and Regional Planning, worked alongside the UB CENTER Director and Assistant Director to complete the report. He oversaw the layout and formatting of the document and assisted with editing each of the drafts.
I also want to recognize Dr. Raul Vasquez and Dr. Kenneth Gales of the Greater Buffalo United Affordable Healthcare Network (GBUAHN) for their visionary leadership, which effort possible. Last but not least, I want to thank the hundreds of community members who attended the public meetings, took the health needs assessment survey, shared their thoughts in focus groups, and participated in the Symposium. Without their participation, this study would not have been possible.
Henry Louis Taylor, Jr., Ph.D. Project Director

iv Comunity HealtH needs assessment
INsIde tHe RePoRt
exeCutive summAry
pArt 1: introduCtion
pArt 2: tHe erie County HeAltH CHAllenGe
pArt 3: tHe Grum Community
pArt 4: findinGs And reCommendAtions
Appendix
viii
1
11
25
67
73
the Community Health needs Assessment will be divided into four (4) parts. The first part will introduce the study, provide an overview of data and methods used in this study and provide an overview of the relationship between GRUM and GBUAHN. The second part will focus on the Erie County Health Challenge, while specifically concentrating on the health problems in the black and Latinos communities. Part three will examine the GRUM Community by taking an indepth look at neighborhood and housing conditions. The fourth part will focus on recommendations.

v Comunity HealtH needs assessment
ACA
BNMC
BUDC
CNI
CT
ECMC
FPL
GRUM
GBUAHN
HSD
HUD
IPA
LFPR
PQI
VA
ZOC
Affordable Care Act
Buffalo Niagara Medical Campus
Buffalo Urban Development Corporation
Community Needs Index
Census Tract
Erie County Medical Center
Federal Poverty Level
Greater Buffalo United Ministries
Greater Buffalo United Affordable Healthcare Network
High School Diploma
U.S. Department of Housing and Urban Development
Independent Physician Association
Labor Force Participation Rate
Preventive Quality Indicators
Veterans Administration
Zone of Change
ACRoNyms

vi Comunity HealtH needs assessment
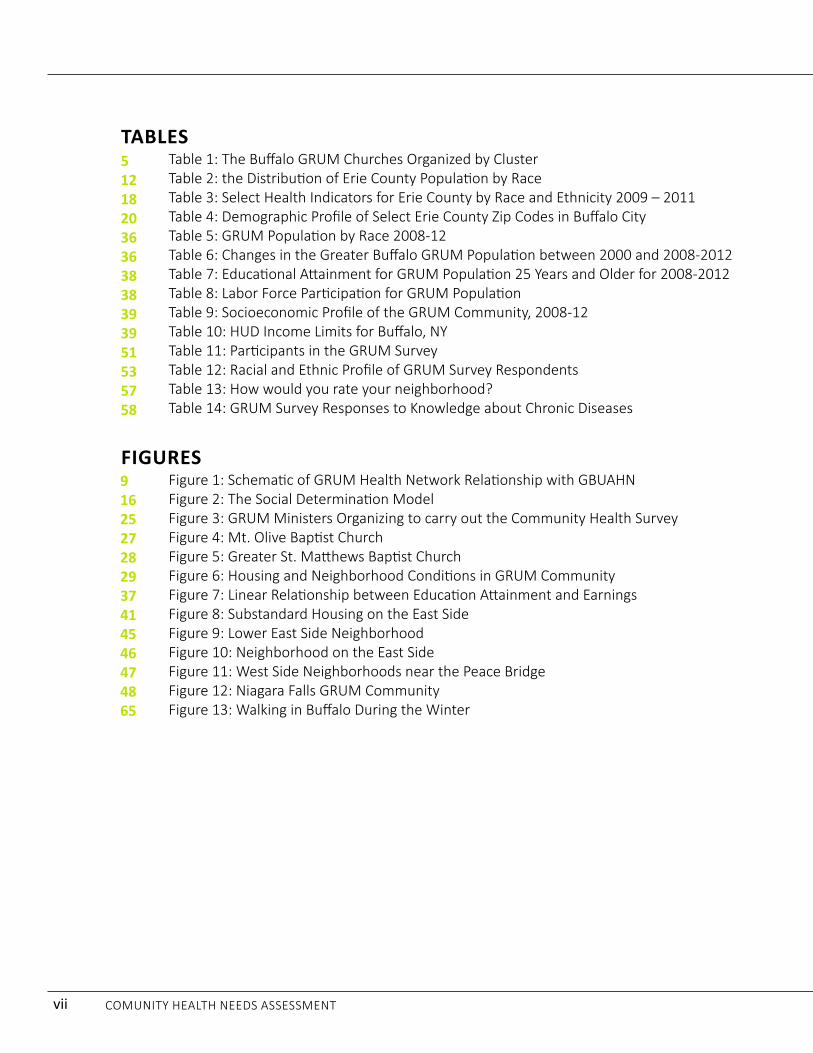
lIst of mAPs, tABles ANd fIGURes
tHe RePoRtmAPs Map 1: Participating GRUM Churches in Greater Buffalo Map 2: Participating GRUM Churches in Buffalo City Map 3: the Buffalo GRUM Clusters Map 4: Buffalo City’s Eight Residential Areas Map 5: Erie County and Niagara County, New York Map 6: Population Distribution by Race in Niagara and Erie Counties Map 7: Black and White Population Distribution in Buffalo City, 2006 Map 8: Distribution of Latinos in Buffalo and a 1937 Map of the Buffalo Industrial Zones Map 9: Zip Codes from which the Erie County Health Department receives 73% of its Patients23 Map 10: Income Distribution in Erie County Map 11: Percentage of Medicaid Recipients in Erie County Map 12: GRUM Non-Clustered Churches Map 13: GRUM Churches in Relationship to the Black and Latino Communities Map 14: Population Change in Buffalo, 1980 - 2010 Map 15: Black Population Changes in GRUM Neighborhoods, 2000 – 2008-2012 Map 16: Vacant and Distressed Land in the City of Buffalo Map 17: Buffalo City Medicaid Service Providers and Black Population Change, 2000 – 2008-2012 Map 18: Residential Location of Buffalo Survey Participants Map 19: Crime Incidents in GRUM Communities
34671113141521
232631354044505263
exeCUtIve sUmmARy mAPs Map 1: Participating GRUM Churches in Greater Buffalo Map 2: Zip Codes from which the Erie County Health Department receives 73% of its Patients Map 3: Black Population Changes in GRUM Neighborhoods, 2000 – 2008-2012 Map 4: Percentage of Medicaid Recipients and Uninsured Population in Erie County
tABles Table 1: Demographic Profile of Select Erie County Zip Codes in Buffalo City Table 2: GRUM Survey Responses to Knowledge about Chronic Diseases
fIGURes Figure 1: The Social Determination Model figure 2: substandard Housing on the east side Figure 3: Poor Access to Food in the GRUM Communities Figure 4: Walking in Buffalo During the Winter
viiixivxvixvii
xxiixiiixv
xivxvi
vii Comunity HealtH needs assessment
fIGURes Figure 1: Schematic of GRUM Health Network Relationship with GBUAHN Figure 2: The Social Determination Model Figure 3: GRUM Ministers Organizing to carry out the Community Health Survey Figure 4: Mt. Olive Baptist Church Figure 5: Greater St. Matthews Baptist Church Figure 6: Housing and Neighborhood Conditions in GRUM Community Figure 7: Linear Relationship between Education Attainment and Earnings figure 8: substandard Housing on the east side Figure 9: Lower East Side Neighborhood figure 10: neighborhood on the east side Figure 11: West Side Neighborhoods near the Peace Bridge figure 12: niagara falls Grum Community Figure 13: Walking in Buffalo During the Winter
9162527282937414546474865
tABles Table 1: The Buffalo GRUM Churches Organized by Cluster Table 2: the Distribution of Erie County Population by Race Table 3: Select Health Indicators for Erie County by Race and Ethnicity 2009 – 2011 Table 4: Demographic Profile of Select Erie County Zip Codes in Buffalo City Table 5: GRUM Population by Race 2008-12 Table 6: Changes in the Greater Buffalo GRUM Population between 2000 and 2008-2012 Table 7: Educational Attainment for GRUM Population 25 Years and Older for 2008-2012 Table 8: Labor Force Participation for GRUM Population Table 9: Socioeconomic Profile of the GRUM Community, 2008-12 Table 10: HUD Income Limits for Buffalo, NY Table 11: Participants in the GRUM Survey Table 12: Racial and Ethnic Profile of GRUM Survey Respondents table 13: How would you rate your neighborhood? Table 14: GRUM Survey Responses to Knowledge about Chronic Diseases
512182036363838393951535758

viii Comunity HealtH needs assessment
exeCUtIve sUmmARy
The quest for wellness and good health is the top challenge facing blacks, Latinos and other low-income groups living in precarious neighborhoods in Greater Buffalo. If people are in poor health they will not be able to meet successfully the challenge of making ends meet and building a better life for themselves and their families. The purpose of this Community Health Needs Assessment is to identify the unmet health challenges of the Greater Buffalo United Ministries (GRUM) communities in Erie and Niagara Counties. It will outline a strategy for addressing those needs, and to develop a set of performance indicators and metrics to monitor progress in meeting those needs. This assessment will provide GRUM and the Greater Buffalo United Affordable Healthcare Network (GBUAHN) with the framework needed to forge an implementation strategy to address the unmet health needs of the GRUM community.
GRUM’s target population is blacks and Latinos between the ages of 18 and 64 years who are eligible for Medicaid and who have multiple chronic diseases or who have one chronic disease , but are at-risk for acquiring another. GRUM’s goal is to enroll these individuals in the Medicaid program, bolster their access to the health care system and to improve the quality of their care in that system. GRUM will use success in this phase of its strategic planning process as a foundation upon which to launch other health programs and activities to improve health outcomes among blacks and Latinos.
In this community health needs assessment, a social determinants of health model was utilized to study the role played by socioeconomic and neighborhood factors in producing undesirable health outcomes in Erie County. This perspective is informed by the view that these social determinants of health are interwoven with everyday life and culture in the black and Latino communities. Therefore, they can only be understood fully within a neighborhood context.
Figure 1: The Social Determination Model
Source: Robert Wood Johnson Foundation

ix Comunity HealtH needs assessment
dAtA ANd metHodsA variety of data and sources were used in this study of the health needs in the Greater Buffalo GRUM com-munity. A number of local reports on community health needs were studied, along with a variety of databases on health issues, including the County Health Rankings by the Robert Wood Johnson and University of Wis-consin Population Health Institute, the New York State Department of Health’s Erie County Health Rankings by Race and Ethnicity, the New York State Erie County Indicators for Tracking Public Health Priority Areas, and the Preventive Quality Indicators for New York State. In addition, to gain insight into the Medicaid populations and health data on Erie County, the Western and Central New York Safety Net (wcnysafteynet.org) database was utilized.
To gain insight into the population demographics, the U.S. Census Bureau’s American Community Survey, 2008-2012 was consulted through Social Explorer. The American FactFinder 2 search engine on the U.S. Census Bureau website was used to complement the Social Explorer data when necessary. Additionally, the U.S. Census Bureau Zip Code Data Base was used to supplement demographic data on the GRUM population. To better understand the income dynamics impacting the GRUM community, the U.S. Department of Housing and Urban Development (HUD), FY 2014 Income Limits Documentation System, Erie County, New York, and the Penn State Living Wage Calculator, “Poverty in American Living Wage Calculator” were consulted.” Data on neighborhood conditions were gathered from a variety of sources. In order to understand the walkability of neighborhoods, we used the walkscore database and neighborhoodscout.com. In both instances, the address of a particular GRUM church was used as the neighborhood focal point. We also used the Dignity Health Community Needs Index (CNI).
The CNI accounts for the underlying economic and structural barriers that affect overall health outcomes. They gather data on five (5) prominent barriers to health care, which include income, cultural/language, education, insurance and housing by zip code. To determine the severity of these barriers in a given community, the CNI gathers other socioeconomic data, including what percentage of the population is elderly and living in poverty, uninsured, and unemployed. Using this data, a score is assigned to each barrier, with 1 representing less community need and 5 representing more community need. The scores are then aggregated and averaged for a final CNI score, with each barrier receiving equal weight in the average. A score of 1.0 indicates a zip code with the lowest socio-economic barriers, while a score of 5.0 represents a zip code with the most socio-economic barriers.
tHe sPAtIAl metHodoloGyThis Community Health Needs Assessment is concerned with understanding the spatial and neighborhood dimensions of the social determinants of health. The goal is to assist GRUM in the formulation of a strategy to improve the neighborhoods in which GRUM residents live and to bolster access to health care and improve the quality of care among blacks and Latinos between the ages of 18 and 64, who are eligible for Medicaid, who have one or more chronic diseases, and/or who are at risk for acquiring multiple chronic diseases. To deepen our understanding of the role of neighborhoods in contributing to undesirable health outcomes among blacks and Latinos, we studied the communities in which 31 of the 61 churches in the Greater Buffalo United Ministries (GRUM) were located.
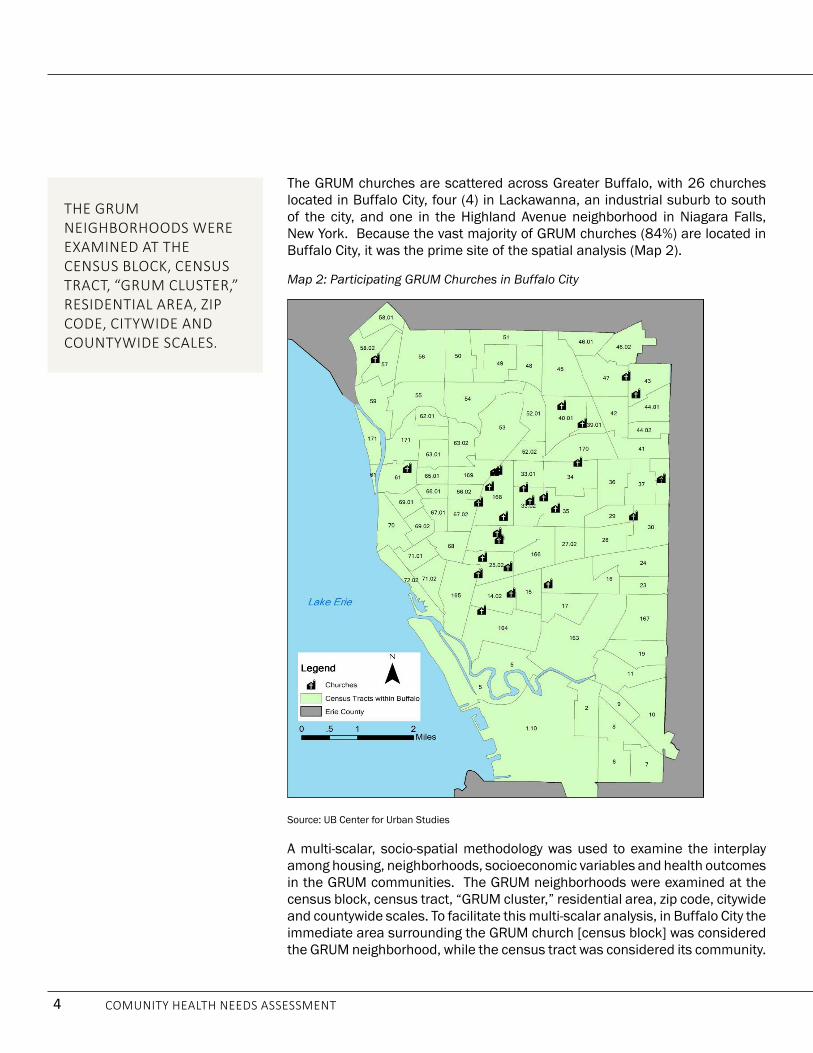
The GRUM churches are scattered across Greater Buffalo, with 26 churches located in Buffalo City, four (4) in Lackawanna, an industrial suburb to south of the city, and one in the Highland Avenue neighborhood in Niagara

x Comunity HealtH needs assessment
Falls, New York. Because the vast majority of GRUM churches (84%) are located in Buffalo City, it was the prime area of the spatial analysis.
A multi-scalar, socio-spatial methodology was used to examine the interplay among housing, neighborhoods, socioeconomic variables and health outcomes in the GRUM communities. The GRUM neighborhoods were examined at the census block, census tract, “GRUM cluster,” residential area, zip code, citywide and countywide scales. To facilitate this multi-scalar analysis, in Buffalo City the immediate area surrounding the GRUM church [census block] was considered the GRUM neighborhood, while the census tract was considered its community.
The churches were then grouped together in a series of twelve (12) clusters based on geographic proximity. These clusters varied in size and were comprised of between one and five churches. The churches were grouped together in clusters based on their proximity and location within the City to facilitate the analysis of those areas that faced similar neighborhood and socioeconomic challenges and to lay the foundation for them to work together to solve common problems.
We then divided Buffalo City into eight residential areas and located the GRUM churches (and clusters) within them, while the residential areas in which the Lackawanna and Niagara Falls GRUM churches are located were identified as well. Additionally, the GRUM communities were analyzed at the zip code level, and their experiences compared with residents at the Buffalo City and County scales.
A methodology was developed to use Google Earth and Google My Maps to conduct windshield surveys of all of the GRUM neighborhoods. A neighborhood conditions rating scale was developed to make assessments of these localities. Fieldwork and photo digital analysis was used to complement virtual windshield surveys. To gain insight into crime in these neighborhoods, Matthew Wrona, crime analyst for the Buffalo Police Department, Erie County Crime Analysis Unit, compiled data on the incident of violent crimes in Buffalo from 2010 to 2013.
Map 1: Participating GRUM Churches in Greater Buffalo
Source: UB Center for Urban Studies

xi Comunity HealtH needs assessment
sURvey ANd foCUs GRoUPsTo better understand the everyday life experiences of GRUM community residents and to get their views on the Erie County health care system, structured questionnaires were completed by members of the GRUM churches and neighborhood residents, and focus groups were held with 229 residents. To facilitate the surveying and focus groups, the GRUM cluster groupings were used to organize and conduct eleven (11) public meetings over a four week period during August and September 2014. The residential location of each person participating in the public meetings was determined from meeting sign-in sheets, and then mapped. This allowed us to determine if participants lived in GRUM neighborhoods and communities and where in the city and county those participants resided.
tHe AffoRdABle CARe ACt, GBUAHN ANd GRUmThe Affordable Care Act (ACA) is the catalytic force that triggered the emergence of GBUAHN and GRUM in their quest to bolster the delivery and quality of health care services in the African American and Latino communities. The ACA expanded health coverage for the poorest citizens by making it possible for states to provide Medicaid eligibility for individuals less than 65 years of age with incomes up to 133% of the federal poverty level (FPL). For the first time, states were able to provide coverage for low-income adults without children and be guaranteed coverage without the need for a waiver. GBUAHN was incorporated in 2009 as an Independent Physician Association (IPA), and became the lead Medicaid Health Home in Western New York as part of a New York State initiative to facilitate the delivery of health care services to Medicaid (and Medicaid eligible) patients.
Medicaid Health Homes are dedicated to integrating and coordinating all primary, acute, behavioral health and long-term services, as well as preventative care and community-based supports, free of charge to Medicaid recipients with chronic health conditions residing in Buffalo and Western New York.
To deepen its linkages to the black and Latino communities and to bolster the delivery of health care services to these places, GBUAHN forged a partnership with the GRUM, a collaborative composed of 61 churches in Buffalo, Cheektowaga, Lackawanna and Niagara Falls. This unique partnership is based on the view that health inequalities can only be addressed by developing a comprehensive approach to health care services that is rooted in prevention and wellness and that is informed by the social determinants of health model. Building such a health care model required forging deep interactive relationships with the black and Latino communities. In this model, GBUAHN would function as a hub with interactive links to the GRUM churches and the communities they served.
This wellness and health care delivery strategy is premised on the belief that the GRUM churches administer services d es i gn ed to meet the needs of both church members and neighborhood residents. In this approach, the church becomes a portal and point of entry into the health care system. The history of black and Latino churches supports their playing this role in the health care system. Historically, churches were positioned in a neighborhood setting, where most of their members lived, and these faith-based institutions have played a significant role in the development of their communities. Today, although most people live in one neighborhood and go to church in another, faith-based institutions are nonetheless rooted in a neighborhood setting, where they continue to develop relationships with community residents.
The GRUM churches represent a wide range of faith-based institutions. Some are very large churches, with full-time pastors and middle-class congregations and offer numerous programs and activities, while others are small

xii Comunity HealtH needs assessment
churches with part-time pastors and working class congregations, and then there are the churches between these two extremes. Some churches have a blend of members who live inside and outside the community, while others have members who mostly reside outside the neighborhood. Some of the churches have strong, interactive relationships with the neighborhoods in which they are located, while others have weaker links. Some of the churches are predominantly black, while others are Latino, and still others have an African immigrant population. However, regardless of their size or type, these churches are nevertheless deeply embedded in the black and Latino communities in Greater Buffalo and improving the delivery of health care services to their congregations and neighbors is the shared interest and social glue that holds them together.
fINdINGs 1. The Greater Buffalo Health Care System has failed to devise and implement a strategy to delivery
effective health care services to the black and Latino communities. The two prime performance indicators supporting this finding are the premature death rates and infant mortality rates among blacks and Latinos.
2. There is a direct connection between housing and neighborhood conditions and the undesirable health outcomes found in the black and Latino neighborhoods.
3. These health inequalities are concentrated on the East Side residential area, where blacks are overrepresented. The five zip codes (14204, 14206, 14211, 14212 and 14215) where the Erie County Department of Health draws 73% of its clinical patients are located on the East Side.
Map 2: Zip Codes from which the Erie County Health Department receives 73% of its Patients
Source: UB Center for Urban Studies

xiii Comunity HealtH needs assessment
4. The remaking of the black East Side is turning the black community into an unstable place, which increases hardship and spawns health challenges. This destructive remaking process is made possible because blacks are building their community on land owned by other people. The problem is that blacks want to develop their community, but the property owners want to make profits on the land. Profit making and economic development is conflicting with community building.
Neighborhood stability matters for four interrelated reasons:
• Social supports and nurturing are critical for producing desirable economic, social, health, and educational outcomes.
• Social supports come from a network of relations with family, friends, acquaintances, and friends.
• Social capital combined with familiarity to construct a neighborhood infrastructure that facilitates trust, solidarity, reciprocity, collaboration, and problem-solving.
• Individuals embedded in stable settings are more likely to have the supports needed to grapple successfully with the stressors and social forces that produce risky behavior, outlaw culture, bad eating habits, overeating, smoking and drug use.
Map 3: Black Population Changes in GRUM Neighborhoods, 2000 – 2008-2012
Source: UB Center for Urban Studies

xiv Comunity HealtH needs assessment
5. Substandard, unhealthy homes are a problem, which is complicated by three interactive issues.
a. Most GRUM residents live in housing units that they do not own. So, they must rely on absentee property owners to upgrade and improve the quality of their homes, which are often drafty, have leaky roofs, asbestos, infestations and are at-risk for lead.
b. Many GRUM homeowners have low-incomes and cannot afford to upgrade, modernize and upgrade the quality of their homes.
c. It is difficult for homeowners and property owners to get financial assistance to make housing improvement in GRUM communities.
6. The health inequalities in Greater Buffalo cannot be eliminated without the radical transformation of the East Side community. The reason is that undesirable health outcomes are concentrated and interwoven into everyday life and culture in this residential area.
Figure 2: Substandard Housing on the East Side
Source: UB Center for Urban Studies
Table 1: Demographic Profile of Select Erie County Zip Codes in Buffalo City
Characteristics US Nys erie Co. Buffalo 14204 14206 14211 14212 14215% in labor force 64.80% 63.80% 63.30% 59.90% 55.90% 60.00% 55.00% 53.90% 59.30%median Household Income $52.762 $56.951 $48.805 $30.230 $20.355 $32.777 $23.949 $26.677 $31.383Per Capita Income 27.951 31.796 27.366 20.072 17.251 19.494 14.686 15.014 17.048% families in Poverty 10.50% 11.00% 10.50% 26.10% 42.50% 16.10% 31.40% 27.60% 27.20%% Individual in Poverty 14.30% 14.50% 14.20% 29.90% 40.40% 20.90% 37.30% 34.50% 28.60%% Black 13.60% 17.20% 14.50% 40.60% 76.90% 11.70% 79.10% 43.90% 82.50%% latino\a 16.30% 17.60% 4.50% 10.50% 9.10% 4.60% 3.60% 2.60% 3.30%% white 74.80% 67.90% 81.50% 52.80% 20.30% 86.70% 18.80% 51.30% 16.00%No High school diploma 14.60% 19.00% 11.10% 19.00% 22.40% 19.40% 23.70% 27.20% 15.50%Source: Erie County, New York, 2014-2017 Community Health Assessment, p. 8

xv Comunity HealtH needs assessment
7. The GRUM community is composed of three distinct geographies: East Side, West Side, and old industrial suburbs. Although each geography is unique, health inequalities is a neighborhood effect in each community, but it manifests itself differently in each locality. Therefore, each segment of the GRUM community must devise a strategy that focuses on its own particularities.
8. The Erie County uninsured and Medicaid populations are overrepresented in the five East Side zip codes and in the GRUM West Side and Lackawanna communities.
9. Health literacy is a serious problem in the GRUM Community. The problem is most dramatically expressed when the survey respondents were asked, “How adequate is your knowledge of the following chronic diseases?” The respondents were give a list of nine chronic diseases and asked to rate their knowledge of these diseases using a scale that ranged from 1 – 10, with 10 being very knowledgeable and 1 being not knowledgeable at all. In all GRUM communities, the respondents indicated that they were “very knowledgeable” about high blood pressure (hypertension). Concurrently, in all communities the respondents said they were “least knowledgeable” about kidney disease. The problem is that high blood pressure will trigger kidney disease if not properly managed. This leads to the conclusion that the perceived knowledge of the respondents about chronic diseases and other health issues is much lower than their actual knowledge of these issues.
Map 4: Percentage of Medicaid Recipients and Uninsured Population in Erie County

xvi Comunity HealtH needs assessment
10. GRUM communities are food swamps and deserts that contribute to undesirable health outcomes. This reality is summed up in the observation that it is easier to buy hamburgers and French fries in the GRUM communities that it is to purchase apple and oranges.
Table 2: GRUM Survey Responses to Knowledge about Chronic Diseases
Ntotal Mean N east side N
west Side N south Buffalo/suburbs
diabetes 229 7.0131 123 7.0244 62 6.1774 34 8.3824
High Blood Pressure 235 7.5404 128 7.5312 62 6.7742 34 9.0000
Heart disease 233 6.5536 126 6.7698 63 5.7937 33 7.1818
Cancer 227 6.5242 123 6.6341 60 5.6000 33 7.6364
kidney disease 225 5.9200 123 6.3252 58 5.1379 33 5.6970
Asthma 231 6.9221 126 7.1508 62 6.0806 32 7.3125
obesity 229 7.0524 125 6.9520 60 6.4167 33 7.8788
depression 229 7.1354 122 7.4754 63 6.2540 33 7.0303
AIds/HIv 232 6.8190 125 7.0080 63 6.2381 33 6.8485 (10=very knowledgeable and 1=not knowledgeable at all)
Source: UB Center for Urban Studies
Figure 3: Poor Access to Food in the GRUM Communities
Source: UB Center for Urban Studies

xvii Comunity HealtH needs assessment
11. Most GRUM residents have poor diets and do not exercise regularly. Their neighborhoods are not very walkable, have few recreational centers and are food swamps/ deserts and service deserts.
12. A tension exists between GRUM community residents and the Greater Buffalo Health System. At the core of this tension is the belief that medical personnel are not really concerned about their health.
a. Focus group respondents say that going to the doctor’s office or clinic is expensive, inconvenient and time consuming.
b. Some respondents say you go to the doctor’s office or clinic only when you are sick.
c. Others believe that doctors don’t really care about them. One respondent put this way, “They call it a medical practice, but they just want to practice on us.”
This viewpoint is problematic on three levels. First, it means that people are less likely to get the check-ups required for early diagnosis and treatment. Second, it means that they are more likely to end up with emergency room visits. When they are sick and need urgent care, the doctor’s appointment schedule, especially if he or she is a specialist, is not likely to accommodate them. So, they go to the emergency room. Third, because they delay treatment until symptoms appear and interrupt everyday life, their rates of hospitalization are likely to be much higher than others.
Figure 4: Walking in Buffalo During the Winter
Source: Henry Louis Taylor, Jr.

xviii Comunity HealtH needs assessment
ReCommeNdAtIoNs1. the Greater Buffalo Urban ministries (GRUm) churches should be turned into decentralized health
care and community development centers, which are connected to the Greater Buffalo Accountable Healthcare Network (GBUAHN).
GRUM consists of both large and small churches with an aggregate membership of over 8,000 parishioners and more than 53,000 community members. They blanket the East Side and are situated in and near every black and Latino community in Greater Buffalo. This, combined with their partnership with the GBUAHN, give them the potential to change significantly the health outcomes in the black and Latino communities.
To realize their potential in practice it will be necessary to build the capacity of the various churches and provide them with the necessary infrastructure to carry out their mission.
Within this framework, a strategic plan should be developed to guide the work of turning GRUM churches into decentralized centers of health care and community development. Regardless of the form they ultimately take, GRUM churches must develop hyper-aggressive neighborhood outreach if they are to be successful.
2. formulate a strategy for GRUm churches to enroll their parishioners and community members into the medicaid program and develop a program of health related activities that target this population.
3. the housing and neighborhood conditions in the black and latinos neighborhoods must be radically transformed if their health outcomes are going to be dramatically improved. The issues outlined in this report cannot be successfully addressed without forging a strategy to turn the communities where blacks and Latinos live into healthy and vibrate neighborhoods in which to live, work, play and raise a family. Therefore, we call for the establishment of a Place-Orientated Development Strategy (PODS) for every GRUM church residential cluster in the Greater GRUM community.
Many of the neighborhood-based health obstacles facing blacks and Latino communities, including low-quality housing, neighborhood blight, health literacy, food and housing insecurity, crime, educational attainment and others cannot be solved outside of the neighborhood context. Therefore, a multi-faceted institution, with the capacity to build trust with the neighborhood, is needed to carry out this health and community building mission. GRUM churches are ideally situated to carry out this task.
4. develop a Neighborhood-based Health literacy Program. Such a program should have the capacity to grapple with two dimensions of the health literacy issue. The first is to provide people with a range of materials and experiences on a sustained and regular basis that target chronic diseases, nutrition, physical fitness, mental health and other information to help them understand and navigate the health care system. The second is to provide them with the ability to translate their health knowledge into practical activities, and to make necessary behavioral changes. The goal of this effort is to change people’s behavior and make healthy living the dominant lifestyle in GRUM communities.
5. develop Neighborhood-based programs and activities to address the food security and physical fitness health challenges. These types of programs can take a variety of forms and should be led by the GRUM churches. Most significantly, they should be made part of the larger POD strategy, which should be implemented in every GRUM community. This is added as a separate recommendation to emphasize its importance.

xix Comunity HealtH needs assessment
6. establish a system of formative and summative evaluations, which uses an outside evaluator to assess the GRUm program and monitor its progress. These evaluations should be used as a tool to strengthen the program and plot a course for continued improvement and development. The evaluation process should be used to monitor program movement towards achieving critical benchmarks and to make sure that the program does not deviate from its original intent.
7. GRUm needs to develop a larger collaborative with partners that help with various aspects of the health and neighborhood development strategy.
PeRfoRmANCe INdICAtoRs1. Number and percentage of GRUM churches that are established as official GRUM health and community
development centers.
a. Although a larger and more complex evaluative system will be established for each of these GRUM health and community development centers, one element of that evaluative system will be the number and percent of parishioners and community residents enrolled by the center.
b. The target population for the GRUM community will be those residents living in the immediate GRUM neighborhood and those living in the larger GRUM community, as defined by the census tract in which the church is located.
c. Establishment of an electronic system, including the appropriate personnel, with the capacity to create and maintain a comprehensive system of data, which makes it possible to acquire and track multiple sources of data.
d. Establishment of a GRUM system wide method of researching and establishing baseline data on a number of health and neighborhood variables needed to track and monitor the progress of GRUM in improving health outcomes in the GRUM community.
2. Number and percentage of GRUM parishioners and community residents, between 18 and 64 years of age, who have at least one chronic disease and that are at-risk for acquiring another, that are enrolled in Medicaid.
3. Number and percentage of GRUM Medicaid enrollees that are serviced by the GBUAHN Health Home.
4. Reduction in the number and percent of preventable hospitalizations among GRUM parishioners and community residents enrolled in the Medicaid program:
a. Reduction in the number and percent of preventable hospitalization and deaths caused by chronic diseases among GRUM parishioners and community residents enrolled in the Medicaid program.
b. Reduction in the number and percent of premature deaths among GRUM parishioners and community residents.
5. The number and percent of GRUM Medicaid members that live at the same address over five to 10 years after enrolling in the program.

xx Comunity HealtH needs assessment
6. The number and percentage of GRUM Medicaid enrollees whose homes are made healthier, including the conditions of the streets and neighborhoods where they live.
7. The number and percentages of locations within GRUM neighborhoods where healthy food choices are made available.
a. The estimated dollar value of healthy foods sold at these locations.
b. The number and percent of healthy food pantries that are established at GRUM churches.
c. The number and percent of people who are serviced at these establishments.
d. The number and percent of healthy cooking classes that are established at GRUM churches.
e. The number and percent of people who attend these classes.
8. The number of fitness programs that are established by GRUM churches and/or their partners, along with the number and percentage of GRUM Medicaid enrollees that attend them.

1 Comunity HealtH needs assessment
OverviewThe quest for wellness and good health is the top challenge facing blacks, Latinos and other low-income groups living in precarious neighborhoods in Greater Buffalo. If people are in poor health they will not be able to meet successfully the challenge of making ends meet and building a better life for themselves and their families. The purpose of this Community Health Needs Assessment is to identify the unmet health challenges of the Greater Buffalo United Ministries (GRUM) community in Erie and Niagara Counties. It will outline a strategy for addressing these needs and develop a set of health indicators and metrics to monitor progress in meeting those needs. This assessment, then, will provide GRUM and its prime partner, the Greater Buffalo United Affordable Healthcare Network (GBUAHN) with the framework needed to forge an implementation strategy to address the unmet health needs of the GRUM community.
Operating within this framework, GRUM’s top priority is to bolster access to health care and improve the quality of that care among blacks and Latinos between the ages of 18 and 64. Specifically it will target individuals who are 1) eligible for Medicaid, 2) have one or more chronic diseases, and 3) are at-risk of acquiring multiple chronic disease. GRUM’s main concern is to enroll these individuals into the Medicaid program, bolster their access to the health care system and improve the quality of their care in that system. GRUM will use success in this phase of its strategic planning process as a foundation upon which to launch other programs and activities, including neighborhood development, to improve wellness and health care among blacks and Latinos.
This Community Health Needs Assessment will use a social determinants of health model to examine the role played by socioeconomic and neighborhood factors in producing health inequalities in Erie County and the City of Buffalo. It will be informed by the view that these social determinants of health are interwoven within everyday life and culture in the black and Latino communities, and therefore, must be understood within a neighborhood context.
PART 1: INTROdUCTION
What Went into this study
6111
249 223
1
public meetings
focus group participants
collaborating churches
common goal
structured intervieWs

2 Comunity HealtH needs assessment
Data anD MethODsA variety of data were used in this assessment of community health needs, including a review of reports and documents on health and health indicators in Erie County. To gain insight into the prevalence of chronic disease, rates of hospitalization and mortality rates among Erie County residents, and to deepen the understanding of health inequalities in Greater Buffalo, a variety of databases were consulted. These reports included the County Health Rankings by the Robert Wood Johnson and University of Wisconsin Population Health Institute, the New York State department of Health’s Erie County Health Rankings by Race and Ethnicity, the New York State Erie County Indicators for Tracking Public Health Priority Areas, and the Preventive Quality Indicators for New York State. In addition, to gain insight into the Medicaid populations and health data on Erie County, the Western and Central New York Safety Net (wcnysafteynet.org) database was utilized.
To gain insight into the population demographics, the U.S. Census Bureau’s American Community Survey, 2008-2012 was consulted through Social Explorer. The American FactFinder 2 search engine on the U.S. Census Bureau website was used to compliment the Social Explorer data when necessary. Additionally, the U.S. Census Bureau Zip Code data Base was used to supplement demographic data on the GRUM population. To better understand the income dynamics impacting the GRUM community, the U.S. department of Housing and Urban development (HUd), FY 2014 Income Limits documentation System, Erie County, New York, and the Penn State Living Wage Calculator, “Poverty in American Living Wage Calculator” were consulted.”1 data on neighborhood conditions were gathered from a variety of sources. In order to understand the walkability of neighborhoods, we used the walkscore database and neighborhoodscout.com. In both instances, the address of a particular GRUM church was used as the neighborhood focal point. We also used the dignity Health Community Needs Index (CNI).
The CNI accounts for the underlying economic and structural barriers that affect overall health outcomes. They gather data on five prominent barriers to health care, which include income, cultural/language, education, insurance and housing by zip code. To determine the severity of these barriers in a given community, the CNI gathers other socioeconomic data, including what percentage of the population is elderly and living in poverty, uninsured, and unemployed. Using this data, a score is assigned to each barrier, with 1 representing less community need and 5 representing more community need. The scores are then aggregated and averaged for a final CNI score, with each barrier receiving equal weight in the average. A score of 1.0 indicates a zip code with the lowest socio-economic barriers, while a score of 5.0 represents a zip code with the most socio-economic barriers.2
1 US Department of Housing and Urban Development, FY 2014 Income Limits Documentation System, Erie County. Online; Penn State Living Wage
Calculator, “Poverty in American Living Wage Calculator,” Online.
2 Dignityhealth.org

3 Comunity HealtH needs assessment
the spatial MethODOlOgyThis Community Health Needs Assessment is concerned with understanding the spatial and neighborhood dimensions of the social determinants of health. The goal is to assist GRUM in the formulation of a strategy to improve the neighborhoods in which GRUM residents live and to bolster access to health care and improve the quality of care among blacks and Latinos between the ages of 18 and 64, who are eligible for Medicaid, who have one or more chronic diseases, and/or who are at risk for acquiring multiple chronic diseases. To deepen our understanding of the role of neighborhoods in contributing to undesirable health outcomes among blacks and Latinos, we studied the communities in which 31 of the 61 churches in the Greater Buffalo United Ministries (GRUM) were located (Map 1).
Map 1: Participating GRUM Churches in Greater Buffalo
Source: UB Center for Urban Studies
To deepen our undersTanding of The role of neighborhoods in conTribuTing To undesirable healTh ouTcomes among blacks and laTinos, we sTudied The communiTies in which 31 of The 61 churches in The greaTer buffalo uniTed minisTries (GRUM) weRe located.
4 Comunity HealtH needs assessment
The GRUM churches are scattered across Greater Buffalo, with 26 churches located in Buffalo City, four (4) in Lackawanna, an industrial suburb to south of the city, and one in the Highland Avenue neighborhood in Niagara Falls, New York. Because the vast majority of GRUM churches (84%) are located in Buffalo City, it was the prime site of the spatial analysis (Map 2).
Map 2: Participating GRUM Churches in Buffalo City
Source: UB Center for Urban Studies
A multi-scalar, socio-spatial methodology was used to examine the interplay among housing, neighborhoods, socioeconomic variables and health outcomes in the GRUM communities. The GRUM neighborhoods were examined at the census block, census tract, “GRUM cluster,” residential area, zip code, citywide and countywide scales. To facilitate this multi-scalar analysis, in Buffalo City the immediate area surrounding the GRUM church [census block] was considered the GRUM neighborhood, while the census tract was considered its community.
The grum neighborhoods were examined aT The census block, census TracT, “grum clusTer,” residenTial area, zip code, ciTywide and coUntywide scales.

5 Comunity HealtH needs assessment
The churches were then grouped together in a series of twelve (12) clusters bases on geographic proximity. These clusters varied in size and were comprised of between one and five churches (Table 1). The churches were grouped together in clusters based on their proximity and location within the City, not only to facilitate the analysis of those areas that faced similar neighborhood and socioeconomic challenges, but also to lay the foundation for them to work together to solve common problems (Map 3).
Table 1: The Buffalo GRUM Churches Organized by Cluster
Cluster 1
Pilgrim Baptist Church
Greater St. Matthews Baptist Church
Miracle Missions Baptist Church
Agape Fellowship Baptist Church
First Shiloh Baptist Church
Cluster 2
Macedonia Baptist Church
First Centennial Baptist Church
St. John Baptist Church
Cluster 3
Mount Olive Baptist Church
New Cedar Grove Life Changing Church
Hopewell Baptist Church
Cluster 4
White Rock Baptist Church
Second Chance Ministries
Cluster 5
Greater Works Baptist Church
Lincoln Memorial United Methodist Church
Bethel African Methodist Episcopal Church
Bethesda World Harvest International Church
Midtown Bible Church
Source: UB Center for Urban Studies
Cluster 6
New Life Restoration Center
Nazareth Baptist Church
Cluster 7
Jordan River Baptist Church
Elim Christian Fellowship
Cluster 8
Asamblea Iglesias de Cristianas
Cluster 9
Revival Church of Buffalo
Cluster 10
Thankful missionary Baptist church
Greater Love Christian Fellowship
Cluster 11
Ebenezer Baptist Church, Lackawanna
First Baptist Church, Lackawanna
Second Baptist Church, Lackawanna
Mount Olive Baptist Church, Lackawanna
Cluster 12
Mount Zion Baptist Church, Niagara Falls

6 Comunity HealtH needs assessment
Map 3: the Buffalo GRUM Clusters
Source: UB Center for Urban Studies
We then divided Buffalo City into eight (8) residential areas and located the GRUM churches (and clusters) within them, while the residential areas in which the Lackawanna and Niagara Falls GRUM churches are located were identified as well (Map 4). Additionally, the GRUM communities were analyzed at the zip code level, and their experiences compared with residents at the Buffalo City and County scales.

7 Comunity HealtH needs assessment
Map 4: Buffalo City’s Eight Residential Areas
Source: UB Center for Urban Studies
A methodology was developed to use Google Earth and Google My Maps to conduct windshield surveys of all of the GRUM neighborhoods. A neighborhood conditions rating scale was developed to make assessments of these localities. Fieldwork and photo digital analysis was used to complement virtual windshield surveys. To gain insight into crime in these neighborhoods, Matthew Wrona, crime analyst for the Buffalo Police department, Erie County Crime Analysis Unit, compiled data on the incident of violent crimes in Buffalo from 2010 to 2013.
a neighborhood condiTions raTing scale was developed To make assessmenTs of each grum neiGhboRhood.

8 Comunity HealtH needs assessment
To better understand the everyday life experiences of GRUM community residents and to get their views on the Erie County health care system, structured questionnaires were completed by members of the GRUM churches and neighborhood residents, and focus groups were held with 229 residents. To facilitate the surveying and focus groups, the GRUM cluster groupings were used to organize and conduct eleven (11) public meetings over a four (4) week period during August and September 2014. The residential location of each person participating in the public meetings was determined from meeting sign-in sheets, and then mapped. This allowed us to determine if participants lived in GRUM neighborhoods and communities as well as where in the city and county those participants lived.
the affOrDable Care aCt, grUM anD gbUahnThe Affordable Care Act (ACA) is the catalytic force that triggered the emergence of GBUAHN and GRUM in their quest to bolster the delivery and quality of health care services in the black and Latino communities. The ACA expanded health coverage for the poorest citizens by making it possible for states to provide Medicaid eligibility for individuals less than 65 years of age with incomes up to 133% of the federal poverty level (FPL). For the first time, states were able to provide coverage for low-income adults without children and be guaranteed coverage without the need for a waiver. GBUAHN was incorporated in 2009 as an Independent Physician Association (IPA), and became the lead Medicaid Health Home in Western New York as part of a New York State initiative to facilitate the delivery of health care services to Medicaid (and Medicaid eligible) patients. Medicaid Health Homes are dedicated to integrating and coordinating all primary, acute, behavioral health and long-term services, as well as preventative care and community-based supports, free of charge to Medicaid recipients with chronic health conditions residing in Buffalo and Western New York.
To deepen its linkages in the black and Latino communities and to bolster the delivery of health care services to these places, GRUM forged a partnership with the GBUAHN, a collaborative composed of 61 churches in Buffalo, Cheektowaga, Lackawanna and Niagara Falls. This unique partnership is based on the view that health inequalities can only be addressed by developing a comprehensive approach to health care services that is rooted in prevention and wellness and that is informed by the social determinants of health model. Building such a health care model required forging deep interactive relationships with the black and Latino communities. In this model, GBUAHN would function as a hub with interactive links to the GRUM churches and the communities they served (Figure 1).
sTrucTured quesTionnaires were compleTed by members of The grum churches and neighborhood residenTs, and focus groups were held with 229 Residents.

9 Comunity HealtH needs assessment
Figure 1: Schematic of GRUM Health Network Relationship with GBUAHN
GBUHN GRUM
GRUMM
GRUM
GRUM
Community Community
Community
GBUAHN
Community
Source : UB Center for Urban Stud ies
This wellness and health care delivery strategy is premised on the belief that the GRUM churches administer services des igned to meet the needs of both church members and neighborhood residents. In this approach, the church becomes a portal and point of entry into the health care system. The history of black and Latino churches supports their playing this role in the health care system. Historically, churches were positioned in a neighborhood setting, where most of their members lived, and these faith-based institutions have played a significant role in the development of their communities.3 Today, although most people live in one neighborhood and go to church in another, faith-based institutions are nonetheless rooted in a neighborhood setting, where they continue to develop relationships with community residents.
The GRUM churches represent a wide range of faith-based institutions. Some are very large churches, with full-time pastors and middle-class congregations and offer numerous programs and activities, while others are small churches with part-time pastors and working class congregations, and then there are the churches between these two extremes. Some churches have a blend of members who live inside and outside the community, while others have members who mostly reside outside the neighborhood. Some of the churches have strong, interactive relationships with the neighborhoods in which they are located, while others have weaker links. Some of the churches are
3 Owens, M.L. (2007), God and Government in the Ghetto: the Politics of Church-State Collaboration in Black America, Chicago: University of Chicago
Press. Emmett, C. F. (2009). “The Siting of Churches and Mosques as an Indicator of Christian–Muslim Relations.” Islam and Christian–Muslim Relations
20(4): 451-476.

10 Comunity HealtH needs assessment
predominantly black, while others are Latino, and still others have an African immigrant population. However, regardless of their size or type, these churches are nevertheless deeply embedded in the black and Latino communities in Greater Buffalo and improving the delivery of health care services to their congregations and neighbors is the shared interest and social glue that holds them together.

11 Comunity HealtH needs assessment
erie COUnty pOpUlatiOn DistribUtiOn Although the GRUM churches have a presence in Erie and Niagara Counties (Map 1), the focal point of this Community Health Needs Assessment will be on the black and Latino experience in Buffalo and Erie County. The start point in understanding their health status is to understand how the population is distributed across Erie County (Map 5). In the United States, there is a hierar-chical , spatial ordering of neighborhoods, which forms a socioeconomic grid that dictates where a person lives and the health status of the place in which he/she resides.
Map 5: Erie County and Niagara County, New York
Source: UB Center for Urban Studies
PART 2: THE ERIE COUNTy HEALTH CHALLENGE
in The erie counTy, There is a hierarchical, spaTial ordering of neighborhoods, which forms a socioeconomic grid ThaT dicTaTes where a person lives and The healTh sTaTus of The place in which he/she Resides.

12 Comunity HealtH needs assessment
Erie County and the central city of Buffalo are shrinking. Between 2000 and 2013, the population of Erie County declined from 950,265 to 919,866, a drop of about 3.2%. Concurrently, 34,000 people left Buffalo City as the population dipped from 292,648 to 258,959, a 12% decline.4 This age of shrinking, after four decades of continuous population loss, could be ending. Between 2010 and 2013, demographic data suggest that the population of Erie County may be stabilizing. Between 2010 and 2013, the population of the county increased by 802 residents, a slight increase of 0.09%. Buffalo City’s population, however, has continued to decline. Between 2010 and 2013, it dropped by 2,360 residents, a decrease of about 0.91%.
In Erie County, the interplay between income and location preference form a sieve which sorts and sifts people across different neighborhoods in the county, and this income-based process leads to the uneven distribution of the population across the suburbs and central city by race and ethnicity (Table 2). For example, in the county, whites constitute 81% of the population, but make-up only 18% of the residents of Buffalo City (Map 6). Concurrently, blacks only constitute 14% of the county population, but they comprise 78% of the residents of Buffalo City. About 60% of Erie County Latinos live in the City of Buffalo. Bi-racial residents (people reporting two or more races) on the other hand, are about evenly distributed between the central city and suburbs.
4 U.S. Census Bureau, American Fact Finder
Table 2: the Distribution of Erie County Population by Race
Erie County Population by Race County Number Buffalo % of City Population
City as % of County
Total Population 2013 919,866 258,959
white alone 80.70% 742,332 130,515 50.4% 18%
Black alone 13.90% 127,861 99,958 38.6% 78%
Hispanic alone 4.90% 45,073 27,190 10.5% 60%
asians 2.90% 26,676 8,027 3.2% 30%
Two or More Races 1.80% 16,558 8,028 3.1% 49%
Source: U.S. Census, American Fact finder, 2013

13 Comunity HealtH needs assessment
Map 6: Population Distribution by Race in Niagara and Erie Counties
Source: John dewitt, Censusscope.org and University of Michigan. Online
bUffalO City pOpUlatiOn DistribUtiOnBlacks and Latinos, although they are concentrated in the central city, are not evenly distributed across Buffalo City. While blacks are dispersed across the city, they are nevertheless concentrated on the East Side. Likewise, although whites live in every section of Buffalo, they are overrepresented on the West Side, Black Rock and in South Buffalo (Map 7). The Latino population is dispersed across the city, but they are also concentrated on the on the West Side, Black Rock and in South Buffalo. However, unlike blacks and whites, the Latinos are clustered, but do not dominate any residential space, sharing residential space with other groups everywhere in Buffalo. Equally important, they built their neighborhoods in the old West Side, Black Rock and South Buffalo industrial zones, localities that are near the New York State Thruway and the Peace Bridge, which connects Buffalo to Canada (Map 8). In this residential area, they

14 Comunity HealtH needs assessment
share space with blacks and a growing immigrant population, which consists of about 29 ethnicities that speak some 31 languages and dialects. Similarly, the black community built its neighborhoods in the city’s old industrial zones. The result is that both blacks and Latinos are building their communities on some of the most undesirable residential lands in Greater Buffalo. This means that environmental issues and black and Latino neighborhood development are conjoined.
Map 7: Black and White Population Distribution in Buffalo City, 2006
Source: City of Buffalo
There are also four (4) GRUM churches in Lackawanna, New York, a suburb that borders Buffalo to the south, and one GRUM church in the Highland neighborhood in Niagara Falls, New York, which is situated in Niagara County. These two predominately black communities are positioned in similar neighborhood settings, even though they are located in different parts of Greater Buffalo. Both neighborhoods are working class communities situated in old industrial settings. Lackawanna was founded by the Lackawanna Iron and Steel Company in 1903, while the Highland Park neighborhood is located in the heart of Niagara Falls’ old industrial belt. So, both communities are brownfield neighborhoods situated near major transportation thoroughfares.
blacks and laTinos are building Their communiTies on some of The mosT undesirable residenTial lands in GReateR bUffalo.

15 Comunity HealtH needs assessment
Map 8: Distribution of Latinos in Buffalo and Map of the Buffalo Industrial Zones (1937)
Source: City of Buffalo and Buffalo Municipal Housing Authority (1932)
the COUnty health rankingsThe social geography described above is interwoven with neighborhood conditions and socioeconomic variables that produce undesirable health outcomes, chronic diseases, and negatively impact life expectancy. These neighborhood conditions and socioeconomic factors are embedded in the health factors that inform the social determinants of health. To deepen our understanding of the health dimensions of this social geography and the interplay among the location of people in geographic space, socioeconomic factors and health outcomes, we need to examine the Erie County Health Rankings.
About the DataThese local health rankings are part of the larger County Health Rankings program administered by the Robert Wood Johnson Foundation and the University of Wisconsin Population Health Institute.5 The annual rankings are based on a social determinates of health model, and they are designed to measure the interplay between health factors and health outcomes, with the goal of showing how health is influenced by where we live, learn, work and play (Figure 2). In the county ranking process, a set of health factors which significantly impact health outcomes are identified. The health factors consist 5 Robert Wood Johnson, Countyhealthrankings.Org. Online.
neighborhood condiTions and socioeconomic facTors are embedded in The healTh facTors ThaT inform The social deTerminanTs of health.

16 Comunity HealtH needs assessment
of the physical environment (10%), social and economic factors (40%), clinical care and access (20%) and health behavior (30%). Each of these factors is then given a weight according to their perceived impact on health outcomes. There are two points worth noting here. The first is that clinical factors are only given only a 20% weight in the ranking system, while socioeconomic factors and behavior are given a combined 70% weight in the health factors rankings.
The two (2) prime health outcomes targeted in the county rankings are quality of life, which focuses on health status, poor physical health days, poor mental health days and low-birth weight. The second, length of life, measures premature death, which refers to any death that occurs before age 75. In the Health Outcomes ratings, length of life (50%) and quality of life (50%) are given equal weight. Within this framework, all of the counties in a given state are rank-ordered and those with the highest ranking are considered the healthiest.
Figure 2: The Social Determination Model
Source: Robert Wood Johnson Foundation
The Two prime healTh ouTcomes TargeTed in The counTy rankings are qualiTy of life and lenGth of life.
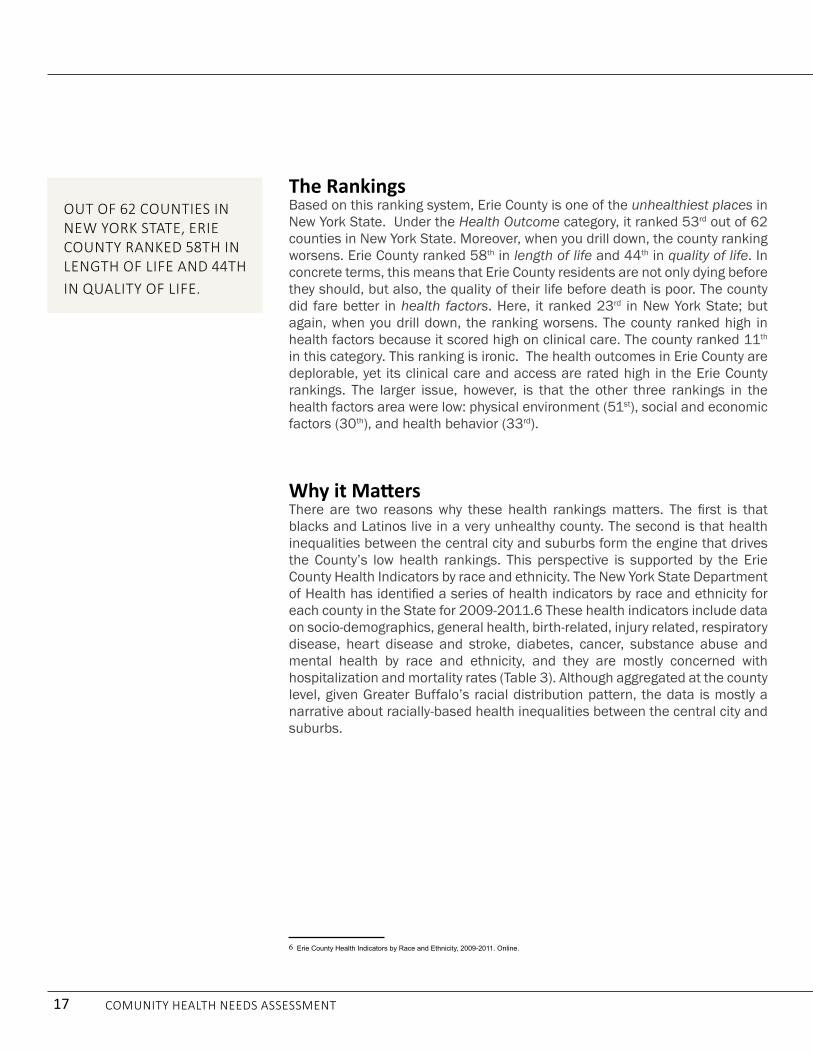
17 Comunity HealtH needs assessment
The RankingsBased on this ranking system, Erie County is one of the unhealthiest places in New York State. Under the Health Outcome category, it ranked 53rd out of 62 counties in New York State. Moreover, when you drill down, the county ranking worsens. Erie County ranked 58th in length of life and 44th in quality of life. In concrete terms, this means that Erie County residents are not only dying before they should, but also, the quality of their life before death is poor. The county did fare better in health factors. Here, it ranked 23rd in New York State; but again, when you drill down, the ranking worsens. The county ranked high in health factors because it scored high on clinical care. The county ranked 11th in this category. This ranking is ironic. The health outcomes in Erie County are deplorable, yet its clinical care and access are rated high in the Erie County rankings. The larger issue, however, is that the other three rankings in the health factors area were low: physical environment (51st), social and economic factors (30th), and health behavior (33rd).
Why it MattersThere are two reasons why these health rankings matters. The first is that blacks and Latinos live in a very unhealthy county. The second is that health inequalities between the central city and suburbs form the engine that drives the County’s low health rankings. This perspective is supported by the Erie County Health Indicators by race and ethnicity. The New York State department of Health has identified a series of health indicators by race and ethnicity for each county in the State for 2009-2011.6 These health indicators include data on socio-demographics, general health, birth-related, injury related, respiratory disease, heart disease and stroke, diabetes, cancer, substance abuse and mental health by race and ethnicity, and they are mostly concerned with hospitalization and mortality rates (Table 3). Although aggregated at the county level, given Greater Buffalo’s racial distribution pattern, the data is mostly a narrative about racially-based health inequalities between the central city and suburbs.
6 Erie County Health Indicators by Race and Ethnicity, 2009-2011. Online.
ouT of 62 counTies in new york sTaTe, erie counTy ranked 58Th in lenGth of life and 44th in qUality of life.

18 Comunity HealtH needs assessment
Three of the variables on this list provide a preface to the narrative on black and Latino health in Erie County. The first is the tandem of infant mortality and low-birth weight. Dr. John Ruffin, the founding director of the National Institute on Minority Health and Health disparities National Institutes of Health has stated that infant mortality and low-birth weight tells the health story of a people. He states that when these figures are high, the health indicators at other stages in the lifecycle are also going to be poor.7 The Erie County Health Indicators by Race and Ethnicity supports Ruffin’s thesis. In Erie County, the black infant mortality rate is 171% greater than the white infant mortality rate, and the Latino infant mortality rate is 125% greater than the white infant mortality rate, while the percentage of black low birth weight babies is 94% higher than whites, and the Latino percentage of low birth weight babies is 38% greater than whites. Given this backdrop, it is not surprising that blacks die prematurely at a rate that 73% greater than whites, while Latinos die at a rate that is 84% greater than whites.
7 John Ruffin and Henry Louis Taylor, Personal Conversation, September 22, 2014, Buffalo, New York.
Table 3: Select Health Indicators for Erie County by Race and Ethnicity 2009 – 2011
health issue white Blacks asian/pi Latino% premature Death 35.5 61.3 na 65.4
% Low Birth Weight Births (< 2.5 Kg) 6.8 13.2 7.1 9.3
infant Mortality per 1,000 live births 5.6 15.2 5 12.6
Diseases of the Heart Mortality per 100,000, Age-adjusted 186.8 238.8 82.8 143
Cerebrovascular Disease (Stroke) Mortality per 100,000* 39.6 57.8 na 37.6
Coronary Heart Disease Mortality per 100,000* 129.1 161.5 49.9 95.1
Diabetes Mortality per 100,000* 19.5 41.6 na 25.1
Colorectal Cancer Mortality per 100,000, Age-adjusted (2008-2010) 14.3 19.8 na 11.1**
Congestive Heart Failure Hospitalizations per 10,000* 22.7 49.2 3.9 25.3
Diabetes Hospitalizations per 10,000 (Any Dx ICD9 250)* 156.1 365.6 58.2 274.4
Asthma Hospitalizations per 10,000, Age-adjusted 8 33.8 7.2 29.2
Chronic Lower Respiratory Disease Hospitalizations per 10,000* 22.3 54.5 10.7 42.8
Drug-related Hospitalizations per 10,000, Age-adjusted 24.1 46.4 1.2 40.2
Lung Cancer incidence per 100,000, Age-adjusted (2008-2010) 74.5 89.9 27.1** 42.2
*Age Adjusted
** Fewer than 10 events in the numerator. The rate is unstable/PI =Pacific Islander
Source: New York State department of Health, Erie County Health Indicators by Race and Ethnicity 2009 -2011, Online.
blacks die premaTurely at a Rate that 73% greaTer Than whiTes, while laTinos die at a Rate that is 84% greaTer Than whiTes in eRie coUnty.

19 Comunity HealtH needs assessment
The data show that the coronary heart mortality rate among blacks is 25% greater than whites, while their diabetes mortality rate is 113% greater. The disparities in terms of hospitalization are also significant. Blacks have an asthma hospitalization rate that is 323% higher than whites and a diabetes hospitalization rate is 134% higher. A similar picture exists among Latinos. Their Chronic Lower Respiratory disease hospitalization rate is 92% greater than whites, while their diabetes hospitalization rate is 76% greater, and the asthma hospitalization rate is 265% greater. Most of these higher than expected hospitalization rates could have been prevented if blacks and Latinos were treated earlier and/or if their communities had very aggressive outpatient programs.
neighbOrhOODs anD the sOCial DeterMinants Of healthThese findings show that the relationship among race, ethnicity and the social determinants of health are interwoven with place. Low-incomes cause most blacks and Latinos to live in the City of Buffalo. Consequently, these County Health Indicators are a tale of health inequalities between the central city and suburbs. This perspective is supported by data from the Erie County Department of Health. There are five zip codes (14204, 14206, 14211, 14212, and 14215) from which the Erie County department of Health draws 73% of its clinic patients. All five zip codes are located in Buffalo City (Table 4).
There are significant socioeconomic inequalities between these five zip codes and the Erie County suburbs. The median household and per capita incomes are much lower here than in the suburbs. Also, the labor force participation rates and educational attainment levels are lower, while the poverty level is much higher. A comparison of the five Buffalo zip codes also reveals a geographically-based class division within Buffalo City. They are also the poorest spatial units in Buffalo City. For example, the poverty rate is much higher than the citywide poverty rate in four of the five zip codes, while the median household income is lower than the citywide median in 3 of the 5 zip codes, and the labor force participation rate is lower than the citywide rate in 4 of the 5 census tracts.
There are five zip codes (14204, 14206, 14211, 14212, and 14215) from which The erie counTy deparTmenT of health dRaws 73% of its clinic patients. They are also The pooresT spaTial uniTs in bUffalo city.

20 Comunity HealtH needs assessment
The existence of a relationship between these socioeconomic factors and health outcomes is supported by an examination of data from the Erie County Preventive Quality Indicators (PQI), which demonstrate that health outcomes are significantly lower in the five zip codes in question than those in the county as a whole. For example, the PQI data for zip code 14215 shows that the hospital admissions are 150% of what would be normally expected in that zip code. Additionally, there is a significant racial disparity with African Americans’ hospital admissions at 210% of what was expected for this zip code, whereas the white population experienced a hospital admissions rate of only 55% of what was normally expected. The findings are very similar in zip codes 14206, 14211, and 14212.
There is more to this story. These zip codes are not randomly located in Erie County, but they are situated on the East Side of Buffalo, where the African American population is concentrated. This means the story of health problems and health inequalities in Erie County is largely a story of the African American and Latino populations (Map 9).
Table 4: Demographic Profile of Select Erie County Zip Codes in Buffalo City
Characteristics Us nys Erie Co. Buffalo 14204 14206 14211 14212 14215% in Labor Force 64.80% 63.80% 63.30% 59.90% 55.90% 60.00% 55.00% 53.90% 59.30%Median Household Income $52.762 $56.951 $48.805 $30.230 $20.355 $32.777 $23.949 $26.677 $31.383Per Capita Income 27.951 31.796 27.366 20.072 17.251 19.494 14.686 15.014 17.048% families in poverty 10.50% 11.00% 10.50% 26.10% 42.50% 16.10% 31.40% 27.60% 27.20%% Individual in Poverty 14.30% 14.50% 14.20% 29.90% 40.40% 20.90% 37.30% 34.50% 28.60%% Black 13.60% 17.20% 14.50% 40.60% 76.90% 11.70% 79.10% 43.90% 82.50%% Latino\a 16.30% 17.60% 4.50% 10.50% 9.10% 4.60% 3.60% 2.60% 3.30%% white 74.80% 67.90% 81.50% 52.80% 20.30% 86.70% 18.80% 51.30% 16.00%No High School Diploma 14.60% 19.00% 11.10% 19.00% 22.40% 19.40% 23.70% 27.20% 15.50%Source: Erie County, New York, 2014-2017 Community Health Assessment, p. 8

21 Comunity HealtH needs assessment
Map 9: Zip Codes from which the Erie County Health Department receives 73% of its Patients
Source: UB Center for Urban Studies
To eliminaTe healTh inequaliTies and dramaTically improve healTh ouTcomes among blacks and laTinos, we musT radically Transform The neighborhoods in which they live.
These zip codes are noT randomly locaTed in erie counTy, buT They are siTuaTed on The easT side of buffalo, where The african american populaTion is concentRated.

22 Comunity HealtH needs assessment
Why it MattersThese zip code boundaries obscure the reality that within them are a series of discrete neighborhoods, which are linked together and morphed into the largely black East Side community. This use of zip codes is a non-spatial way of thinking about black neighborhoods. Black and Latino neighborhoods are geographically-based communities, where socioeconomic variables are deeply embedded in everyday life and culture. For this reason, the social determinants of health cannot be understood fully outside of the neighborhood context. This is particularly important in the United States because the urban housing market continuously steers blacks and Latinos into predominantly low-income neighborhoods where conditions are precarious and distressed.
The urban land-rent grid will place blacks and Latinos in the most undesirable locations, wherever they live in the urban metropolis. For this reason, scholars Robert J. Sampson and Patrick Sharkey say that blacks and Latinos are stuck in place. They move frequently, but only into neighborhoods that are precarious and distressed places. Simply put, blacks and Latinos are not going to move to neighborhoods of opportunity, since the land-rent structure will erect barriers to keep this from happening. Therefore, to eliminate health inequalities and dramatically improve health outcomes among blacks and Latinos, we must radically transform the neighborhoods in which they live. The start point in this process is to deepen our understanding of how life in precarious and distressed neighborhoods contributes to undesirable health outcomes.
Place and the Medicaid PopulationThe prime focus of the GRUM initiative are those individuals who are between ages 18 and 64 years, who are eligible for Medicaid and who have multiple chronic diseases, or who have one chronic disease, but are at-risk for acquir-ing another. In the United States, there is a class and racial dimension to the health inequalities problem. Because of the way the health care system in the United States operates, low-income groups and people of color are most likely to experience health problems and have less access to the health care system than higher income groups and whites.
In Erie County, the lowest income groups are going to be overrepresented in Buffalo City, so it is here that we will find the highest concentration of resi-dents who are either enrolled in Medicaid or who are eligible for Medicaid (Maps 10 and 11). Also, given the overrepresentation of chronic diseases, morbidity, mortality and preventable hospitalizations found in Buffalo City, along with the concentration of uninsured individuals, there will be both a large Medicaid population, and Medicaid eligible population with multiple chronic diseases and/or who have one chronic disease, but who are at-risk for acquiring another.
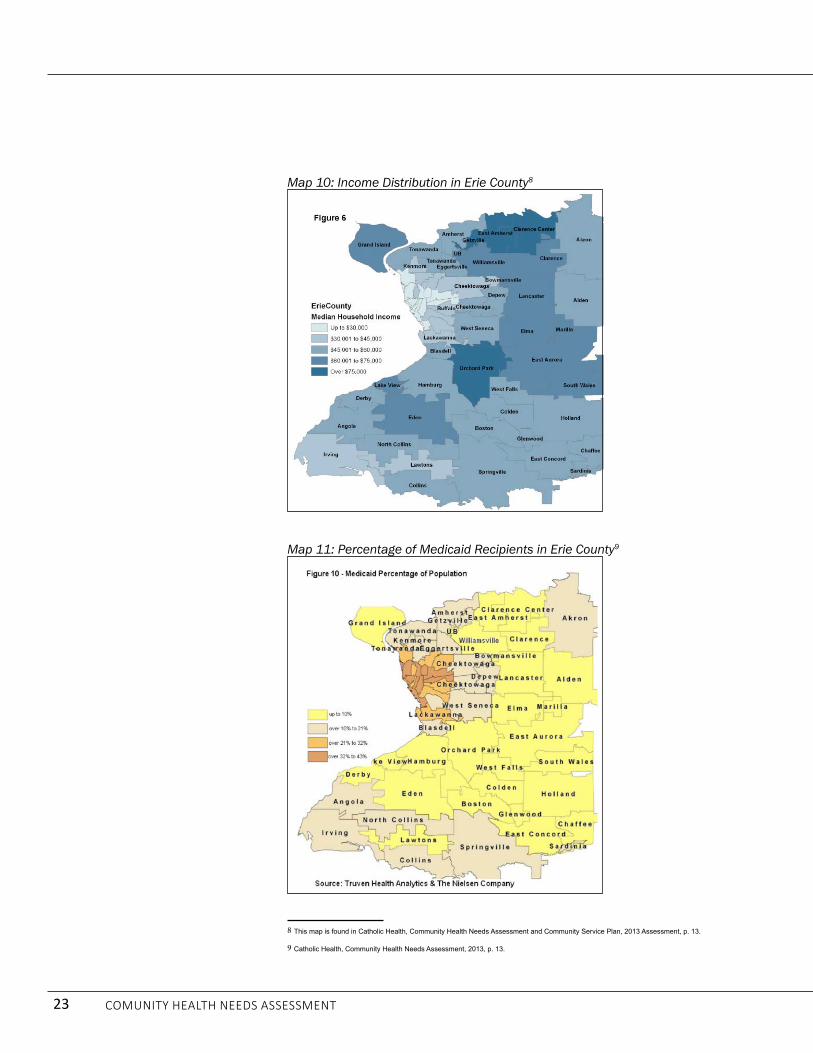
23 Comunity HealtH needs assessment
Map 10: Income Distribution in Erie County8
Map 11: Percentage of Medicaid Recipients in Erie County9
8 This map is found in Catholic Health, Community Health Needs Assessment and Community Service Plan, 2013 Assessment, p. 13.
9 Catholic Health, Community Health Needs Assessment, 2013, p. 13.

24 Comunity HealtH needs assessment
the greater bUffalO health Care systeMIn Erie County, clinical care, which includes access and quality of care, is ranked 11th in New York State. The Greater Buffalo health care network is anchored by several large hospital systems, including Kaleida Health, the Catholic Health System, the Erie County Medical Center Corporation, Roswell Park Cancer Institute, the Veterans Administration (VA) Hospital Care System and the Erie County department of Health. Within this system, there are a number of hospitals, including Buffalo General Medical Center, Gates Vascular Institute, deGraff Memorial Hospital, Millard Fillmore Suburban Hospital, Women & Children’s Hospital of Buffalo, Kenmore Mercy Hospital, Mercy Hospital, Sisters of Charity Hospital, Sister of Charity Hospital—St. Joseph Campus, the VA Hospital, and Erie County Medical Center.
The Greater Buffalo health care system also includes long-term care facilities, dozens of outpatient clinics, urgent care facilities, and more than a 1,000 affiliated physicians. Added to this mix are the health insurance associations, along with numerous organizations and institutes, such as the Wellness Center, the P2 Collaborative, and social service providers that are devoted to improved health care in Greater Buffalo.10 Within this framework, there are dozens of organizations that provide health care and social services to Medicaid members.11 Additionally, the region’s largest economic sectors are health care and education, with their growth being driven by the Buffalo Niagara Medical Campus (BNMC) and the University at Buffalo.12
Even though Erie County has one of the top health care systems in New York State, health outcomes for blacks and Latinos are very undesirable. Therefore, to improve health outcomes and eliminate health inequalities among this population, it will be necessary to gain deeper insights into the neighborhood and socioeconomic forces that erect barriers to wellness and access to health care in Buffalo and Erie County. Then, on the basis of this insight, we will be able to design a system that will remove the obstacles, thereby increasing wellness and the quality of health care among blacks and Latinos. This is the pathway to desirable health outcomes for blacks and Latinos in Erie County.
10 John Snow, Inc. Western New York Primary Care Assessment, Health Foundation for Western and Central New York, January 2014.
11 Salient Medicaid Data Version 6.4.online.
12 Forbes, Forbes.com
even Though erie counTy has one of The Top healTh care sysTems in new york sTaTe, healTh ouTcomes for blacks and laTinos are very UndesiRable.

25 Comunity HealtH needs assessment
the ChUrCh: anChOr Of the grUM COMMUnityThe GRUM churches anchor the Greater Buffalo GRUM community, and they will form the critical connector between the black and Latino communities and the Greater Buffalo United Accountable Healthcare Network (GBUAHN) Health Home. Led by a group of black and Latino ministers, the GRUM churches seek to play a leading role in building a healthcare pipeline that will connect thousands of blacks and Latinos to the GBUAHN Health Home, thereby taking a giant step forward in the elimination of health inequalities in Greater Buffalo (Figure 3). The unique partnership between GRUM and GBUAHN is based on the view that health inequalities can only be addressed by using a social determinants of health model, by developing a comprehensive approach to health care services rooted in prevention and wellness, and by radically transforming black and Latino neighborhoods. developing such an approach to health care requires forging deep interactive relationships with the black and Latino communities, and the black and Latino church is the social institution most strategically located to realize this practice.
This approach to prevention and wellness is premised on the belief that GRUM churches in partnership with GBUAHN have the capacity to design and implement programs that can meet the health needs of church members and community residents and that the GRUM churches can unite with others to radically rebuild and recreate their communities. In this way, the GRUM churches will become a portal for blacks and Latinos to enter the Greater Buffalo health care system.
PART 3: THE GREATER BUFFALO GRUM COMMUNITy
Figure 3: GRUM Ministers Organizing to carry out the Community Health Survey
Source: UB Center for Urban Studies

26 Comunity HealtH needs assessment
the grUM ChUrChesThirty-two GRUM churches participated in the church survey. However, only 23 (72%) of the churches surveyed in the analysis of GRUM churches participated in both the church survey and the Community Health Needs Assessment and Focus Groups. Moreover, some of the census tracts in which these churches are located were not included in the demographic analysis, which was based on census tract data. However, seven of the nine GRUM non-clustered churches, which participated only in the church survey, are located on Buffalo’s East Side and are situated near the East Side GRUM clusters (Map 12). The other two GRUM non-clustered churches are situated in Buffalo City neighborhoods, which are similar to the West Side GRUM neighborhoods. Thus, the inclusion of these nine churches will not obscure the overall analysis.13
Map 12: GRUM Non-Clustered Churches
Source: UB Center for Urban Studies
13 The respondents for 24 of the 32 surveys were the pastor, while eight surveys were completed by the associate pastor, church administers and church
officials knowledgeable of the church operations and membership.
32 grum churches parTicipaTed in The chURch sURvey.

27 Comunity HealtH needs assessment
Church MembershipThe aggregate membership of GRUM churches is 8,852, with the church congregations ranging widely in terms of size. The largest GRUM church has 3,000 members, while the smallest has only about 10 members. The average GRUM church has about 275 members with a median of 150 church members. The GRUM churches are mostly African American churches. In the 28 churches reporting the racial make-up of their parishioners, they indicated that 87% of the membership was African American, with the remainder being Latinos and blacks from Africa and the Caribbean. All of the Latinos were from Puerto Rico. According to the GRUM churches, less than one percent of their membership was white. Thus, the GRUM church members are largely African American and Puerto Rican, with a handful of African and Caribbean blacks.
Although the GRUM churches are rooted in their communities, most of the parishioners did not live in the GRUM neighborhood where the faith-based institution is located.14 According to the surveys, 30% of the church parishioners live in the GRUM neighborhood, while 62% did not.15 This is not surprising. Today, because of the high levels of “contextual” residential mobility among people of color, most folks do not attend neighborhood churches. At the same time, most (74%) of those parishioners living outside their church’s neighborhood nevertheless resided in Buffalo City.
14 In this study, the “neighborhood” is defined as an area comprising about four to five square blocks in which the church is located.
15 We asked the informants to estimate the percentage of their members who lived inside and outside the neighborhood. The estimates did not always
amount to 100 percent.
Figure 4: Mt. Olive Baptist Church
Source: UB Center for Urban Studies

28 Comunity HealtH needs assessment
GRUM Church Relationship with the NeighborhoodMost church members live outside of the GRUM neighborhood, which helps to explain the “weak” connections that many GRUM churches have with the neighborhoods in which they are located. Using a scale of 1 to 5, with 1 being very good and 5 being poor, we asked church leaders to rate the relationship of their church with residents of the immediate neighborhood. About 18 or 58% of the churches said their relationships with their immediate neighborhood ranged from “tolerable”[ not good and not bad] to poor, while 23% said they had “good” relations with their neighborhood and 19% said they had “very good” relations with their neighborhoods.
Figure 5: Greater St. Matthews Baptist Church
Source: UB Center for Urban Studies

29 Comunity HealtH needs assessment
Neighborhood ConditionsWe then asked the church leader and/or administrator to rate their neighborhoods on a scale of 1 to 5, with 1 being very good and 5 being very poor. Seventy-two percent (N=23/32) of the churches said that crime was a problem in their neighborhoods, with 34% (N= 11/32) of the churches saying that it was very problematic.16 In terms of housing, 77% (N=23/31) of the churches said that housing in their neighborhood ranged from “tolerable” to very poor. Only three churches said housing in their neighborhood was very good.
Next, using the same 1-5 rating scale, the churches were asked to rate their neighborhood’s physical environment. About 81% said the church neighborhood environment ranged from “tolerable” to very poor, with 42% saying it was very poor.
The same rating scale was used to evaluate the neighborhood’s access to services [parks, groceries, schools, and supportive services]. Seventy-two percent (N=27/32) said the neighborhood’s access to services ranged from “tolerable to very poor.” Lastly, the churches were asked to evaluate the overall conditions of life in their neighborhood. Eighty-four percent (N=27/32) believed that their neighborhood conditions ranged from “tolerable” to “very poor.”
16 There were 31 responses to this question.
Figure 6: Housing and Neighborhood Conditions in GRUM Community
Source: Google Earth, 2012
77% of The churches said ThaT housing in Their neighborhood ranged from “Tolerable” To veRy pooR.

30 Comunity HealtH needs assessment
GRUM Church Health and Supportive Service ProgramsThe churches were asked about the programs they offered to parishioners and neighborhood residents. They offered a wide range of health and health related programs that ranged across health education, gardening, exercise, food, counseling and the provision of clothes, along with programs in computer literacy and basic education. The most widely held programs were food related, including gardening programs. In this section, we did not ask them to evaluate the quality of the program, nor did we ask to give estimates of the number of participants in each program. In this analysis, we were only concerned with the types of programs being offered.
Why it MattersThe GRUM churches are the lead institution in the quest to build an interactive pipeline between the black and Latino communities and the GBUAHN Health Home. Thus, knowing their capacity, along with the kind and types of churches that comprise GRUM, as well as the church leadership’s view of, and relationship with, their host communities is critical to planning a program of action to connect the community to the GBUAHN Health Home. It is also essential to learn as much as possible about the GRUM community itself, so that the GRUM’s programmatic activities are aligned with health needs of its community.
pOrtrait Of the grUM COMMUnityThe 31 GRUM churches in Greater Buffalo are strategically located in and near every major black and Latino community in Greater Buffalo (Map 13). They are situated in 19 census tracts, with 17 of the census tracts (CT) located in Buffalo City. Fifteen GRUM census tracts are located on the East Side and two on the West Side, including the Black Rock Neighborhood. The remaining two CTs are located in Lackawanna and Niagara Falls. The 19 CTs were organized into 12 residential clusters, with a total population of 71,872 residents, with 85% (N= 60,823) living in Buffalo City, according to the 2008-2012 U.S. Census Bereau’s American Community Survey. Eight of the GRUM clusters are found on the East Side, two are on the West Side, including Black Rock, and there is a GRUM cluster in both Lackawanna and in Niagara Falls.

31 Comunity HealtH needs assessment
Map 13: GRUM Churches in Relationship to the Black and Latino Communities
Source: UB Center for Urban Studies
The Buffalo City East SideMost GRUM churches (N=24/77%) are located on Buffalo’s East Side and 80% (N=53,267) of the GRUM residents live in this part of Buffalo City.17 Most significant, the most severe health problems facing blacks and Latinos are located on the East Side, and it is here that the worst housing and neighborhood conditions in the Greater Buffalo GRUM community are found. The East Side, then, is the foundation upon which the GRUM healthcare strategy will be built. Within this framework, the social determinants of health framework suggest that undesirable health inequalities cannot be reduced without radically improving housing and neighborhood conditions. Therefore, the first step in this process is to use a health perspective to gain insight into the city building process driving the development of the East Side.
17 One of the East Side GRUM churches is located on the western side of Main Street, technically making it a West Side church. Nonetheless, because
of its proximity to Lincoln Memorial Church, we decided to treat it as an East Side Church.
77% of The grum churches are locaTed on buffalo’s east side.

32 Comunity HealtH needs assessment
The East SideThe East Side is undergoing a radical remaking process in which land-use is being repurposed and multiple activities are taking place, which are designed to maximize the profitability of land.18 This remaking process has turned the entire East Side into a Zone of Change (ZOC), with the most intense development activities taking place in the greater downtown district.19 For example, according to the Buffalo Urban development Corporation (BUdC), millions of dollars of new and planned investments are taking place in the broadly defined downtown Buffalo, which covers a significant portion of the lower East Side. These developments are mostly targeted for the eastern side of Main Street, with investments falling into about six categories: medical/medical related research and development, office construction, tourism and hospitality, residential, mixed developments and a wide variety of unclassified activities. In all, the BUdC says that over $5 billion is being invested in the downtown region, spawning concentric investment zones that spiral outward from the central business district, covering most of the lower East Side.
The Contradiction between Economic and Social DevelopmentThese concentric investment zones become priority targets for real estate developers that seek to flip low value lands into high value profit-making ventures.20 For example, the lower East Side is being turned into Buffalo’s prime entertainment destination. It now houses Canalside, HarborCenter, the Cobblestone district, the Seneca Buffalo Creek Casino, the Inner Harbor Infrastructure Project, Silo City, the Outer Harbor, the Michigan Avenue Heritage Project, the Larkin district and the evolving Ohio Street revitalization effort. Further north, but still in the lower East Side, the Buffalo Niagara Medical Campus is triggering massive developments within a 30 block radius, and with such investments rents are skyrocketing in the area.21 To take advantage of the demand for housing, the developer Mark Trammell is proposing the transformation of Pilgrim Village, from a low-income housing development to an apartment building geared for seniors, medical students and higher-paid campus workers. If approved, this development would reduce dramatically the number of affordable housing units available to low-income residents in the Fruit Belt community.22
18 The term gentrification is too narrowly defined to capture the complicated dynamics of ZOC, where land-use conversions occur at multiple-levels and
that often includes a process of planned abandonment.
19 We use the term, “greater downtown” because the Buffalo planning definition of downtown has included area more than two miles from the Central
Business District.
20 Buffalo Urban Development Corporation, Downtown Buffalo Projects, 2013. Online.
21 Buffalo News, Development near the Buffalo Niagara Medical Campus shows the city is shaking off decades of despair,” October 4, 2004. Online.
22 Buffalo News, “New housing plans near medical campus seek approval,” October 7, 2014. Online.
The easT side is undergoing a radical remaking in which land-Use is beinG repurposed and mulTiple acTiviTies are Taking place, which are designed To maximize The iTs pRofitability.

33 Comunity HealtH needs assessment
In the Upper East Side, Ciminelli Real Estate Corporation has announced plans to build 600 new housing units in the Central Park Plaza, which will catalyze redevelopment activities across the Leroy community. In describing the apartment’s prime clients, Ciminelli said, “We’re looking to the suburban market and people relocating to the area to capitalize on the thousands of jobs being created up and down the Main Street corridor. There will be 10,000 jobs created over the next several years from UB South out to the Medical Campus, and this will be an ideal place for them to live.”23 Meanwhile, Bethune Lofts Apartments at the old Buffalo Meter Company, next to Bennett High School, recently opened near UB’s South Campus with rents starting at $1,200 per month.24
Not far away from these two apartments, near Mt. Olive Baptist Church, on the border between the Mid- and Upper-East Side, the Empire State development Corporation’s board of directors recently announced approval of funding for the purchase of about 50 acres of underutilized industrial land on Buffalo’s East Side, for the purpose of developing a business park focused on manufacturing and energy. These properties include about 700,000 square feet of industrial space in the Northland Avenue Belt Line Corridor, an extensive but underutilized industrial zone on the East Side, near Erie County Medical Center (ECMC).
Why does it Matter?This approach to economic development is destabilizing the lower East Side black community and sending economic tremors throughout the entire east side of Buffalo City, discombobulating neighborhoods and thwarting the black community development process. The reason is that zones of change (ZOC) intensify the contradiction between social and economic development as real estate developers and institutions speculate, acquire and repurpose land, especially parcels used for low-income housing development, thereby forcing many blacks and Latinos to move. This forms the volatile contextual setting which GRUM and the East Side community is currently experiencing. 25
23 Buffalo News, Ciminelli unveils plan for 600 apartments at Central Park Plaza site, August 25, 2014
24 For a housing unit renting for $1,200 a month to be affordable (30% of income), a person would need to have a yearly income of about $50,000. Few
East Side residents could afford rent that high without a roommate.
25 John T. Metzger (2000). Planned Abandonment: the Neighborhood Life-Cycle Theory and National Urban Policy, Housing Policy Debate, Vol. 11/1, pp.
7-40.
zones of change (Zoc) intensify the conTradicTion beTween social and economic developmenT and force many blacks and laTinos To leave Their coMMUnities.

34 Comunity HealtH needs assessment
Black Population Movement and Neighborhood InstabilityThe remaking of the East Side is resulting in GRUM communities becoming unstable, transitory neighborhoods. This is reflected in the pattern of population movement, which consists of three interrelated trends. First, the center of black population growth and development has shifted from the lower East Side to the upper East Side. About 77% (76,547) of Buffalo’s 100,000 blacks live on the East Side. At one time, the majority of blacks lived in the lower East Side, but now most blacks live in the upper East Side (31,385/41%). Currently, about 31% (31,385) of the East Side black population lives in the mid-East Side and only about 28% (21,425) of the black population lives in the lower East Side.
Second, those neighborhoods along Main Street, and places near the centers of economic growth, are being emptied out. The final trend is that the black neighborhoods on the periphery are growing, on both the East and West Sides. Within this context, blacks are moving into Latino neighborhoods on the West Side, while Latinos are moving into black neighborhoods on the East Side. Concurrently, two trends are occurring among whites. On the one hand, the East Side white population is concentrated in the lower East Side, where they comprise about 44% (19,000) of the population, while the mid- and upper-East Side white populations are rapidly moving out of these neighborhoods as the black and Latino populations increase. For example, only 1,993 whites live in the middle East Side, while about 6,000 whites live in the upper East Side.26
This reshuffling of the East Side GRUM population is pushing African Americans northward into the middle and upper East Side and eastward toward the Town of Cheektowaga border. Map 14 shows the population shifts in the 30 years between 1980 and 2010. The important issue is that blacks and Latinos are stuck in place. They do not have the resources to move out of undesirable locations to neighborhoods where conditions are better. To understand why blacks and Latinos are “stuck in place,” we need to understand more deeply the socioeconomic forces that drive their development.
26 Ihenko, Uzochuckwu E. (2003). Constructive Approaches with Contradictory Results: Community Development and the Dynamics of Housing
Demolition in the Inner City of Buffalo, New York, 1960-1997, Dissertation, University at Buffalo, March 10, 2003.
77% of buffalo’s 100,000 blacks live on The easT side.

35 Comunity HealtH needs assessment
Map 14: Population Change in Buffalo, 1980 - 2010
Source: U.S. Census Bureau
the grUM pOpUlatiOnThe GRUM community is a multi-racial one, with African Americans comprising the largest segment of the population (Table 5). The Buffalo GRUM clusters contain about 40% of the black population, with 39% of them living on the East Side (Table 6). Concurrently, 18% of the Buffalo Latino population lives in the GRUM community, with the group being almost evenly divided between the East and West sides.27 On the West Side, the Latino population is clustered together and the GRUM Latino population lives near most of the larger Buffalo Latino community. The East Side Latino population, on the other hand, is more dispersed. There are also about 16,564 (23%) whites living in the GRUM community, with 9,692 (60%) living on the East Side. The East Side black community is the largest (55%) racial group of the GRUM communities, and their community is hub around which the other GRUM communities oscillate.
27 There is a differential in the total population numbers when the figures are calculated by race, which is caused by some double counting with the Latino
population. This happens by trying to separate out the non-Hispanic white population. Hispanic whites are a subset of whites, with the other being white
Hispanic and Latino Americans.
The imporTanT issue is ThaT blacks and laTinos are sTuck in place. they do not have The resources To move ouT of undesirable locaTions To neighborhoods where condiTions are betteR.
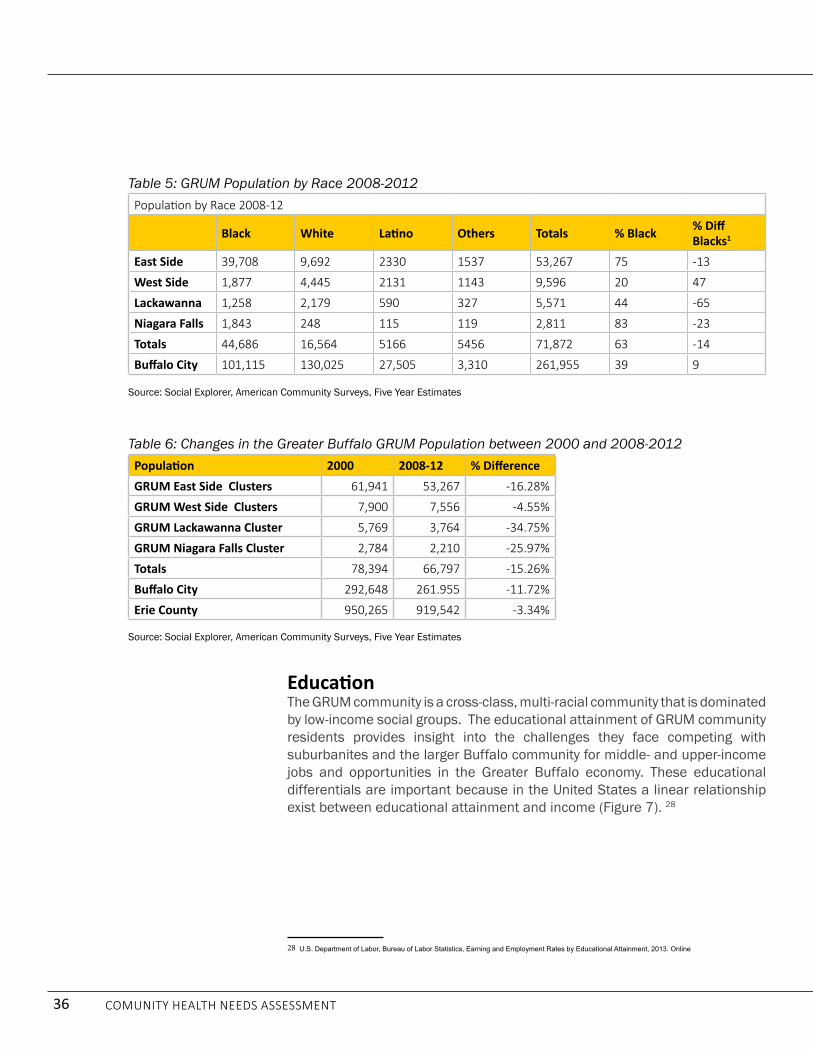
36 Comunity HealtH needs assessment
EducationThe GRUM community is a cross-class, multi-racial community that is dominated by low-income social groups. The educational attainment of GRUM community residents provides insight into the challenges they face competing with suburbanites and the larger Buffalo community for middle- and upper-income jobs and opportunities in the Greater Buffalo economy. These educational differentials are important because in the United States a linear relationship exist between educational attainment and income (Figure 7). 28
28 U.S. Department of Labor, Bureau of Labor Statistics, Earning and Employment Rates by Educational Attainment, 2013. Online
Table 5: GRUM Population by Race 2008-2012population by Race 2008-12
Black white Latino Others totals % Black % Diff Blacks1
East Side 39,708 9,692 2330 1537 53,267 75 -13
West Side 1,877 4,445 2131 1143 9,596 20 47
Lackawanna 1,258 2,179 590 327 5,571 44 -65
Niagara Falls 1,843 248 115 119 2,811 83 -23
totals 44,686 16,564 5166 5456 71,872 63 -14
Buffalo City 101,115 130,025 27,505 3,310 261,955 39 9
Source: Social Explorer, American Community Surveys, Five Year Estimates
Table 6: Changes in the Greater Buffalo GRUM Population between 2000 and 2008-2012Population 2000 2008-12 % DifferenceGRUM East Side Clusters 61,941 53,267 -16.28%
GRUM West Side Clusters 7,900 7,556 -4.55%
GRUM Lackawanna Cluster 5,769 3,764 -34.75%
GRUM Niagara Falls Cluster 2,784 2,210 -25.97%
totals 78,394 66,797 -15.26%
Buffalo City 292,648 261.955 -11.72%
erie County 950,265 919,542 -3.34%
Source: Social Explorer, American Community Surveys, Five Year Estimates

37 Comunity HealtH needs assessment
Figure 7: Linear Relationship between Education Attainment and Earnings
U.S. department of Labor, 2013
In Greater Buffalo, 52% of GRUM residents, 25 years and over, have only a high school education or less, compared to 47% and 40% of Buffalo and Erie County residents respectively (Table 7). These workers with a high school diploma and less are going to be at the very bottom of the regional labor market and opportunity structure. Then, at the upper end of the educational attainment spectrum, 17% of GRUM residents have a Bachelor and/or post-graduate degree, while 23% and 30% Buffalo and Erie County residents, respectively, have Bachelor degrees and/or post-graduate degrees. The bottom line is educational differentials place the GRUM residents in a noncompetitive position in the Greater Buffalo labor market and opportunity structure.
educaTional differenTials place The grum residenTs in a noncompeTiTive posiTion in The greaTer buffalo labor markeT and opporTuniTy stRUctURe.

38 Comunity HealtH needs assessment
Work & Labor Force Participation Educational inequality has contributed to the marginalization of blacks and Latinos within the Greater Buffalo labor market and opportunity structure (Table 8). This marginalization is reflected most dramatically in a 1) low labor force participation rate, 2) low-incomes, and 3) a high poverty rate. The labor force participation rate for the GRUM residents is 53% compared to 60% and 64% for Buffalo City and Erie County residents respectively. This means that increasing numbers of GRUM residents are becoming so discouraged that they have stopped looking for work altogether. Moreover, the high unemployment rate among GRUM workers (15%) means that many community residents are looking for work, but cannot find it.
Table 7: Educational Attainment for GRUM Population 25 Years and Older for 2008-12
Population 25 & over
no High School
% High School % some
College %Bachelor
Degree % post
Grad %
GRUM East Side Cluster 32,084 6,751 21% 9,652 30% 9,804 31% 3,315 10% 1,827 6%GRUM West Side Cluster 4,729 1,369 29% 1,390 29% 1,280 27% 482 10% 208 4%GRUM Lackawanna Cluster 2,331 623 27% 811 35% 607 26% 228 10% 62 3%GRUM Niagara Falls Cluster 1,258 294 23% 387 31% 458 33% 106 8% 13 1%total 38,965 8,778 23% 11,726 30% 11,888 31% 3,898 10% 2,675 7%Buffalo City 164,739 30,166 18% 47,295 29% 48,791 30% 21,268 13% 17,219 10%erie County 624,799 66,144 11% 181,231 29% 188,515 30% 104,933 17% 83,976 14%
Source: Social Explorer, American Community Surveys, 5 Year Estimates
Table 8: Labor Force Participation for GRUM Population
Cluster LFPR Unemployment Poverty Rate % no HSD Median Household Income
East Side 54.1 15.8 34.9 21.2% 24,336West Side 53.9 13.7 36.4 29% 23,121Lackawanna 54.2 8.5 35.3 26.7% 20,672Niagara Falls 50.8 9.7 31.7 23.4% 23,017Buffalo 60.3 13.6 27.3 18.3% 30,949Erie County 63.7 8.2 13.4 10.6% 50,709All Tracts 54 15 35.1 22.5% 23,715
Source: Social Explorer, American Community Surveys, 5 Year Estimates

39 Comunity HealtH needs assessment
The economic plight of some GRUM members is even worse than the aggregate data suggest. In six Buffalo City GRUM census tracts the unemployment rate was between 16% and 19% and in five census tracts the unemployment rate was 20% or higher. Thus, in 11 of the 17 (65%) of the Buffalo City GRUM census tracts, the unemployment rate is 16% or higher. Moreover, the data suggest that the economic dire straits among GRUM residents are worsening. Between 2000 and 2008-12, the Labor force participation rate fell in 11 (58%) of the 19 GRUM census tracts, while the unemployment rates increased in 15 of the 17 Buffalo City GRUM tracts.
IncomeThese dire straits are also reflected in their low-incomes. In 2008-2012, the GRUM community median household income was $23,715 compared to $30,949 and $50,709 for Buffalo City and Erie County, respectively. At the same time, the GRUM community poverty rate was 35% compared to 27% and 13% for Buffalo City and Erie County (Table 9). Using a U.S. department of Housing and Urban development Framework, overall, the GRUM community is considered a very low-income community, where most people live on the economic edge (Table 10).
Table 9: Socioeconomic Profile of the GRUM Community, 2008-2012Cluster lfpr Unemployment poverty rate % no hsDEast Side 54.1 15.8 34.9 21.2%West Side 53.9 13.7 36.4 29%Lackawanna 54.2 8.5 35.3 26.7%Niagara Falls 50.8 9.7 31.7 23.4%Buffalo 60.3 13.6 27.3 18.3%erie County 63.7 8.2 13.4 10.6%
Source: Social Explorer: American Community Surveys, 5 Year Estimates
Table 10: HUD Income Limits for Buffalo, NY
erie County 1- person families
2- person families
3-person families
4-person families
5-person families
6-person families
7-or more-per-son families
very low (50%) $22,250 $25,400 $28,600 $31,750 $34,300 $36,850 $39,400
Extremely Low (30%) $13,350 $15,250 $17,150 $19,050 $20,600 $22,100 $23,650
Low (80%) $35,600 $40,650 $45,750 $50,800 $54,900 $58,950 $63,000Source: U.S. department of Housing and Urban development, Income Limits
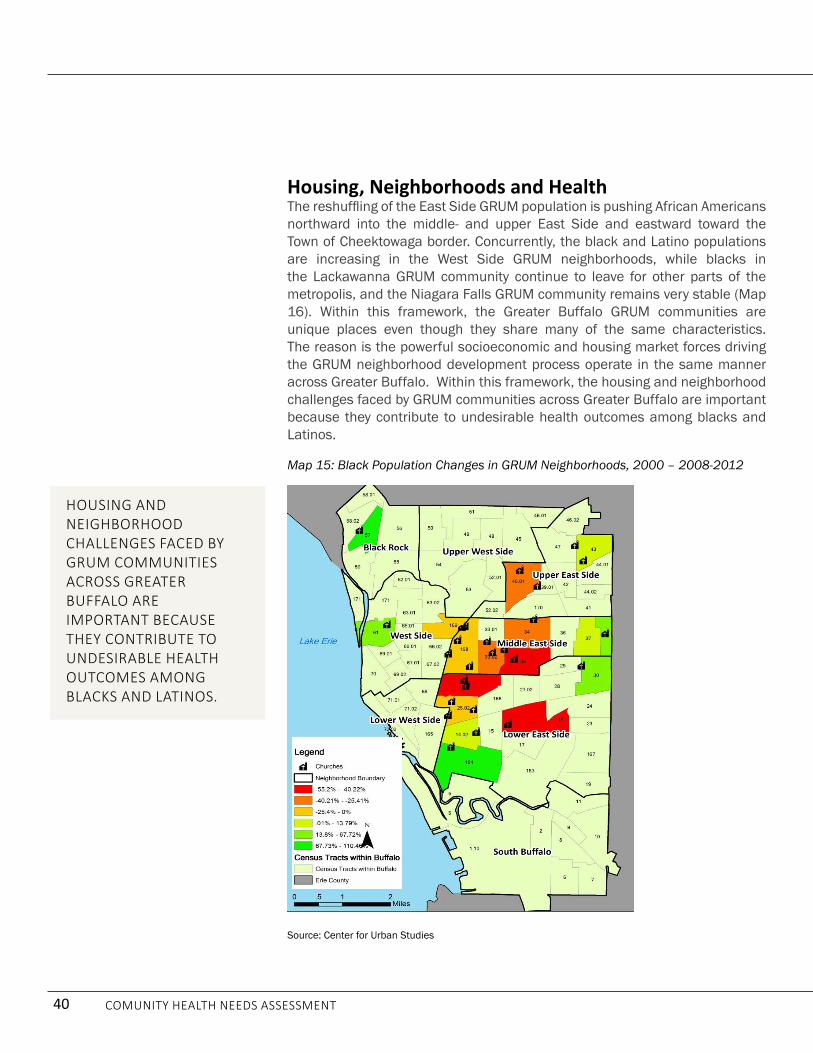
40 Comunity HealtH needs assessment
Housing, Neighborhoods and HealthThe reshuffling of the East Side GRUM population is pushing African Americans northward into the middle- and upper East Side and eastward toward the Town of Cheektowaga border. Concurrently, the black and Latino populations are increasing in the West Side GRUM neighborhoods, while blacks in the Lackawanna GRUM community continue to leave for other parts of the metropolis, and the Niagara Falls GRUM community remains very stable (Map 16). Within this framework, the Greater Buffalo GRUM communities are unique places even though they share many of the same characteristics. The reason is the powerful socioeconomic and housing market forces driving the GRUM neighborhood development process operate in the same manner across Greater Buffalo. Within this framework, the housing and neighborhood challenges faced by GRUM communities across Greater Buffalo are important because they contribute to undesirable health outcomes among blacks and Latinos.
Map 15: Black Population Changes in GRUM Neighborhoods, 2000 – 2008-2012
Source: Center for Urban Studies
housing and neighborhood challenges faced by grum communiTies across greaTer buffalo are imporTanT because They conTribuTe To undesirable healTh ouTcomes among blacks and latinos.

41 Comunity HealtH needs assessment
Housing and Health QuestionThe problem of inadequate, unhealthy homes is a serious, but underappreciated one in Buffalo. Housing is important because it is the most basic organizational unit in any society. The home anchors the neighborhood. It is the place where everyday life and the struggle to make ends meet are launched. It is the place where children are nurtured and relationships are cultivated, and it is also the place where individuals and families seek refuge from the hostilities and stresses of urban life. Substandard housing places the home at-risk by making it vulnerable to infestations, lead paint, radon, asbestos, mold and mildew, and preventable injury. In addition, housing insecurity causes frequent moves by individuals and families, thereby producing instability in both the neighborhood and household. Thus, substandard housing and housing insecurity undermine community development and contributes to undesirable health outcomes among blacks and Latinos.
Housing in the GRUM communities are at-high risk for being substandard, unhealthy and insecure for three interrelated reasons. The first is that housing for most blacks and Latinos are found in the low-income housing market, which is led by small property owners with limited financial resources.29 In Buffalo, the low-income housing market is dominated by rental properties, which are filtered-down to those residents with the lowest incomes.30 Within this market domain, most blacks and Latinos are renters, not home owners. In Buffalo City, for example, 61% of the GRUM community residents are renters, and they are dependent on small property owners to provide them with affordable, healthy homes. However, this is not likely to happen in the GRUM communities because of the toxic mixture between old houses and low-incomes (Figure 8).
29 Surprisingly little is known about the low-income housing market. The market consists of public housing, Section 8 housing vouchers, which attempts
to monitor housing quality. However, we do not know much about the people owning the investment properties in these communities, with the exception
that many seem to be small time investors with limited resources.
30 Blue Ribbon Commission on Minimum Housing Standards in Erie County, Meeting the 21st Century Housing Challenge: Building a Minimum Housing
Standard in Erie County, 2003. UB Center for Urban Studies.
Figure 8: Substandard Housing on the East Side
Source: UB Center for Urban Studies
subsTandard housing and housing insecuriTy undermine communiTy developmenT and conTribuTes To undesirable healTh ouTcomes among blacks and latinos.

42 Comunity HealtH needs assessment
Most of the housing units in the GRUM community were built in 1939 or earlier, and the people living in them have low-incomes. The median income for all 12 GRUM clusters is less than $26,000 annually, and the residents in them carry a heavy housing cost burden. In seven of the 12 GRUM clusters, the residents pay over 40% of their income on housing costs.31 This suggests that most GRUM residents, renters and homeowners, do not have the resources to make improvements in the housing units where they live. This is particularly problematic for renters because they are dependent on small property owners to improve the quality of their housing.
The problem is that most small property owners do not have the financial resources to improve their housing units without raising rents.32 If the rents are raised, then the housing cost burden is increased on many residents, who are already paying significantly more than the recommended 30% of their income on housing. Therein lays the dilemma. Most of these older homes were built before 1940, resulting in high levels of disrepair, lead paint poisoning, asthma triggers, as well as high utility costs. Transforming these houses into energy efficient healthy places is an expensive proposition, which most low-income property owners cannot afford without grants, subsidies and/or loans. For the most part, such grants and subsidies do not exist and financial institutions are reluctant to make loans to small property owners operating in the low-income housing market.33 This is the crux of the rental housing challenge facing GRUM residents.
The second challenge is housing insecurity. Many blacks live on the economic margins and pay a sizable portion of their incomes on housing. If rent increases or if the person loses their job, or faces some other type of hardship, they cannot pay their rent and are forced to move. These economic hardships contribute to housing insecurity and help to explain why many black East Siders move frequently. Some people are evicted, while others are forced to leave because they cannot afford the rent, or the home is declared unfit for human habitat, or they leave in search of a better place. Over the past decade hundreds of East Siders changed addresses, and we believe the movement of blacks from location to location is even greater. Although imperfect, the census data show that nine of the 19 GRUM census tracts lost 16% or more of their population over a year.34 These frequent moves create obstacles to the community building process and the type of social relationships to build strong neighborhoods.
31 UB GRUM Project, Neighborhood Data, Housing, UB Center for Urban Studies.
32 Blue Ribbon Commission, Meeting the 21st Housing Challenge. P. 11.
33 Telephone Interview, Clyde Kincaide and Henry Louis Taylor, Jr., October 20, 2014. Kincaide is small property owners and investor in Inkster,
Michigan, a black Detroit suburb.
34 UB GRUM Project, Housing, Vacancies.
mosT small properTy owners do noT have The financial resources To improve Their housing uniTs withoUt RaisinG Rents.

43 Comunity HealtH needs assessment
The third housing challenge facing GRUM communities is vacancies and abandonment. Planner-sociologist, Robert M. Silverman, in his study of Buffalo, referred to the black and Latino community as “Zombielands” because of the large concentration of vacant and abandoned properties in them.35 The housing vacancy and abandonment issue has two dimensions. Across the 12 GRUM communities the housing vacancy rate is 23%, which 6% higher than the citywide vacancy rate of 17%. Most importantly, the vacancy rates in 9 of the 12 GRUM clusters in which comparable data exists saw significant increases in the number of vacancies between 2000 and 2008-2012.36 Also, in those East Side census tracts where the black population increased and the white population decreased, the housing vacancy rates increased significantly.37 On the East Side, housing vacancy and abandonment appear to be caused by the absence of demand in some neighborhoods, while in others, such as the Fruit Belt, the high vacancy rates appear to be artificially produced by investors seeking to flip their properties from low to high value uses.38 In both instances, the increases in vacant and abandoned properties spawn neighborhood decline and the growth of unhealthy conditions in the physical environment, which can lead to personal health issues.
grUM neighbOrhOOD COnDitiOns
East SideThe physical environment is problematic throughout the East Side, although conditions vary by community. The lower East Side is riddled with vacant and distressed land (Map 16). In these locales, the sidewalks are poorly maintained and often lack handicap accessibility. The street lighting is inadequate, the vacant lots are unkept, lawn care is poor, many of the houses need paint and repairs and vacancies and housing abandonment are serious issues. Neighborhood conditions are especially poor in the lower East Side, particularly east of Jefferson Street. The lower East Side was ground zero for the City’s urban renewal, road widening and highway construction projects during the 1950s and 1960s. These activities scarred the landscape with numerous “unbuilt” vacant lands and spawned serious environmental challenges, including brownfields.39
35 Silverman, Robert M., Li Yin, and Kelly Patterson (2012). Dawn of the Dead City: An Exploratory Analysis of Vacant Addresses in Buffalo, NY 2008-
2010. Journal of Urban Affairs. 35/2, pp. 131-152
36 In those instances where the 2000 and the 2010 census tracts differed, we did not make comparisons.
37 Silverman, et. Al., Dawn of the Dead City, p. 138.
38 Business First, McGuire, Trammell plan $200M med campus development, April 28, 2014. Trammel outlines his strategy of not filling vacant apart-
ments as part of the strategy of preparing Pilgrim Village for redevelopment.
39 Ihenko, Uzochuckwu E. (2003). Constructive Approaches with Contradictory Results: Community Development and the Dynamics of Housing
Demolition in the Inner City of Buffalo, New York, 1960-1997, Dissertation, University at Buffalo, March 10, 2003.
The black and laTino communiTy are refered To as “zombielands” because of The large concenTraTion of vacanT and abandoned pRopeRties in theM.

44 Comunity HealtH needs assessment
Map 16: Vacant and Distressed Land in the City of Buffalo
Source: City of Buffalo

45 Comunity HealtH needs assessment
There are also neighborhood physical environment issues in the middle- and upper East Side, where communities are more built up and have fewer unbuilt vacant lands. Everywhere, blight and housing abandonment is either “creeping” into neighborhoods, or has already become a big problem. In other locations, demolitions have destroyed the neighborhood urban design by creating a landscape characterized by tracts of “unbuilt” vacant land interspersed with housing units (Figure 9). The result is that many East Side neighborhoods have a foreboding visual image, and when the omnipresent danger of street-level violent crime is added to the mixture, the walkability of these neighborhoods is diminished (Figure 10). Walkability is also lessened by the absence of vibrant commercial corridors with services, shops, schools, stores, markets and other destinations that generate animated street life. Most East Side neighborhoods are a combination of food deserts and food swamps. They lack grocery stores where inexpensive healthy foods can be purchased, while they contain many fast food and convenience stores where junk foods can be bought. The sad reality is on the East Side it is easier to buy hamburgers and French fries than fruits and vegetables.
Figure 9: Lower East Side Neighborhood
Source: Google Earth
demoliTions have desTroyed The neighborhood urban design by creaTing a landscape characTerized by TracTs of “unbuilT” vacanT land inTerspersed wiTh hoUsinG Units.

46 Comunity HealtH needs assessment
Air and noise pollution are also problematic on the East Side. The problem is most severe in the lower East Side, which is adjacent to downtown Buffalo and traversed with the interstate highway system, major thoroughfares and rail transit. Here, thousands of trucks, cars, buses and trains travel through the community daily, producing air and noise pollution in their wake. These environmental issues are exacerbated by the lack of tree coverage and the heat island effect. Air and noise pollution are also problematic in other East Side neighborhoods. The entire East Side is crisscrossed with a series of major roadways, including Route 33, Bailey Avenue, Main Street, East delavan Avenue, Jefferson Avenue and Fillmore Avenue, where hundreds of cars, buses and trucks traveling through the neighborhoods regularly, spewing pollution and noise into the atmosphere.
Figure 10: Neighborhood on the East Side
Source: Google Earth, 2012
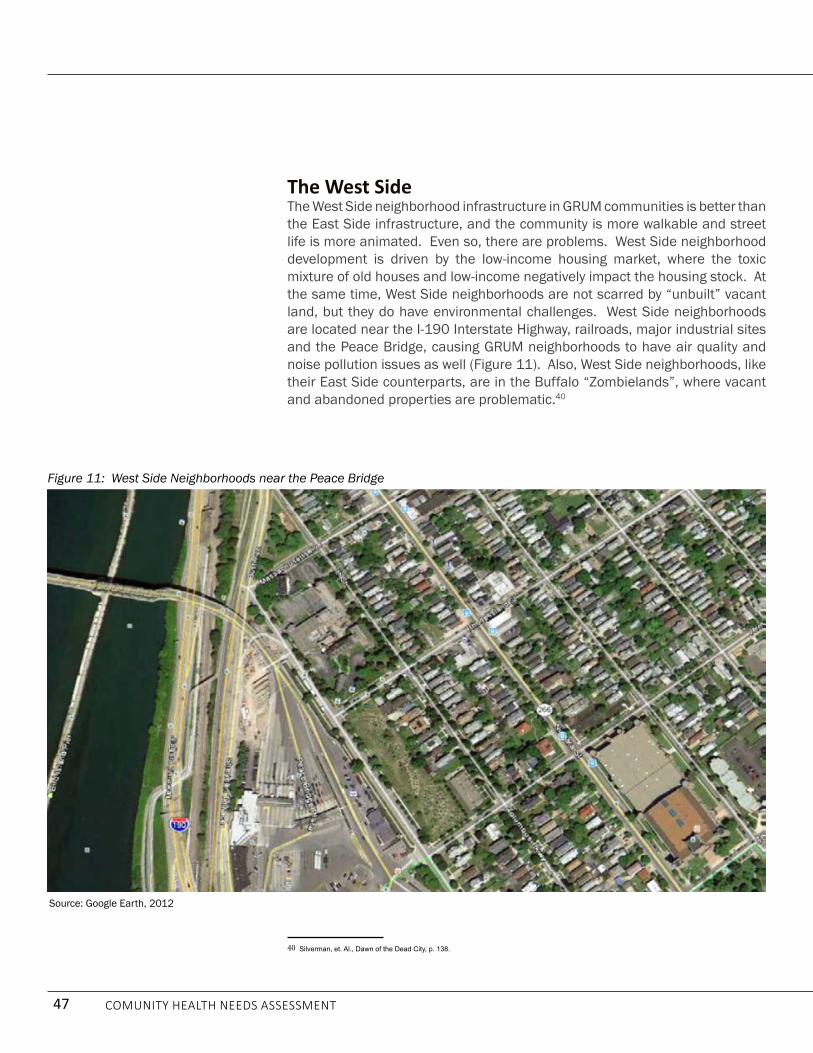
47 Comunity HealtH needs assessment
The West SideThe West Side neighborhood infrastructure in GRUM communities is better than the East Side infrastructure, and the community is more walkable and street life is more animated. Even so, there are problems. West Side neighborhood development is driven by the low-income housing market, where the toxic mixture of old houses and low-income negatively impact the housing stock. At the same time, West Side neighborhoods are not scarred by “unbuilt” vacant land, but they do have environmental challenges. West Side neighborhoods are located near the I-190 Interstate Highway, railroads, major industrial sites and the Peace Bridge, causing GRUM neighborhoods to have air quality and noise pollution issues as well (Figure 11). Also, West Side neighborhoods, like their East Side counterparts, are in the Buffalo “Zombielands”, where vacant and abandoned properties are problematic.40
40 Silverman, et. Al., Dawn of the Dead City, p. 138.
Source: Google Earth, 2012
Figure 11: West Side Neighborhoods near the Peace Bridge

48 Comunity HealtH needs assessment
Lackawanna and Niagara Falls GRUM CommunitiesThe neighborhood landscape in the Lackawanna and in the Niagara Falls GRUM Communities is similar. Both places are situated on former heavy industrial lands, where brownfields are omnipresent and demolitions have severely scarred the landscape (Figure 12). Both neighborhoods are auto-dependent ones that are not very walkable. The streetscapes are barren and the neighborhoods are low-density with little street life. In Lackawanna, the GRUM community is located near the former Bethlehem Steel Plant and is sandwiched between the railroad tracks, Route 5 and the old industrial waterfront. There are virtually no shops or stores in this area, except for a few convenience stores. The Niagara Falls GRUM community has a similar landscape and in both communities public housing is the best housing available for the residents.
Figure 12: Niagara Falls GRUM Community
Google Earth, 2012

49 Comunity HealtH needs assessment
Why it Matters?The housing and neighborhood conditions in GRUM communities matter because they contribute to undesirable health outcomes among blacks and Latinos. This is a structural issue driven by the low-income housing market and the neoliberal approach to economic development. Unless resolved, these structural issues will continually create barriers to good health among blacks and Latinos because of three interrelated reasons. First, most blacks and Latinos are renters and their housing is supplied mostly by small property owners who do not, or cannot, afford to transform their homes into affordable, energy efficient and healthy housing units. Until this is changed, most blacks and Latinos are going to live in unhealthy homes that contribute to undesirable health outcomes.
Second, housing is not affordable for many black and Latinos. Many pay 40% or more of their income on housing. This is problematic for two reasons. First, the high cost of housing limits the resources they have to spend on other items, including food, medicine and visits to the physician. Second, financial problems force an indeterminate number of residents to move, while others move in the continued quest to find a good place to live.
Lastly, in shrinking cities vacancy and housing abandonment is endemic. In Buffalo, however, this is not a random problem. Rather it is an issue associated with black and Latino neighborhood development. Silverman referred to these black and Latino community as “Zombielands” because of the large concentration of vacant and abandoned properties in them.41 This is related to the Buffalo City neighborhood development process, which appears to operate at two, seemingly contradictory levels. At the first level, when blacks and Latinos move into neighborhoods, whites typically begin moving out. Even on the West Side, where housing and neighborhood conditions are better, the neighborhood change process operates the same; as blacks and Latinos move into the GRUM communities, whites move out, thereby reducing the demand for housing in these locales. This is particularly problematic on the East Side, which has lost more than three times more population than the West Side. This problem will continue to produce issues for East Side, and to a lesser degree, the West Side. These poor neighborhood conditions, especially air quality and noise pollution, will remain problematic without intervention. Yet in those sections of the East Side where the economy is booming, as blacks leave the neighborhoods, whites are moving in. We believe we are seeing the onset of traditional gentrification in these places.
At another level, as blacks are pushed out of the sections of the East Side experiencing economic growth, they are being relocated in neighborhoods along Buffalo’s eastern border, and this is increases financial hardships by 41 Silverman, et. Al., Dawn of the Dead City, p. 138.
housing and neighborhood condiTions in grum communiTies maTTer because They conTribuTe To undesirable healTh ouTcomes among blacks and latinos.

50 Comunity HealtH needs assessment
increasing the distance they must travel for critical services, especially those available for Medicaid patients (Map 17). The Erie County Medicaid population is concentrated in Buffalo, and blacks are the most critical group among the Medicaid population. However, a spatial analysis of Medicaid service providers shows that most are concentrated on the West Side and outside Buffalo City. Therefore, the gradual relocation of blacks to the City’s eastern boundaries will increase the cost and travel time of patients to the services they need.
Map 17: Buffalo City Medicaid Service Providers and Black Population Change, 2000 – 2008-2012
Source: US Census, American Community Surveys, 5 Year Estimates
blacks are being pushed ouT of secTions of The easT side experiencing economic growTh which increases financial hardships because of a greaTer disTance They musT Travel for criTical services, especially Those available for Medicaid patients.

51 Comunity HealtH needs assessment
everyDay life anD CUltUre: what the grUM parishiOners anD resiDents thinkYou cannot understand the reality of the GRUM community without knowing what the parishioners and GRUM residents think about issues impacting neighborhood life and health care. Toward this end, we conducted 249 surveys with GRUM parishioners and neighborhood residents. Eighty-two percent (N=203/249) of these interviews were held at 11 public meetings, and 42 (17%) were self-administered.42 About 32% (N=80/249) of the respondents lived in GRUM neighborhoods, with the remaining 169 respondents scattered across the East Side, West Side, South Buffalo and suburban communities outside of Buffalo (Table 11).43 Given the dispersal of the population taking the survey, we aggregated the data, as well as analyzed it by section of Greater Buffalo.
Who are the GRUM Survey Respondents? A discussion of the demographic make-up of the survey participants is important because their racial, ethnic and class status will help us interpret their responses to questions about the Greater Buffalo health care system, health, health literacy, nutrition and fitness, and the housing and neighborhood conditions found in their communities. The socioeconomic profile of the GRUM survey participants paints the picture of a complex population, with a profile that differs somewhat from the larger GRUM neighborhood population.44 The survey respondents consisted of three groups: respondents who live on the East Side, respondents who live on the West Side and those respondents who lived in South Buffalo/Suburbs and other locations including Lackawanna and
42 In the surveys, the number of total respondents is constantly changing because respondents did not always choose to answer a specific question.
Therefore, to avoid confusion, wherever necessary, when citing numbers, we will typically include the numbers that are being used to determine the
frequency. For example, it will be recorded as (N=100/200/50%).
43 For analytical reasons, the South Buffalo respondents (N=2) were placed with the suburban GRUM communities. These South Buffalo respondents
live closer to Lackawanna than other Buffalo GRUM neighborhoods, so placing them with these groups is a logical choice.
44 This refers to the GRUM community that lives in the census tracts in which the churches are embedded.
Table 11: Participants in the GRUM SurveySection of Greater Buffalo Number Percent
East Side 133 53.4%West Side 67 26.9%South Buffalo/Suburbs 38 15.3%Missing Information 11 4.4%total 249 100%GRUM Census Tracts 80 32.1%
Source: UB Center for Urban Studies
249 surveys wiTh grum parishioners and neighborhood residenTs were condUcted.

52 Comunity HealtH needs assessment
Niagara Falls. Map 18 shows the residential location of survey participants in Buffalo City. Only 32% (N=80/249) of the respondents lived in the GRUM community, so the views of these respondents will be reflective not only of the realities of the GRUM census tract community, but also of the experiences of black and Latinos who live in the larger Greater Buffalo community. Nonetheless, because about 80% of the respondents lived in Buffalo City (N=200/249), with 53.4% (N=133/249) and 27% (N=67/249) residing on the East Side and West Side respectively (Map 18) we will gain even deeper insight into the factors contributing to undesirable health outcomes among blacks and Latinos.
Map 18: Residential Location of Buffalo Survey Participants
Source: UB Center for Urban Studies
53.4% reside on the east side.
27% reside on the west side.

53 Comunity HealtH needs assessment
This is critically important because it means that a significant number of the respondents lived in a neighborhood setting similar to the GRUM community residents. Thus, even if they did not live in the same location, given the “stuck in place” thesis, we would anticipate the neighborhood experience to be comparable. Within this context, most of the respondents identified themselves as African Americans (N=169/232/72.8%) and Latinos (N=42/232/18.1%) with a handful of African, Native Americans, whites and other people color.
EducationThe racial and ethnic dimension aside, the respondents to the survey were a somewhat more affluent population. Class, even within an African American and Latino setting, is still important. These differences must be taken into consideration when evaluating the responses of the survey informants. For example, the survey respondents are more highly educated than the majority of GRUM community residents. Twenty-three percent (N=51/221) of survey respondents had a college degree and/or additional graduate studies. This percentage is not only more than that of GRUM community residents (15%), but is also higher than the citywide (20%) and county (27%) percent of residents with a college degree and/or graduate studies.
Work and IncomeThe higher levels of education attainment are also reflected in the income and employment status of the respondents. Although, we have no accurate data on the age of respondents, it is estimated, based on visual observations, that most were 40 years and older. The employment status suggests that most respondents are either retired or working full-time. About 35% (N=78/222) of the respondents are retired. Among the respondents, 49% currently participate in the labor force (N=108/222), 72% (N=78/108) are employed full time and 28% (N=30/108) hold part-time jobs. Only 8.3% (N=9/108) and
Table 12: Racial and Ethnic Profile of GRUM Survey Respondents
Racial and Ethnic Profile totals Percent East Side west Side
south Buffalo/Suburbs
African American 169 72.8% 112 30 27African 14 6% 5 7 2Latino 42 18.1% 8 26 8Native American 2 0.9% 2 0 0white 3 1.3% 1 2 0Other 2 0.9% 1 1 0total 232 100% 129 66 37
Source: UB Center for Urban Studies

54 Comunity HealtH needs assessment
are unemployed. Twelve percent (N=27/222) of the survey respondents are on public assistance.
These figures notwithstanding, there was a significant low-income cohort among the survey respondents. Twenty-nine percent had only a high school diploma or less education and 38% (N=83/221) had “some college,” but no degree. These individuals are likely to be at the bottom of the Greater Buffalo economic ladder. Only 173 of the survey respondents answered questions regarding their annual income. So, we have to be very careful interpreting this data. With this caveat, about 55% (N=95) of the respondents made $29,999 or less, while 20% (N=34) made $30,000 to $49,999 annually, and 25% (N=44) made over $50,000 annually.
Who Owns a Car?The last socioeconomic issue to explore is car ownership. Car ownership matters because people who own their car experience the city and region differently from those who are dependent on public transportation. Overall, 72% (N=160/223) of the survey respondents owned a car, but there were significantly differences in the ownership rate in different sections of the Greater Buffalo GRUM community. Within this context, car ownership was highest among the South Buffalo/suburbanites (N=33/89%) and lowest among the West Siders (N=37/61%). Seventy-two percent of East Siders owned automobiles.
the sUrveyThe survey explored dimensions of health that are interwoven with everyday life and culture in the GRUM community: housing and neighborhood conditions; health literacy; grocery shopping, nutrition and exercise; and access to the health care system.
Tell Us About Your Housing and NeighborhoodHousing and neighborhood conditions are critical components in the quest to produce desirable health outcomes and eliminate health inequalities. Housing anchors neighborhoods, and the two form the primary place in which people live out their lives. Therefore, understanding the housing and neighborhood conditions is a perquisite to improving the health status of the GRUM parishioners and community residents.
Do You Rent or Own?Unpacking the housing tenure question is the first step in the quest to understand the housing and neighborhood condition of survey respondents. So, we asked the respondents if the owned or rented the house in which they live. Across the Greater Buffalo GRUM community, about 53% (N=120/226)

55 Comunity HealtH needs assessment
of the respondents owned their homes, but these figures varied across the different sections of the GRUM community. As expected, the highest rate of homeownership was in the South Buffalo/Suburbs community, where 66% (N=23/35) of the respondents owned their home. On the East Side, 58% (N=73/126) owned their home, while only 37% (N=24/65) of West Side residents owned their housing units. Among these homeowners, we wanted to know how many paid a mortgage on the housing in which they lived. About 58% (N=64/111) of the respondents said they still paid a mortgage.
The housing tenure question matters because renters must depend on property owners to improve the quality of their housing units. Moreover, renters are more likely to move than homeowners. Thus, communities with large renter populations are more likely to be more transient than those communities dominated by homeowners. Among the survey respondents, in all three Greater Buffalo GRUM community sectors, there is a large renter class, especially on the West Side, where 63% (N=41/65) of the respondents were renters. On both the East Side and in the South Buffalo/Suburban communities, although smaller, there is still a critical mass of renters. Next, we wanted to know how many people lived in the homes of the survey respondents. Sixty-eight percent of the respondents (N=155/227) had from one to three people living in the same household, with a mean of 1.4 persons per household. Yet, it is important to note that there were deviations from this norm. The point is that large households, although not the majority, are not usual in the Greater Buffalo GRUM community.
How Old is Your House?The age of the housing unit matters because the maintenance cost of housing increases with age. Thus, because of the cost of maintenance and repairs, older housing units increase the economic burdens on the owners, including the landlord and property management class. Most of the survey respondents lived in older homes. Seventy-four percent (N=164/223) of respondents lived in housing units that were forty years of age or older. Only 13% (N=30/223) of the respondents lived in housing units that were 20 years old or less. These housing units ranged in type, with the detached single-family (N=113/222/51%) and the two-family units (N=72/222/32%) being the dominant types. Others resided in multi-family homes (11%), townhouses (3%) and side-by-sides (2%)
Housing ProblemsGiven the age of these housing units, it is important to know the types of issues they have. The top problems reported by the respondents were drafty windows (N=80/249/32%), drafty doors (29%), and being cold in winter (29%). These issues will increase utility costs, as well as produce health problems. Given the age of these housing units, the “peeling paint” issue reported by 14% of the respondents raises concern about the lead paint problem. Indeed, six percent

56 Comunity HealtH needs assessment
of the respondents said that lead paint was an issue in their homes, along with four percent who said that asbestos was an issue for them. Additionally, about 10% of the respondents indicated that they had issues with “leaky roofs,” others reported “bad smoke detectors (8%), space heaters (7%) and issues with insects (5%), rodents (4%) and ticks (1%). Collectively, these issues paint the picture of housing units with multiple problems, which can produce health issues.
We asked the survey respondents to use a scale of 1 to 5, with 1 being very good and 5 being very poor, to “rate the condition of your house.” Fifty-four percent (N=122/226) rated their homes as “neither good nor bad”, “bad”, or “very bad”. Of this number, 33% percent rated their home as tolerable (neither good nor bad), 13% rated it as bad, and 8% rated its condition as very bad. On the flipside, forty-six percent (N=104/226) of the survey respondents rated the condition of their housing units as “good” (21%) to “very good” (25%). What this suggests is that a significant number of the survey respondents live in housing with problem issues that need addressing.
The Neighborhood PlaceHousing is embedded in a larger neighborhood context, so we asked the respondents to tell us about their neighborhood. On a scale of 1 – 5, with 1 being very good and 5 being very bad, we asked the respondents to rate eight neighborhood issues: unkept vacant lots, poor sidewalks, abandoned houses, drug houses, crime, lack of parks, playgrounds, play areas, trash and garbage on the ground, and homes in need of paint/major repairs (Table 13). Within the Greater Buffalo GRUM community, the neighborhood rating varied on the basis of geographic sector. East Side survey respondents rated five of the eight neighborhood issues (unkept vacant lots, poor sidewalks, abandoned housing, crime, and houses in need of repair), as “neither good nor bad.” On the other hand, West Siders and South Buffalo/Suburbs did not give a single issue a 3.0 or higher rating. Moreover, in the South Buffalo/Suburbs community, they rated four of the eight neighborhood issues (abandoned houses, drug houses, lack of parks and playgrounds, trash and garbage on the ground) as very good. Two other neighborhood issues (crime and houses in need of paint/major repairs) were rated as good (2.0).
Most significantly, while crime was viewed as an issue on the East Side, it was considered much less of an issue on the West Side and in the South Buffalo/Suburbs community. We also asked the residents to use the 1 – 5 scale to rate the services found in their neighborhood. Forty-four percent (N=55/126) of the East Siders rated the services in their neighborhood as ranging from poor to very poor, while, while only 18% (N=12/65) of West Siders and 22% (N=8/37) of South Buffalo/Suburbs rated services in their neighborhood as poor to very poor.
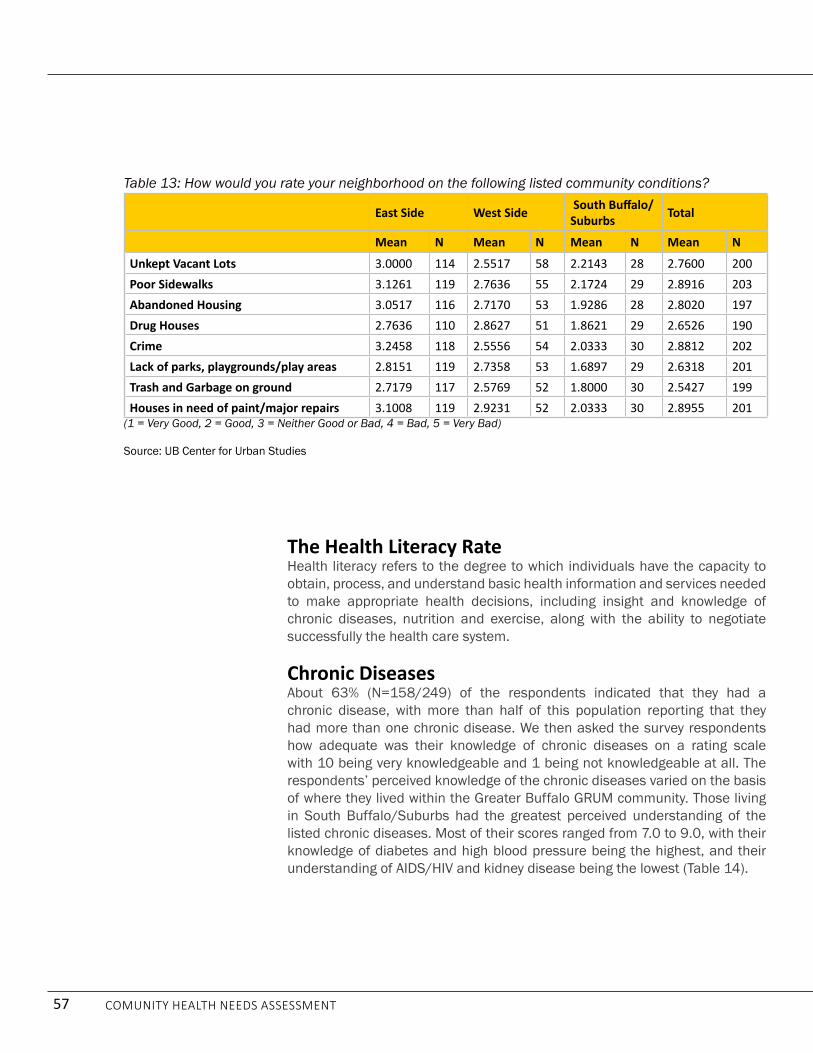
57 Comunity HealtH needs assessment
The Health Literacy RateHealth literacy refers to the degree to which individuals have the capacity to obtain, process, and understand basic health information and services needed to make appropriate health decisions, including insight and knowledge of chronic diseases, nutrition and exercise, along with the ability to negotiate successfully the health care system.
Chronic Diseases About 63% (N=158/249) of the respondents indicated that they had a chronic disease, with more than half of this population reporting that they had more than one chronic disease. We then asked the survey respondents how adequate was their knowledge of chronic diseases on a rating scale with 10 being very knowledgeable and 1 being not knowledgeable at all. The respondents’ perceived knowledge of the chronic diseases varied on the basis of where they lived within the Greater Buffalo GRUM community. Those living in South Buffalo/Suburbs had the greatest perceived understanding of the listed chronic diseases. Most of their scores ranged from 7.0 to 9.0, with their knowledge of diabetes and high blood pressure being the highest, and their understanding of AIdS/HIV and kidney disease being the lowest (Table 14).
Table 13: How would you rate your neighborhood on the following listed community conditions?
East Side West Side South Buffalo/Suburbs total
Mean n Mean n Mean n Mean n
Unkept Vacant Lots 3.0000 114 2.5517 58 2.2143 28 2.7600 200Poor Sidewalks 3.1261 119 2.7636 55 2.1724 29 2.8916 203Abandoned Housing 3.0517 116 2.7170 53 1.9286 28 2.8020 197Drug Houses 2.7636 110 2.8627 51 1.8621 29 2.6526 190Crime 3.2458 118 2.5556 54 2.0333 30 2.8812 202Lack of parks, playgrounds/play areas 2.8151 119 2.7358 53 1.6897 29 2.6318 201Trash and Garbage on ground 2.7179 117 2.5769 52 1.8000 30 2.5427 199Houses in need of paint/major repairs 3.1008 119 2.9231 52 2.0333 30 2.8955 201
(1 = Very Good, 2 = Good, 3 = Neither Good or Bad, 4 = Bad, 5 = Very Bad)
Source: UB Center for Urban Studies

58 Comunity HealtH needs assessment
The West Siders perceived knowledge of chronic diseases was the lowest. All their scores were in the 5 to 6 range, which is that gray area between knowledgeable and not knowledgeable at all. Their understanding of kidney disease, cancer and heart disease were the lowest, while their stated understanding of high blood pressure and obesity were the highest. The East Side ratings were higher, but still close to that divide between “knowing” and “not knowing.” East Siders knew the most about high blood pressure and depression and the least about kidney disease. Over all, knowledge about kidney disease was the lowest, while knowledge of high blood pressure is the highest. Considering the important link between high blood pressure and kidney disease, this finding is troubling and suggests that the respondents perceived knowledge of these diseases could be hiding a high level of ignorance about them.
Next, we wanted to find out where the respondents obtained their information about health. To gain insight into this issue, we asked the respondents to select from a list of nine items, in order of importance, their three most important sources of health information. About 55% (N=99/179) of the respondents said their most important source of health information came from doctors/clinics. The second preferred source of health information was friends/family (N=47/151/31%) and the third preferred choice was the Internet (N=28/136/21%). What stands out in these responses is that many people do not have a clearly defined source of information about health issues. Most of
Table 14: GRUM Survey Responses to Knowledge about Chronic Diseases
ntotal Mean n East Side n
west Side n South Buffalo/Suburbs
Diabetes 229 7.0131 123 7.0244 62 6.1774 34 8.3824
High Blood Pressure 235 7.5404 128 7.5312 62 6.7742 34 9.0000
heart Disease 233 6.5536 126 6.7698 63 5.7937 33 7.1818
Cancer 227 6.5242 123 6.6341 60 5.6000 33 7.6364
Kidney Disease 225 5.9200 123 6.3252 58 5.1379 33 5.6970
asthma 231 6.9221 126 7.1508 62 6.0806 32 7.3125
Obesity 229 7.0524 125 6.9520 60 6.4167 33 7.8788
Depression 229 7.1354 122 7.4754 63 6.2540 33 7.0303
aiDs/hiv 232 6.8190 125 7.0080 63 6.2381 33 6.8485 (10=very knowledgeable and 1=not knowledgeable at all)
Source: UB Center for Urban Studies

59 Comunity HealtH needs assessment
them rely on a combination of the doctor/clinic, friends/family, television and the internet. Also, what is significant for the purpose of this study, is that only a very small number of respondents identified the ministers/church as a source of health information.
Food SecurityFood security is critical to developing a healthy lifestyle, eliminating health inequalities and producing desirable health outcomes. Within this context, food security is not only about people having “access to sufficient, safe, nutritious food to maintain a healthy and active life”, it is also about having the knowledge and resources required to purchase “safe, nutritious” food. In this part of the survey on health literacy, we sought to gain insight into the resident’s understanding of nutrition and exercise and, within this framework, we sought to gain insight also into the socioeconomic forces that thwart the respondent’s ability to access “safe, nutritious” foods.
Grocery ShoppingIn the United States, food security starts with grocery shopping. So, we wanted to know where the respondents most often shop for groceries. Most said they either shopped for groceries at major grocery stores (N=108/227/48%) and stores that sold a combination of food and retail items (N=86/227/38%). Surprisingly, almost none (N=2/227/0.9%) said they shopped at Farmers Markets. The grocery shopping habits of the GRUM respondents varied on the basis of the geographic district in which they lived. Most East Siders and GRUM respondents living in South Buffalo/suburbs purchased most of their food from major grocery stores, but on the West Side, most respondents grocery shopped at convenience/drug stores (21%) and at mixed food stores/retail outlets (46%), such as Walmart and Walgreens.
This could be a reflection of the low automobile ownership rate on the West Side, which limits food shopping options. On this point, we asked the respondents to tell us how they usually got to the grocery store for shopping. While the great majority of respondents (N=191/230/83%) used their own car for shopping, a significant number of residents did not, especially those living in Buffalo City. About 17% (N=40/230) used a variety of methods to get to the grocery store, including buses, taxies and walking. Also, it should be stressed that on the West Side, an indeterminate number of respondents ride to the grocery store in the cars of friends.
Once inside the grocery store, we wanted to know what factors influenced their decision to purchase certain items. Using a scale of 1-10, with 10 being very important and 1 being not important at all, we asked the respondents to rate ten variables. On the East Side and the West Side, the highest rated variable was “item price,” while in South Buffalo/suburbs it was “my personal likes.”

60 Comunity HealtH needs assessment
In all three sectors of the Greater Buffalo GRUM community, the “nutritional value” of food ranked behind other priorities. For example, on the East Side and in South Buffalo/Suburbs it ranked fourth on the list of ten variables, while on the West Side it ranked third. In all three sections of the Greater Buffalo GRUM community, the “brand name” name of a food item ranked near the bottom. Also, of some concern, on the West Side, a “children like” ranked very high (average 7.04), while it ranked very low on the East Side (4.7) and in South Buffalo/Suburbs (4.7).
What Are Your Eating Habits?Eating habits matter because the foods you consume can affect your health and put you at risk for certain diseases. For these reasons we wanted to gain insight into the eating habits and foods consumed by the respondents. To begin, we asked the respondents to tell us how many meals they eat daily. Across all sections of the GRUM community, most residents ate two meals a day (N=176/228/77%). We then asked the respondents if they ate breakfast, lunch and dinner regularly. About 40% (N=93/231) of the respondents said they did not eat breakfast regularly, with about 46% (N= 60/131) of East Siders saying they do not eat breakfast.
Most respondents eat lunch (71%) and dinner (92%). Next, the respondents were asked to list the foods they would normally eat for breakfast, lunch and dinner. An assessment of the foods eaten suggests that most residents do not have a balanced diet consisting of the appropriate mix of carbohydrates, protein and fibers. The foods consumed at all three meals tended be either heavily weighted toward carbohydrates or toward protein. Most respondents tended to vacillate toward one extreme or the other. Lastly, we asked the respondents to rate their diets on a scale of 1 to 5, with 1 being very good and 5 being very poor. They responded rated their diets as being on the divide between “being very good” and “being very poor.”
Exercise: Why it MattersExercise matters because regular physical activity helps to improve one’s overall health and fitness, and reduces their risk for many chronic diseases. For this reason, we wanted to gain insight into how active was the respondent’s lifestyle. Toward this end, we asked the respondents about walking, biking, gardening, and how often they workout in a gymnasium or a fitness center. Lastly, we asked the respondents to estimate how much exercise they get weekly. The respondents were about evenly divided between those who walked less than 30 minutes a day (N=107/220/49%) and those walked more than 30 minutes daily (N=113/220/51%). Biking is not a very popular form of exercise among the GRUM respondents. Seventy-two percent (N=161/224) said they never biked, while only 6% (N=14/225) said they biked regularly. Gardening also was not a popular activity. Fifty-five percent (N=124/227) of

61 Comunity HealtH needs assessment
the respondents said they never garden, while only 14% (N=31/227) said they frequently gardened. Respondents also did not go regularly to the gymnasium to work out. Sixty-one percent (N=14/228) said they never go the gym, while only 9% (N=20/228) said they frequented the gym regularly. Nonetheless, 51% (N=110/217) of the respondents said they engaged in anywhere from two to three or more hours of exercise weekly.
Access to Health Care: Let’s See a Doctor All but three of the survey respondents had some form of health insurance, with about 44% (N=109/249) covered by Medicaid and Medicare. Since monetary resources do not appear to be an obstacle to accessing health care for the survey respondents, we wanted to know where they would go for medical care if they were sick. Fifty-eight percent (N=132/226) said they would visit a private physician’s office, while 38% of the survey respondents said they would visit one of several area emergency rooms. Within this framework, we wanted to know how frequently the respondent’s visited a doctor, clinic or hospital. We asked them when they last visited a doctor or medical facility. Seventy-five percent (N=170/227) of the survey respondents said “less than six months ago,” while 18% (N=40) went to the doctor within a year. We asked the respondents to tell us the reason for their last visit to the doctor or medical office. Seventy-six percent (N=167/220) said they went for a regular medical check-up. About 22% (N=48/220) said they were sick. Both a follow-up and reinforcing question was “do you have regular medical check-ups?” Most survey respondents said they visited the doctor for regular medical check-ups. Still, there were interesting differences in the answers of respondents from the three sections of the Greater Buffalo GRUM communities. Among the three GRUM sectors, West Siders (N=50/63/79%) were least likely to have regular medical checkups, while East Siders (N= 113/124/91%) were the most likely.
Lastly, to obtain a deeper understanding of the relationship between the survey respondents and medical personnel, we asked them a series of seven questions. On a scale of 1 – 10, with 10 always and 1 never, we asked, “do you trust the doctor and/or nurse that you visit?” The respondents rated their trust of doctors and nurses at a high level. In the second question, we asked, “Are you afraid of going to the doctor?” On the rating scale, most respondents rated the fear factor near the high end of the “never” spectrum. The respondents said they had little trouble understanding instructions from the doctor, following instructions on the label of medicines, and being able to ask questions about their health problems.
The Focus GroupsTo deepen our understanding of the surveys, 82% (N=203/249) of the survey respondents also participated in the focus groups. This made it possible for them to elaborate on issues and discuss their concerns in greater detail. In

62 Comunity HealtH needs assessment
the focus groups, no effort was made to control for the geographic area in which the respondents live, or differences in socioeconomic conditions. Rather, we wanted to have an open-ended discussion, where the respondents were encouraged to speak frankly about their issues and concerns, as well as discuss those things that were very satisfying. The focus groups made it possible to add texture to the surveys, especially since most of the respondents participated in both activities.
neighbOrhOOD COnDitiOns
Service DesertsWhile most residents liked their neighborhoods, the lack of services, shops and stores force them to travel to other parts of the city and suburbs to get needed goods and services, thereby making life more expensive and difficult.45 The threat of neighborhood crime and violence was another element that made life anxious and stressful for the respondents, although most said they had adapted. Even so, their concerns about crime and violence never went away, especially for parents, who constantly worried about their children getting into trouble. The reported incidences of crime give a sense of the realities faced by inner-city residents. Many may not have been a victim of crime, but they know people who have been and they know that criminal activities and violence are part of the landscape of their communities (Map 19).46
45 In the surveys, a number of East Siders expressed concern about neighborhood services, but West Siders and South Buffalo/Suburb respondent
seemed more satisfied with the quality of services in their communities. However, regardless, the focus group members were highly critical of the absence
of services in their neighborhoods. .
46 The surveys indicate that this view may shift depending on where in the Greater Buffalo GRUM geography a person lives.
The lack of services, shops and sTores force residenTs To Travel To oTher parTs of The ciTy and suburbs To geT needed goods and services, Thereby making life more expensive and difficUlt.

63 Comunity HealtH needs assessment
Map 19: Crime Incidents in GRUM Communities
Source: UB Center for Urban Studies & Buffalo Police department

64 Comunity HealtH needs assessment
Food Deserts & Swamps and the Suburban Food MarketIn this neighborhood setting, on both the East Side and West Side, developing a healthy lifestyle is difficult. The GRUM neighborhoods are food deserts and food swamps, which mean that residents must travel outside of their communities to grocery shop. In many of these neighborhoods, there are fast food restaurants, convenience stores, service stations and pharmacies where residents can purchase junk foods. Most focus group respondents owned a car or had easy access to an automobile, so life was easier for them. A large number of these respondents lived on the East Side, but they usually shopped for groceries on the West Side or in the suburbs, with most saying they preferred shopping in the suburbs because prices were lower and the food fresher. The respondents who depended on public transportation did not have these choices, so most of them grocery shopped on the West Side, with a few occasionally buying food on the East Side.
Eating Healthy is Not EasyWithin this context, the respondents said buying healthy foods was an expensive and challenging job. The consensus was that healthy foods were more expensive, and this, combined with their limited knowledge of nutrition, made buying healthy foods a very difficult task. In some respects, cooking healthy meals was even more challenging. While most respondents seemed to know what constituted a healthy meal, they had trouble operationalizing this knowledge in the real world. Aside from the issue of buying healthy foods, many respondents said the demands of work and other responsibilities kept them from consistently cooking healthy meals. Others said they simply did not know how to prepare inexpensive, culturally appropriate, healthy meals, while some noted that stress causes you to crave foods that make you feel good, and that these types of foods are usually unhealthy. Some respondents said that we live in a world where people are always on the run, which makes healthy eating very difficult.
Exercise: The Neighborhood is Not Made for WalkingThe respondents also said getting regular exercise was problematic. The majority of focus group participants said they were usually too tired, or had no time to work out; while others said the neighborhood environment was a deterrent to walking and other outside activities. Here, the residents were mostly concerned about issues of safety and the problem of unleashed dogs. Getting regular exercise was also made challenging by the absence of neighborhood-based facilities for exercising and the reality that most focus group respondents had no gym memberships. This is an important issue in cities such as Buffalo, where the winters are long, cold and snowy. The snowy conditions are made even worse because many sidewalks are impassable during the winter months, forcing people to walk in the streets (Figure 12).

65 Comunity HealtH needs assessment
In 2000, a statewide report showed that Buffalo ranks third in pedestrian fatalities and nationally it ranks eighth in the percent of traffic deaths that were pedestrian.47 So, walking can be fatal in East Side neighborhoods. On the West Side and in the South Buffalo/Suburbs, walking in the neighborhoods might not be a big issue. Still, the long, difficult winters are a disincentive to walking. The surveys also indicated that most respondents were not walkers. If you do not have some place to work out, exercising on a regular basis is going to be very challenging. But even so, some respondents said they regularly walked, biked, or gardened in the neighborhood, or got their exercise by taking care of the children. The focus group and surveys suggest that the respondents do not have an “active living culture.”
47 Taylor, Henry Louis (2005), “Health and the Built Environment: The Effects of Where We Live, Work and Play,” Keynote presentation, The William T. Small, Jr. Keynote Address 26th Annual Minority Health Conference, University
of North Carolina, School of Public Health.
Figure 13: Walking in Buffalo During the Winter
Source: Henry Louis Taylor, Jr.
66 Comunity HealtH needs assessment
the health Care systeM
Going to the DoctorLastly, we will discuss the views of focus group participants on the health care system, especially their attitudes toward visiting a doctor’s office or clinic. These comments are particularly interesting because the surveys suggest that the respondents have a more positive attitude about going to the doctor office than the focus group discussions indicated. Most respondents said in the focus groups that going to a doctor’s office or clinic was expensive, inconvenient and time consuming. They complained about the co-pays and the cost of transportation, including gasoline and parking, or bus or taxi fares. The respondents especially found the long waits at the doctor’s office or clinic frustrating and annoying, and a complete waste of time. For many respondents, a combination of the cost of a visit and long waits were deterrents to regularly visiting a doctor’s office or clinic.
Other respondents believed that you only go to the doctor when you are sick. On this point, a man said, “If I feel good, I ain’t going,” while others said that going to the doctor was your last resort; something that happened only after your home remedies failed. For others, fear made them reluctant to visit the doctor’s office or clinic. Some of these individuals were afraid of being diagnosed with a chronic disease, especially if they had a family history of cancer, hypertension and the like, while others said that if you are already under pressure, you do not need the added stress of knowing you have a chronic disease. So, you put off going to the doctor. You just don’t want to hear any more bad news.
Finally, for many respondents, trust and the quality of care were big issues. The insights offered here are particularly interesting since the surveys suggested that a high level of trust existed between the doctors and respondents. One respondent summed up this viewpoint by simply saying, “doctors don’t care like they used to.” He said this attitude was reflected in waiting a long time to see the doctor, and then being rushed in and out of his/her office. Others agreed. Other respondents complained about going to a clinic and being seen by a nurse, student, or an inexperienced intern, rather than a “real” doctor.
These data show that many of the attitudes and beliefs of blacks and Latinos problematizes health care delivery in their community. For example, if you believe that you go to the doctor only when you are sick, then you are likely not to get the screening that detects illnesses early in their pre-symptomatic stage.
mosT respondenTs said in The focus groups ThaT going To a docTor’s office or clinic was expensive, inconvenienT and Time consUMinG.

67 Comunity HealtH needs assessment
finDings
1. The Greater Buffalo Health Care System has failed to devise and implement a strategy to delivery effective health care services to the black and Latino communities. The two prime performance indicators supporting this finding are the premature death rates and infant mortality rates among blacks and Latinos.
2. There is a direct connection between housing and neighborhood conditions and the undesirable health outcomes found in the black and Latino neighborhoods.
3. These health inequalities are concentrated on the East Side residential area, where blacks are overrepresented. The five zip codes (14204, 14206, 14211, 14212 and 14215) where the Erie County Department of Health draws 73% of its clinical patients are located on the East Side.
4. The remaking of the black East Side is turning the black community into an unstable place, which increases hardship and spawns health challenges. This destructive remaking process is made possible because blacks are building their community on land owned by other people. The problem is that blacks want to develop their community, but the property owners want to make profits on the land. Profit making and economic development is conflicting with community building.
Neighborhood stability matters for four interrelated reasons:
• Social supports and nurturing are critical for producing desirable economic, social, health, and educational outcomes.
• Social supports come from a network of relations with family, friends, acquaintances, and friends.
• Social capital combined with familiarity to construct a neighborhood infrastructure that facilitates trust, solidarity, reciprocity, collaboration, and problem-solving.
• Individuals embedded in stable settings are more likely to have the supports needed to grapple successfully with the stressors and social forces that produce risky behavior, outlaw culture, bad eating habits, overeating, smoking and drug use.
5. Substandard, unhealthy homes are a problem, which is complicated by three interactive issues.
part 4: finDings anD reCOMMenDatiOns

68 Comunity HealtH needs assessment
a. Most GRUM residents live in housing units that they do not own. So, they must rely on absentee property owners to upgrade and improve the quality of their homes, which are often drafty, have leaky roofs, asbestos, infestations and are at-risk for lead.
a. Many GRUM homeowners have low-incomes and cannot afford to upgrade, modernize and upgrade the quality of their homes.
b. It is difficult for homeowners and property owners to get financial assistance to make housing improvement in GRUM communities.
6. The health inequalities in Greater Buffalo cannot be eliminated without the radical transformation of the East Side community. The reason is that undesirable health outcomes are concentrated and interwoven into everyday life and culture in this residential area.
7. The GRUM community is composed of three distinct geographies: East Side, West Side, and old industrial suburbs. Although each geography is unique, health inequalities is a neighborhood effect in each community, but it manifests itself differently in each locality. Therefore, each segment of the GRUM community must devise a strategy that focuses on its own particularities.
8. The Erie County uninsured and Medicaid populations are overrepresented in the five East Side zip codes and in the GRUM West Side and Lackawanna communities.
9. Health literacy is a serious problem in the GRUM Community. The problem is most dramatically expressed when the survey respondents were asked, “How adequate is your knowledge of the following chronic diseases?” The respondents were give a list of nine chronic diseases and asked to rate their knowledge of these diseases using a scale that ranged from 1 – 10, with 10 being very knowledgeable and 1 being not knowledgeable at all. In all GRUM communities, the respondents indicated that they were “very knowledgeable” about high blood pressure (hypertension). Concurrently, in all communities the respondents said they were “least knowledgeable” about kidney disease. The problem is that high blood pressure will trigger kidney disease if not properly managed. This leads to the conclusion that the perceived knowledge of the respondents about chronic diseases and other health issues is much lower than their actual knowledge of these issues.
10. GRUM communities are food swamps and deserts that contribute to undesirable health outcomes. This reality is summed up in the observation that it is easier to buy hamburgers and French fries in

69 Comunity HealtH needs assessment
the GRUM communities that it is to purchase apple and oranges.
11. Most GRUM residents have poor diets and do not exercise regularly. Their neighborhoods are not very walkable, have few recreational centers and are food swamps/ deserts and service deserts.
12. A tension exists between GRUM community residents and the Greater Buffalo Health System. At the core of this tension is the belief that medical personnel are not really concerned about their health.
a. Focus group respondents say that going to the doctor’s office or clinic is expensive, inconvenient and time consuming.
b. Some respondents say you go to the doctor’s office or clinic only when you are sick.
c. Others believe that doctors don’t really care about them. One respondent put this way, “They call it a medical practice, but they just want to practice on us.”
This viewpoint is problematic on three levels. First, it means that people are less likely to get the check-ups required for early diagnosis and treatment. Second, it means that they are more likely to end up with emergency room visits. When they are sick and need urgent care, the doctor’s appointment schedule, especially if he or she is a specialist, is not likely to accommodate them. So, they go to the emergency room. Third, because they delay treatment until symptoms appear and interrupt everyday life, their rates of hospitalization are likely to be much higher than others.cing their housing unit at-risk for becoming unhealthy.

70 Comunity HealtH needs assessment
reCOMMenDatiOns1. The Greater Buffalo Urban Ministries (GRUM) churches should be
turned into decentralized health care and community development centers, which are connected to the Greater Buffalo Accountable Healthcare Network (GBUAHN).
GRUM consists of both large and small churches with an aggregate membership of over 8,000 parishioners and more than 53,000 community members. They blanket the East Side and are situated in and near every black and Latino community in Greater Buffalo. This, combined with their partnership with the GBUAHN, give them the potential to change significantly the health outcomes in the black and Latino communities.
To realize their potential in practice it will be necessary to build the capacity of the various churches and provide them with the necessary infrastructure to carry out their mission.
Within this framework, a strategic plan should be developed to guide the work of turning GRUM churches into decentralized centers of health care and community development. Regardless of the form they ultimately take, GRUM churches must develop hyper-aggressive neighborhood outreach if they are to be successful.
2. Formulate a strategy for GRUM churches to enroll their parishioners and community members into the Medicaid program and develop a program of health related activities that target this population.
3. The housing and neighborhood conditions in the black and Latinos neighborhoods must be radically transformed if their health outcomes are going to be dramatically improved. The issues outlined in this report cannot be successfully addressed without forging a strategy to turn the communities where blacks and Latinos live into healthy and vibrate neighborhoods in which to live, work, play and raise a family. Therefore, we call for the establishment of a Place-Orientated Development Strategy (POdS) for every GRUM church residential cluster in the Greater GRUM community.
Many of the neighborhood-based health obstacles facing blacks and Latino communities, including low-quality housing, neighborhood blight, health literacy, food and housing insecurity, crime, educational attainment and others cannot be solved outside of the neighborhood context. Therefore, a multi-faceted institution, with the capacity to build trust with the neighborhood, is needed to carry out this health and community building mission. GRUM churches are ideally situated to carry out this task.
4. develop a Neighborhood-based Health Literacy Program. Such a program should have the capacity to grapple with two dimensions of

71 Comunity HealtH needs assessment
the health literacy issue. The first is to provide people with a range of materials and experiences on a sustained and regular basis that target chronic diseases, nutrition, physical fitness, mental health and other information to help them understand and navigate the health care system. The second is to provide them with the ability to translate their health knowledge into practical activities, and to make necessary behavioral changes. The goal of this effort is to change people’s behavior and make healthy living the dominant lifestyle in GRUM communities.
5. develop Neighborhood-based programs and activities to address the food security and physical fitness health challenges. These types of programs can take a variety of forms and should be led by the GRUM churches. Most significantly, they should be made part of the larger POd strategy, which should be implemented in every GRUM community. This is added as a separate recommendation to emphasize its importance.
6. Establish a system of formative and summative evaluations, which uses an outside evaluator to assess the GRUM program and monitor its progress. These evaluations should be used as a tool to strengthen the program and plot a course for continued improvement and development. The evaluation process should be used to monitor program movement towards achieving critical benchmarks and to make sure that the program does not deviate from its original intent.
7. GRUM needs to develop a larger collaborative with partners that help with various aspects of the health and neighborhood development strategy.

72 Comunity HealtH needs assessment
perfOrManCe inDiCatOrs1. Number and percentage of GRUM churches that are established as
official GRUM health and community development centers.
a. Although a larger and more complex evaluative system will be established for each of these GRUM health and community development centers, one element of that evaluative system will be the number and percent of parishioners and community residents enrolled by the center.
b. The target population for the GRUM community will be those residents living in the immediate GRUM neighborhood and those living in the larger GRUM community, as defined by the census tract in which the church is located.
c. Establishment of an electronic system, including the appropriate personnel, with the capacity to create and maintain a comprehensive system of data, which makes it possible to acquire and track multiple sources of data.
d. Establishment of a GRUM system wide method of researching and establishing baseline data on a number of health and neighborhood variables needed to track and monitor the progress of GRUM in improving health outcomes in the GRUM community.
2. Number and percentage of GRUM parishioners and community residents, between 18 and 64 years of age, who have at least one chronic disease and that are at-risk for acquiring another, that are enrolled in Medicaid.
3. Number and percentage of GRUM Medicaid enrollees that are serviced by the GBUAHN Health Home.
4. Reduction in the number and percent of preventable hospitalizations among GRUM parishioners and community residents enrolled in the Medicaid program:
a. Reduction in the number and percent of preventable hospitalization and deaths caused by chronic diseases among GRUM parishioners and community residents enrolled in the Medicaid program.
b. Reduction in the number and percent of premature deaths among GRUM parishioners and community residents.
5. The number and percent of GRUM Medicaid members that live at the same address over five to 10 years after enrolling in the program.

73 Comunity HealtH needs assessment
appenDix a
Affordable Care Act
glOssary Of terMs
(Census) Block Group
Census Tract
the comprehensive health care reform law enacted in March 2010 that put into place comprehensive health insurance reforms that contain key provisions intended to extend coverage to millions of uninsured americans, to implement measures that will lower health care costs and improve system efficiency, and to eliminate industry practices that include rescission and denial of coverage due to pre-existing conditions.
http://www.healthinsurance.org/glossary/affordable-care-act/
the smallest geographic used by the U.s. census bureau for statistical divisions of census tracts and are generally defined to contain between 600 and 3,000 people, and are used to present data and control block numbering. a block group consists of clusters of blocks within the same census tract.
https://www.census.gov/geo/reference/gtc/gtc_bg.html
a term used by the U.s. census bureau to refer to small, relatively permanent statistical subdivisions of a county or equivalent entity that are updated by local participants prior to each decennial census as part of the census bureau’s participant statistical areas program. the primary purpose of census tracts is to provide a stable set of geographic units for the presentation of statistical data. census tracts generally have a population size between 1,200 and 8,000 people, with an optimum size of 4,000 people. a census tract usually covers a contiguous area; however, the spatial size of census tracts varies widely depending on the density of settlement. census tract boundaries are delineated with the intention of being maintained over a long time so that statistical comparisons can be made from census to census. census tracts occasionally are split due to population growth or merged as a result of substantial population decline.
https://www.census.gov/geo/reference/gtc/gtc_ct.html
Chronic Disease a chronic disease is one lasting 3 months or more, by the definition of the U.s. national center for health statistics. chronic diseases generally cannot be prevented by vaccines or cured by medication, nor do they just disappear.
http://www.medicinenet.com/script/main/art.asp?articlekey=33490
Clinical Care clinical care refers or pertains to a clinic or to the bedside; pertaining to or founded on actual observation and treatment of patients, as distinguished from theoretical or basic sciences.
http://medical-dictionary.thefreedictionary.com/clinical
Distressed Neighborhood a neighborhood facing decline in regards to the socioeconomic standing of its residents as well as the physical condition of the built environment.
Food Desert food deserts are defined as urban neighborhoods and rural towns without ready access to fresh, healthy, and affordable food. instead of supermarkets and grocery stores, these communities may have no food access or are served only by fast food restaurants and convenience stores that offer few healthy, affordable food options. the lack of access contributes to a poor diet and can lead to higher levels of obesity and other diet-related diseases, such as diabetes and heart disease.
http://apps.ams.usda.gov/fooddeserts/fooddeserts.aspx
Food Security the world health organization states that food security exists “when all people at all times have access to sufficient, safe, nutritious food to maintain a healthy and active life”. commonly, the concept of food security is defined as including both physical and economic access to food that meets people’s dietary needs as well as their
food preferences.
http://www.who.int/trade/glossary/story028/en/
Greater Buffalo the geographical area encompassing the city of buffalo and surrounding suburbs.

74 Comunity HealtH needs assessment
grUM Cluster a GRUM church or group of GRUM churches grouped together based on their proximity and location within the city of buffalo or Greater buffalo to facilitate the analysis of those geographic areas that are faced with similar neighborhood and socioeconomic challenges.
health a state of complete physical, mental, and social well-being and not just the absence of sickness or frailty.
http://www.cdc.gov/socialdeterminants/definitions.html
health behavior individual actions that directly affect one’s health.
health Disparity a type of difference in health that is closely linked with social or economic disadvantage. health disparities negatively affect groups of people who have systematically experienced greater social or economic obstacles to health. these obstacles stem from characteristics historically linked to discrimination or exclusion such as race or ethnicity, religion, socioeconomic status, gender, mental health, sexual orientation, or geographic location. other characteristics include cognitive, sensory, or physical disability.
http://www.cdc.gov/socialdeterminants/definitions.html
health equity when all people have “the opportunity to ‘attain their full health potential’ and no one is ‘disadvantaged from achieving this potential because of their social position or other socially determined circumstance’”.
http://www.cdc.gov/socialdeterminants/definitions.html
Health Factors issues including health behaviors, access to care, social and economic influences, and physical environment issues that impact health outcomes.
Health Indicators a quantifiable measure relating to the achievement of specific health outcomes.
health inequity a difference or disparity in health outcomes that is systematic, avoidable, and unjust.
http://www.cdc.gov/socialdeterminants/definitions.html
Health Literacy the degree to which individuals have the capacity to obtain, process and understand basic health information needed to make appropriate health decisions and services needed to prevent or treat illness.
http://www.hrsa.gov/publichealth/healthliteracy/healthlitabout.html
Health Metrics benchmarks for health outcomes used to measure the health of a population.
Health Outcomes the resulting state of one’s physical, mental, and social well-being.
Health Rankings a comparison and classification of health outcomes for a specific geographical areas.
Heat Island Effect a term used to describe the phenomenon when built up areas that are hotter than nearby rural areas.
http://www.cdc.gov/socialdeterminants/definitions.html
Life Expectancy the average age a person or population is expected to live.
Multi-Scalar Analysis this is an approach to analysis that is conducted on multiple scales and uses multiple variables to assess a specific issue or question.
Neoliberalism an approach to economics and social studies in which control of economic factors is shifted from the public sector to the private sector. drawing upon principles of neoclassical economics, neoliberalism suggests that governments reduce deficit spending, limit subsidies, reform tax law to broaden the tax base, remove fixed exchange rates, open up markets to trade by limiting protectionism, privatize state-run businesses, allow private property and back deregulation.
Performance Indicators a set of quantifiable measures used gauge or compare performance in terms of meeting strategic and operational goals.
http://www.investopedia.com/terms/k/kpi.asp

75 Comunity HealtH needs assessment
Population Transiency
premature Death the age-adjusted loss of years of life due to death before age 75.
http://www.cdc.gov/hrqol/concept.htm
Quality of Life quality of life (qol) is a broad multidimensional concept that usually includes subjective evaluations of both positive and negative aspects of life. what makes it challenging to measure is that, although the term “quality of life” has meaning for nearly everyone and every academic discipline, individuals and groups can define it differently. although health is one of the important domains of overall quality of life, there are other domains as well—for instance, jobs, housing, schools, the neighborhood. aspects of culture, values, and spirituality are also key aspects of overall quality of life that add to the complexity of its measurement.
http://www.cdc.gov/hrqol/concept.htm
Service Desert for this report, service deserts are defined as urban neighborhoods that lack services, shops and stores found in other communities that allow individuals and families access to the goods and services they need on a daily basis. service deserts force people to travel to other parts of the city and metropolitan region to get needed goods and services, thereby making life more expensive and difficult.
Social Capital social capital refers to the institutions, relationships, and norms that shape the quality and quantity of a society's social interactions, allowing it to function efficiently.
http://web.worldbank.org/wbsite/exteRnal/topics/extsocialdevelopMent/
Social Determinates of Health the complex, integrated, and overlapping social structures and economic systems that are responsible for most health inequities. these social structures and economic systems include the social environment, physical environment, health services, and structural and societal factors. social determinants of health are shaped by the distribution of money, power, and resources throughout local communities, nations, and the world.
Social Geography social Geography studies the spatialization of society in a particular place or region. it is an inherently multi-disciplinary field that continues to evolve and grow as we realize that everything is in fact interconnected and related. it is also a branch of human geography dealing with social relationships and structures, and the interrelations between these; the environment of a place or region, as it relates to, or is affected by, society and social factors.
http://placeculture.wordpress.com/2010/11/28/social-geography/
Socio-Demographics this term refers to data that is collected and analyzed based on a combination of social and demographic factors.
Socioeconomic Inequality discrimination and inequity for a group or race of people based on economic and demographic factors such as income level, poverty level, labor force participation rate, unemployment rate, etc. due to structural barriers imposed on that group or race.
Spatial Units the geographic area used to analyze a particular set of data, often; these areas have been predetermined based on preexisting boundaries, such as a census block or a city boundary. however, researchers often determine appropriate spatial units in circumstances where no predefined boundary exists.
Urban Land-Rent Gradient the general definition of this term refers to the value of parcel(s) of land in a central city as it relates to its location within the city. the cost of land within this dynamic is affected by the physical, social, and economic environment at any given time.
Vacant Housing an empty building that is not in use, but the owner is known. in most cases the building is foreclosed or owned by a bank.
http://chicagobuildings.org/faq.html
Windshield Survey observing the physical features of the built environment, either on foot or in a moving vehicle, to help determine certain neighborhood level conditions.
Zone of Change the radical remaking and alteration of the social and/or physical dimensions of a specific geographical area.
this term refers to the movement of the population within a geographic area, such as a neighborhood, city or county within a short period of time.

76 Comunity HealtH needs assessment
appenDix blist Of pUbliC Meetings
Cluster # grUM host site Public Meeting DateCluster 1 pilgrim baptist church
665 Michigan avenuebuffalo, ny
9/11/2014
Cluster 2 first centennial baptist church373 high streetbuffalo, ny
9/9/2014
Cluster 3 hopewell baptist church1301 fillmore avebuffalo, ny
8/18/2014
Cluster 4 white Rock baptist church 480 e Utica stbuffalo, ny
8/25/2014
Cluster 5 lincoln Memorial United Methodist church641 Masten avebuffalo, ny
8/26/2014
Cluster 6 nazareth baptist church475 berkshire avebuffalo, ny
8/19/2014
Cluster 7 elim christian fellowship70 chalmersbuffalo, ny
8/21/2014
Cluster 8 asamblea iglesias de cristianas213 ontario st.buffalo, ny
9/15/2014
Cluster 9 Revival church of buffalo195 lafayette avenuebuffalo, ny
9/2/2014
Cluster 10 thankful Missionary baptist church 187 sumner placebuffalo, ny
8/28/2014
Cluster 11 Mount olive baptist church 66 wasson avelackawanna, ny
9/4/2014
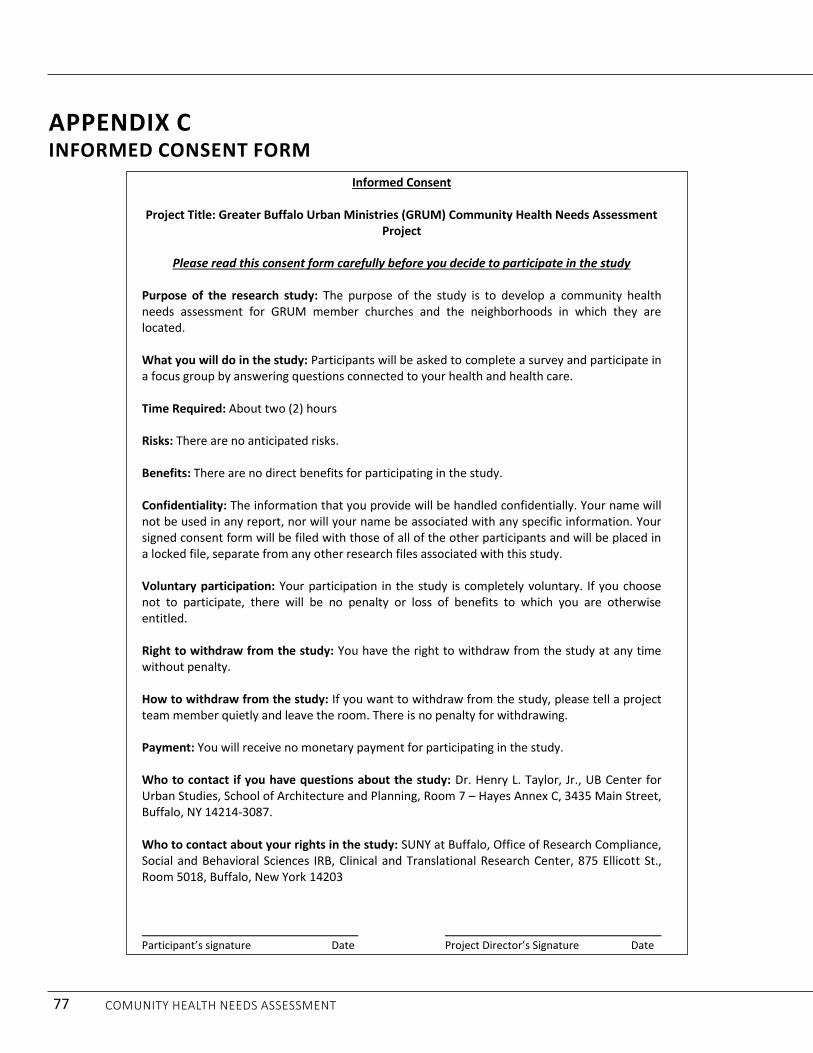
77 Comunity HealtH needs assessment
appenDix CinfOrMeD COnsent fOrM
Informed Consent
Project Title: Greater Buffalo Urban Ministries (GRUM) Community Health Needs Assessment Project
Please read this consent form carefully before you decide to participate in the study
Purpose of the research study: The purpose of the study is to develop a community health needs assessment for GRUM member churches and the neighborhoods in which they are located. What you will do in the study: Participants will be asked to complete a survey and participate in a focus group by answering questions connected to your health and health care. Time Required: About two (2) hours Risks: There are no anticipated risks. Benefits: There are no direct benefits for participating in the study. Confidentiality: The information that you provide will be handled confidentially. Your name will not be used in any report, nor will your name be associated with any specific information. Your signed consent form will be filed with those of all of the other participants and will be placed in a locked file, separate from any other research files associated with this study. Voluntary participation: Your participation in the study is completely voluntary. If you choose not to participate, there will be no penalty or loss of benefits to which you are otherwise entitled. Right to withdraw from the study: You have the right to withdraw from the study at any time without penalty. How to withdraw from the study: If you want to withdraw from the study, please tell a project team member quietly and leave the room. There is no penalty for withdrawing. Payment: You will receive no monetary payment for participating in the study. Who to contact if you have questions about the study: Dr. Henry L. Taylor, Jr., UB Center for Urban Studies, School of Architecture and Planning, Room 7 – Hayes Annex C, 3435 Main Street, Buffalo, NY 14214-3087. Who to contact about your rights in the study: SUNY at Buffalo, Office of Research Compliance, Social and Behavioral Sciences IRB, Clinical and Translational Research Center, 875 Ellicott St., Room 5018, Buffalo, New York 14203 Participant’s signature Date Project Director’s Signature Date

78 Comunity HealtH needs assessment
appenDix DsUrvey instrUMent
1
GRUM COMMUNITY HEALTH NEEDS SURVEYHello, my name is (*your name*), and I am working with the project team for the Greater Buffalo United Ministries (GRUM) Community Health Needs Assessment team.
The purpose of this interview is to provide the GRUM churches, in partnership with the Greater Buffalo United Accountable Healthcare Network (GBUAHN), with the data and information needed to build an interactive health care network between GBUAHN (the network) and the GRUM churches and their immediate neighborhoods. This health network will be designed to provide services to residents that are 18 years and older and that are either covered by Medicaid or eligible for Medicaid. This network will give you easy access to improve resources for your health and well-being.
ALL INFORMATION IN THIS SURVEY WILL BE HELD STRICTLY CONFIDENTIAL AND WILL NOT BE SHARED WITH ANY OTHER PERSONS, ORGANIZATIONS AND/OR INSTITUTIONS.
Administrative Information
Survey Number: ______________ Date: _______________
GRUM Church______________________________ GRUM Cluster Meeting #__________
Personal Data
Time Ended: _______________
Address: _________________________________________
Date of Birth: _____________________________________
Gender: Male____ Female____ Other____
Race:
White Black Hispanic Asian African Native American Other
How long have you lived in Buffalo? ______________
How long have you lived at your current address? _____________
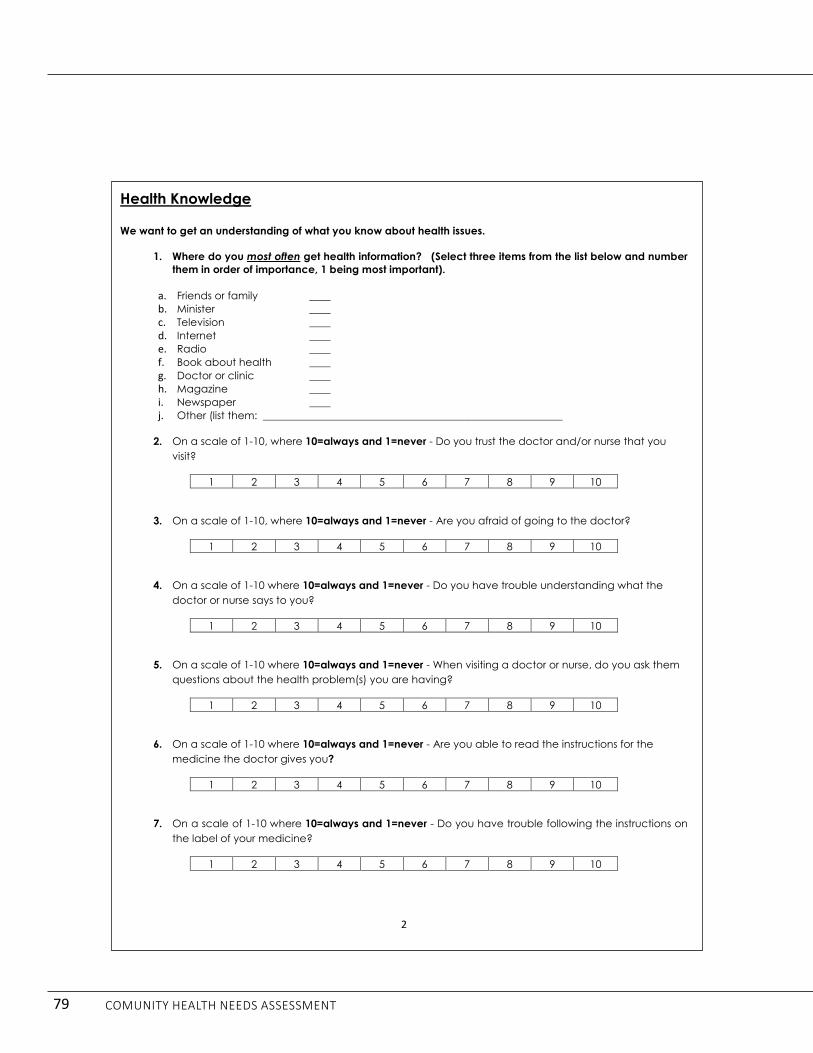
79 Comunity HealtH needs assessment
2
Health Knowledge
We want to get an understanding of what you know about health issues.
1. Where do you most often get health information? (Select three items from the list below and number them in order of importance, 1 being most important).
a. Friends or family ____b. Minister ____c. Television ____d. Internet ____e. Radio ____f. Book about health ____g. Doctor or clinic ____h. Magazine ____i. Newspaper ____j. Other (list them: _________________________________________________________
2. On a scale of 1-10, where 10=always and 1=never - Do you trust the doctor and/or nurse that you visit?
1 2 3 4 5 6 7 8 9 10
3. On a scale of 1-10, where 10=always and 1=never - Are you afraid of going to the doctor?
1 2 3 4 5 6 7 8 9 10
4. On a scale of 1-10 where 10=always and 1=never - Do you have trouble understanding what the doctor or nurse says to you?
1 2 3 4 5 6 7 8 9 10
5. On a scale of 1-10 where 10=always and 1=never - When visiting a doctor or nurse, do you ask them questions about the health problem(s) you are having?
1 2 3 4 5 6 7 8 9 10
6. On a scale of 1-10 where 10=always and 1=never - Are you able to read the instructions for the medicine the doctor gives you?
1 2 3 4 5 6 7 8 9 10
7. On a scale of 1-10 where 10=always and 1=never - Do you have trouble following the instructions on the label of your medicine?
1 2 3 4 5 6 7 8 9 10

80 Comunity HealtH needs assessment
3
8. On a scale of 1-10 where 10=always and 1=never - Do you have trouble understanding and filling out medical forms?
1 2 3 4 5 6 7 8 9 10
9. On a scale of 1-10, where 10=very knowledgeable and 1=not knowledgeable at all –How adequate is your knowledge of the following chronic diseases?
Diabetes 1 2 3 4 5 6 7 8 9 10High Blood Pressure/Hypertension
1 2 3 4 5 6 7 8 9 10
Heart Disease 1 2 3 4 5 6 7 8 9 10Cancer 1 2 3 4 5 6 7 8 9 10Kidney disease 1 2 3 4 5 6 7 8 9 10Asthma 1 2 3 4 5 6 7 8 9 10Obesity 1 2 3 4 5 6 7 8 9 10Depression 1 2 3 4 5 6 7 8 9 10AIDS/HIV 1 2 3 4 5 6 7 8 9 10
Nutrition and Health Knowledge
1. We want to know about the foods you eat on a typical day.
a. Do you regularly eat breakfast? Yes ____ No _____
If yes, List the foods that you would normally eat at breakfast:
1.___________________________________________________2.___________________________________________________3.___________________________________________________4.___________________________________________________
b. Do you regularly eat lunch?Yes ____ No ____
If yes, List the foods that would eat for lunch:
1. ________________________________________________________2. ________________________________________________________3. ________________________________________________________4. ________________________________________________________

81 Comunity HealtH needs assessment
4
c. Do you regularly eat dinner? Yes ____ No____
If yes, List the foods that would normally eat for dinner:
1. ________________________________________________________2. ________________________________________________________3. ________________________________________________________4. ________________________________________________________
d. How Many Meals do you eat daily? 1 2 3 More than 3
e. On a scale of 1 to 5, with 1 being very good and 5 being very poor - How would you rate your diet?
1 2 3 4 5
f. List three (3) places where you normally go to grocery shop?
1. ______________________________________2. ______________________________________3. ______________________________________
g. How do you usually get to the grocery store for shopping? Bus____ Car____ Friend _____ Taxi_____ Walk ____ Other (please indicate) ________________________________________
h. How often do you go to the convenience store in your neighborhood: Often____ Not often____ Rarely____ Never _____
i. How would you rate the services found in your neighborhood?Excellent____ Very Good____ Good____ Poor____ Very Poor____
2. On a scale of 1-10, where 10=very important and 1=not important at all - How important are the following factors in influencing what you buy when shopping for groceries?
Nutritional Value 1 2 3 4 5 6 7 8 9 10Price 1 2 3 4 5 6 7 8 9 10Item on Sale 1 2 3 4 5 6 7 8 9 10Coupons 1 2 3 4 5 6 7 8 9 10WIC Eligible 1 2 3 4 5 6 7 8 9 10Foods I Like 1 2 3 4 5 6 7 8 9 10Dietary Needs 1 2 3 4 5 6 7 8 9 10Foods my Children Want 1 2 3 4 5 6 7 8 9 10Advertisement 1 2 3 4 5 6 7 8 9 10Brand Name

82 Comunity HealtH needs assessment
5
3. We want to know how much exercise you get daily and weekly.
How often do you engage in the following activities?
a. Walking
Less than 30 minutes daily____ More than 30 minutes daily____
b. Gardening
Often____ Sometimes ____ Never _____
c. Biking
Often____ Sometimes ____ Never _____
d. Go to a Gym/Fitness Center
Often____ Sometimes ____ Never _____
e. Please estimate how much exercise you get weekly:
30 minutes ____ 1 hour____ 2 to 3 hours____ More than 3 hours____
f. Is your job:
Sedentary____ Slightly Sedentary____ Active____ Very Active____
g. On a scale of 1 to 5, with 1 being very good and 5 being very poor - How would you rate the amount of your weekly physical activity?
1 2 3 4 5
Neighborhood Conditions1. On a scale of 1-10 where 10=very safe and 1=not safe at all - How safe do you feel in your
neighborhood?
1 2 3 4 5 6 7 8 9 10
2. On a scale of 1-10 where 10=very safe and 1=not safe at all - How safe do you feel in your home?
1 2 3 4 5 6 7 8 9 10
3. On a scale of 1 – 5, with 1 being very good and 5 being very bad - How would you rate the following community conditions?
a. Unkempt Vacant lots _____ b. Poor Sidewalks _____c. Abandoned Housing _____ d. Drug Houses _____e. Crime _____ f. No parks, playgrounds or play areas _____ g. Trash and Garbage on ground _____h. Houses in need of paint/major repairs _____

83 Comunity HealtH needs assessment
6
Housing Conditions
1. Please estimate the age of your home: 0-20 years____ 21-40 Years____ 41-60 Years____ 61-80 Years____ 80 Years and older____
2. Do you own or rent the house in which you live? Own___ Rent___
3. Do you pay rent or a mortgage in the housing unit in which you live?Yes ___ No ___
4. Estimate the percent of your monthly income that is spent on housing (rent /mortgage, utilities, repairs, and other expenses) ______%
5. How long have you lived at your current residence? Less than one year ____ 1-2 Years ____ 2-5 Years____ 5 or more Years_____
6. How many bedrooms are in your housing unit? _____
7. How many people live in your housing unit? _____
8. What type of house do you live in? Detached Single home_____ Two-family home____ Side by Side home____ Townhouse____ Multi-family home____
9. Check all the items or conditions found in your home:
RodentsCockroachesTicksNon-Working Smoke DetectorsLead PaintPeeling PaintAsbestosDrafty WindowsDrafty Doors House is cold in the winterSpace HeatersLeaky RoofLeaky PipesPoor LightingNone of the above
10. On a scale of 1 to 5, with 1 being very good and 5 being very poor - How would you rate the condition of your house? (Please check the most appropriate number)
1 2 3 4 5

84 Comunity HealtH needs assessment
7
Access to Health Care
1. Is there a doctor’s office, particular clinic, or hospital emergency room that you go to if you are sick or need advice about your health? (If YES, please check the box below to next to the place of health care that you go to)
Source of Medical CareNo regular medical carePrivate Physician’s OfficeErie County Medical Center - Emergency Room (ECMC)Buffalo General - Emergency RoomWomen and Children’s Hospital - Emergency RoomSisters of Charity Hospital - Emergency RoomMASH / Immediate Care Mercy Comprehensive Health Care ClinicOther Medical Source (list or name below)
2. We are also interested in knowing what type of health insurance you have, if any. How do you cover the costs of your health care? (Please check all the company(s) that applies to you)
Insurance ProviderNone/Self Pay MedicaidMedicareHill BurtonIndependent HealthCommunity BlueUniveraBlue Cross Blue ShieldFidelis CareBGH Insurance PlanGHIAetnaUnsure / Don’t KnowOther (Please list below)

85 Comunity HealtH needs assessment
8
3. Not everyone needs or wants to see a doctor every time they are sick. We are interested in knowing what other types of things you do to get better when you are sick, besides going to a doctor. (Please answer yes or no to the following questions)
a. Do you wait until sickness passes, or is over? Yes____ No____
b. Do you use medicines you can get at the drug store or supermarket without a prescription?Yes____ No____
c. Do you use home remedies? Yes____ No____
d. Do you seek the help of a chiropractor, someone who uses body adjustments to cure, such as adjusting the spinal column to cure back pain?Yes____ No____
e. Do you seek an acupuncturist, someone who uses needles and pressure to cure?Yes____ No____
f. Do you seek the advice of a folk healer?Yes____ No____
g. What other strategies do you use? (Please list all that apply)
_______________________________________
_______________________________________
_______________________________________
_______________________________________

86 Comunity HealtH needs assessment
9
Prevalence of Chronic Disease1. Below is a list of chronic diseases. Please check each disease that you have:
DiabetesHigh Blood Pressure/HypertensionArthritisKidney DiseaseCancerAsthmaHeart DiseaseStrokeDepression/Generalized AnxietyLupusBipolar disorderAIDS/HIVObesityMultiple SclerosisOther (Please list below)
I don’t have any chronic diseases
2. Now, we want to know how frequently you visit a doctor, clinic or hospital.
a. When was your last medical visit?Less than 6 months ago _____ 6 months to 1 Year _____ 1 to 2 Years ago _____ 2 to 3 Years ago____ Over 3 Years ago____ Have never seen a doctor _____
b. What was the reason for your last visit to the doctor? Regular check-up____ I was sick____ Don’t Recall____
c. Do you have regular medical check-ups? Yes____ No____
d. If you answered yes, how often do you visit a doctor? Once a year____ Twice a year____ Every now and then____
e. If you do not have regular medical check-ups, please tell us why:

87 Comunity HealtH needs assessment
10
More Data on you1. What was the last grade you finished in school?
• No Education ____• Highest Grade Completed (Check one)
1 2 3 4 5 6 7 8 9 10 11 12• Some college ____• College Graduate ____• Graduate School ____
2. What is your country of birth? _____________________________
3. What is your primary language? _____________________________
4. What is your estimated annual income?1. $0.00 to $14,999 ____2. $15,000 to $29,999 ____3. $30,000 to $49,999 ____4. $50,000 to $69,999 ____5. $70,000 and above ____6. I cannot answer ____
5. Are you employed? Yes____ No____
6. If you are employed, do you work:Full time____ Part-time____
7. Are you retired?Yes____ No____
8. Are you on disability?Yes____ No____
9. Are you currently on Public Assistance?Yes____ No____
10. Do you own a car?Yes____ No____
11. What is the name of your Neighborhood? ________________________________
12. Are you currently covered by Medicaid? Yes____ No____
Thank You!

88 Comunity HealtH needs assessment
appenDix eFOCUS GROUP QUESTIONS
Greater Buffalo United Ministries Community Health Needs Assessment GRUM Focus Group Questions:
1. When you go grocery shopping, how do you typically get to the store? I will name five places:
Your Neighborhood, East Side, West Side, Buffalo, and Suburbs -- Raise your hand when Identify the place where you do most of your grocery shopping takes place. Neighborhood, East Side, West Side, Buffalo, Suburbs:
2. Do you experience trouble getting the groceries into your house or apartment?
3. What are the main factors do you consider when buying grocery?
4. What are the things that keep you from buying the type of groceries or food that you want and need?
5. How much exercise do you get on a weekly basis? What type of exercise is it? What things [problems or other challenges] keep you from exercising? What about walking in your neighborhood? Do you walk around the neighborhood to get exercise? If not, what things keep you from doing this?
6. I am going to ask a series of questions about health and exercise:
a. What do you think a good breakfast would consist of: b. What do you think a good lunch would consist of: c. What do you think a good dinner would consist of:
d. What factors keep people from eating a good breakfast, lunch, dinner?
7. Are you a caregiver for someone in your family—grandchildren, parents, relatives?
8. What things [problems] keep you from going to the doctor [or clinic] for visits or regular medical
check-ups? [To be examined and take test to make sure that you have no illnesses].
9. What would make it easy for you to visit the doctor or clinic when you needed to go?
10. Where do you go to purchase medicine: raise your hand when I name the place you are most likely to go to get the medicine you need [neighborhood, East Side, West Side, Buffalo, Suburbs].
11. When you need help, such as doing chores, getting help when you are sick and in bed, feeling down and need someone to talk to, who would you most likely contact?
12. What are three things you like the most about your neighborhood?
13. What are three of the most important problems for people living in your neighborhood?

89 Comunity HealtH needs assessment
Greater Buffalo United Ministries Community Health Needs Assessment
PREGUNTAS PARA GRUPO DE ENFOQUE: 1. Cuando vaya de compras, como suelen llegar a la tienda? Voy a nombrar cinco lugares:
Su vecindario, El Este, El Oeste, Buffalo y los Suburbios -- Levante la mano cuando identifique el lugar en que hace la mayor de sus compras comestibles.
El vecindario, El Este, El Oeste, Buffalo, Los Suburbios:
2. Has experimentado problemas llevando su compra a su casa o apartamento? 3. Cuales son los principales factores que consideras al comprar comestibles? 4. Cuales son las cosas que le impide comprar el tipo de alimentos o alimentos que usted quiere y necesita? 5. Cuanto ejercicio tu haces a la semana? Que tipo de ejercicio es? Que cosas [problemas u otros desafios] impide que tu hagas ejercicio? Que acerca de caminar en su vecindario? Caminas alrededor de su vecindario para conseguir ejercicio? Si no, que cosa le impide? 6. Voy a preguntarte una serie de preguntas sobre la salud y el ejercicio.
a) Que piensas un buen desayuno consistiria? b) Que piensas un buen almuerzo consistiria? c) Que piensas una buena cena consistiria?
d) Que factores impiden que la gente comen un buen desayuno, almuerso, y cena?
7. Es usted un cuidador para alguien en su familia--nietos, padres, parientes? 8. Que cosas [problemas] te mpiden ir al medico [o clinica] para visita o chequeos medicos regulares? [Para ser examinado y tomar la prueba para segurarse de que no padece ninguna enfermedad]. 9. Que lo haria mas facil para que usted visite al medico o la clinica cuando necesitabas ir? 10. A donde va a comprar la medicina: levante la mano cuando nombro el lugar que tienen mas probabilidades de ir a conseguir el medicamento que necesitas [vecindario, El Este, El Oeste, Buffalo, los Suberbios? 11. Cuando usted necesita ayuda, por ejemplo, hacer las tareas, obtener ayuda cuando este enfermo y en cama, deprimido y necesita alguien con quien hablar, quien seria su mas probable contacto? 12. Cuales son tres cosas que mas le gusta de su vecindario? 13. Cuales son tres de los problemas mas importante para las personas que viven en su vecindario?

90 Comunity HealtH needs assessment
appenDix egrUM ChUrCh sUrvey
UB Center for Urban Studies Community Health Needs Assessment
GRUM Church Questionnaire
Background Information
1. Date____________________________________________ 2. Church Name_____________________________________ 3. Completed by_____________________________________ 4. Contact E-Mail Address_____________________________ 5. What is the name of the neighborhood in which the church is located___________________ 6. Address__________________________________________ 7. Pastor ___________________________________________
Church Information: If the data is not readily available to answer these questions, then estimate to the best of your knowledge, the answer to the following questions.
8. Number of Parishioners___________________________ 9. Racial Make-up
a. African American____________ b. Black [other countries]_________ c. White____________ d. Asian______________ e. African___________ f. Caribbean ________ g. Hispanic _____________ h. What are the ethnic backgrounds of the Hispanics church members? Indicate the
approximate percentage. i. Puerto Rican_____ ii. Cuban______
iii. Mexican______ iv. Others_______
i. What percent of your parishioners are recent immigrants:__________
j. Languages spoken in Church other than English:
i. ____________________ ii. ____________________
iii. ____________________ iv. ____________________

91 Comunity HealtH needs assessment
UB Center for Urban Studies Community Health Needs Assessment
10. Congregation: by neighborhood we are referring to four to five square block or the immediate census tract in which the church is located. To the best of your ability, estimate the…
a. Percent Living in Neighborhood________. b. Percent Living outside of Neighborhood___________. c. Percent Living in Buffalo___________.
11. What Percent of the members of your church do you estimate are eligible for Medicaid (133% of
the poverty level or $15,551 for a one-person family) ___________.
12. What Percent of the members of your immediate church neighborhood are eligible or currently enrolled in Medicaid (estimate)_______________
Neighborhood rating
13. On a scale of 1 to 5, with 1 being very good and 5 being very poor, how would you rate the neighborhood in which the church is located in terms of the following:
a. Crime: 1___2___3___4__5___ b. Housing: 1___2____3____4___5___ c. Physical environment: 1___2___3___4___5___ d. Access to parks, groceries, schools, services: 1____2___3___4___5___ e. Overall condition: 1____2____3___4___5___
14. On a scale of 1 to 5, with 1 being very good and 5 being very poor, how would you rate your
church’s relationship with neighborhoods within three to four square blocks of the church. 1____2___3____4____5____.
15. Please list the programs that your offer the neighborhood residents a. ______________________________________
b. ______________________________________
c. _________________________________________
d. __________________________________________
e. __________________________________________

92 Comunity HealtH needs assessment
appenDix fwinDshielD sUrvey MethODOlOgy
1
Instructions for the Google Virtual Street Level Windshield Survey and Satellite Scan You can use Google Earth, Walkscore, or Google My Map, but the directions must be followed regardless of the program used.
1. In this survey, the church is the focal point of the neighborhood. The neighborhood boundaries are based on the church location, and it should be the start point in the windshield survey.
2. The boundaries for each of the neighborhoods are found in the GRUM cluster file. Use the boundaries to determine what streets should be canvassed.
3. Go into Goggle Maps, and place the icon on the street to be entered.
Place the Icon at the street entry

93 Comunity HealtH needs assessment
2
4. Line up the curser so that it is on the street that you want to go down .
5. Situate the map so that the left hand side of the street is facing you. The houses should be f lush with the screen.
Figure 1: This is the picture you should see when the review starts. Make sure you are on the left side of the street.
6. If you place the oval cursor on a house it will turn into a rectangle. Do a left click on the
mouse, and it will properly situate the left hand side of the street on your screen.

94 Comunity HealtH needs assessment
3
Figure 2: the orange arrow is where your cursor should be to advance the page along the street
7. Your evaluation will be for the entire street. As you move from lot to lot, please make note of the ratings for the five variables. Rate each side of the street, and then rate the entire street. Your final score should be based on a summation of the ratings of all streets in the neighborhood.

95 Comunity HealtH needs assessment
4
8. To move down the street, left clique the mouse one time. That should move you about one
house. You will to get some experience in keeping it focus on the one side of the street. Make sure the arrow is in the oval, which should be ahead of the directional arrows.
9. On each stop: (1) examine the sidewalk and curb (2) the land maintenance (3) House (4) vacant lot if one exists. Notice things like storage on the front porch [lawn mower, couch, and other items].
The evaluation should be based on the complete assessment of both sides of the street.

96 Comunity HealtH needs assessment
5
Your assessment should be very systematic. Evaluate the curbs, then the sidewalks, and next the house. Look first at the yard—does it have flowers, is it landscaped, and well-maintained—and then the house—does it need paint/stairs/porch/windows, roof. If there is a vacant lot, you still move systematically from the curb, sidewalk, and then to the vacant lot.
Curb assessment Sidewalk
assessment
House analysis
Vacant lot

97 Comunity HealtH needs assessment
6
Figure 3: Use the larger context to look for environmental pollution and other issues. When making this satellite view, note issues like proximity to parks, railroad tracks, large highways and other issues that could impact air quality and/or access to parks, playgrounds and other recreational sites.
The Variables
Neighborhood Condition Index Physical condition of Sidewalk 1. Excellent: Well paved, good curbs (handicap accessible), room for people to pass. 2. Good: A few cracks, passable, curbs need some repair. 3. Fair: Many cracks, passable, curbs poorly maintained, need some repair. 4. Poor: Numerous cracks, uneven slabs, tripping big possibility, passing is problem, no handicap accessibility; missing slabs; need major repair, no handicap accessibility.
Railroads Parks Major Streets