Striving for a Better Operating Theatre Environment for a Better Operating Theatre Environment May...
26
Striving for a Better Operating Theatre Environment May 11, 2010 HKHA Convention 2010 – Symposium 11 CONFIDENTIAL AND PROPRIETARY Any use of this material without specific permission of McKinsey & Company is strictly prohibited Dr Claudia Süssmuth-Dyckerhoff Dr Alexander Ng
-
Upload
phamnguyet -
Category
Documents
-
view
217 -
download
4
Transcript of Striving for a Better Operating Theatre Environment for a Better Operating Theatre Environment May...

Striving for a Better Operating Theatre Environment
May 11, 2010HKHA Convention 2010 – Symposium 11
CONFIDENTIAL AND PROPRIETARYAny use of this material without specific permission of McKinsey & Company is strictly prohibited
Dr Claudia Süssmuth-DyckerhoffDr Alexander Ng

McKinsey & Company 1|
From health systems to hospital departments, healthcare leaders are under increasing pressure to tackle multiple challenges
Delivering high
quality
SOURCE: McKinsey Global Institute analysis
Responding to rising
costs
▪ Managing rising numbers of chronic disease patients
▪ Reducing variations in clinical practice
▪ Adopting evidence-based care
▪ Defining "right" level of care and coverage
▪ Defining role of private and public sectors
▪ Ensuring equity across the system
▪ Improving value for spending▪ Ensuring rational adoption of new
drugs, devices, and technologies▪ Creating value conscious patients
and cost competitive providers
Providing
access
How to best balance cost, quality, and access in a manner that is both sustainable and consistent with social values and political goals?

McKinsey & Company 2|
Performance of the system is under increasing public scrutiny
Delivering high
quality
Responding to rising
costs
Providing
access
SOURCE: Press articles

McKinsey & Company 3|
McKinsey has supported hospitals globally to address the challenge of balancing quality, access, and cost
SELECTED EXAMPLES
SOURCE: McKinsey
Turn around a university hospital around of ~1,500 beds and more than 40 clinical facilities including reorganizing operating theatre, intensive care, and emergency room
Improve surgical service operations for large 1,500-bed hospital
Diagnose operating theatre process for a major academic medical centreto benchmark productivity, quality and identify improvement initiatives
Transform surgical pathway and major specialities that are stakeholders in OT for major NHS hospitals
Liberate effective capacity to enable growth incardiovascular surgical services for a 900-bed urban hospital affiliated with a major medical school
McKinsey & Company 4|
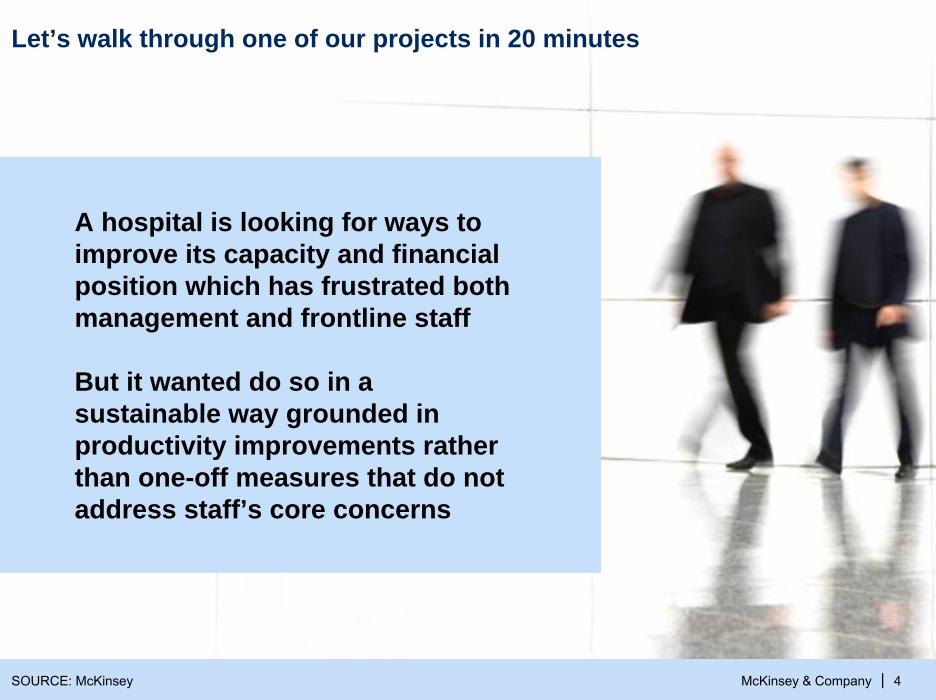
Let’s walk through one of our projects in 20 minutes
SOURCE: McKinsey
A hospital is looking for ways to improve its capacity and financial position which has frustrated both management and frontline staff
But it wanted do so in a sustainable way grounded in productivity improvements rather than one-off measures that do not address staff’s core concerns

McKinsey & Company 5|
To deliver performance, we focused on building strengths in 3 areas as the cornerstones of our approach
“The way assets and resources are configured and optimized to create value and minimize losses”
“The formal structures, processes, and systems through which resources are managed in support of the operating system”
“The way people think, feel, and conduct themselves in the workplace, individually and collectively”
Operating System
Management Infrastructure
Mindsets, Capabilities, &
Behaviours
SOURCE: McKinsey
McKinsey & Company 6|
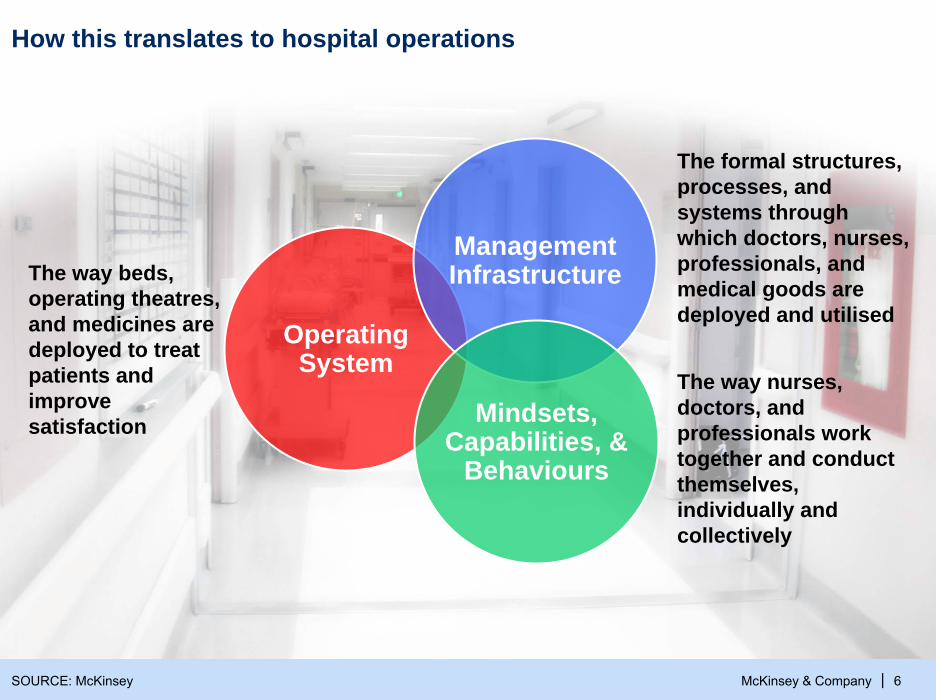
How this translates to hospital operations
The way beds, operating theatres, and medicines are deployed to treat patients and improve satisfaction
Operating System
Management Infrastructure
Mindsets, Capabilities, &
Behaviours
SOURCE: McKinsey
The formal structures, processes, and systems through which doctors, nurses, professionals, and medical goods are deployed and utilised
The way nurses, doctors, and professionals work together and conduct themselves, individually and collectively

McKinsey & Company 7|
The project focused on the elective knee replacement as a start
Create an overview of the pathway and problem areas
Focus on 1-2 problems to solve
Review results, sustain improvements, celebrate success and agree on next areas to focus on
Generate solutions, agree on changes, and implement
SOURCE: McKinsey

McKinsey & Company 8|SOURCE: Pathway mapping exercise; Process observations
Patient journey for primary knee replacement highlighted a number of issues
Outpatient clinic(25% new, 75% F/U)
Scheduling of appoint-ment(choose and book)
Pre-op assess-ment and booking
Pre-op assess-ment and consent (4-6weeks)
X-ray
Out
Out
▪ ~50% choose & book
Treatment plan
▪ Basic decision to go ahead with surgery?
▪ Basic decision to go ahead with surgery
Home Post-op review (including x-ray)
Ward
Continued nursing care at home
Discharge to commu-nityhospital
▪ Social input▪ Physio and
OT input
▪ TT0 medication social services
▪ Early Orthopaedic Discharge Scheme
▪ Daily home nursing visits▪ Since Aug 2002 350+ patients
have used the scheme (80% hip or knee patients)
Admis-sion
Holding bay
Anaesthe-tist room
Theatre(av. 13.7 patients/week)
Recovery
Day of surgery arrival
▪ Arrive▪ Nursing
assessment▪ Doctor’s
assessment▪ Sign the
consents
▪ Ensure suitability (consent, etc.)
▪ “waiting” area
▪ Anesthetize patient when theatre free
▪ Operation and prep
▪ Nurse monitor recovery
▪ Wait for ward nurse to collect
▪ Arrive at 7:30▪ Sign the consent
Waiting time for
x-ray
High % nurse
time spent on notes
prep
External organizations
supply OT equipment and equipment will not always be
ordered at pre-op
Delay in patients arriving to theater ~31%
either not marked, consented or on
correct ward
Time wasted in
theatrestheatre
utilizationonly ~41%
Delays when
recovery closed
Delay in patients
collected from recovery
Average delay: 56 mins
Nurses spend as little as 31%
of time on direct patient
care
Delay in discharge due to transport ,
TT0s, or social services – LOS 0.8 days longer
than peer average
2h 0.5h 0.5h 0.5h 0.5h 0.1h 2h 7d1h 98d 48d 12h 0.75h 1h 28d 1h
McKinsey & Company 9|
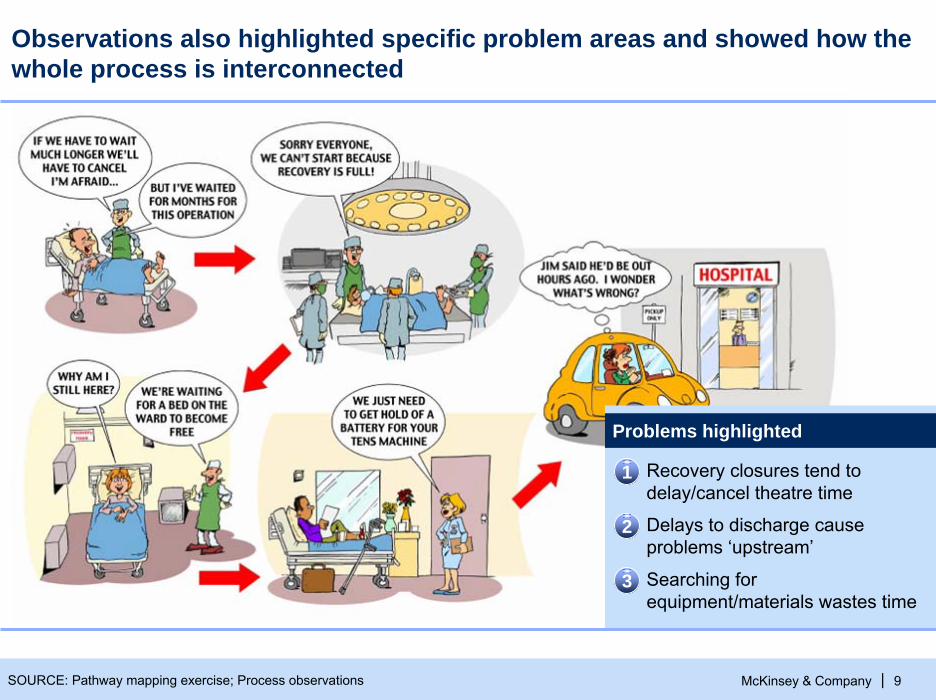
Observations also highlighted specific problem areas and showed how the whole process is interconnected
SOURCE: Pathway mapping exercise; Process observations
Recovery closures tend to delay/cancel theatre time
Delays to discharge cause problems ‘upstream’
Searching for equipment/materials wastes time
Problems highlighted
1
2
3

McKinsey & Company 10|
▪ The problems most cited by orthopaedics staff were time wasted due to process glitches, delays in and out of theatres & delays to discharge
▪ Discharge planning will reduce LOS and lower bed occupancy. This would reduce the time spent ‘chasing’ beds
▪ Focusing on ensuring patients get down to theatre and leave recovery when ready will increase theatre utilization
Process issues are frustrating staff both on wards and theatres
Time wasted, 10 mentions
Time wasted searching for LMAs in the morning
Problems in discharging,6 mentions
Family came to collect Rx which arrived on ward but not signed
off(staff nurse, Ward 11)
Delays in and out of theatres, 7 mentions
Patients getting to holding bay after their
trolleys have been here 15 mins or more
SOURCE: Staff feedback forms

McKinsey & Company 11|
Improving operating theatre environment was made a priority
SOURCE: Pathway mapping exercise; Process observations
▪ “Recovery” was later prioritised as the focus as it was the area that staff perceived as the main bottleneck
▪ The following analyses and approaches could be applied to any of the issues upstream or downstream along the patient pathway
Holding bay Anaesthe-tist room
Theatre(av. 13.7 patients/week)
Recovery
Day of surgery arrival
▪ Ensure suitability (consent, etc.)
▪ “waiting” area
▪ Anesthetize patient when theatre free
▪ Operation and prep
▪ Nurse monitor recovery
▪ Wait for ward nurse to collect
▪ Arrive at 7:30▪ Sign the consent
Delay in patients arriving to theater ~31%
either not marked, consented or on
correct ward
Time wasted in
theatrestheatre
utilizationonly ~41%
Delays when
recovery closed
Delay in patients
collected from recovery
Average delay: 56 mins
Nurses spend as little as 31%
of time on direct patient
care

McKinsey & Company 12|
Detailed observations of one session provides further insight into how time is lost
Time usage in theatre 7 (trauma orthopaedic list for 3 patients, running 14:00-17:30)
▪ “Today was a very good day” (theatre 7 surgeon)
▪ Summary of time use: (100% = 3.5 hours)
12%
26%
62%
13:00 14:00 15:00 16:00 17:00 18:00
Peripheral time/waiting time2
Anaesthetic time
Surgical time1
SOURCE: Process Observations – Theatre 7
1 Knife to skin2 Includes setting up equipment movement of patients & waiting3 0n occasion up to 75% of trays have been unsterile and some packs have no replacement stocks
Surgical time1 Anaesthetic time Peripheral time/waiting time2
Recovery closes 14:55-15:10
An unsterile tray needed replacing3
Surgery due to start at 14:00 but in practice anaesthetic time does

McKinsey & Company 13|
21
118
7
41
96
Knife to skin
Anaes. time
Early finish
13
Prep time in theatre
Late arrival of patient
Latestarts
Late finishes
4
Scheduled time
Around 38% of theatre time is identified as not value-adding
Overall theatre utilisation 6 & 8 based on 9 days of data
50% of early finishes were due to cancellations
SOURCE: Theatre 6 & 8 utilisation over a 9 days period
Percent

McKinsey & Company 14|
Full recovering bay is closed to new patients, leading to cancellations or late finishes
As well as cancellations and late finishes, the expectation of closures in recovery is factored into scheduling by surgeons and the theatre manager, leading to lower numbers of patients per listand contributing to early finishes
Total minutes of recovery closure by time of day
3520
1351022011
1213
240142201522816
Number of closures by time of day
64
211
41
1516
1011121314
3855
3520
5413510
111213
120141516
Average length of closure by time of day
SOURCE: 18 days of recovery closure data

McKinsey & Company 15|
▪ Staffing levels generally track patient demand levels
▪ Late morning and afternoon and ‘crunch times’ when recovery is sometimes forced to close
▪ This was a ‘light day’ with 5 cancellations and 2 theatres closed
Recovery staff required1 vs. recovery staff present
While staggered shifts in recovery help to make the best use of available capacity … Peak periods
0
1
2
3
4
5
6
7
8
9
10
9:00
9:40
10:2
0
11:0
0
11:4
0
12:2
0
13:0
0
13:4
0
14:2
0
15:0
0
15:4
0
16:2
0
17:0
0
17:4
0
18:2
0
19:0
0
19:4
0
20:2
0
21:0
01 Based on 1:1 nursing for patients who are recovering and 1:2 nursing for patients who are recovered but waiting for collection
SOURCE: 3 days of observations in recovery
Recovery staff required1 Recovery staff present

McKinsey & Company 16|
▪ On average, half of patientsin recovery were fit to leave
▪ At approx 13:15, almost all patients in recovery were recovered (i.e. fit enough to return to the ward)
0
2
4
6
8
10
12
9:00
9:40
10:2
0
11:0
0
11:4
0
12:2
0
13:0
0
13:4
0
14:2
0
15:0
0
15:4
0
16:2
0
17:0
0
17:4
0
18:2
0
19:0
0
19:4
0
20:2
0
21:0
0
Recovered patients vs. total patients
... recovery nurses can spend more time looking after recovering patients than recovered patients … Recovered patients Recovering patients
SOURCE: 1 day recovery observations
McKinsey & Company 17|
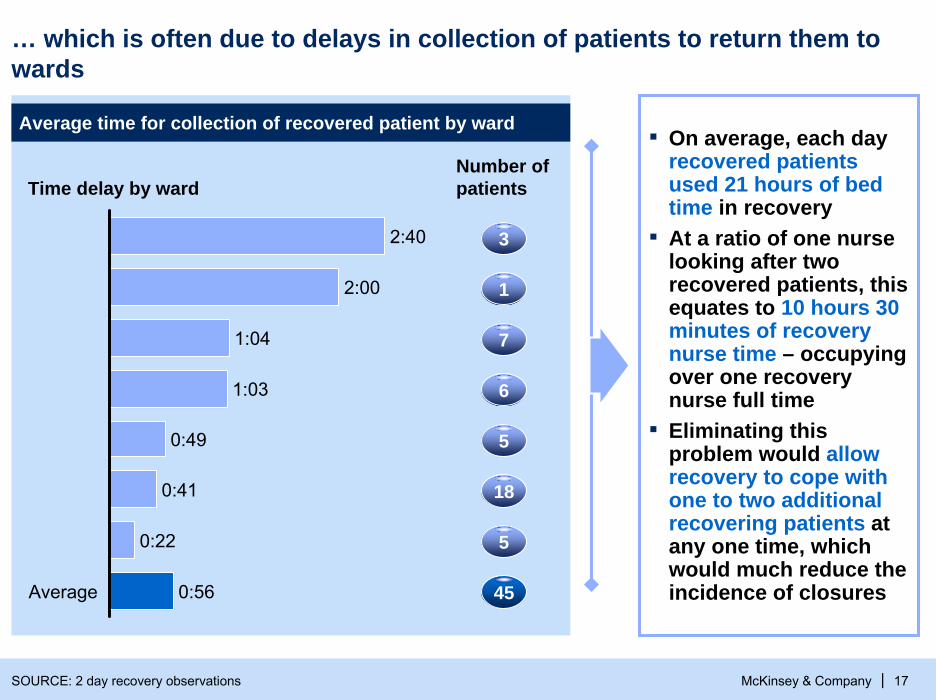
▪ On average, each day recovered patients used 21 hours of bed time in recovery
▪ At a ratio of one nurse looking after two recovered patients, this equates to 10 hours 30 minutes of recovery nurse time – occupying over one recovery nurse full time
▪ Eliminating this problem would allow recovery to cope with one to two additional recovering patients at any one time, which would much reduce the incidence of closures
… which is often due to delays in collection of patients to return them to wards
Time delay by ward
Average time for collection of recovered patient by ward
Number of patients
SOURCE: 2 day recovery observations
Average 0:56
0:22
0:41
0:49
1:03
1:04
2:00
2:40 3
45
1
7
6
5
18
5

McKinsey & Company 18|
Based on the analyses performed with frontline staff, we agreed on a number of improvement ideas during a workshop
AIM OF IMPROVEMENT WEEK: Make changes to ensure (1) patients can access and leave recovery without delay and (2) to ensure that patients are in theatres on time
Idea
▪ Health-care workers (HCW) can take low-criticality patients back to the wards
Description
▪ Change escorting policy for patients to be brought back to ward
▪ Recovery staff to bring patients back
▪ Measure key indicators
▪ Recovery staff to help holding bay and open reception earlier
▪ Measure key indicators
▪ Recovery staff to bring patients back rather than waiting for collection
▪ Record time between “patient ready to leave” and “actually left recovery bay”
▪ Record times that recovery closes
▪ One recovery nurse to assist holding bay 8.30 until 9.30 am and allow second person to use phone in reception
▪ Record delays in patient arrival vs. target time and note reasons for delays
SOURCE: Idea generation workshop

McKinsey & Company 19|
Changes
▪ Change in escorting policy to allow health-care workers (HCW) to escort patients
▪ Recovery nurses taking patients back to wards
▪ No local anaesthetic patients to go to recovery
▪ Theatre nurses to help take last patients of day back to wards
Impact
Average ‘waiting time’ in recovery1
Minutes
11
56
Improvement week
Diagnostic week
-80%
The average delay between recovered patients leaving recovery fell 80% from 56 minutes to 11 minutes
SOURCE: Observations and data collection in recovery unit

McKinsey & Company 20|
The recovery team & wards were pleased with the changes
Staff comments
We definitely would have been closed if we weren’t taking back
– Recovery leader
It really helped to keep patients flowing through
– Recovery nurse
It was a great help having our patients brought back and gave us some time back
– Ward leader
The team is pleased with the changes, they like taking back as they can then concentrate
on their next patients
There have been no delays in handoverof patients to the wards
– Recovery nurse
We had these ideas for a long time. I just don’t think our voice was quite loud enough, but now everyone has taken an interest. I feel further changes we suggest will be supported
– Recovery nurse
SOURCE: Staff interviews

McKinsey & Company 21|
Information
Process to solve problems
▪ Key indicators such as late starts, early finishes, and overruns tracked and reviewed on a weekly basis
▪ Charts from utilisation audit to be displayed
▪ Daily issues with new changes to be resolved by recovery/theatre teams
▪ Weekly review and actions with theatre lead and recovery leader
▪ Aims for the day or details of changes displayed on flipchart
▪ Review of bottom line form performance scorecard
▪ Analyse key areas highlighted form daily utilisation audit
▪ Develop action plan based on monthly scorecard results
TS
E
Efficiency
Q
Quality
Staff Timeliness
Visual management of objectives and results helped to track and embed changes
WeeklyDaily Monthly
SOURCE: McKinsey

McKinsey & Company 22|
Sustaining momentum for improvement was crucial in the long run
▪ Refine ward guidelines on changes
▪ Agree detail of policy
▪ Ensure expectations of wards and recovery are aligned, i.e., when is it ok for wards to say they are not ready, when can recovery still ask for timely collection by wards
▪ Monitor weekly time patient waiting once fit, recovery closures and theatre minutes lost due to this and display to the team weekly
Embed changes trialled Develop and implement new changes
▪Work on solving other blockages to the recovery system, i.e., ward pre-discharge system
▪Consider the use of a focused 1-week improvement initiative in other areas of the theatre action plans
▪ Visual management: Use theatre utilisation data to highlight problems and progress visually on boards in theatre areas
SOURCE: McKinsey
McKinsey & Company 23|
Improving recovery processes have also improved theatre utilisation and gradually shortened the waiting list▪ Less recovery closure time
▪ Less buffer built into theatre scheduling
▪ More efficient transfers between theatre and recovery
Staff is happier and more satisfied after removal of frustrating bottlenecks in processes
Working/training frontline staff with new skills to problem solve was a critical part of the McKinsey support, leading to staff feeling empowered to capture ongoing improvement opportunities
Getting quick wins early during the improvement week was instrumental to boosting staff’s morale, and made tackling subsequent issues a lot easier
Final thoughts
SOURCE: McKinsey

McKinsey & Company 24|
Questions?

McKinsey & Company 25|
Thank YouClaudia_Suessmuth-Dyckerhoff @ McKinsey.com
Alexander_Ng @ McKinsey.com