STRIPPING POLAROGRAPHY AND THE REDUCTION...
12
Anolytico Chimico Acto, 113 (1980) 79-90 0 Elsevier Scientific Publishing Company, Amsterdam - Printed in The Netherlands STRIPPING POLAROGRAPHY AND THE REDUCTION OF COPPER( II) IN SEA WATER AT THE HANGING MERCURY DROP ELECTRODE ALBERT0 ZIRINO* and S. P. KOUNAVES Chemistry and Environmental Sciences Group, Naval Ocean Systems Center, Code 5132 Son Diego. California 92152 (U.S.A.) (Received 18th July 1979) SUMMARY An approximate but general theoretical treatment for reversible and irreversible stripping polarographic systems is presented. The treatment is based on the development of an average current (i), which at plating times exceeding 15 s. is analogous to the instantaneous current in d-c. polarography. Plots of i vs. (E - E*) are generated for reversible and irre- versible waves and are discussed for the reduction of copper(H) in sea water asan example. From stripping polarography and anodic stripping voltammetry, this work indicates that the overall reduction of copper(H) at the natural pH is kinetically hindered and thus is Wreversible”. The reversibility and the determination of copper in sea water by a.s.v. can be improved by acidification and/or by the addition of ethylenediamine. In recent years much of the work concerned with the speciation of trace metals in natural waters has been done using anodic stripping voltammetry (a.s.v.). This work has primarily progressed in two directions: studies of the shift in trace metal peak potentials with changing concentrations of ligands [l-5] and studies of changes in metal peak height or peak area under differing experimental conditions.Variants of the second approach include pII titrations [ 5-71 and compleximetric titrations [8] in which natural or added ligands are quantitatively titrated with metal ions or, alternatively, metal ions are titrated with ligands [8-lo]. In this technique, the electrolysis potential is set at a value which presumably discriminates between the “free” (i.e., rapidly reducible) metal and the complexed metal, which is reduced at a much slower rate. This approach has been used extensively to estimate the “complexation capacity” of natural waters. Techniques based on the shift of the peak potential depend on the degree of reactivity of the oxidized metal with the ligand of interest in the reaction layer. They can describe the species undergoing reduction, i.e., the speciation in the natural medium, only indirectly and by assuming reversibility. Thus, they are more suitable for model studies (1, ll] and for t-he determination of stability constants in known media [Z, 3, 121 than for direct determination of natural speciation. On the other hand, methods dependent on peak height or peak area can give direct information on the natural species as long as a
Transcript of STRIPPING POLAROGRAPHY AND THE REDUCTION...

Anolytico Chimico Acto, 113 (1980) 79-90 0 Elsevier Scientific Publishing Company, Amsterdam - Printed in The Netherlands
STRIPPING POLAROGRAPHY AND THE REDUCTION OF COPPER( II) IN SEA WATER AT THE HANGING MERCURY DROP ELECTRODE
ALBERT0 ZIRINO* and S. P. KOUNAVES
Chemistry and Environmental Sciences Group, Naval Ocean Systems Center, Code 5132 Son Diego. California 92152 (U.S.A.)
(Received 18th July 1979)
SUMMARY
An approximate but general theoretical treatment for reversible and irreversible stripping polarographic systems is presented. The treatment is based on the development of an average current (i), which at plating times exceeding 15 s. is analogous to the instantaneous current in d-c. polarography. Plots of i vs. (E - E*) are generated for reversible and irre- versible waves and are discussed for the reduction of copper(H) in sea water asan example. From stripping polarography and anodic stripping voltammetry, this work indicates that the overall reduction of copper(H) at the natural pH is kinetically hindered and thus is Wreversible”. The reversibility and the determination of copper in sea water by a.s.v. can be improved by acidification and/or by the addition of ethylenediamine.
In recent years much of the work concerned with the speciation of trace metals in natural waters has been done using anodic stripping voltammetry (a.s.v.). This work has primarily progressed in two directions: studies of the shift in trace metal peak potentials with changing concentrations of ligands [l-5] and studies of changes in metal peak height or peak area under differing experimental conditions.Variants of the second approach include pII titrations [ 5-71 and compleximetric titrations [8] in which natural or added ligands are quantitatively titrated with metal ions or, alternatively, metal ions are titrated with ligands [8-lo]. In this technique, the electrolysis potential is set at a value which presumably discriminates between the “free” (i.e., rapidly reducible) metal and the complexed metal, which is reduced at a much slower rate. This approach has been used extensively to estimate the “complexation capacity” of natural waters.
Techniques based on the shift of the peak potential depend on the degree of reactivity of the oxidized metal with the ligand of interest in the reaction layer. They can describe the species undergoing reduction, i.e., the speciation in the natural medium, only indirectly and by assuming reversibility. Thus, they are more suitable for model studies (1, ll] and for t-he determination of stability constants in known media [Z, 3, 121 than for direct determination of natural speciation. On the other hand, methods dependent on peak height or peak area can give direct information on the natural species as long as a

80
direct proportionality exists between the quantity of metal reduced during electrolysis and the metal oxidized from the amalgam. One relatively novel form of a_s.v. which gives information about the species undergoing reduction is stripping polarography, sometimes called pseudopolarography [ 13,141.
In stripping polarography, peak heights or peak areas obtained by a.s.v. are plotted against the applied electrolysis potential. These plots have the sig- moidal shape of ordinary d-c. polarograms but without the residual current component, and present the possibility of extending existing polarographic methodology to trace metals at the part per billion (ppb) level. The shapes of the plots indicate the degree of reversibility of the species undergoing reduction and may be useful for their identification. The reduction of copper in sea water provides a good example of the usefulness of stripping polarography for these purposes. Figure 1 shows three plots of 6 ppb copper added to un- filtered sea water from San Diego Bay and analyzed under varying conditions. Each of the experimental points represents the copper peak current obtained bya.s.v. after a 5-min electrolysis at a hanging mercury drop electrode (HMDE). The plots obtained for copper at pH 8 (Fig. 1, curves a and b) feature broadly curving slopes, and no distinct limiting plateau is reached, even at the highest applied potential. The shapes of these “waves” indicate an irreversible reduc- tion. On the other hand, the reduction of copper at pH 3 is quasi-reversible (Fig. lc) with E;“14 - EC4 = 42 mV. These plots may be compared with the reduction of cadmium in sea water, which proceeds reversibly both at pH 3 and 8 as discussed by Gino and Kounaves [14) and Kounaves and Zirino [15]. This paper presents a more general treatment for reversible and irre- versible systems and examines some of the analytical implications of irrevcrs-
Fig. 1. Stripping polarographic plots of 6 ppb Cu in sea water (not to scale). (a) Raw sea water, pH 8; (b) u.v.+,xidized sea water, pH 8; (c) raw sea water, pH 3.

81
ibility. The reduction of copper in sea water is used to illustrate some of these points.
THEORY
The general equation for the instantaneous current resulting from the re- duction of a simple metal ion to a metal which in turn forms an amalgam with the HMDE is [16]
i = nFAk {Ci exp [~Y~F(RT)‘~ (E - EO)] - C,O exp [ 1 - crnF(RT)-’ (2 - E’)]}
(1)
where k is the formal rate constant for the reaction, E is the electrode poten- tial, E” is the standard potential for the amalgam electrode, C!j and c are the concentrations of simple metal ion and reduced (amalgamated) metal, A is the area of the electrode, Q is the transfer coefficient, and n, F, R and T have their usual meanings_
For a prolonged electrolysis time t, integration of expression (1) over the interval 0 =G X < t will yield q, the charged passed in the accumulation of reduced metal in the HMDE. If, for the moment, it is assumed that there are no losses in the electrode, then q will equal q’, the charge obtained from the integration of the a.s.v. peak. Rigorous integration of eqn. (1) is difficult, however, and will not be attempted here. Nevertheless, an analytically useful expression may be obtained in terms of the average current 5 which flows over the same time interval. From the mean value theorem, it can be shown that it = G i dt = q. Now, the peak current electrolysis potential relationship can be derived in terms of an average flu.. F, to the electrode since 7 = nFAF<. For a stirred solution, and assuming that the concentration of the simple ion does not change appreciably with time, the relationship between F, and the concentration of the simple ion in the bulk of solution can be given by the Nemst diffusion Iayer equation fi: = [C, - Cfo] D,/6,, where D, is the diffusion coefficient of the simple metal ion, 6, is the average thickness of the diffusion layer, C, is the concentration of the simple metal ion in the bulk solution.
Similarly, Zirino and Kounaves [ 141 have shown experimentally that the average concentration of the reduced metal at the surface of the electrode can be approximated by
e = 3it/8n nFr’ (2)
where r is radius of the HMDE.Although a strict interpretation of eqn. (2) yields a physical impossibility, C,O becomes a satisfactory approximation for c for electrolysis times longer than about 15 s [ 14 1. Expression (1) can now be rewritten in terms of the average quantities i; C!, and C,O, yielding
i = k {[C, - (i(G,/D,)/nFA)] exp [anF(RT)-* (E’ - EO)] - (37t/2r) CXP
[(l - a)nF(RT)-’ (E -E’)]} (3)

82
Expression (3) can also be rearranged to obtain an eq&ion which relates the average peak current directly to the concentration of the reactant species:
1 k exp [-anF(RT)-’ (E-E’)]
+ $ exp [nF(RT)-’ (E-E’)])
(4)
Figure 2 plots the average current occurring over the interval 0 < t < 1000, versus E -E” for various values of k. It can be seen that i behaves analogously to i in d-c. polarography and that stripping polarcigrams can be expected to broaden out and reach the limiting plateau less rapidly as the rate constant for the reaction diminishes. It is also evident from expression (4) that for any given E and t, the proportionality between i and C, is maintained regard- less of whether the reaction is reversible or irreversible_ Stirring (6, + 0) will yield increasingly larger currents, while i will decrease with smal!er values of k. At large overpotentials the second and third terms in the denominator will tend to zero and 7 --* nFA(D,/ti,)C, the limiting current at the experimentally chosen cell conditions.
In a manner similar to the above, the relationship between 7 and C,* for a reversible reaction is
$ exp [nF(RT)-’ (E - EO)]) (5)
This is the expression originally derived by Zirino and Kounaves [14], and it describes the familiar sigmoidal form of a reversible polarographic wave. As pointed out earlier [ 141, AT& for this function is a log-linear function of the electrolysis time t and’will vary as -(ln t) RZ’/nF, (EC, is used for the half-wave potential of a stripping polarographic wave while E,,* refers to the half-wave potential of a d-c. polarogram.)
moo; ._ _ __ _- _-.- _
F.E,(V) TlUC 1%)
Fig. 2. 7 plotted as a function of E - E, for various values of h and C, = 1 X lo-* M, o = 0.5, t = 1000 s, 6,/D, = 2.64 X 10’ cm s-‘. t = 0.046 cm.
Fig. 3. 7 plotted es a function of t at various over-potentials. Conditions: h > lo-‘; C, = 1 x lo-‘M, o = 0.5,6,/D, = 2.64 x 10’ cm s-‘, r = 0.046 an.

a3
For the tot&y irreversible reduction of the simple metal ion to an amal- gamated metal, eqn. (3) yields
1 + k exp [GF(RT)-’ (E -II”)] I (6)
Now, because the back-reaction occurs at a negligible rate, T is no longer dependent on the electrolysis time t, even at very low overvoltages. This dependence of Efn on electrolysis time may also be useful to characterize the degree of reversibility of the reduction. The slope of Ez2 vs. In t will always be RT/nF for a reversible reaction and something less than that for an irreversible reaction, and it will approach zero as the reaction approaches total irreversibility.
The average current i is also useful for calculating q, the charge passed in the reduction and amalgamation of the metal in the mercury drop, since q = it. This quantity can then be compared to q’, the charge obtained by integrating the area under the experimentally obtained a.s.v. peak. It also follows that when q is proportional to the peak current (ii,), then ia i,.
EXPERl?vlENTAL
Instrumentation and solutions All current-voltage measurements were made with a Princeton Applied
Research Corporation (PAR) Model 174 Polarographic Analyzer in conjunc- tion with a Hewlett-Packard Model 7034A x-y recorder. A PAR Model 315 Automated Electroanalysis Controller was used to automate the Model 174. pH was measured with a Coming No. 476055 combination microelectrode connected to an Orion Model 801 Research pH Meter. Stripping polarograms of copper-ethylenediamine, Cu(en),, in sea water were generated with a specially programmed Hewlett-Packard 21 MX minicomputer interfaced with a PAR 174 polarographic analyzer and a PAR electrolysis cell [ 151.
The electrolysis cell consisted of a PAR No. 9323 HMDE fitted into a PAR No. 9300 polarographic cell top. A PAR No. 3343 borosilicate glass polarographic cell bottom completed the cell. A vessel corresponding to the PAR cell bottom but machined from acrylic plastic was also used. Solutions were stirred with a l.lcm tefloncovered stirring bar coupled to a Sargent- Welch 600-rpm synchronous speed magnetic stirrer. A Beckman fiber-junction saturated calomel electrode (SCE) was placed in a PAR K65 reference elec- trode bridge tube with vycor tip to form a double-junction reference elec- trode. The outer junction was filled with sea water. A bare platinum wire served as the auxiliary electrode. All experiments were done at room temperature.
Solutions were made with reagent-grade salts. Pre-purified nitrogen and pre-purified nitrogen containing 300 ppm CO* were used to remove oxygen from all solutions. Additions of ethylenediamine (en) were made from a stock solution of 3 X IO-’ M en in distilled, de-ionized water. The pH of this solution was adjusted to 6.3 with hydrochloric acid; (Ultrex Grade, J. T. Baker and Co.).

84
Procedure Electrodes of suitable size were produced by turning the micrometer
capillary four divisions. Drops formed in this manner have a diameter of approximately 0.093 cm [ 141. New drops were used for each plating stripping cycle. An electrolysis potential of -1.0 V vs. SCE was selected for individual determinations by a-s-v. For stripping polarography, the electrolysis potentials were selected randomly from a list of those bracketing E”. In both cases, the electrolysis potential was applied for a preselected time t, during which the solution was stirred. Afterwards, stirring was ceased, the solution was allowed to come to rest for 30 s while maintaining the applied potential and then the metal was stripped out of the drop. Stripping was carried out at 5 mV s-’ either in the linear sweep (1.s.a.s.v.) or in the differential pulse (d.p.a.s.v.) mode; a 50-mV pulse was used in the latter case.
RESULTS AND DISCUSSION
Stripping polarography Inspection of Fig. 1 shows that the shapes of the stripping polarograms of
copper in San Diego Bay water are approximately comparable to the plots (Fig. 2) generated from the theory (eqns. 4-6) developed above. At pH 3 (Fig. 1, curve c) copper(H) is reduced quasi-reversibly and reaches a distinct limiting current plateau within 0.2 V of E;(S2. However, at the natural pH (Fig. 1, curve a) no well-defined limiting current plateau is reached within the range of applied potentials, indicating less reversibility and possible com- plexation by the natural organic ligands. Removal of the dissolved organic matter in the sample by oxidation with a high-energy mercury vapor lamp [17] does not alter markedly the shape of the curve (Fig. 1, curve b) strongly suggesting that the reduction of copper(I1) at pH 8 is hindered by the in- organic constituents of sea water. A more careful comparison of Fig. 1, curve a and Fig. 2 also shows that the experimental data do not fit the “theoretical” irreversible curve very well. This is because the theory has been developed for electron transfer reactions only, while the irreversibility of the copper(I1) reductions is probably caused by a more complex series of chemical steps occurring at the electrode surface. The magnitudes of the respective peak currents obtained at each potential also contain information about the re- duction. Highest currents occur at pH 3, where the reaction is most reversible and there is the least adsorption. On the other hand, the u.v.-oxidized sea water yields the smallest currents because the opportunity for adsorption of copper on hydrated iron and manganese oxides is the greatest in the organic-free matrix [ 181.
Et2 for the reduction of copper in sea water at pH 3 and t = 300 s is -0.275 V. If, for the moment, reversibility is assumed and the potential is corrected to t = 0, then E& = -0.20. Heyrovsky and Kuta [19] list E,,, for the reduction of Cu(1) to Cu(Hg) in 1 M KC1 as 4.23 V. Within the assumptions made, these two values can be considered the same. Thus, the

85
reduction of copper in acidified sea water may proceed in a manner similar to that in 1 M KCl. The chlorocuprate ion (CuCl,)’ -X is reduced in two steps: Cu(l1) + Cu(1) proceeds easily at any potential more negative than 0.00 V, while Cu(I) + Cu(Hg) occurs at approximately -0.2 V. However, it should be noted that the experimental value of E$, - Ez, = 42 mV lies between a single and double electron transfer. The irreversibility of the reduction of copper in sea water at pH 8 strongly suggests some mechanistic hindrance, either associated with the predominant form of copper in sea water, pre- sumably a hydroxide or a carbonate 111, 201, or with the chemical compo- sition of the electrical double layer, or both. The above observations are also in agreement with the findings of Odier and Plichon [26] who used a.c. polarography to study the speciation of copper in sea water. They found that the reduction of copper at the DME produced only one peak, corre- sponding to CuCl; + Cu(Hg) + 2 Cl-. In a similar manner these workers also found evidence for the existence in sea water of a [Cu(HCO,),OH]- complex.
Equations (4-6) also predict that at limiting potentials i/C, = k,, where k, is a constant, and that iP/C, = k,t, where k2 is also a constant and t is the electrolysis time. This is the basis for the use of a.s.v. in quantitative analysis, and the validity of the relationship for a.s.v.-measurable metals in many media is well established. Deviations from linearity have, in general, been ascribed to the presence of complexing agents in natural media [4, 7, 101.
Equations (4) and (5) also predict that at low overvoltages, i and thus i, vary markedly with electrolysis time and the degree of reversibility of the reaction_ Figure 3 shows the effect of the electrolysis time on 5 for a reversible reaction at a HMDE at low overpotentials. It can be seen that the influence of t on i becomes vanishingly small in all cases when the applied potential is 0.2 V more negative than E”. This situation includes most analytical appli- cations, and thus experimental plots of i, vs. t are generally shown to be linear.
The reduction of copper in sea water at pH 8 From the analytical point of view, the irreversibility of the reduction of
copper at pH 8 in sea water implies a loss of sensitivity_ Moreover, the analysis by standard addition is further complicated by adsorption of the standard on the cell walls and on surface-active particulates and colloids present in natural samples. For these reasons, copper in sea water is measured in acidic solutions almost universally. Nevertheless, the measurement of copper under natural conditions is important because any metal so determined represents the copper fraction in solution which is most available to marine organisms and is most toxic to marine algae [ 211. The behaviour of copper peak currents in filtered (0.22 pm), organic-free [17] sea water was studied at pH 8 and 2 by making successive copper additions to sea-water samples followed by analysis ofd.p.a.s.v. Figure 4 shows the results of several such sets of standard additions. At pH 8 and at low copper concentration, standard addition plots show a considerable degree of curvature, particularly just after the cell surface has
zo-
0 2 4 6 16
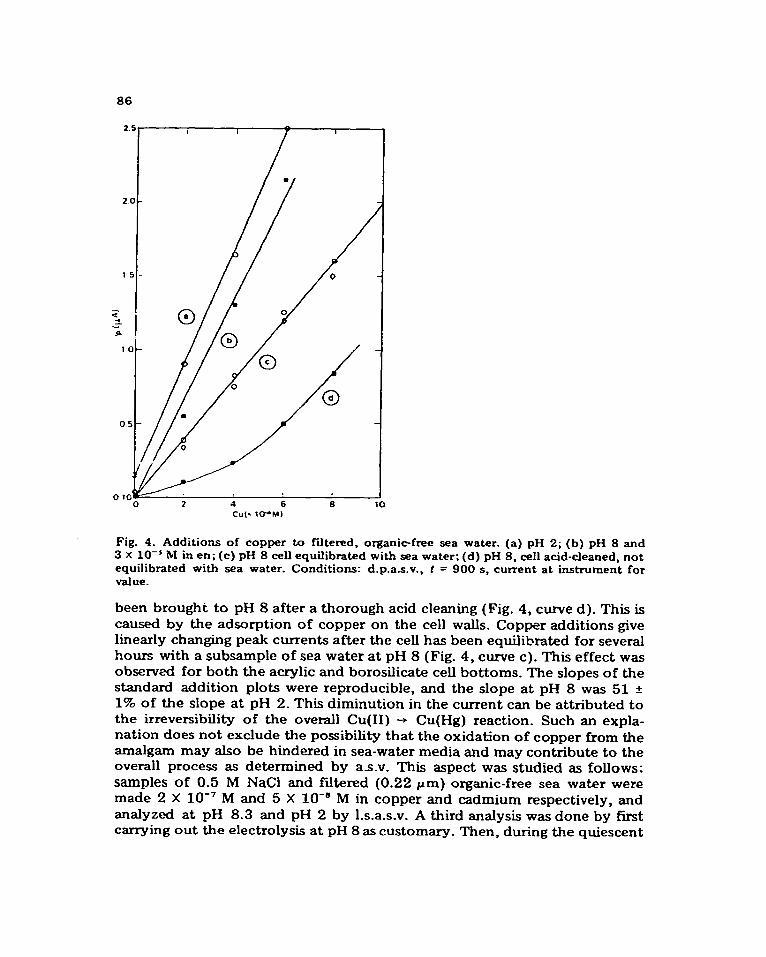
Fig. 4. Additions of copper to filtered, organic-free sea water- (a) pH 2; (b) pH 8 and 3 x lo-’ M in en; (c) pH 8 cell equilibrated with sea water; (d) pH 8, cell acid-cleaned, not equilibrated with sea water. Conditions: d.p.a.s.v., t = 900 s, current at instrument for value.
been brought to pH 8 after a thorough acid cleaning (Fig. 4, curve d). This is caused by the adsorption of copper on the cell walk. Copper additions give linearly changing peak currents after the cell has been equilibrated for several hours with a subsample of sea water at pH 8 (Fig. 4, curve c). This effect was observed for both the acrylic and borosihcate cell bottoms. The slopes of the standard addition plots were reproducible, and the slope at pH 8 was 51 f 1% of the slope at pH 2. This diminution in the current can be attributed to the irreversibility of the overall Cu(I1) -* Cu(Hg) reaction. Such an expla- nation does not exclude the possibility that the oxidation of copper from the amalgam may also be hindered in sea-water media and may contribute to the overall process as determined by as-v. This aspect was studied as follows: samples of 0.5 M NaCl and filtered (0.22 pm) organic-free sea water were made 2 X lo-’ M and 5 X lOba M in copper and cadmium respectively, and analyzed at pH 8.3 and pH 2 by 1.s.a.s.v. A third analysis was done by first carrying out the electrolysis at pH 8 as customary. Then, during the quiescent

87
period, acid was added to bring the pH to 2, stirring was briefly resumed, the solution was atlowed to come to rest once more and the amalgam was stripped as previously. This procedure is essentially one of medium exchange f 22,231 where the reduction is carried out at pH 8 and the stripping occurs at pH 2. The number of coulombs transferred in the stripping step were calculated from the peak areas. The results of this experiment are shown in Table 1, which gives the sea-water data along with the values obtained in the NaCl medium; q’,. the charge obtained by plating and stripping cadmium in N&I, is 0.85 + 0.05 PC. Assuming that q’ = q, the charge transferred during plating, a value for SO/.& of 2.77 X lo* cm s-i can be calculated. This value can be compared to 2.64 X lo2 cm s-l obtained earlier for cadmium in 1 M KCl, using a cell with similar geometry and stirring conditions f14]. Under the same experimental conditions, q’ for 2 X 10S7 M copper is oniy 1.00 F 0.04 PC, despite the fact that copper is four times more concentrated than cadmium in solution. Because cadmium is known not to interfere with copper [24], this poor recovery can be attributed to the irreversibility of copper reduction, t.o possible losses of copper within the drop, and to the fact that Cu(I-Ig) is oxidized primarily to copper(I) in chloride media [ 25 1.
The charges obtained for cadmium and copper in the sea-water samples at pH 8 are slightly lower than those obtained in NaCl. The loss is greater for copper than for cadmium, confirming that the reduction of copper is hindered more in sea water at the natural pH than in NaCI. Electrolysis at pH 8 and stripping at pH 2 produces no significant difference over electrolysis and stripping at pH 8. This supports the stripping polarographic data suggesting that the slow step in the a.s.v. analysis of copper occurs on reduction. A complete as-v. operation at pH 2 does not increase the yield of cadmium significantly but increases copper by 58%. This is in reasonable agreement with the results obtained earlier from the standard addition plots.
TABLE 1
Peak potenthds (I.$,) and peak charge (q’) for 2.0 x 1W” M Cd and 5.0 X lo-* M Cu in 0.7 M NaCl and scn water by 1.s.n.s.v.
_ _--_... .___ - .--
Solution PH E, Cd E, Cu Q’ Cd Q’ CU
Plate strip (mv) (mv) (G) (PC)
0.7 M NaCl 8.2 8.2 -0.630 -0.150 0.85 0.96 8.2 8.2 -0.625 -0.150 0.89 1.03 8.2 8.2 -0.620 -0*150 0.85 0.96 6.3 6.3 -0.625 -0.150 oJ39 1.04 6.3 6.3 -0.625 -0.150 0.75 1.01 8.3 8.3 -0.610 -0.125 0.72 0.76
Organic&x sea water 8.3 2.0 -0.605 -0.115 0.74 0.82 2.0 2.0 -0.610 -0.125 0.74 1.20

88
Improving the reversibility of the reduction of copper in sea water In general, previous workers have chosen to improve the reversibility of
the a.s,v. determination of copper in sea water by lowering the pH and by adding substantial quantities of an additional electrolyte, usually sodium acetate. The latter carries the risk of contaminating natural samples with copper in the electrolyte. Thus the use of ethylenediamine (en) as a reagent was explored to facilitate the reduction of copper in sea water. The addition of en during analysis has two virtues: Cu(en)l* is reduced reversibly in some media [‘I] and en effectively scavenges copper(I1) off the cell walls and off particulates. From stripping polarographic plots, the reduction of Cu(en)i* in sea water was found to be irreversible at small concentrations of en but that a distinct limiting plateau was reached within 0.2 V of E& Thus, en was effec- tive in improving the reduction of copper in sea water. This can be seen in Fig. 4 (curve b), which shows a standard addition plot of copper in sea water at pH 8 made 3 X lo-’ M in en. Similarly, the use of en was also explored as a method for determining ultra-trace levels of copper at the normal pH of sea water: 100 ~1 of 3 X 10m2 M en was added to 100 ml of raw sea water and allowed to equilibrate for 1 h, and the sample was then analyzed as usual by d.p.a.s.v.; standard additions were then made, each of which increased the concentration of copper(I1) in the sample by 1.8 X 10m9 M. The resulting
r
b
I I 1 I
0.2 0.4 0.6 0.8 Cdx 10-M 1
30
10
IO
1 I
Fig. 5. D.p.as.v. measurement of copper addLions to sea water. Conditions: t = 900 s, sweep 5 mV s-‘, pulse 50 mV. (a) raw sea water, pH 8; (b) raw sea water, pH 8, mad6 3 x lo-’ M in en; (v) plus successive additions of copper.

89
current-voltage plots are reproduced in Fig. 5. With en, the standard addition plot was linear at a concentration level where copper(I1) would have been readily adsorbed by the cell and sample surfaces. This experiment also suggests than en may be used in analyses of sea water for natural copper which is readily complexed by this reagent.
Conclusion Stripping polarography is a useful complement to a.s.v. because it gives
information about the substance undergoing reduction as well as about the mechanism of the reduction. This information can then be applied directly to the study of electroactive species in natural media which are measurable by as-v. This work indicates that the reduction of copper(H) in sea water at the HMDE at natural pH is irreversible and that the irreversibility can be lessened by acidification or by complexation with ethylenediamine. These treatments also prevent the adsorption of copper(H) on cell walls and natural particulate matter and improve the analytical sensitivity of the a-s-v. analysis for copper. Current speciation models suggest that the overall reduction of copper(H) in sea water at pH 8 at the HMDE is kinetically hindered because (1) copper(H) at pH 8 forms a hydroxide or carbonate or hydroxycarbonate complex, or (2) hydrogencarbonate and carbonate in the reaction layer im- pede the reduction, or (3) both occur.
We wish to thank S. Yamamoto and E. P. Cooper for their continuing support of this effort. We are also indebted to Jacques Buffle for many con- structive suggestions. Work was funded by the Naval Ocean Systems Center IR/IED program and by the Office of Naval Research under contract NR 083-301.
REFERENCES
1 A. Zirino and M. L. Healy. Limnol. Oceanogr., 15 (1970) 956. 2 W. L. Bradford, Limnol. Oceanogr., 18 (1973) 757. 3 H. Bilinski, R. Huston and W. Stumm, Anal. Chim. Acta, 84 (1976) 157. 4 T. A. O’Shea and K. H. Mancy, AnJ. Chem., 48 (1976) 1603. 5 J. C. Duinker and C. J. M. Kramer, Mar. Chem., 5 (1977) 207. 6 A. Piro, M. Bernhard, M. Bran& and M. Verzi, in Radioactive Contamination of the
Marine Environment, Proc. Symp., Seattle, July 1972, IAEA edn., IAEA, Vienna, pp. 287-304.
7 R. Ernst, H. E. Allen and K. H. Mancy, Water Res., 9 (1975) 969. 8 M. S. Shuman and G. P. Woodward, Anal. Chem., 45 (1973) 2032. 9 Y. K. Chau and K. LumShueChau, Water Res., 8 (1974) 383.
10 T. M. Florence and G. B. Batley, J. Electroanal. Chem., 75 (1977) 791. 11 A. Zirino and S. Yamamoto, Limnol. Oceanogr., 17 (1972) 661. 12 W. Stumm and H. Bilinski, in Advances in Water Pollution Research, 6th International
Conference, Jerudcm, June 8-23,1972, Pergamon, Oxford, 1973, p_ 39. 13 S. Bubic and hi. Branica. Thalassia Jugosl., 9 (1973) 47. 14 A. Zirino and S. P. Kounaves, Anal. Chem., 49 (1977) 56 (correction, 51 (1979) 592). 15 S. P. Kounaves and A. Zirino, Anal. Chim. Acta, 109 (1979) 327.

90
16 P. Delahay, New Instrumental Methods in Electrochemistry, Interscience, New York, 1954. p. 437.
17 F. A. J. Armstrong, P. M. Wiiiiams and J. D. H. Strickland, Nature, 211 (1966) 481. 18 J. Vuceta and J. J. Mcrgan, Environ. Sci. Technol., in press. 19 J. Heyrovsky and J. Kuti, Principles of Poiarography, Academic Press, New York,
1966, p. 581. 20 D. R. Kester, personal communication. 21 W. Sunda and R. R. L. Guiliard, J. Mar. Res., 34 (1976) 511. 22 X Ariel, V. Eisner and S. Gottesfeld, J. Electroanal. Chem.. 5 (1963) 362. 23 L. Zieglerova, K. Stulik and J. Doleaai, Taianta, 18 (1971) 603. 24 J. D. Smith and J. D. Redmond, J. Electroanai. Chem., 33 (1972) 169. 25 M. J. Pinchin and J. Newham, Anal. Chim. Acta, 90 (1977) 91. 26 M. Odier and V. Plichon, Anal. Chim. Acta, 55 (1971) 209. 27 L. Meites, Polarographic Techniques, 2nd edn., Interscience, New York, 1965.