Striation Counting (JFAP)
18
TECHNICAL ARTICLE—PEER-REVIEWED Counting on Fatigue: Striations and Their Measure P. H. DeVries • K. T. Ruth • D. P. Dennies Submitted: 8 September 2009 / Published online: 23 February 2010 Ó ASM International 2010 Abstract Fatigue has been the subject of innumerable books, papers, and studies since the late 1800s and con- tinues to be a major factor in component failure with an estimated 90% of all mechanical failures being attributed to fatigue (Dieter, Mechanical metallurgy, 1976). The classic fatigue ‘‘thumbnail’’ often visible to the naked eye may allege fatigue, but microscopic striations—tiny ridges that bear immutable witness to cyclical loading—pronounce the verdict. As such, counting striations should provide the analyst with valuable information regarding the loading regimen, the time to failure, and insight into events that gave birth to fracture. This paper presents both pros and cons of striation counting and discusses striation count accuracy. It also presents practical techniques for use in fatigue striation counting based on laboratory experience and observation. Keywords Crack growth rate Fatigue analysis Fatigue crack growth Fatigue cracking Fatigue failure Fatigue striations Introduction Fatigue is the term given to the time-dependant fracture growth resulting from repeated or cyclical tensile stress. Since fatigue is a function of local applied stress levels, crack initiation and growth can often occur at loads con- sidered safe for the equipment or component. Local stress levels can be readily influenced by the presence of notches or ‘‘stress risers’’ at sharp geometric contours, as the result of poor machining practices, or due to service-induced damage. Fatigue can also initiate from crack precursors such as grinding quench cracks, corrosion pits, or stress corrosion cracking [1]. Taking a Crack at Fatigue Most failure analysts are familiar with the classic fatigue ‘‘thumbnail’’ (Fig. 1) often evident on a fatigue fracture face. Other fatigue features (e.g., flat fracture morphology or multiple initiation sites with stepped fracture features) may be so prominent that the analyst may make a confident failure mode diagnosis without further inspection. How- ever, absolute confirmation of fatigue comes with positive identification of striations—those tiny ridges that bear immutable witness to cyclical loading (Fig. 2). Down for the Count From an engineering standpoint, fatigue exhibits no notable bulk ductility (plastic deformation), thus it can often propagate with little notice until catastrophic failure occurs. Detecting, assessing, and preventing fatigue failure are outside the scope of this paper; however, once failure has occurred, significant knowledge about the failure may be gained from fracture surface evaluation. Since fatigue is brought about by cyclical loading, it follows that counting striations may provide valuable information that could be used to assist in design life cal- culations or risk mitigation. Evaluating striations can help determine the type of loading regime experienced by the P. H. DeVries (&) K. T. Ruth The Boeing Company, 5301 Bolsa Ave., MC H021-F116, Huntington Beach, CA 92647-2099, USA e-mail: [email protected]; [email protected] D. P. Dennies The Boeing Company, 5301 Bolsa Ave., MC H019-F781, Huntington Beach, CA 92647-2099, USA 123 J Fail. Anal. and Preven. (2010) 10:120–137 DOI 10.1007/s11668-009-9320-4
-
Upload
paul-devries -
Category
Documents
-
view
64 -
download
1
Transcript of Striation Counting (JFAP)
TECHNICAL ARTICLE—PEER-REVIEWED
Counting on Fatigue: Striations and Their Measure
P. H. DeVries • K. T. Ruth • D. P. Dennies
Submitted: 8 September 2009 / Published online: 23 February 2010
� ASM International 2010
Abstract Fatigue has been the subject of innumerable
books, papers, and studies since the late 1800s and con-
tinues to be a major factor in component failure with an
estimated 90% of all mechanical failures being attributed to
fatigue (Dieter, Mechanical metallurgy, 1976). The classic
fatigue ‘‘thumbnail’’ often visible to the naked eye may
allege fatigue, but microscopic striations—tiny ridges that
bear immutable witness to cyclical loading—pronounce the
verdict. As such, counting striations should provide the
analyst with valuable information regarding the loading
regimen, the time to failure, and insight into events that
gave birth to fracture. This paper presents both pros and
cons of striation counting and discusses striation count
accuracy. It also presents practical techniques for use in
fatigue striation counting based on laboratory experience
and observation.
Keywords Crack growth rate � Fatigue analysis �Fatigue crack growth � Fatigue cracking � Fatigue failure �Fatigue striations
Introduction
Fatigue is the term given to the time-dependant fracture
growth resulting from repeated or cyclical tensile stress.
Since fatigue is a function of local applied stress levels,
crack initiation and growth can often occur at loads con-
sidered safe for the equipment or component. Local stress
levels can be readily influenced by the presence of notches
or ‘‘stress risers’’ at sharp geometric contours, as the result
of poor machining practices, or due to service-induced
damage. Fatigue can also initiate from crack precursors
such as grinding quench cracks, corrosion pits, or stress
corrosion cracking [1].
Taking a Crack at Fatigue
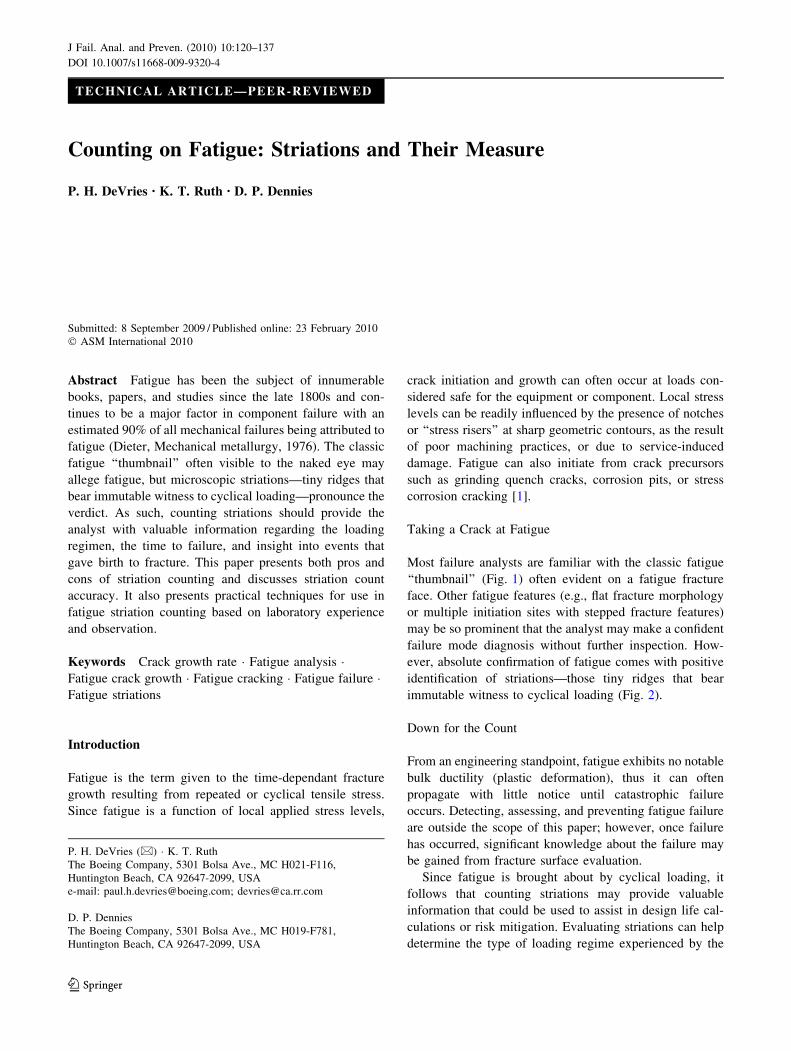
Most failure analysts are familiar with the classic fatigue
‘‘thumbnail’’ (Fig. 1) often evident on a fatigue fracture
face. Other fatigue features (e.g., flat fracture morphology
or multiple initiation sites with stepped fracture features)
may be so prominent that the analyst may make a confident
failure mode diagnosis without further inspection. How-
ever, absolute confirmation of fatigue comes with positive
identification of striations—those tiny ridges that bear
immutable witness to cyclical loading (Fig. 2).
Down for the Count
From an engineering standpoint, fatigue exhibits no notable
bulk ductility (plastic deformation), thus it can often
propagate with little notice until catastrophic failure
occurs. Detecting, assessing, and preventing fatigue failure
are outside the scope of this paper; however, once failure
has occurred, significant knowledge about the failure may
be gained from fracture surface evaluation.
Since fatigue is brought about by cyclical loading, it
follows that counting striations may provide valuable
information that could be used to assist in design life cal-
culations or risk mitigation. Evaluating striations can help
determine the type of loading regime experienced by the
P. H. DeVries (&) � K. T. Ruth
The Boeing Company, 5301 Bolsa Ave., MC H021-F116,
Huntington Beach, CA 92647-2099, USA
e-mail: [email protected]; [email protected]
D. P. Dennies
The Boeing Company, 5301 Bolsa Ave., MC H019-F781,
Huntington Beach, CA 92647-2099, USA
123
J Fail. Anal. and Preven. (2010) 10:120–137
DOI 10.1007/s11668-009-9320-4
failed component, provide insight into the time frame or
point in process at which failure initiated, or assist in
verifying the accuracy of warranty or injury claims. Having
touted the usefulness of striation counting, just how is this
information gathered and how accurate is it?
Bumps Along the Way: Understanding Striations
Setting the Stage
Before discussing striation counting, it is useful to review
the various stages of fatigue. Fatigue is caused by localized
cyclic plastic deformation [2, p. 242], and the resulting
failure is typically described as occurring in three stages
[2, p. 250].
Stage I: Initiation
Stage I fatigue can comprise over 90% of the total number
of cycles applied. During Stage I fatigue, localized plastic
slip produces intruding and extruding slip steps (Fig. 3) up
to several grains deep. As the number of cycles increases,
the number of slip steps increases forming stress risers
from which microcracking can initiate. These cracks are
essentially featureless and oriented 45� to the primary
tensile load. Multiple slip steps regions can form simulta-
neously, thus fatigue cracks will often nucleate at a number
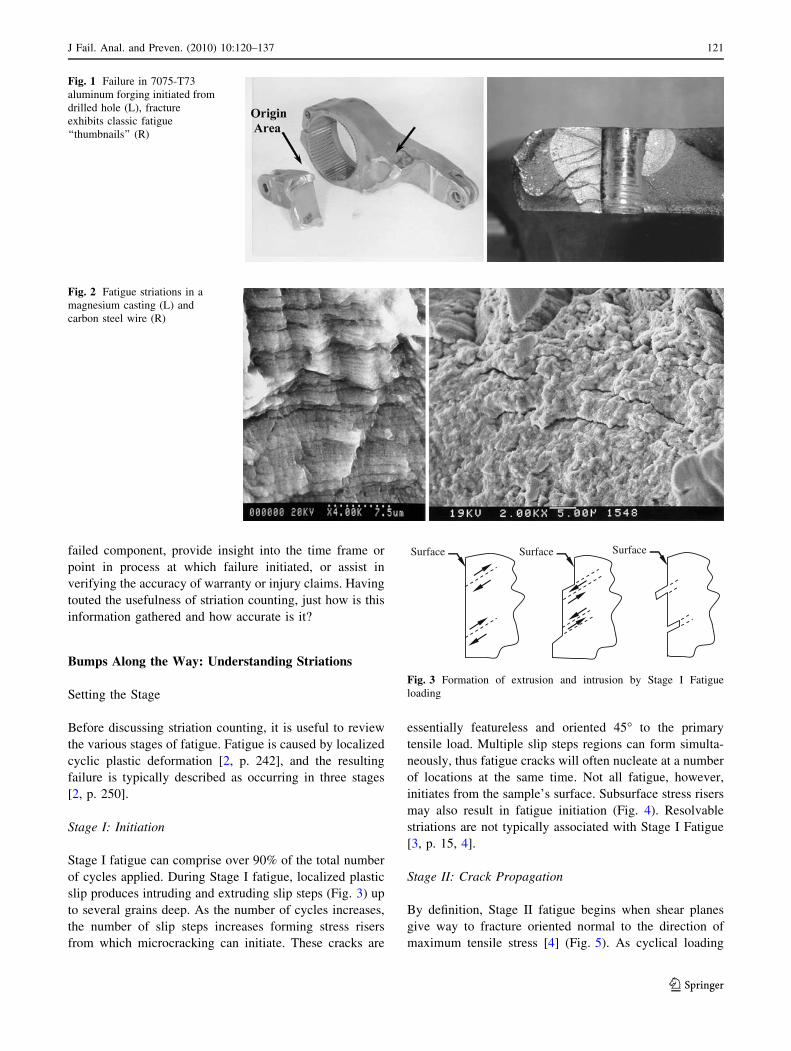
of locations at the same time. Not all fatigue, however,
initiates from the sample’s surface. Subsurface stress risers
may also result in fatigue initiation (Fig. 4). Resolvable
striations are not typically associated with Stage I Fatigue
[3, p. 15, 4].
Stage II: Crack Propagation
By definition, Stage II fatigue begins when shear planes
give way to fracture oriented normal to the direction of
maximum tensile stress [4] (Fig. 5). As cyclical loading
Fig. 1 Failure in 7075-T73
aluminum forging initiated from
drilled hole (L), fracture
exhibits classic fatigue
‘‘thumbnails’’ (R)
Fig. 2 Fatigue striations in a
magnesium casting (L) and
carbon steel wire (R)
Surface Surface Surface
Fig. 3 Formation of extrusion and intrusion by Stage I Fatigue
loading
J Fail. Anal. and Preven. (2010) 10:120–137 121
123
continues, one or more of the microcracks will reach crit-
ical flaw size and begin to propagate under cyclical
loading. Eventually, multiple initiation sites will begin to
join together producing plateaus or ridges (sometimes
called ratchet marks) to form a common fracture (Figs. 6
and 7). Crack propagation continues as a successive series
of crack fronts until the remaining uncracked cross section
becomes too weak to support the imposed loads and final
rapid fracture occurs.
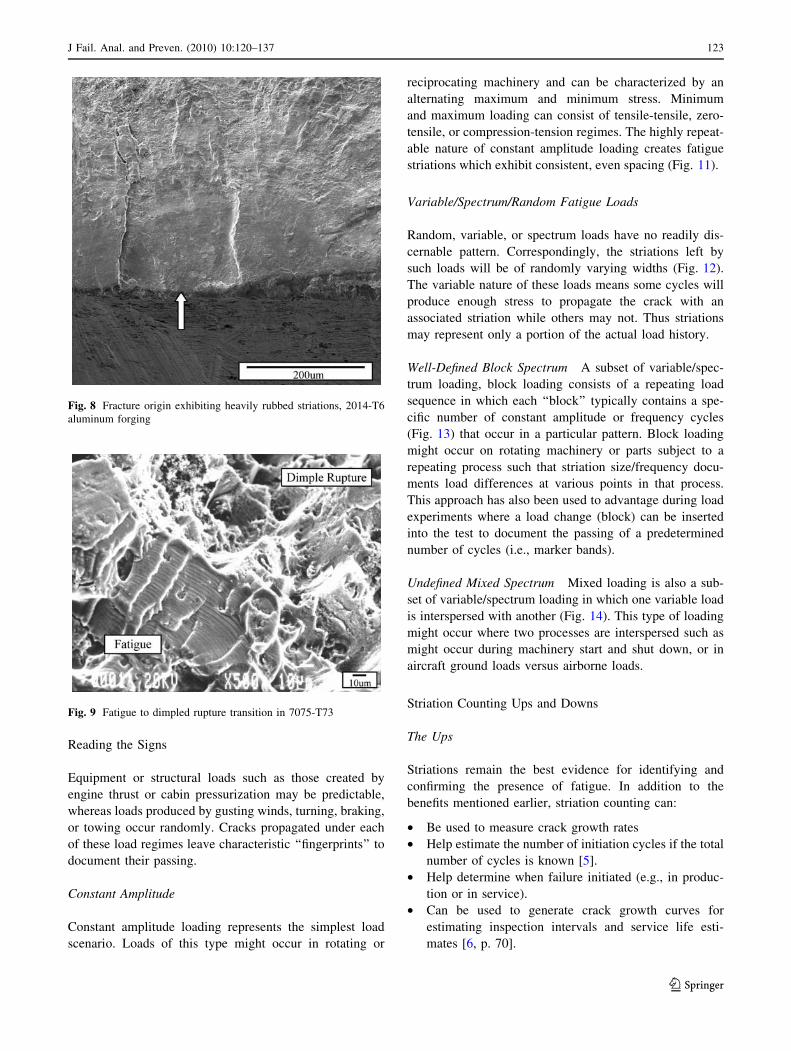
While Stage I may account for the majority of fatigue
life, striations (and therefore striation counting) are limited
to Stage II crack propagation. Since Stage I is typically
small and most fracture details within approximately
0.010 in. of the origin are often too rubbed, oxidized, and/or
corroded to discern clearly (Fig. 8), the analyst will usually
extrapolate from the closest known area of discernable
striations back to the origin assuming constant striation
spacing. Since striation spacing typically gets smaller closer
the origin, this assumption can lead to an undercount in the
number of striations estimated in crack propagation.
Stage III: Fracture
Stage III occurs during the last fatigue cycle when tensile
stress exceeds the load carrying capacity of the remaining
material section and overload fracture ensues (Figs. 9, 10).
Overload fracture will be ductile, brittle, or a combination
of both [4].
Fig. 4 Fatigue rupture
initiating at a subsurface void,
300 M
Stage 1 Stage 2 Stage 3
Initiation Propagation Overload
Load
Load
Fig. 5 The stages of fatigue
FractureSurface
MaterialSurface
Fig. 6 Plateaus or ridges produced between multiple fatigue fracture
initiation sites
Fig. 7 Micrograph of multiple
fatigue initiation sites in
3Al–2.5V titanium. Right hand
edge represents thin-wall
fatigue fracture
122 J Fail. Anal. and Preven. (2010) 10:120–137
123
Reading the Signs
Equipment or structural loads such as those created by
engine thrust or cabin pressurization may be predictable,
whereas loads produced by gusting winds, turning, braking,
or towing occur randomly. Cracks propagated under each
of these load regimes leave characteristic ‘‘fingerprints’’ to
document their passing.
Constant Amplitude
Constant amplitude loading represents the simplest load
scenario. Loads of this type might occur in rotating or
reciprocating machinery and can be characterized by an
alternating maximum and minimum stress. Minimum
and maximum loading can consist of tensile-tensile, zero-
tensile, or compression-tension regimes. The highly repeat-
able nature of constant amplitude loading creates fatigue
striations which exhibit consistent, even spacing (Fig. 11).
Variable/Spectrum/Random Fatigue Loads
Random, variable, or spectrum loads have no readily dis-
cernable pattern. Correspondingly, the striations left by
such loads will be of randomly varying widths (Fig. 12).
The variable nature of these loads means some cycles will
produce enough stress to propagate the crack with an
associated striation while others may not. Thus striations
may represent only a portion of the actual load history.
Well-Defined Block Spectrum A subset of variable/spec-
trum loading, block loading consists of a repeating load
sequence in which each ‘‘block’’ typically contains a spe-
cific number of constant amplitude or frequency cycles
(Fig. 13) that occur in a particular pattern. Block loading
might occur on rotating machinery or parts subject to a
repeating process such that striation size/frequency docu-
ments load differences at various points in that process.
This approach has also been used to advantage during load
experiments where a load change (block) can be inserted
into the test to document the passing of a predetermined
number of cycles (i.e., marker bands).
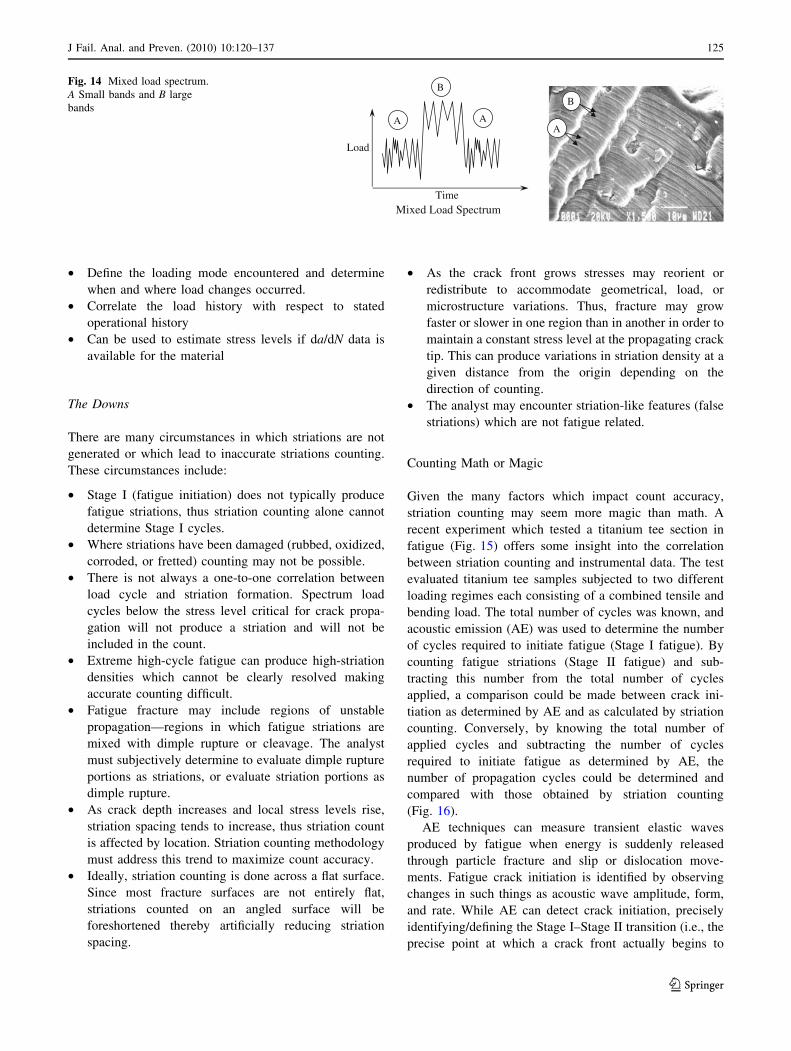
Undefined Mixed Spectrum Mixed loading is also a sub-
set of variable/spectrum loading in which one variable load
is interspersed with another (Fig. 14). This type of loading
might occur where two processes are interspersed such as
might occur during machinery start and shut down, or in
aircraft ground loads versus airborne loads.
Striation Counting Ups and Downs
The Ups
Striations remain the best evidence for identifying and
confirming the presence of fatigue. In addition to the
benefits mentioned earlier, striation counting can:
• Be used to measure crack growth rates
• Help estimate the number of initiation cycles if the total
number of cycles is known [5].
• Help determine when failure initiated (e.g., in produc-
tion or in service).
• Can be used to generate crack growth curves for
estimating inspection intervals and service life esti-
mates [6, p. 70].
Fig. 8 Fracture origin exhibiting heavily rubbed striations, 2014-T6
aluminum forging
Fig. 9 Fatigue to dimpled rupture transition in 7075-T73
J Fail. Anal. and Preven. (2010) 10:120–137 123
123
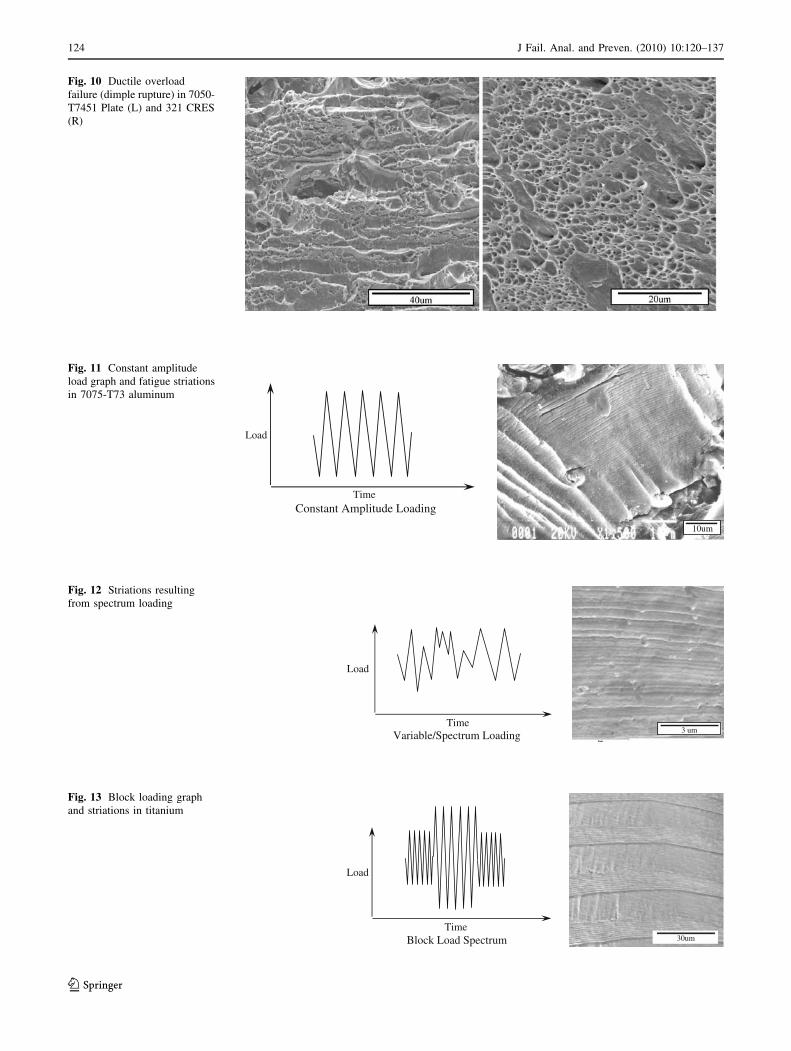
Fig. 10 Ductile overload
failure (dimple rupture) in 7050-
T7451 Plate (L) and 321 CRES
(R)
Constant Amplitude Loading
Load
Time
10um
Fig. 11 Constant amplitude
load graph and fatigue striations
in 7075-T73 aluminum
Variable/Spectrum Loading
Load
Time 3 um
Fig. 12 Striations resulting
from spectrum loading
Block Load Spectrum
Load
Time 30um
Fig. 13 Block loading graph
and striations in titanium
124 J Fail. Anal. and Preven. (2010) 10:120–137
123
• Define the loading mode encountered and determine
when and where load changes occurred.
• Correlate the load history with respect to stated
operational history
• Can be used to estimate stress levels if da/dN data is
available for the material
The Downs
There are many circumstances in which striations are not
generated or which lead to inaccurate striations counting.
These circumstances include:
• Stage I (fatigue initiation) does not typically produce
fatigue striations, thus striation counting alone cannot
determine Stage I cycles.
• Where striations have been damaged (rubbed, oxidized,
corroded, or fretted) counting may not be possible.
• There is not always a one-to-one correlation between
load cycle and striation formation. Spectrum load
cycles below the stress level critical for crack propa-
gation will not produce a striation and will not be
included in the count.
• Extreme high-cycle fatigue can produce high-striation
densities which cannot be clearly resolved making
accurate counting difficult.
• Fatigue fracture may include regions of unstable
propagation—regions in which fatigue striations are
mixed with dimple rupture or cleavage. The analyst
must subjectively determine to evaluate dimple rupture
portions as striations, or evaluate striation portions as
dimple rupture.
• As crack depth increases and local stress levels rise,
striation spacing tends to increase, thus striation count
is affected by location. Striation counting methodology
must address this trend to maximize count accuracy.
• Ideally, striation counting is done across a flat surface.
Since most fracture surfaces are not entirely flat,
striations counted on an angled surface will be
foreshortened thereby artificially reducing striation
spacing.
• As the crack front grows stresses may reorient or
redistribute to accommodate geometrical, load, or
microstructure variations. Thus, fracture may grow
faster or slower in one region than in another in order to
maintain a constant stress level at the propagating crack
tip. This can produce variations in striation density at a
given distance from the origin depending on the
direction of counting.
• The analyst may encounter striation-like features (false
striations) which are not fatigue related.
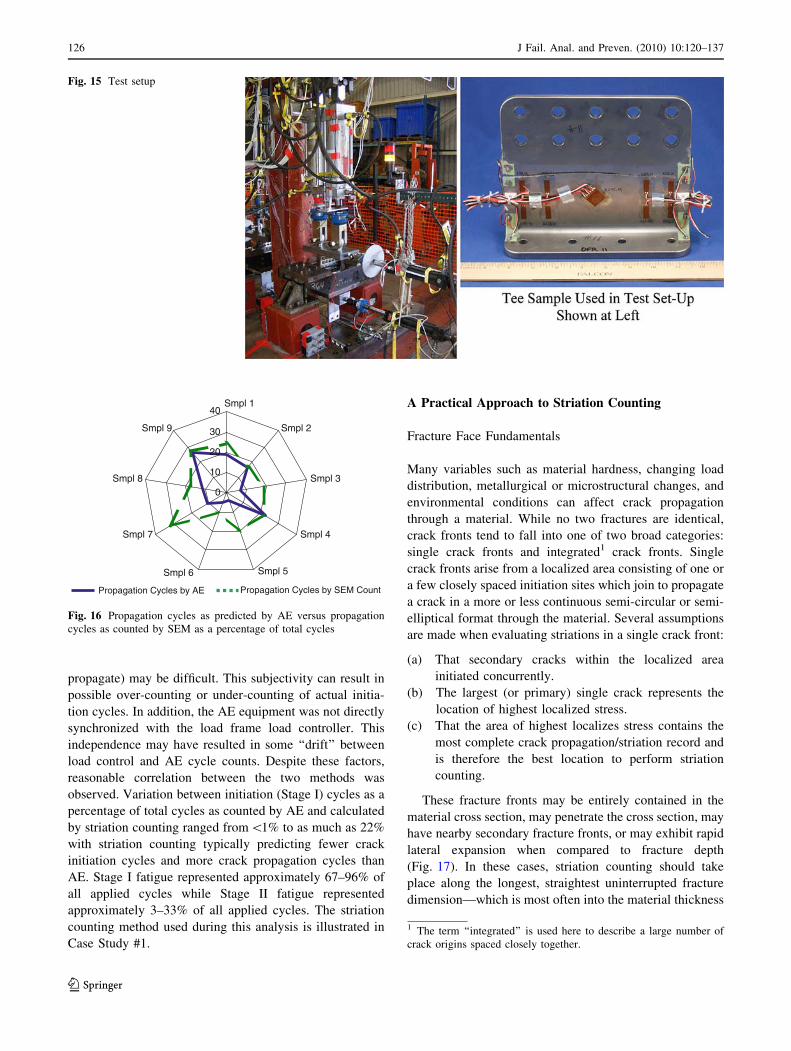
Counting Math or Magic
Given the many factors which impact count accuracy,
striation counting may seem more magic than math. A
recent experiment which tested a titanium tee section in
fatigue (Fig. 15) offers some insight into the correlation
between striation counting and instrumental data. The test
evaluated titanium tee samples subjected to two different
loading regimes each consisting of a combined tensile and
bending load. The total number of cycles was known, and
acoustic emission (AE) was used to determine the number
of cycles required to initiate fatigue (Stage I fatigue). By
counting fatigue striations (Stage II fatigue) and sub-
tracting this number from the total number of cycles
applied, a comparison could be made between crack ini-
tiation as determined by AE and as calculated by striation
counting. Conversely, by knowing the total number of
applied cycles and subtracting the number of cycles
required to initiate fatigue as determined by AE, the
number of propagation cycles could be determined and
compared with those obtained by striation counting
(Fig. 16).
AE techniques can measure transient elastic waves
produced by fatigue when energy is suddenly released
through particle fracture and slip or dislocation move-
ments. Fatigue crack initiation is identified by observing
changes in such things as acoustic wave amplitude, form,
and rate. While AE can detect crack initiation, precisely
identifying/defining the Stage I–Stage II transition (i.e., the
precise point at which a crack front actually begins to
Load
Time Mixed Load Spectrum
AA
B
A
BFig. 14 Mixed load spectrum.
A Small bands and B large
bands
J Fail. Anal. and Preven. (2010) 10:120–137 125
123
propagate) may be difficult. This subjectivity can result in
possible over-counting or under-counting of actual initia-
tion cycles. In addition, the AE equipment was not directly
synchronized with the load frame load controller. This
independence may have resulted in some ‘‘drift’’ between
load control and AE cycle counts. Despite these factors,
reasonable correlation between the two methods was
observed. Variation between initiation (Stage I) cycles as a
percentage of total cycles as counted by AE and calculated
by striation counting ranged from\1% to as much as 22%
with striation counting typically predicting fewer crack
initiation cycles and more crack propagation cycles than
AE. Stage I fatigue represented approximately 67–96% of
all applied cycles while Stage II fatigue represented
approximately 3–33% of all applied cycles. The striation
counting method used during this analysis is illustrated in
Case Study #1.
A Practical Approach to Striation Counting
Fracture Face Fundamentals
Many variables such as material hardness, changing load
distribution, metallurgical or microstructural changes, and
environmental conditions can affect crack propagation
through a material. While no two fractures are identical,
crack fronts tend to fall into one of two broad categories:
single crack fronts and integrated1 crack fronts. Single
crack fronts arise from a localized area consisting of one or
a few closely spaced initiation sites which join to propagate
a crack in a more or less continuous semi-circular or semi-
elliptical format through the material. Several assumptions
are made when evaluating striations in a single crack front:
(a) That secondary cracks within the localized area
initiated concurrently.
(b) The largest (or primary) single crack represents the
location of highest localized stress.
(c) That the area of highest localizes stress contains the
most complete crack propagation/striation record and
is therefore the best location to perform striation
counting.
These fracture fronts may be entirely contained in the
material cross section, may penetrate the cross section, may
have nearby secondary fracture fronts, or may exhibit rapid
lateral expansion when compared to fracture depth
(Fig. 17). In these cases, striation counting should take
place along the longest, straightest uninterrupted fracture
dimension—which is most often into the material thickness
Fig. 15 Test setup
0
10
20
30
40Smpl 1
Smpl 2
Smpl 3
Smpl 4
Smpl 5Smpl 6
Smpl 7
Smpl 8
Smpl 9
Propagation Cycles by AE Propagation Cycles by SEM Count
Fig. 16 Propagation cycles as predicted by AE versus propagation
cycles as counted by SEM as a percentage of total cycles
1 The term ‘‘integrated’’ is used here to describe a large number of
crack origins spaced closely together.
126 J Fail. Anal. and Preven. (2010) 10:120–137
123
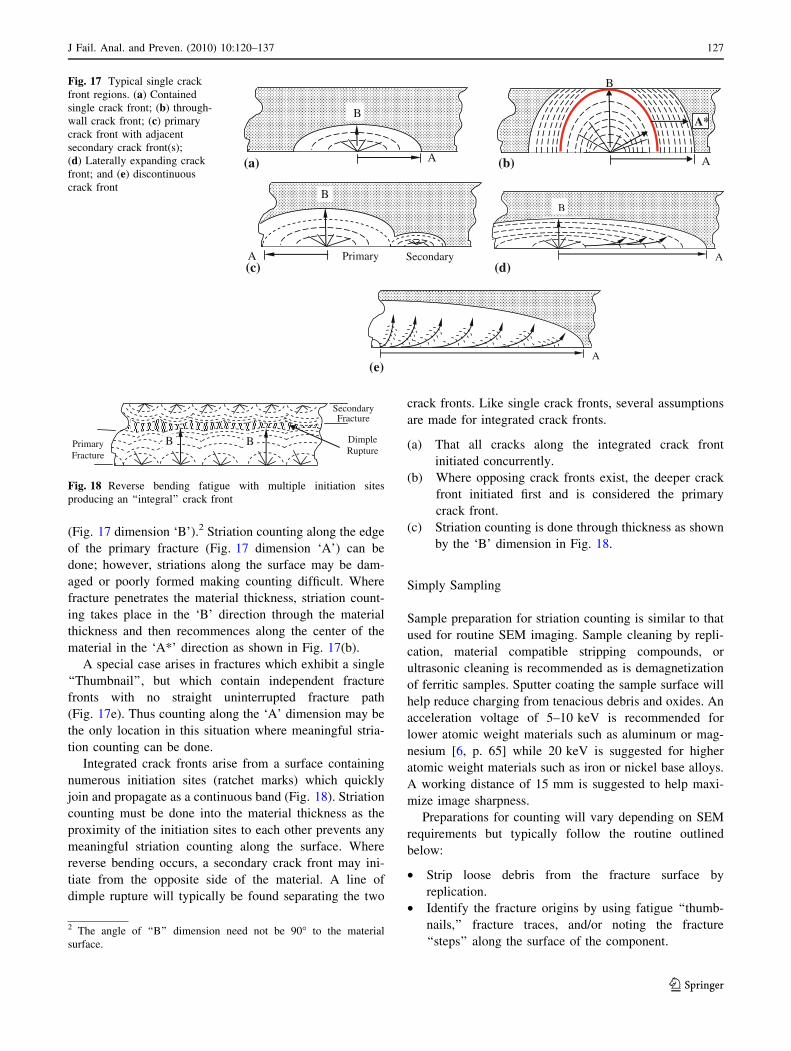
(Fig. 17 dimension ‘B’).2 Striation counting along the edge
of the primary fracture (Fig. 17 dimension ‘A’) can be
done; however, striations along the surface may be dam-
aged or poorly formed making counting difficult. Where
fracture penetrates the material thickness, striation count-
ing takes place in the ‘B’ direction through the material
thickness and then recommences along the center of the
material in the ‘A*’ direction as shown in Fig. 17(b).
A special case arises in fractures which exhibit a single
‘‘Thumbnail’’, but which contain independent fracture
fronts with no straight uninterrupted fracture path
(Fig. 17e). Thus counting along the ‘A’ dimension may be
the only location in this situation where meaningful stria-
tion counting can be done.
Integrated crack fronts arise from a surface containing
numerous initiation sites (ratchet marks) which quickly
join and propagate as a continuous band (Fig. 18). Striation
counting must be done into the material thickness as the
proximity of the initiation sites to each other prevents any
meaningful striation counting along the surface. Where
reverse bending occurs, a secondary crack front may ini-
tiate from the opposite side of the material. A line of
dimple rupture will typically be found separating the two
crack fronts. Like single crack fronts, several assumptions
are made for integrated crack fronts.
(a) That all cracks along the integrated crack front
initiated concurrently.
(b) Where opposing crack fronts exist, the deeper crack
front initiated first and is considered the primary
crack front.
(c) Striation counting is done through thickness as shown
by the ‘B’ dimension in Fig. 18.
Simply Sampling
Sample preparation for striation counting is similar to that
used for routine SEM imaging. Sample cleaning by repli-
cation, material compatible stripping compounds, or
ultrasonic cleaning is recommended as is demagnetization
of ferritic samples. Sputter coating the sample surface will
help reduce charging from tenacious debris and oxides. An
acceleration voltage of 5–10 keV is recommended for
lower atomic weight materials such as aluminum or mag-
nesium [6, p. 65] while 20 keV is suggested for higher
atomic weight materials such as iron or nickel base alloys.
A working distance of 15 mm is suggested to help maxi-
mize image sharpness.
Preparations for counting will vary depending on SEM
requirements but typically follow the routine outlined
below:
• Strip loose debris from the fracture surface by
replication.
• Identify the fracture origins by using fatigue ‘‘thumb-
nails,’’ fracture traces, and/or noting the fracture
‘‘steps’’ along the surface of the component.
A
B
(a) (b)
(c) (d)
(e)
A
B
A*
A
B
Primary Secondary A
B
A
Fig. 17 Typical single crack
front regions. (a) Contained
single crack front; (b) through-
wall crack front; (c) primary
crack front with adjacent
secondary crack front(s);
(d) Laterally expanding crack
front; and (e) discontinuous
crack front
Primary Fracture
Secondary Fracture
Dimple Rupture
B B
Fig. 18 Reverse bending fatigue with multiple initiation sites
producing an ‘‘integral’’ crack front
2 The angle of ‘‘B’’ dimension need not be 90� to the material
surface.
J Fail. Anal. and Preven. (2010) 10:120–137 127
123
• Identify the primary initiation site. Be aware that
fracture origins in plated surfaces or heavily rubbed/
corroded components may not be readily identifiable.
• Photograph the primary initiation site at 20–1009. Note
any scratches, pits, burns, imbedded particles, or other
surface damage associated with the origin (example:
grit blast particles, arc strikes, or inclusions).
• Perform energy dispersive spectroscopy of the origin to
determine if foreign materials are present.
Counting on Striations
Unless one is dealing with very low cycle fatigue, counting
every striation will not be practical. Striations near the
origin are likely to be smeared, oxidized, and finely spaced
while those near the end of the fatigue region may be better
preserved but also may be intermixed with dimple rupture.
Striation counting is done on photographs taken at conve-
nient intervals along a line running from the initiation point
to the furthest reaches of the fracture zone. Magnifications
of 2,0009 to 7,0009 are typical, although high-cycle
fatigue may require magnifications of up to 20,0009 to
resolve. Resolution at higher magnifications may be limited
by either equipment capabilities or poor striation quality.
One may find counting easier if one begins at the extreme
region of the fracture zone and works back toward the
initiation point.
The counting process generally progresses along the
following sequence:
• Survey the primary fatigue fracture area to determine
where fatigue ends and overload begins. Examine the
striations as close to the initiation point and as far from
the initiation point as possible. If the spacing is
significantly different, multiple areas will need to be
counted to ensure accuracy. If unstable regions of
fatigue mixed with dimple rupture exist, the analyst
must decide where counting will stop.
• Orient the sample in the SEM such that the straightest,
longest uninterrupted fracture front is parallel to the X- or
Y-stage axis to facilitate easy distance measurements.
• Measure the distance from the origin to the point where
fatigue stops and divide it into convenient intervals.
Striation spacing at the beginning of the interval should
not differ significantly from those at the end of the
interval.
• Begin by locating and measuring the distance from
the origin to the nearest stable growth region using
the SEM stage micrometer. Mark the location on the
overall photograph.
• Photograph a typical striation region within the interval
at a magnification high enough to resolve individual
striations. Be sure to include a micrometer bar on the
photo. Six to ten striations should be clearly discern-
able. Actual striation counting may be done directly on
the photograph, or if the striations are still difficult to
discern, the photograph can be enlarged on the
computer screen using image processing software and
the striations marked on the digital image. The photo
can then be printed out in a convenient size and the
marked striations measured using the micron bar
attached to the photo.
• Obtain striation counts from several areas in the
interval. The striation counts will be averaged and the
average reported as the striation count for the interval.
• Move to next location and repeat until representative
photos have been obtained from each interval.
• Using the micron bar on the photos, measure the
distance between six to fifteen striations. Divide
striations counted by the distance the number of and
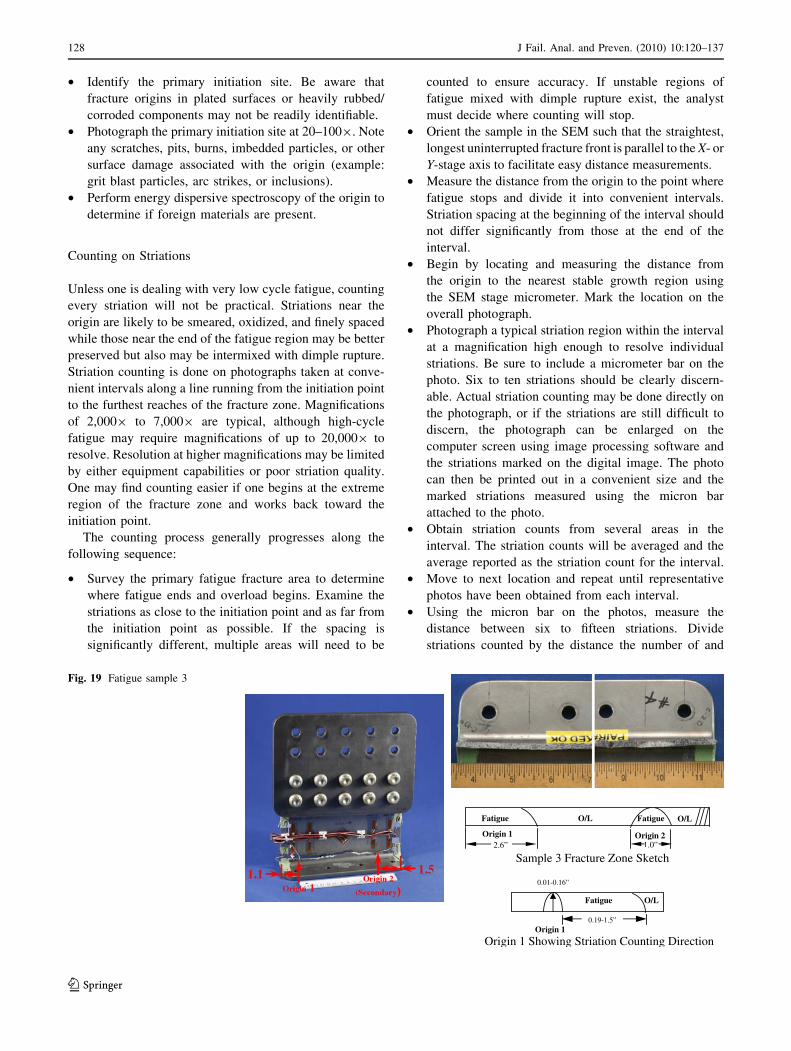
Sample 3 Fracture Zone Sketch
Origin 1 Showing Striation Counting Direction
2.6”
Fatigue Fatigue O/L O/L
Origin 1 Origin 2 1.0”
0.19-1.5” Origin 1
O/L Fatigue
0.01-0.16”
Fig. 19 Fatigue sample 3
128 J Fail. Anal. and Preven. (2010) 10:120–137
123
report the count for that photo in terms of striations per
unit length.
• A plot of the striations per inch as a function of crack
depth can be made. The area under the curve is an
estimate of the total number of cycles the crack has
propagated [5].
• One can estimate the number cycles to initiation if the
number of propagation cycles and total number of
cycles are known.
Document all assumptions.
Case Study #1: Striation Counting in a Titanium Test
Sample Under Constant Amplitude Loading
Sample 3 (Fig. 19) from the fatigue testing described in
Striation Counting Math or Magic was forwarded for stri-
ation count following complete through-wall failure. As
shown in the fracture zone sketch, cracking proceeded
through the web thickness first, followed by cracking along
the web. In this case, to capture the number of cycles
required to produce through-wall penetration, striation
counting proceeded through thickness first as represented
by the counts recorded for the distance of 0.01–0.16 in. in
Table 1. Counting then proceeded along the length of the
web fracture from 0.19 to 1.5 in. at which point dimple
Table 1 Striation counting sample 3
Distance (in.)
Ave. striation
size (in./striation)
Number
of striations
Through thickness
0.00–0.01 N/A (subsurface origin) N/A
0.01–0.03 2.8 9 10�6 7,140
0.03–0.05 3.7 9 10�6 5,410
0.05–0.07 5.9 9 10�6 3,390
0.07–0.09 4.0 9 10�6 5,000
0.09–0.11 5.6 9 10�6 3,570
0.11–0.13 6.9 9 10�6 2,900
0.13–0.16 5.0 9 10�6 6,000
Along web
0.19–0.30 2.5 9 10�5 4,400
0.30–0.40 4.8 9 10�5 2,080a
0.40–0.60 5.9 9 10�5 3,390a
0.60–0.80 1.2 9 10�4 –b
0.80–1.00 2.0 9 10�4 –b
1.00–1.50 4.7 9 10�4 –b
Total 43,280
a A small amount of dimple rupture contributed to crack extension;
however, these small regions were ignored for this countb Fatigue was present; however, there was too much dimple rupture
to produce a meaningful count
....
....
...
..
....
...
....
...
...
...
....
....
...
..
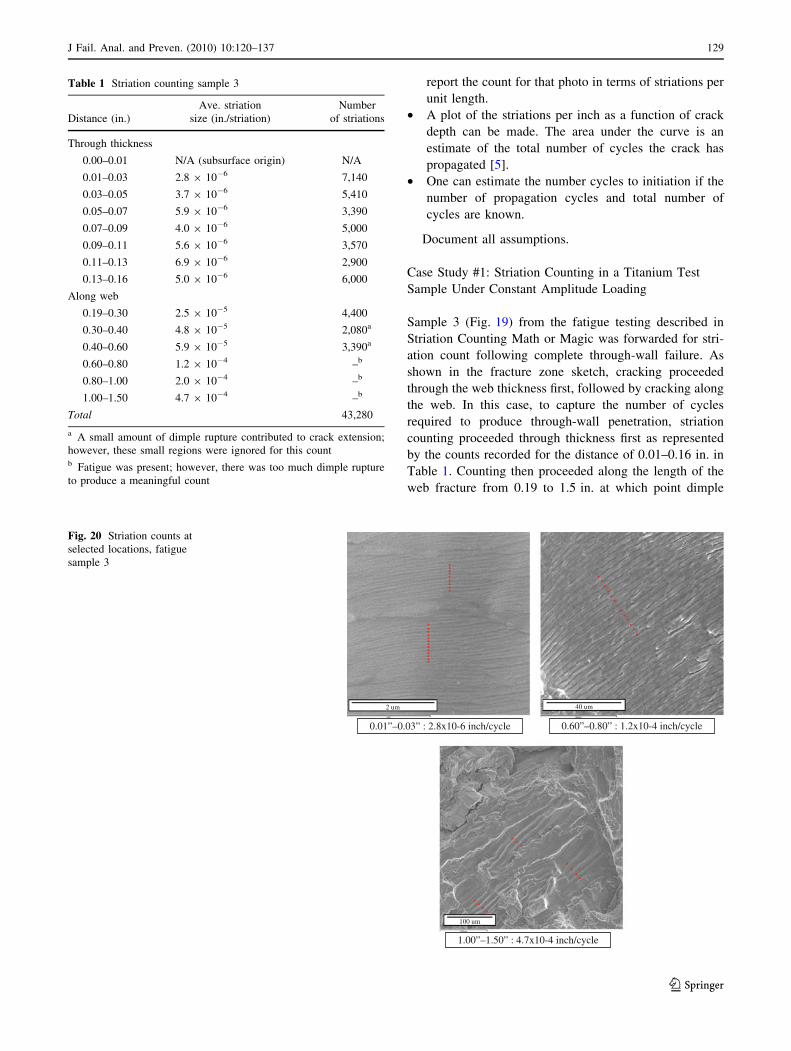
0.01”–0.03” : 2.8x10⁻⁶ inch/cycle 0.60”–0.80” : 1.2x10⁻⁴ inch/cycle
1.00”–1.50” : 4.7x10⁻⁴ inch/cycle
100 um
40 um2 um
Fig. 20 Striation counts at
selected locations, fatigue
sample 3
J Fail. Anal. and Preven. (2010) 10:120–137 129
123
rupture became predominant. The fatigue portions of the
fracture were divided into sections from which represen-
tative photographs (Fig. 20) were taken. One or more
striation counts were made on each photograph and an
average striation count calculated for the region (see
Table 1). The region 0.00–0.01 in. was not counted as
crack initiation had occurred subsurface.
A Rough Count
While striation counts may be desired, fractures are
often damaged in some fashion limiting counting oppor-
tunities. Examples of some of these damage mechanisms
are summarized below.
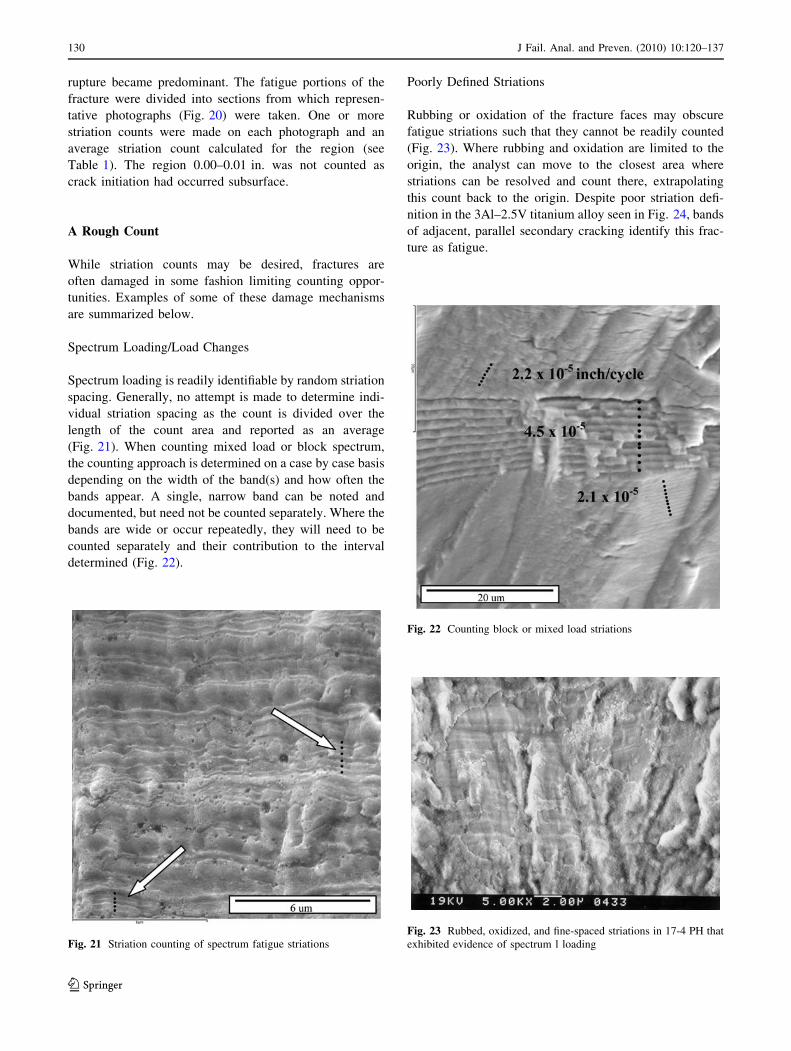
Spectrum Loading/Load Changes
Spectrum loading is readily identifiable by random striation
spacing. Generally, no attempt is made to determine indi-
vidual striation spacing as the count is divided over the
length of the count area and reported as an average
(Fig. 21). When counting mixed load or block spectrum,
the counting approach is determined on a case by case basis
depending on the width of the band(s) and how often the
bands appear. A single, narrow band can be noted and
documented, but need not be counted separately. Where the
bands are wide or occur repeatedly, they will need to be
counted separately and their contribution to the interval
determined (Fig. 22).
Poorly Defined Striations
Rubbing or oxidation of the fracture faces may obscure
fatigue striations such that they cannot be readily counted
(Fig. 23). Where rubbing and oxidation are limited to the
origin, the analyst can move to the closest area where
striations can be resolved and count there, extrapolating
this count back to the origin. Despite poor striation defi-
nition in the 3Al–2.5V titanium alloy seen in Fig. 24, bands
of adjacent, parallel secondary cracking identify this frac-
ture as fatigue.
Fig. 21 Striation counting of spectrum fatigue striations
Fig. 22 Counting block or mixed load striations
Fig. 23 Rubbed, oxidized, and fine-spaced striations in 17-4 PH that
exhibited evidence of spectrum l loading
130 J Fail. Anal. and Preven. (2010) 10:120–137
123
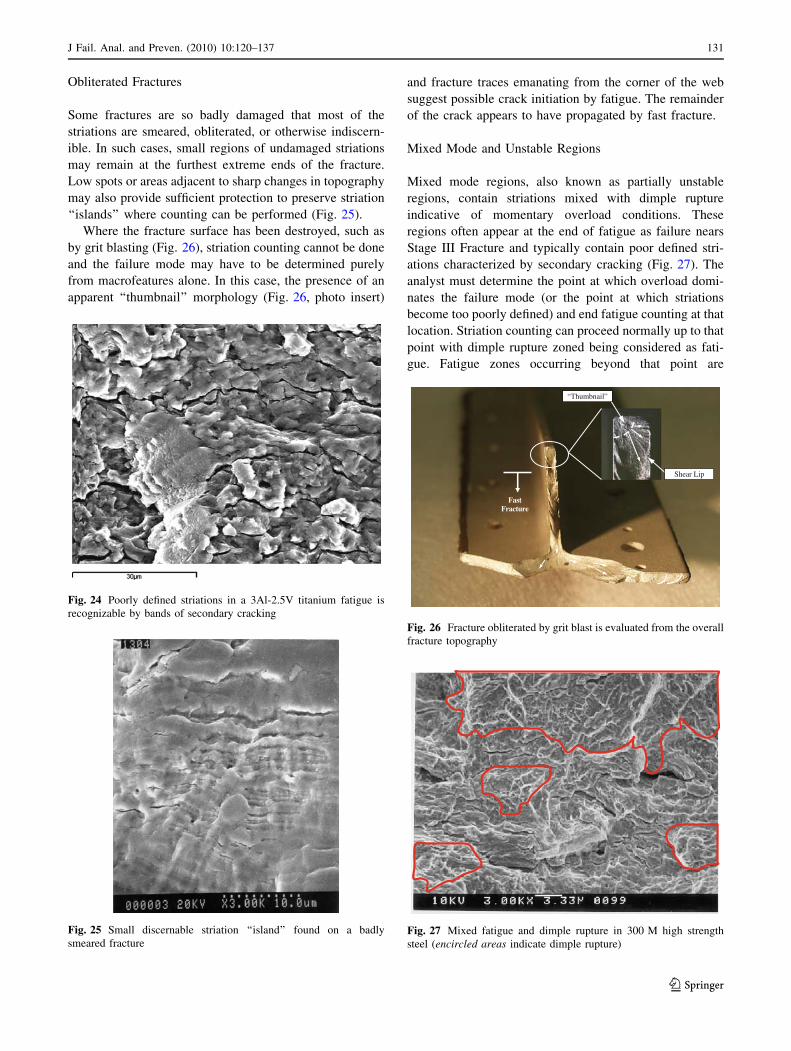
Obliterated Fractures
Some fractures are so badly damaged that most of the
striations are smeared, obliterated, or otherwise indiscern-
ible. In such cases, small regions of undamaged striations
may remain at the furthest extreme ends of the fracture.
Low spots or areas adjacent to sharp changes in topography
may also provide sufficient protection to preserve striation
‘‘islands’’ where counting can be performed (Fig. 25).
Where the fracture surface has been destroyed, such as
by grit blasting (Fig. 26), striation counting cannot be done
and the failure mode may have to be determined purely
from macrofeatures alone. In this case, the presence of an
apparent ‘‘thumbnail’’ morphology (Fig. 26, photo insert)
and fracture traces emanating from the corner of the web
suggest possible crack initiation by fatigue. The remainder
of the crack appears to have propagated by fast fracture.
Mixed Mode and Unstable Regions
Mixed mode regions, also known as partially unstable
regions, contain striations mixed with dimple rupture
indicative of momentary overload conditions. These
regions often appear at the end of fatigue as failure nears
Stage III Fracture and typically contain poor defined stri-
ations characterized by secondary cracking (Fig. 27). The
analyst must determine the point at which overload domi-
nates the failure mode (or the point at which striations
become too poorly defined) and end fatigue counting at that
location. Striation counting can proceed normally up to that
point with dimple rupture zoned being considered as fati-
gue. Fatigue zones occurring beyond that point are
Fig. 24 Poorly defined striations in a 3Al-2.5V titanium fatigue is
recognizable by bands of secondary cracking
Fig. 25 Small discernable striation ‘‘island’’ found on a badly
smeared fracture
“Thumbnail”
Shear Lip
FastFracture
Fig. 26 Fracture obliterated by grit blast is evaluated from the overall
fracture topography
Fig. 27 Mixed fatigue and dimple rupture in 300 M high strength
steel (encircled areas indicate dimple rupture)
J Fail. Anal. and Preven. (2010) 10:120–137 131
123
considered dimple rupture under the assumption that this
method effectively evens out the count. The total crack
length in which fatigue is actually observed should be
noted and reported that the customer is aware that fatigue
continued even though striation counting stopped.
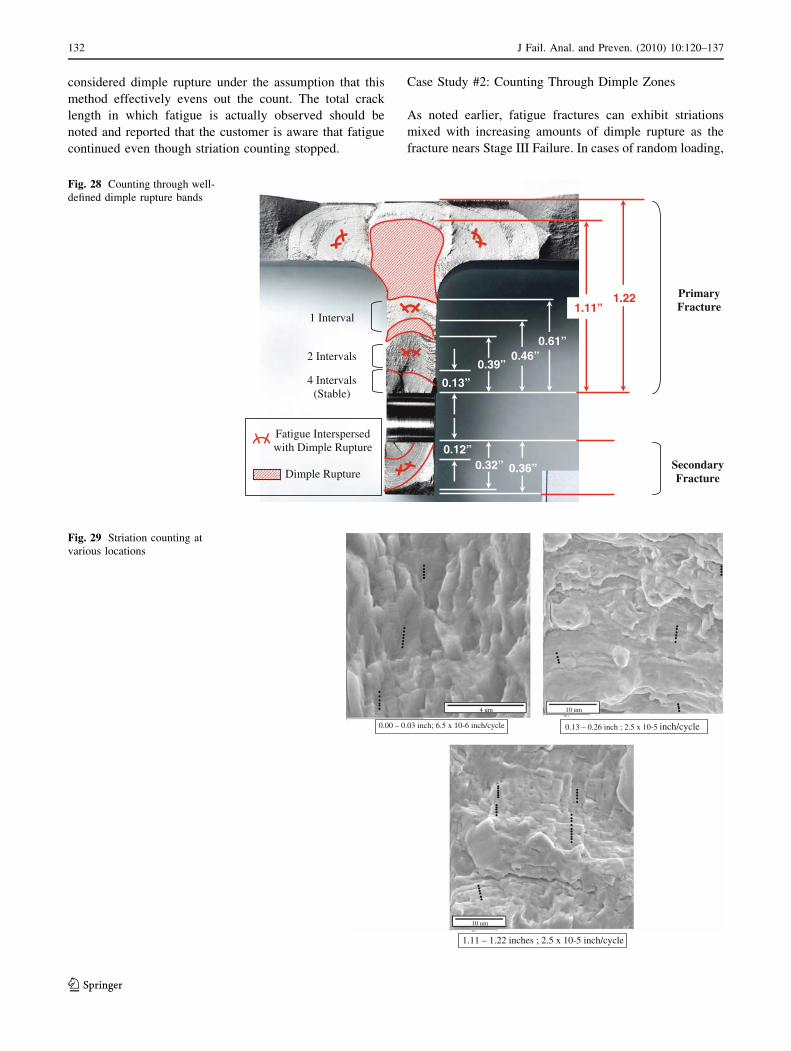
Case Study #2: Counting Through Dimple Zones
As noted earlier, fatigue fractures can exhibit striations
mixed with increasing amounts of dimple rupture as the
fracture nears Stage III Failure. In cases of random loading,
0.39”
0.13”
0.46”0.61”
1.11”1.22
0.12”0.32” 0.36”
4 Intervals (Stable)
2 Intervals
1 Interval
PrimaryFracture
SecondaryFracture
Fatigue Interspersed with Dimple Rupture
Dimple Rupture
Fig. 28 Counting through well-
defined dimple rupture bands
...........
.....
....
......
......
..........
....
..........
.......
....
.
0.00 – 0.03 inch; 6.5 x 10⁻⁶ inch/cycle 0.13 – 0.26 inch ; 2.5 x 10⁻⁵ inch/cycle
1.11 – 1.22 inches ; 2.5 x 10⁻⁵ inch/cycle
10 um4 um
10 um
Fig. 29 Striation counting at
various locations
132 J Fail. Anal. and Preven. (2010) 10:120–137
123
fatigue may be interspersed with bands of intermittent
dimple rupture (Fig. 28). Where bands are fairly well
defined, striation counting can continue through these
bands by simply noting the width of the band and where
they occur. Figure 29 shows typical striations found on this
fracture at selected locations listed in Table 2.
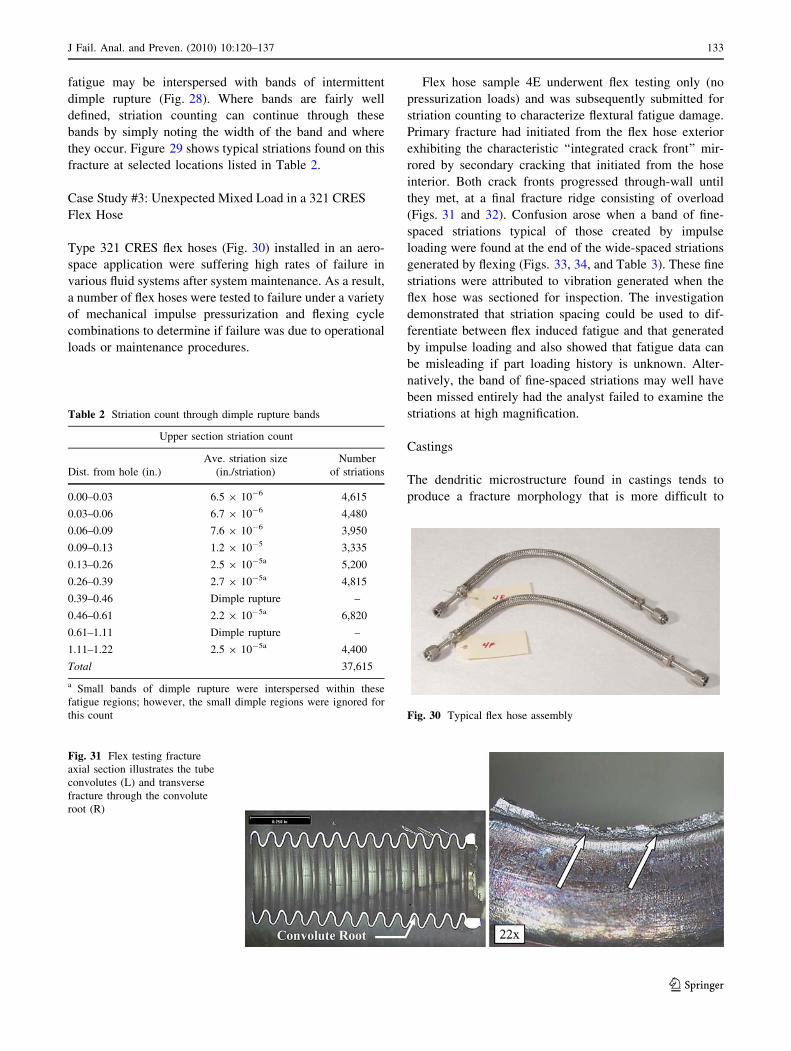
Case Study #3: Unexpected Mixed Load in a 321 CRES
Flex Hose
Type 321 CRES flex hoses (Fig. 30) installed in an aero-
space application were suffering high rates of failure in
various fluid systems after system maintenance. As a result,
a number of flex hoses were tested to failure under a variety
of mechanical impulse pressurization and flexing cycle
combinations to determine if failure was due to operational
loads or maintenance procedures.
Flex hose sample 4E underwent flex testing only (no
pressurization loads) and was subsequently submitted for
striation counting to characterize flextural fatigue damage.
Primary fracture had initiated from the flex hose exterior
exhibiting the characteristic ‘‘integrated crack front’’ mir-
rored by secondary cracking that initiated from the hose
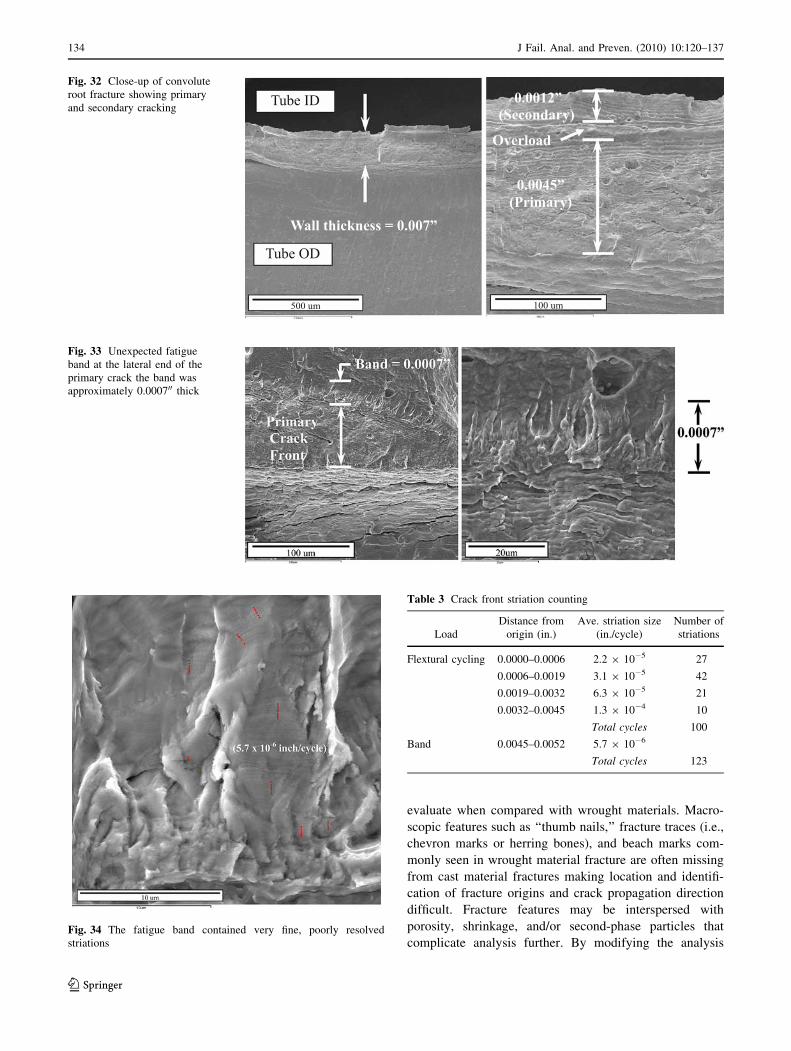
interior. Both crack fronts progressed through-wall until
they met, at a final fracture ridge consisting of overload
(Figs. 31 and 32). Confusion arose when a band of fine-
spaced striations typical of those created by impulse
loading were found at the end of the wide-spaced striations
generated by flexing (Figs. 33, 34, and Table 3). These fine
striations were attributed to vibration generated when the
flex hose was sectioned for inspection. The investigation
demonstrated that striation spacing could be used to dif-
ferentiate between flex induced fatigue and that generated
by impulse loading and also showed that fatigue data can
be misleading if part loading history is unknown. Alter-
natively, the band of fine-spaced striations may well have
been missed entirely had the analyst failed to examine the
striations at high magnification.
Castings
The dendritic microstructure found in castings tends to
produce a fracture morphology that is more difficult to
Table 2 Striation count through dimple rupture bands
Upper section striation count
Dist. from hole (in.)
Ave. striation size
(in./striation)
Number
of striations
0.00–0.03 6.5 9 10�6 4,615
0.03–0.06 6.7 9 10�6 4,480
0.06–0.09 7.6 9 10�6 3,950
0.09–0.13 1.2 9 10�5 3,335
0.13–0.26 2.5 9 10�5a 5,200
0.26–0.39 2.7 9 10�5a 4,815
0.39–0.46 Dimple rupture –
0.46–0.61 2.2 9 10�5a 6,820
0.61–1.11 Dimple rupture –
1.11–1.22 2.5 9 10�5a 4,400
Total 37,615
a Small bands of dimple rupture were interspersed within these
fatigue regions; however, the small dimple regions were ignored for
this count Fig. 30 Typical flex hose assembly
Fig. 31 Flex testing fracture
axial section illustrates the tube
convolutes (L) and transverse
fracture through the convolute
root (R)
J Fail. Anal. and Preven. (2010) 10:120–137 133
123
evaluate when compared with wrought materials. Macro-
scopic features such as ‘‘thumb nails,’’ fracture traces (i.e.,
chevron marks or herring bones), and beach marks com-
monly seen in wrought material fracture are often missing
from cast material fractures making location and identifi-
cation of fracture origins and crack propagation direction
difficult. Fracture features may be interspersed with
porosity, shrinkage, and/or second-phase particles that
complicate analysis further. By modifying the analysis
Wall thickness = 0.007”
Tube ID
Tube OD
500 um 100 um
0.0012”(Secondary)
0.0045”(Primary)
Overload
Fig. 32 Close-up of convolute
root fracture showing primary
and secondary cracking
Fig. 33 Unexpected fatigue
band at the lateral end of the
primary crack the band was
approximately 0.000700 thick
Fig. 34 The fatigue band contained very fine, poorly resolved
striations
Table 3 Crack front striation counting
Load
Distance from
origin (in.)
Ave. striation size
(in./cycle)
Number of
striations
Flextural cycling 0.0000–0.0006 2.2 9 10�5 27
0.0006–0.0019 3.1 9 10�5 42
0.0019–0.0032 6.3 9 10�5 21
0.0032–0.0045 1.3 9 10�4 10
Total cycles 100
Band 0.0045–0.0052 5.7 9 10�6
Total cycles 123
134 J Fail. Anal. and Preven. (2010) 10:120–137
123
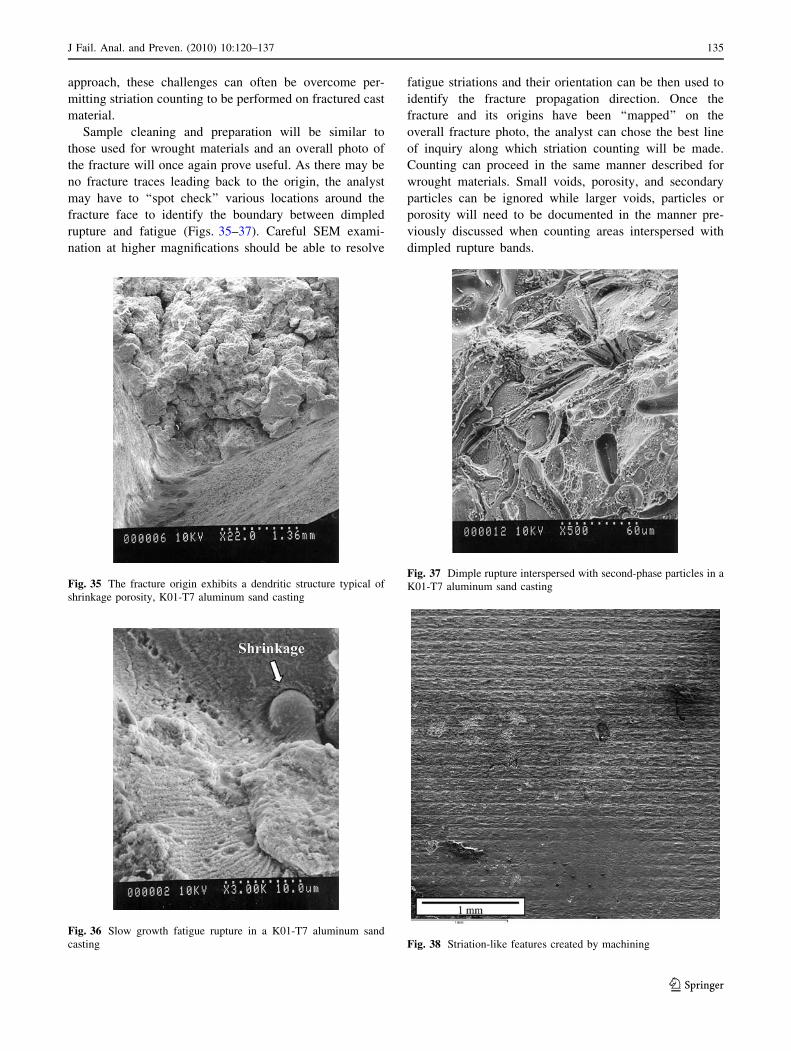
approach, these challenges can often be overcome per-
mitting striation counting to be performed on fractured cast
material.
Sample cleaning and preparation will be similar to
those used for wrought materials and an overall photo of
the fracture will once again prove useful. As there may be
no fracture traces leading back to the origin, the analyst
may have to ‘‘spot check’’ various locations around the
fracture face to identify the boundary between dimpled
rupture and fatigue (Figs. 35–37). Careful SEM exami-
nation at higher magnifications should be able to resolve
fatigue striations and their orientation can be then used to
identify the fracture propagation direction. Once the
fracture and its origins have been ‘‘mapped’’ on the
overall fracture photo, the analyst can chose the best line
of inquiry along which striation counting will be made.
Counting can proceed in the same manner described for
wrought materials. Small voids, porosity, and secondary
particles can be ignored while larger voids, particles or
porosity will need to be documented in the manner pre-
viously discussed when counting areas interspersed with
dimpled rupture bands.
Fig. 35 The fracture origin exhibits a dendritic structure typical of
shrinkage porosity, K01-T7 aluminum sand casting
Fig. 36 Slow growth fatigue rupture in a K01-T7 aluminum sand
casting
Fig. 37 Dimple rupture interspersed with second-phase particles in a
K01-T7 aluminum sand casting
Fig. 38 Striation-like features created by machining
J Fail. Anal. and Preven. (2010) 10:120–137 135
123
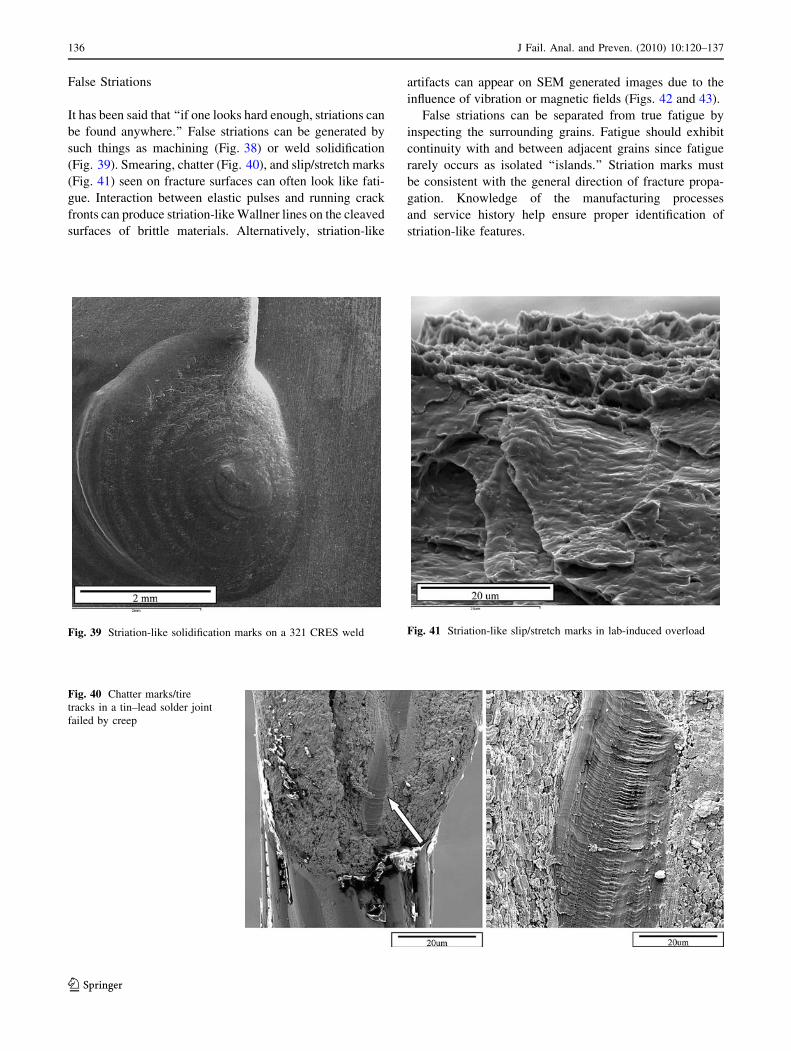
False Striations
It has been said that ‘‘if one looks hard enough, striations can
be found anywhere.’’ False striations can be generated by
such things as machining (Fig. 38) or weld solidification
(Fig. 39). Smearing, chatter (Fig. 40), and slip/stretch marks
(Fig. 41) seen on fracture surfaces can often look like fati-
gue. Interaction between elastic pulses and running crack
fronts can produce striation-like Wallner lines on the cleaved
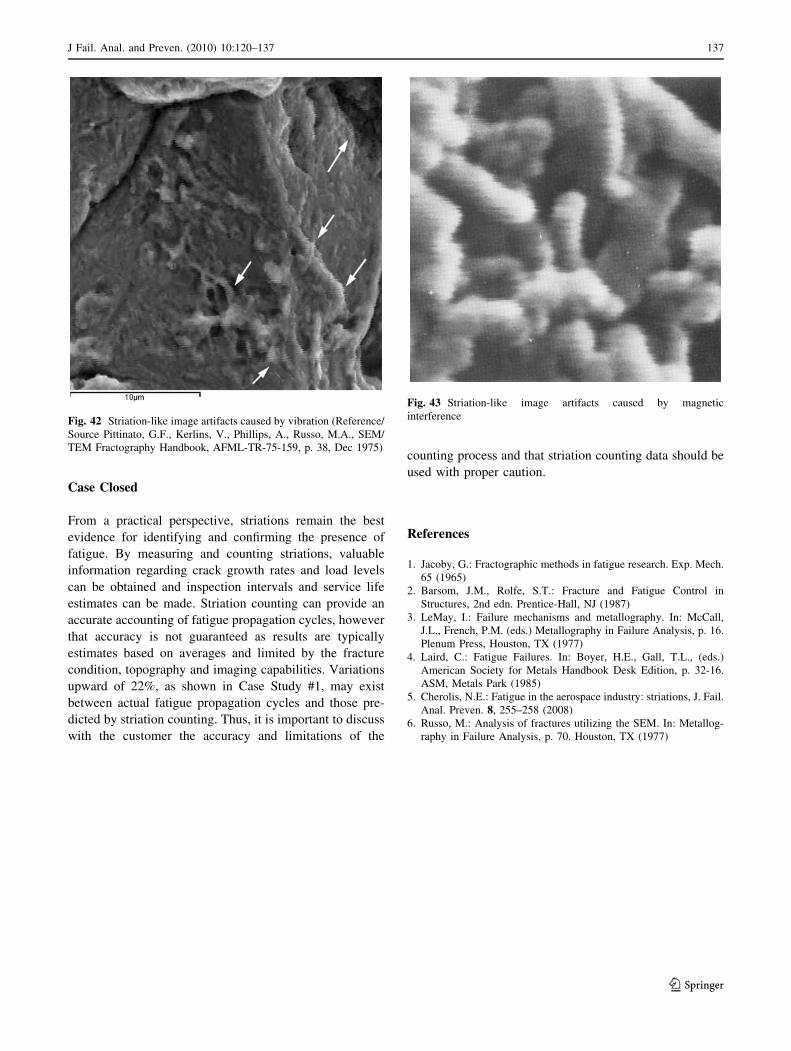
surfaces of brittle materials. Alternatively, striation-like
artifacts can appear on SEM generated images due to the
influence of vibration or magnetic fields (Figs. 42 and 43).
False striations can be separated from true fatigue by
inspecting the surrounding grains. Fatigue should exhibit
continuity with and between adjacent grains since fatigue
rarely occurs as isolated ‘‘islands.’’ Striation marks must
be consistent with the general direction of fracture propa-
gation. Knowledge of the manufacturing processes
and service history help ensure proper identification of
striation-like features.
Fig. 39 Striation-like solidification marks on a 321 CRES weld
Fig. 40 Chatter marks/tire
tracks in a tin–lead solder joint
failed by creep
Fig. 41 Striation-like slip/stretch marks in lab-induced overload
136 J Fail. Anal. and Preven. (2010) 10:120–137
123
Case Closed
From a practical perspective, striations remain the best
evidence for identifying and confirming the presence of
fatigue. By measuring and counting striations, valuable
information regarding crack growth rates and load levels
can be obtained and inspection intervals and service life
estimates can be made. Striation counting can provide an
accurate accounting of fatigue propagation cycles, however
that accuracy is not guaranteed as results are typically
estimates based on averages and limited by the fracture
condition, topography and imaging capabilities. Variations
upward of 22%, as shown in Case Study #1, may exist
between actual fatigue propagation cycles and those pre-
dicted by striation counting. Thus, it is important to discuss
with the customer the accuracy and limitations of the
counting process and that striation counting data should be
used with proper caution.
References
1. Jacoby, G.: Fractographic methods in fatigue research. Exp. Mech.
65 (1965)
2. Barsom, J.M., Rolfe, S.T.: Fracture and Fatigue Control in
Structures, 2nd edn. Prentice-Hall, NJ (1987)
3. LeMay, I.: Failure mechanisms and metallography. In: McCall,
J.L., French, P.M. (eds.) Metallography in Failure Analysis, p. 16.
Plenum Press, Houston, TX (1977)
4. Laird, C.: Fatigue Failures. In: Boyer, H.E., Gall, T.L., (eds.)
American Society for Metals Handbook Desk Edition, p. 32-16.
ASM, Metals Park (1985)
5. Cherolis, N.E.: Fatigue in the aerospace industry: striations, J. Fail.
Anal. Preven. 8, 255–258 (2008)
6. Russo, M.: Analysis of fractures utilizing the SEM. In: Metallog-
raphy in Failure Analysis, p. 70. Houston, TX (1977)
Fig. 42 Striation-like image artifacts caused by vibration (Reference/
Source Pittinato, G.F., Kerlins, V., Phillips, A., Russo, M.A., SEM/
TEM Fractography Handbook, AFML-TR-75-159, p. 38, Dec 1975)
Fig. 43 Striation-like image artifacts caused by magnetic
interference
J Fail. Anal. and Preven. (2010) 10:120–137 137
123