Stress Testing: How to Link Scenarios to Risk Drivers
17
Stress Testing - How to link scenarios to risk drivers Dr. JUAN M. LICARI SENIOR DIRECTOR HEAD OF ECONOMIC & CONSUMER CREDIT ANALYTICS – EMEA MOODY’S ANALYTICS
-
Upload
moodys-analytics -
Category
Economy & Finance
-
view
776 -
download
2
Transcript of Stress Testing: How to Link Scenarios to Risk Drivers
Stress Testing - How to link scenarios to risk drivers
Dr. JUAN M. LICARI
SENIOR DIRECTOR
HEAD OF ECONOMIC & CONSUMER CREDIT ANALYTICS – EMEA
MOODY’S ANALYTICS
2 2
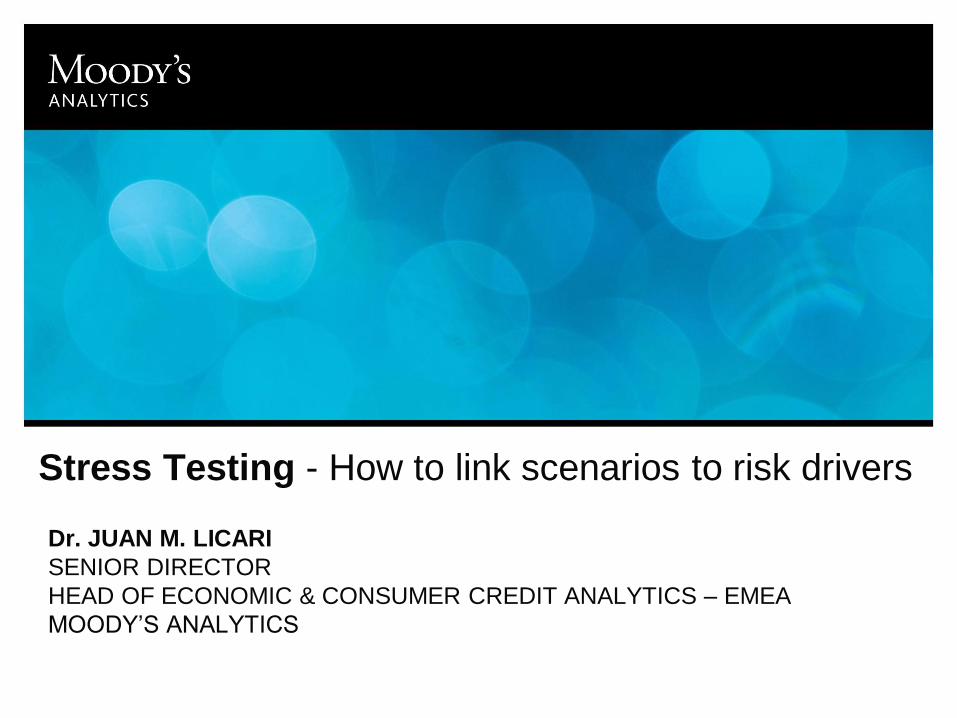
Today’s Presenter
2
Dr. Juan Licari - Senior Director - Moody’s Analytics – EMEA
Dr. Juan Licari is a Senior Director at Moody’s Analytics and the head of
the Economics and Consumer Credit Analytics team for EMEA. Dr.
Licari’s team is responsible for generating alternative macroeconomic
forecasts for Europe and for building econometric tools to model credit
risk phenomena. His team is an industry leader in developing and
implementing risk solutions that explicitly connect credit data to the
underlying economic cycle, allowing portfolio managers to plan for
alternative macroeconomic scenarios. These solutions are leveraged into
stress testing and reverse stress testing practices.

3 3
Independent provider of credit rating
opinions and related information for
nearly 100 years
Research, data, software, and related
professional services for financial risk
management
3
About Moody’s Analytics
Moody's Analytics operates independently of the credit ratings activities
of Moody's Investors Service. We do not comment on credit ratings or
potential rating changes, and no opinion or analysis you hear during this
presentation can be assumed to reflect those of the ratings agency.
Leading global provider of credit rating opinions, insight, and tools for credit risk
measurement and management
4 4
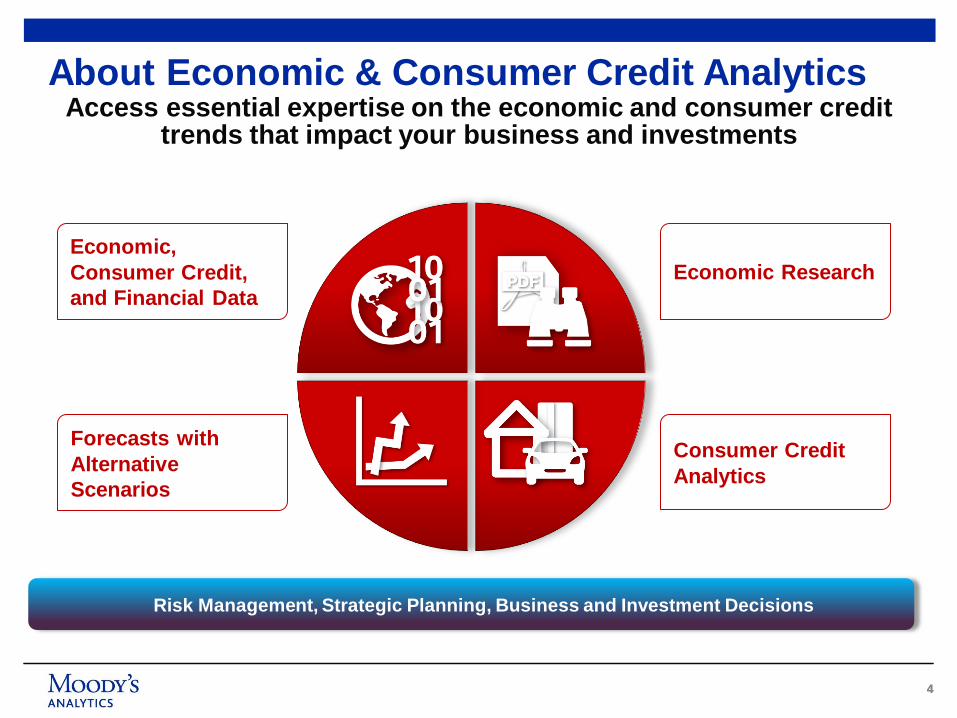
Access essential expertise on the economic and consumer credit trends that impact your business and investments
About Economic & Consumer Credit Analytics
Economic,
Consumer Credit,
and Financial Data
Forecasts with
Alternative
Scenarios
Economic Research
Consumer Credit
Analytics
Risk Management, Strategic Planning, Business and Investment Decisions
4
5 5
For more analysis and research on Europe and the
global economy please visit
www.economy.com
5

6 6
» Different methodologies as a response to alternative regulatory
guidelines.
» Stressing risk parameters directly vs. stressing the drivers behind
these risk models.
» Stressing credit migrations: A two stage approach to handle bi-
modal distributions.
» Q&A [email protected]
Agenda
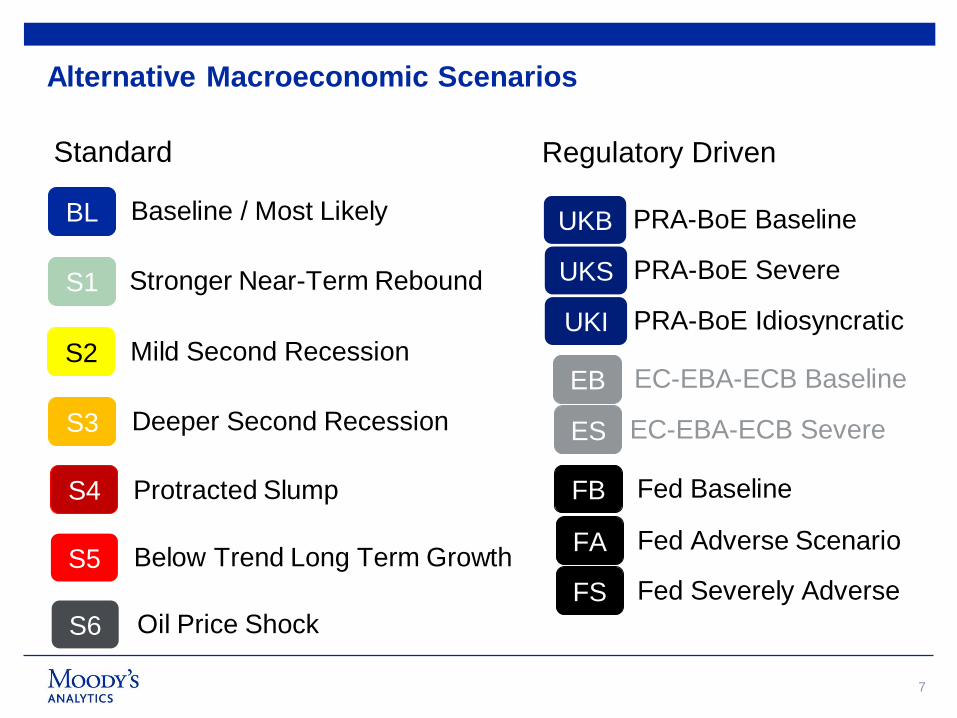
Alternative Macroeconomic Scenarios
7
Stronger Near-Term Rebound S1
S2 Mild Second Recession
S3 Deeper Second Recession
Protracted Slump S4
Baseline / Most Likely BL
Standard
Below Trend Long Term Growth S5
Oil Price Shock S6
Fed Baseline FB
Fed Adverse Scenario FA
EC-EBA-ECB Baseline EB
EC-EBA-ECB Severe ES
Regulatory Driven
PRA-BoE Baseline UKB
Fed Severely Adverse FS
PRA-BoE Severe UKS
PRA-BoE Idiosyncratic UKI
7
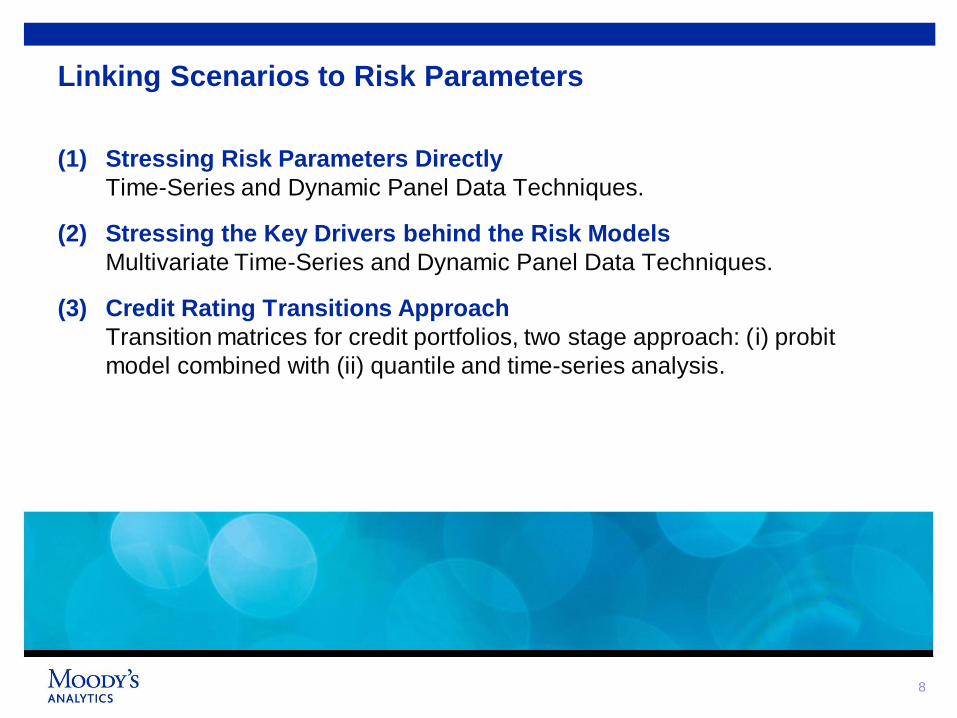
(1) Stressing Risk Parameters Directly
Time-Series and Dynamic Panel Data Techniques.
(2) Stressing the Key Drivers behind the Risk Models
Multivariate Time-Series and Dynamic Panel Data Techniques.
(3) Credit Rating Transitions Approach
Transition matrices for credit portfolios, two stage approach: (i) probit
model combined with (ii) quantile and time-series analysis.
8
Linking Scenarios to Risk Parameters
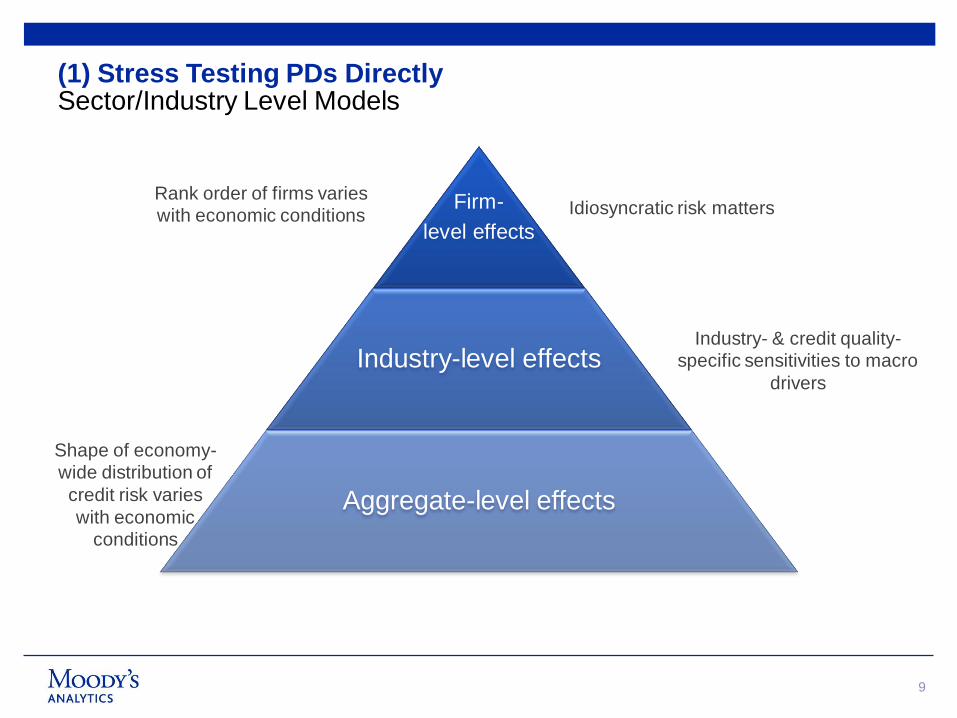
9
Firm-
level effects
Industry-level effects
Aggregate-level effects
Idiosyncratic risk matters
Industry- & credit quality-
specific sensitivities to macro
drivers
Rank order of firms varies
with economic conditions
Shape of economy-
wide distribution of
credit risk varies
with economic
conditions
(1) Stress Testing PDs Directly Sector/Industry Level Models
9
10
10
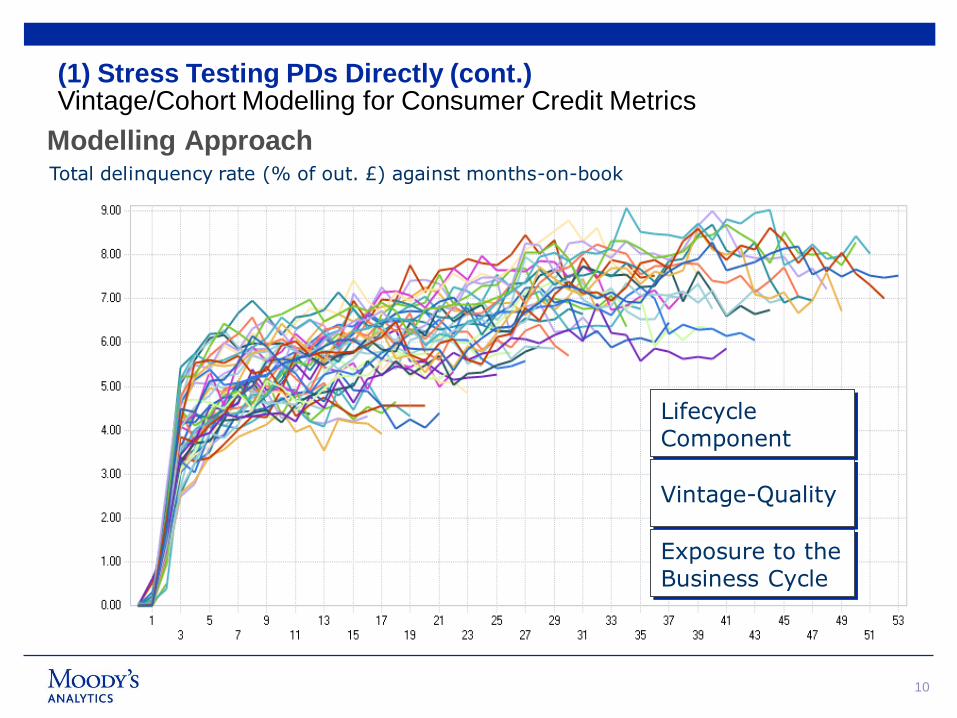
(1) Stress Testing PDs Directly (cont.) Vintage/Cohort Modelling for Consumer Credit Metrics
Modelling Approach
Lifecycle Component
Vintage-Quality
Exposure to the Business Cycle
Total delinquency rate (% of out. £) against months-on-book

Under the S4 scenario GDP growth is
negative…
… which translates into high probabilities
of default
11
EDF (Expected Default Frequency):
Market-driven estimate of the probability that a company will default within the next year
EDF Drivers: (i) Asset Returns, (ii) Asset Volatility and (iii) Default Point
11
(2) Stress Testing of PD Drivers Corporate Credit - Illustration from option-pricing PD modes
1995 2000 2005 2010
Year
1995 2000 2005 2010
Year
1995 2000 2005 2010
Year
1995 2000 2005 2010
Year
1990 1995 2000 2005 2010
Year
Construction Consumer Products Health Care
Services Trade
Rate
s (
%)
-10
-5
0
5
1
0
R
ate
s (
%)
-1
0 -5
0
5
1
0
R
ate
s (
%)
-10
-5
0
5
1
0
Rate
s (
%)
-10
-5
0
5
1
0
Rate
s (
%)
-10
-5
0
5
1
0
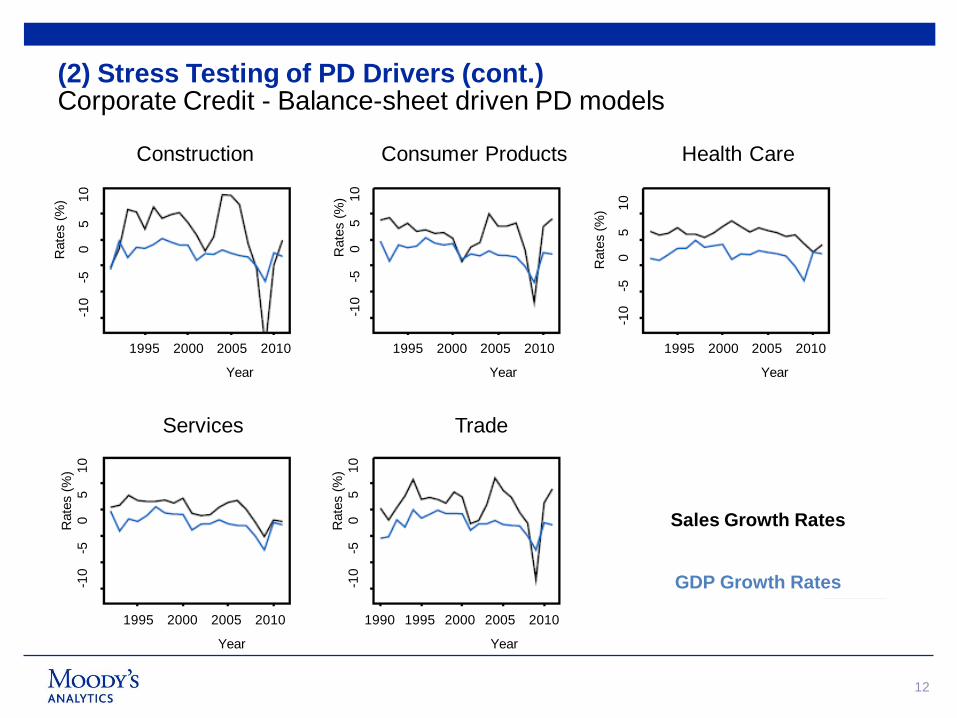
Sales Growth Rates
GDP Growth Rates
12
(2) Stress Testing of PD Drivers (cont.) Corporate Credit - Balance-sheet driven PD models
13
13
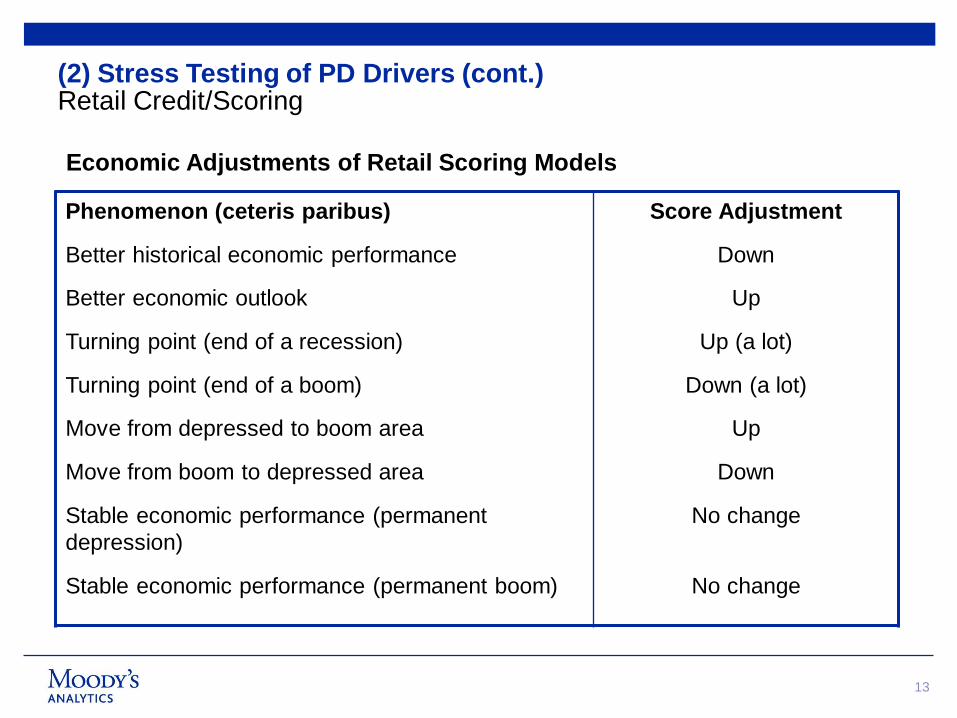
(2) Stress Testing of PD Drivers (cont.) Retail Credit/Scoring
Phenomenon (ceteris paribus)
Better historical economic performance
Better economic outlook
Turning point (end of a recession)
Turning point (end of a boom)
Move from depressed to boom area
Move from boom to depressed area
Stable economic performance (permanent
depression)
Stable economic performance (permanent boom)
Score Adjustment
Down
Up
Up (a lot)
Down (a lot)
Up
Down
No change
No change
Economic Adjustments of Retail Scoring Models

14
Table 1 Average probabilities (1983M1 - 2007M1)
Aaa Aa A Baa Ba B Caa-c Def
Aaa 92.10% 7.52% 0.33% 0.00% 0.04% 0.00% 0.00% 0.00%
Aa 0.99% 90.49% 8.07% 0.37% 0.04% 0.03% 0.00% 0.02%
A 0.07% 2.76% 90.65% 5.67% 0.65% 0.15% 0.03% 0.02%
Baa 0.05% 0.24% 5.51% 87.91% 4.75% 1.14% 0.23% 0.17%
Ba 0.01% 0.07% 0.47% 6.35% 82.56% 8.60% 0.60% 1.33%
B 0.01% 0.05% 0.18% 0.52% 5.52% 82.90% 4.74% 6.08%
Caa-c 0.00% 0.02% 0.10% 1.20% 1.19% 7.12% 69.42% 20.96%
Table 2 Average probabilities (2007M6 - 2009M10)
Aaa Aa A Baa Ba B Caa-c Def
Aaa 78.15% 21.71% 0.04% 0.11% 0.00% 0.00% 0.00% 0.00%
Aa 0.05% 82.65% 16.03% 0.99% 0.11% 0.02% 0.07% 0.09%
A 0.00% 0.88% 89.58% 8.24% 0.44% 0.30% 0.15% 0.41%
Baa 0.01% 0.14% 2.20% 91.95% 4.40% 0.72% 0.20% 0.38%
Ba 0.00% 0.00% 0.04% 5.10% 81.25% 10.46% 1.83% 1.32%
B 0.00% 0.00% 0.07% 0.17% 3.35% 78.31% 13.55% 4.55%
Caa-c 0.00% 0.00% 0.00% 0.14% 0.23% 5.74% 71.19% 22.70%
14
Figure I: Bi-Modal Nature of Credit Transitions Bi-Modal Distribution of Baa to Ba Credit Migrations (Bar Chart) vs. a Normal, Symmetric Distribution (Green Solid Line)
01
02
03
04
0
Den
sity
0 .02 .04 .06 .08 .1baa_ba
(3) Stress Testing of Credit Migrations Example of Global Corporate Credit Transitions

No Change in Policy Collection Policy "A" Collection Policy "B"
% of Cured Accs, 1 month later % of Cured Accs, 1 month later % of Cured Accs, 1 month later
0 96.75% 97.72% 98.70%
1 34.78% 40.86% 44.95%
2 11.97% 13.77% 15.14%
3 6.45% 7.21% 7.93%
4 5.20% 6.13% 6.75%
5 0.40% 0.48% 0.52%
6 0.42% 0.59% 0.65%
Sta
rtin
g s
tatu
s
BASELINE
0 1 2 3 4 5 6 7
0 97.48% 2.35% 0.15% 0.02% 0.00% 0.00% 0.00% 0.00%
1 39.33% 37.87% 22.22% 0.32% 0.03% 0.02% 0.00% 0.20%
2 14.69% 11.23% 28.79% 44.22% 0.39% 0.01% 0.00% 0.67%
3 6.15% 4.34% 5.25% 24.07% 57.57% 0.47% 0.03% 2.12%
4 3.06% 0.64% 1.22% 3.05% 21.51% 68.08% 0.14% 2.29%
5 1.43% 0.73% 1.04% 0.58% 3.03% 18.07% 72.52% 2.62%
6 0.50% 0.22% 0.02% 0.13% 0.08% 1.71% 9.34% 88.00%
Status 1 month later
Sta
rtin
g s
tatu
s
STRESSED
0 1 2 3 4 5 6 7
0 96.75% 3.03% 0.19% 0.03% 0.00% 0.00% 0.00% 0.00%
1 28.57% 40.17% 30.44% 0.44% 0.05% 0.03% 0.00% 0.30%
2 9.63% 7.38% 27.39% 54.28% 0.47% 0.01% 0.00% 0.83%
3 3.72% 2.61% 3.19% 21.46% 65.94% 0.54% 0.03% 2.50%
4 1.73% 0.37% 0.71% 1.77% 18.25% 74.44% 0.15% 2.58%
5 0.85% 0.43% 0.63% 0.34% 1.76% 15.04% 78.12% 2.84%
6 0.28% 0.12% 0.01% 0.07% 0.04% 0.94% 7.47% 91.06%
Status 1 month later
Sta
rtin
g s
tatu
s
15
(3) Stress Testing of Credit Migrations (cont.) Retail Credit Transitions
15
16 16
Q&A Session
Please use the chat function to ask questions
After the webinar please send your questions to:
Join Us for the next webinar in our Stress Testing Webinars
• Stress Testing – Making it Part of Risk Management Best Practice
Eric Leman discusses the advantages of a dedicated framework for
enterprise-wide model consolidation and storage.
>>Monday May 12, 2014; Time: 9:30 - 10:00 AM GMT (London)
To Register, please email: [email protected]
17 17
www.economy.com
United States
121 North Walnut Street
Suite 500
West Chester PA 19380
+1.610.235.5299
Australia
Level 10
1 O'Connell Street
Sydney, NSW, 2000
Australia
+61.2.9270.8111
United Kingdom
One Canada Square
Canary Wharf
London E14 5FA
+44.20.7772.5454
Prague
Washingtonova 17
110 00 Prague 1
Czech Republic
+420.22.422.2929