Stress Loading Unloading -...
14
124 Figure 4.1: Typical monotonic stress-strain behavior assumed in Tresca model. Figure 4.2: Tresca failure criterion in a 3-D stress space. Figure 4.3: Isotropic model: evolution of the yield surface in 2-D (left) and 3-D (right) principal stress space. Loading Unloading Stress Strain
Transcript of Stress Loading Unloading -...

124
Figure 4.1: Typical monotonic stress-strain behavior assumed in Tresca model.
Figure 4.2: Tresca failure criterion in a 3-D stress space.
Figure 4.3: Isotropic model: evolution of the yield surface in 2-D (left) and 3-D (right)
principal stress space.
Loading
Unloading
Stress
Strain

125
Rankine
Drucker-Prager
Figure 4.4: Two ways of modeling crack in finite element analysis (after Pankaj, 1990).
Figure 4.5: Yield surfaces for CDP model in the deviatoric plane, corresponding to different
values of (modified from Abaqus 6.11, 2011).
Figure 4.6: Yield surface for CDP model in plane stress (after Abaqus 6.11, 2011).
(a) Discrete crack (b) Smeared crack

126
Figure 4.7: Definition of cracking strain ̃ used in tension data (after Abaqus 6.11, 2011).
Figure 4.8: Definition of compressive inelastic (or crushing) strain ̃ used in compression
data (after Abaqus 6.11, 2011).

127
Figure 4.9: Drained triaxial compression test for cement-treated Toyoura sand by Namikawa
(2006).
Figure 4.10: Loading and boundary conditions simulated in finite element models.
(a) Drained triaxial
compression test (b)Direct tension test
(Full
specimen
model)
(Quarter
specimen
model)
0
500
1000
1500
2000
-0.3 -0.1 0.1 0.3 0.5D
ev
iato
r str
ess (kP
a)
z (%)x (%)y (%)
128
-0.4
-0.3
-0.2
-0.1
0
-0.020-0.015-0.010-0.0050.000
Ten
sile
str
ess
(MP
a)
strain z (%)
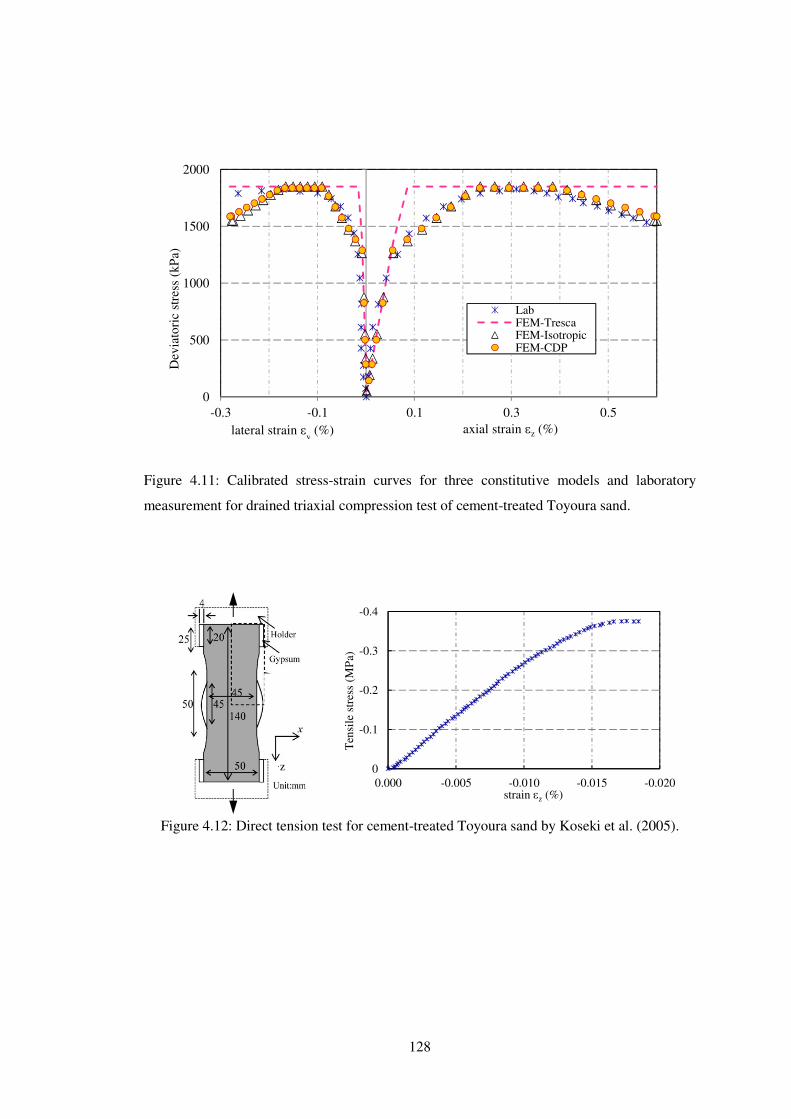
Figure 4.11: Calibrated stress-strain curves for three constitutive models and laboratory
measurement for drained triaxial compression test of cement-treated Toyoura sand.
Figure 4.12: Direct tension test for cement-treated Toyoura sand by Koseki et al. (2005).
0
500
1000
1500
2000
-0.3 -0.1 0.1 0.3 0.5
Dev
iato
ric
stre
ss (
kP
a)
axial strain z (%)
LabFEM-TrescaFEM-IsotropicFEM-CDP
lateral strain y (%)
z

129
Figure 4.13: Classical and tension truncated for Tresca criteria (after Antão et al., 2007).
Figure 4.14: Projection of Rankine surface in deviatoric plane.
Figure 4.15: Post-failure stress-fracture energy curve simulated by CDP model (after Abaqus
6.11, 2011).
(a) Classical Tresca (b)Tension truncated Tresca
admissible stress state imitated truncation
1 3
- 1
2
- 3
- 2
1
2
3
cr
c

130
Figure 4.16: Calibrated tensile stress-strain curves for three constitutive models and
laboratory measurement for direct tension test of cement-treated Toyoura sand.
Figure 4.17: Three-point bending notched beam test for cement-treated Toyoura sand by
Namikawa (2006).
-0.5
-0.4
-0.3
-0.2
-0.1
0
-0.025-0.020-0.015-0.010-0.0050.000
Ten
sile
str
ess
(MP
a)
strain y (%)
Lab
FEM-Tresca
FEM-Isotropic
FEM-CDP
Beam width = 40mm
Specimen length = 180mm
(a) (b)
Load F

131
Figure 4.18: Load-deflection curves of three-point bending notched beam test results for
cement-treated Toyoura sand by Namikawa (2006).
Figure 4.19: Tension-softening relation for cement-treated Toyoura sand by Namikawa
(2006).
0
5
10
15
20
25
30
35
40
0 0.1 0.2 0.3 0.4 0.5 0.6 0.7 0.8
Lo
ad,
F (
N)
Beam Deflection, v (mm)
Bab-1
Bab-2
Bab-3
0
0.05
0.1
0.15
0.2
0.25
0.3
0 0.05 0.1 0.15
t(M
Pa)
Opening crack displacement, c (mm)
Bab-1 Bab-2
Bab-3

132
Figure 4.20: Finite element meshes for simulating the three-point bending notched beam test:
(a) coarser mesh with 5,353 elements; and (b) finer mesh with 9,866 elements.
Figure 4.21: Load-deflection curves for two different mesh sizes in simulating the three-point
bending notched beam test for cement-treated Toyoura sand.
0
5
10
15
20
25
30
35
40
45
50
0 0.1 0.2 0.3 0.4 0.5 0.6
Lo
ad,
F (
N)
Beam Deflection, v (mm)
5353 elements
9866 elements
Load, F
(a)
Load, F
(b)

133
Figure 4.22: FEM input tension-softening relation in Case T2 for cement-treated Toyoura
sand.
Figure 4.23: Calibrated load-deflection curves and laboratory measurement for three-point
bending notched beam test of cement-treated Toyoura sand.
0
5
10
15
20
25
30
35
40
45
50
0 0.1 0.2 0.3 0.4 0.5 0.6
Lo
ad,
F (
N)
Beam Deflection, v (mm)
Bab-1
Bab-2
Bab-3
Case T1
Case T2
0
0.05
0.1
0.15
0.2
0.25
0.3
0.35
0.4
0 0.05 0.1 0.15 0.2
t(M
Pa)
Opening crack displacement, c (mm)
Bab-1
Bab-2
Bab-3
FEM input

134
0
200
400
600
800
1000
0 1 2 3 4 5
Axia
l st
ress
(kP
a)
Axial strain (%)
14Days
Aw=30%
Figure 4.24: Tensile damage process happened around the notch tip observed in FE analysis
Case T2.
Figure 4.25: Schematic experiment setup and stress-strain curves for UCT of cement-treated
Singapore marine clay.
0
5
10
15
20
25
30
35
0 0.1 0.2 0.3 0.4 0.5
Lo
ad,
F (
N)
Beam Deflection, v (mm)
Case T2
a b
c
d
(a) (b)
(c) (d)
sample
load cell
Displacement
transducer
loading rate
1 mm/min

135
Figure 4.26: FEM model and stress-strain curves for UCT calibration of cement-treated
Singapore marine clay.
Figure 4.27: Schematic diagram of three-point bending notched beam test B1 of cement-
treated Singapore marine clay (unit: mm).
0
200
400
600
800
1000
0 1 2 3 4 5
Axia
l st
ress
(kP
a)
Axial strain (%)
Lab
FEM-CDP
(Single element
model)
200
25 25 50
25
2.5
Load, F

136
0
2
4
6
8
10
12
14
16
18
0 0.05 0.1 0.15 0.2 0.25 0.3
Lo
ad,
F (
N)
Beam deflection, v (mm)
Test B1 (14Days
Aw=30%)
Figure 4.28: Load-deflection curve of three-point bending notched beam test B1 for cement-
treated Singapore marine clay.
Figure 4.29: Finite element mesh for simulating the three-point bending notched beam Test
B1.
Load, F

137
Figure 4.30: Calibrated load-deflection curves and laboratory measurement for three-point
bending notched beam Test B1 for cement-treated Singapore marine clay.
Figure 4.31: Post-test damage observed in numerical (Top) and laboratory (Bottom) for three-
point bending notched beam Test B1.
0
2
4
6
8
10
12
14
16
18
0 0.05 0.1 0.15 0.2 0.25 0.3 0.35
Loa
d,
F (
N)
Beam Deflection, v (mm)
Lab
E=212qu
E=400qu
E=800qu
crack
specimen
notch