Stress intensity factors for corner cracks at a hole under remote tension
6
ACTA MECHANICA SINICA ,Vol .7, No .1, February 1991 Science Press, Beijing, China Allerton Press, INC., New York, U .S .A ISSN 0567 - 7718 STRESS INTENSITY FACTORS FOR CORNER CRACKS AT A HOLE UNDER REMOTE TENSION Zhao Wei Wu Xueren Yan Minggao (Institute of Aeronautical Materials, Beijing 100095; China ) ABSTRACI" : The three-dimensional weight function method recently developed by the authors is used to determine stress intensity factors for two symmetric quarter-elliptical corner cracks at a hole in a wide finite-thickness plate subjected to remote tensile loading. The geometry parameters considered are r / t = 0.5, 1, 2 ; a / c= 0.2, 0.5, 1, 2 ; a / t = 0.2, 0.5 within c/r = 2. The results are compared, where possible, with other solutions available in the literature. Generally good agreement is observed. The effect of an approximation of the two-dimensional unflawed stress distribution on the accuracy of stress intensity factors by the weight function method is discussed. KEY WORDS : three dimensional weight function, corner crack, stress intensity factor I. INTRODUCTION Fatigue failures of engineering structures often result from the propagation of corner or surface cracks initiating from stress concentrations such as holes or notches. Reliable prediction of fatigue life and residual strength of cracked components requires accurate solutions of stress intensity factors. Due to the complexity of the three-dimensional crack problems in finite bodies, no exact solution is available. Determination of stress intensity factors for such problems has heavily relied on some Fig. 1 Corner cracks at hole sophisticated numerical techniques. Hechmer and Bloom Ill and Raju and Newman [21 analysed the problem of two symmetric quarter-elliptical corner cracks at a hole shown in Fig. 1 by using the finite element method. Nishioka and Atluri TMsolved the same problem by the finite element and alternating method. Although these sophisticated numerical methods can be applied to determine stress intensity factors for problems involving various loading and geometry conditions with good accuracy, it Would be prohibitively expensive to use these methods in a routine damage tolerance analysis of engineering structures. To overcome this difficulty the authors have developed a three-dimensional weight function method [4' 51, and applied it to an embedded elliptical crack [4" 51, surface cracks at hole [4'61, corner cracks at hole [41, surface crack at notch [4,7- 91 and corner Crack at notch [4'7.10].These applica- tions have shown that this method is simple, efficient and very accurate. As a further application of the weight func- tion method the problem of two symmetric comer cracks at a hole in a wide plate under remote tension is analysed in this paper in detail with some new solutions presented. Also discussed in the paper is the effect of the two-dimensional unflawed stress distribution on the accuracy of stress intensity factors obtained by the weight function method, which needs a proper attention when the weight function method combined with the two-dimensional unflawed stress distribution is applied to solve the three-dimensional crack problems involving stress concentrations. Received 4 April 1990, revised 12 August 1990
Transcript of Stress intensity factors for corner cracks at a hole under remote tension

ACTA MECHANICA SINICA ,Vol .7, No .1, February 1991 Science Press, Bei j ing, China Allerton Press, INC., New York, U .S .A
ISSN 0567 - 7718
STRESS INTENSITY FACTORS FOR CORNER CRACKS AT A HOLE UNDER REMOTE TENSION
Zhao Wei Wu Xueren Yan Minggao
(Institute o f Aeronautical Materials, Beijing 100095; China )
ABSTRACI" : The three-dimensional weight function method recently developed by the authors is used to determine stress
intensity factors for two symmetric quarter-elliptical corner cracks at a hole in a wide finite-thickness plate subjected to
remote tensile loading. The geometry parameters considered are r / t = 0.5, 1, 2 ; a / c= 0.2, 0.5, 1, 2 ; a / t = 0.2, 0.5
within c / r = 2. The results are compared, where possible, with other solutions available in the literature. Generally good
agreement is observed. The effect of an approximation of the two-dimensional unflawed stress distribution on the accuracy
of stress intensity factors by the weight function method is discussed.
KEY WORDS : three dimensional weight function, corner crack, stress intensity factor
I. INTRODUCTION Fatigue failures of engineering structures often result from the propagation of corner or surface
cracks initiating from stress concentrations such as holes or notches. Reliable prediction of fatigue life and residual strength of cracked components requires accurate solutions of stress intensity factors. Due to the complexity of the three-dimensional crack problems in finite bodies, no exact solution is available. Determination of stress intensity factors for such problems has heavily relied on some
Fig. 1 Corner cracks at hole
sophisticated numerical techniques. Hechmer and Bloom Ill and Raju and Newman [21 analysed the problem of two symmetric quarter-elliptical corner cracks at a hole shown in Fig. 1 by using the finite element method. Nishioka and Atluri TM solved the same problem by the finite element and alternating method. Although these sophisticated numerical methods can be applied to determine stress intensity factors for problems involving various loading and geometry conditions with good accuracy, it Would be prohibitively expensive to use these methods in a routine damage tolerance analysis of engineering structures. To overcome this difficulty the authors have developed a three-dimensional weight function method [4' 51, and applied it to an embedded elliptical crack [4" 51, surface cracks at hole [4'61, corner cracks at hole [41, surface crack at notch [4, 7- 91 and corner Crack at notch [4' 7.10]. These applica-
tions have shown that this method is simple, efficient and very accurate. As a further application of the weight func- tion method the problem of two symmetric comer cracks
at a hole in a wide plate under remote tension is analysed in this paper in detail with some new solutions presented. Also discussed in the paper is the effect of the two-dimensional unflawed stress distribution on the accuracy of stress intensity factors obtained by the weight function method, which needs a proper attention when the weight function method combined with the two-dimensional unflawed stress distribution is applied to solve the three-dimensional crack problems involving stress concentrations.
Received 4 April 1990, revised 12 August 1990

Vol.7, No. 1 Z~ao Wei et al .: Stress Intensity Factors for Corner Cracks 77
II. THREE-DIMENSIONAL WEIGHT FUNCTION METHOD
Since the three-dimensional weight function method is described in great detail in [4, 5] and illustrated by different applications in [ 6, 9, 10], only a brief description in relation to the problem in consideration is given below.
2.1 Modeling and the Weight Function
According to the weight function method In' 51 the cracked body is decomposed into two series of orthogonal slices. Such a decomposition of comer cracks at a hole shown in Fig. 1 is depicted in Fig.2, whe re /~ a n d / ~ are restraining areas. The subscripts a and c are used to denote parameters related to the slices parallel respectively to the a- or c-axis of the crack. We consider only the infinite width plate in this work, i. e. (c+r) /b is equal to zero. Thus we have Ri = oo (i=a, c). The typical ~dices are shown in Fig.3 with the corresponding weight functions as follows
Wa= Wdoable ( l a )
Wc==Wholli . . . . ( l b )
These weight functions are available from W u ' s work tH' 12] and can also be found in [4, 6].
I Y
I
Rc I T
2b
Fig.2 Slice arrangements and the restraining areas
P(x, y)
~ t m
~ P(x, : P(x, y) ] g x
(a) basic slice (b) spring slice Fig. 3 Typical slices
2.2 Stress Intensity F a c t o r s
A useful relation has been derived in [ 4, 5] based on which stress intensity factors for the three- dimensional cracked body can be obtained by combining stress intensity factors for the corresponding slices in the following way
_ _ { 41 X.}_F E 1411/4 K(~p)= 1-q21 Ka~ax) L-.E~ ~ Kc(cy) ( - 1 ) "
(2) q = 0 for ~p= 0 o, 90 o q=v for 0 ~ ~
n =1 for Ki<~O n = 2 for K i > 0

78 ACTA MECHAN1CA SINICA 1991
where v is Po~sson's ratio. For the definitions of the crack parametric angle, tp, and the crack lengths, ax and Cy, for the slices please refer to Fig.4. Detailed solution procedures are given in [ 4 - - 6] .
a
y a/c~ 1
~ ( x , y) ~a
y a/c> I
C~
~ c ~ - - ~
(a) (b)
ax
I =x
Fig.4 Definition of crack parameters
III. ~ L T S AND DISCUSSIONS
The geometry parameters considered are r / t = 0.5, 1 ,2 ; a / c = 0.2, 0.5, 1 ,2 and a / t = 0.2, 0.5 within the limit of c / r = 2. Newly provided solutions are listed in Tables 1 and 2. Comparisons with other results available in the literature are made in F igs .J - - 9. The results are presented in the follow- ing non-dimensional form
F = K / ( tr n~a / ~ ) (3) where Q, known as the shape factor of an elliptic crack, is equal to �9 2, where ~ is the complete e l l i p t i c i n t e g r a l o f t h e s e c o n d k i n d .
Table I Normalized SIFs, F, for double comer cracks at hole, remote tension, a / c = 0.5
Table 2 Normalized SIFs, F, for double corner cracks at hole, remote tension, r / t = 2
r / t a / c
a / t ~ 0.5 1 2 a/t ~~ 0.2 1 2
0.2 0.1 1.189 1.481 1.840 0.2 0.1 0.863 2.936 2.168
11.3 1.265 1.528 1.872 11.3 0.995 2.947 2.196
22.5 1.280 1 . 5 7 7 1.936 22.5 1.196 2.865 2.101
33.8 1.373 1.711 2.091 33.8 1.430 2.850 2.016
45.0 1.533 1.909 2.295 45.0 1,690 2.871 1.913
56.3 1.728 2.149 2.527 56.3 1.972 2.941 1.813
67.5 1.975 2.414 2.756 67.5 2.272 3.039 1.729 82.5 2.521 2.872 3.114 82.5 2.805 3,274 1.717
89.9 2.631 2.872 3.042 89,9 2 .845 3.181 1.667
0.5 0.1 0.915 1.123 1.386 0.5 0.1 0.657 2.430 1.950
11.3 1.046 1.215 1.442 11.3 0.800 2.457 1.981
22.5 1.015 1.222 1.485 22,5 0.920 2.401 1.904
33.8 1.087 1.313 1.615 33.8 1.104 2.420 1.845
45.0 1.250 1.475 1.817 45.0 1.324 2.492 1.775
56,3 1.385 1.663 2.068 56.3 1.540 2.618 1.707
67.5 1.526 1.901 2.358 67.5 1.770 2.788 1.655
82.5 2.050 2.481 2.881 82.5 2.398 3.13t 1.681
89.9 2.363 2.642 2.914 89,9 2.660 3.087 1.641
3.1 Comparisons with the Finite- Element Results
Shown in Fig.5 is the case for shallow cracks. It is seen that the present solutiohs are in excellent agreement with Raju and Newman's finite element resuRs TM with difference less than 3% all the way along the crack front except the points at the plate and the hole surface. Near the hole surface the

Vol.7, No. 1 Zhao Wei et a l . : Stress Intensity Factors for Corner Cracks 79
finite element results drop quickly. This behavior had in [2, 13] been attributed as caused by the " boundary layer " effect. Recently Newman and his colleagues [14! have re-evaluated their finite element model and found out some "ill-shaped" elements at the location where the crack front inter- sects the hole surface. Their new solutioos, where these "ill-shaped" elements were eliminated, show good agreement up to points very near the hole surface 14' 7,141. Fig. 5 also shows the effect of the hole radius on the stress intensity factors. The larger the radius, the higher the stress intensity factors. Fig .6 is for the quarter-circular cracks. The agreement of the present results with those in [ 2] is good with difference within 5% away from the hole surface for a / t = 0 . 5 . For a / t = 0 . 2 the present result agrees within about 3% with that in [ 1], but differ nearly 7% at least from that in [ 2].
F
l
a/c=0.2 ~ r 3 a/t=0.2 r/ t= 1
0.5
0 t I I I I I I I l 30 60 90
o
F ig .5 Compar i son ofnorraal ized SIFs along the
crack front with the F E M results [21
symbols : Raju and N e w m a n (1979)
3
2
Fig. 6
r/t=0.5 a/c= 1
a / t = 0 . 2 ~
0.5
l I I 1 L I ~ I _ ~ 1 30 60 90
Compar ison with the F E M results [ 1,21
symbols : Raju and N e w m a n (1979)
dashed curve : H e c h m e r and Bloom (1977)
The present results for deep cracks are compared with those in [ 2, 3] in Fig.7. For a / t = 0.5 it is noted that the three methods are in excellent agreement within 2% away from the hole surface ; near the hole surface the present result keeps in good agreement with that in [3], while the results in [2] dropped off rapidly due to the above-mentioned " ill-shaped " elements. Near the hole surface the observations for a / t = 0.2 are similar to those for a / t = 0.5 ; near the plate surface, althotigh the two numerical solutions are in close agreement they are 5 - 10% lower than the weight function result.
3 r/t=O.5, a/c=2
2 ~ _ a/t=0.2
0.5 ,~
_ _ l I _ J i ~ i I I I 30 60 90
o
Fig .7 Compar ison with the F E M results [2' 3]
symbols : Raju and N e w m a n (1979)
dashed curves : Nishioka and Atluri (1982)
F
t
Fig. 8
r / t = l
a/c= 1
a / t = ~
0.5
I I I I I I I I 30 60 90
~ ~
Compar ison with the F E M results 121 alld equation[ 131 the
symbols : Raj u and N e w m a n (1979)
dashed curves : N e w m a n and Raju ( 1983 )
Figs.6 and 7 are for r / t = 0 . 5 . The corresponding results for r / t = 1 are shown in Figs.8 and 9. From Figs.6 and 8 the agreement of the weight function and the finite element results/21 for r / t = 1 is similar to that of the results for r / t = 0.5. Fig.9 shows that the present results for deep cracks agree
80 ACTA MECHANICA SINICA 1991
very well with those in [2] with difference within 4% away from the hole surface. Shown also in Figs.8 and 9 is result from Newman and Raju ' s equation [131. Since further refinement of the finite element meshes made the stress intensity factors increase at the hole surface TM 131, the data near the hole surface were not used in fitting their equation [131. Thus the equation was less influenced by the "ill-shaped : elements, and has a better accuracy near the hole surface than the finite element data
r / t = l, a / c = 2
2
F
itselE
0 I I I b I I I I I 30 60 90
r
Fig. 9. , Compar ison with the F E M results 12] and the equa- tion I131 Symbols : Raju and N e w m a n (1979)
dashed curves : N e w m a n and Raj u ( 1983 )
3.2 ~ I I I
3.1 ~
3.0
2.9
2.8
2.7
I L I I t 0 . 4 0.2 0
y / t
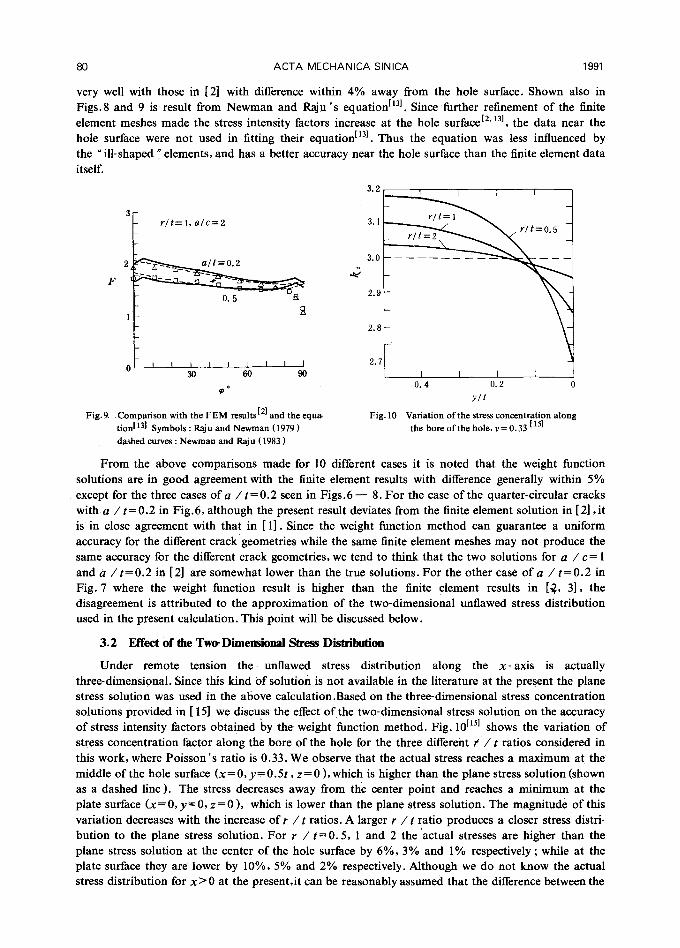
Fig. 10 Variation o f the stress concentrat ion along the bore o f the hole, v = 0.33 [ 151
From the above comparisons made for 10 different cases it is noted that the weight function solutions are in good agreement with the finite element results with difference generally within 5% except for the three cases of a / t = 0.2 seen in F i g s . 6 - 8. For the case of the quarter-circular cracks with a / t = 0 . 2 in Fig.6, although the present result deviates from the finite element solution in [2], it is in close agreement with that in [ 1]. Since the weight function method can guarantee a uniform accuracy for the different crack geometries while the same finite element meshes may not produce the same accuracy for the different crack geometries, we tend to think that the two solutions for a / c = 1 and a / t = 0.2 in [ 2] are somewhat lower than the true solutions. For the other case of a / t = 0.2 in Fig. 7 where the weight function result is higher than the finite element results in [~2, 3], the disagreement is attributed to the approximation of the two-dimensional unflawed stress distribution used in the present calculation. This point will be discussed below.
3.2 Effect of the Two-Dimensional Stress Distribution
Under remote tension t h e unflawed stress distribution along the x-axis is actually three-dimensional. Since this kind of solution is not available in the literature at the present the plane stress solution was used in the above calculation.Based on the three-dimensional stress concentration solutions provided in [ 15] we discuss the effect of the two-dimensional stress solution on the accuracy of stress intensity factors obtained by the weight function method. Fig. 10 [55] shows the variation of stress concentration factor along the bore of the hole for the three d i f f e r e n t / / t ratios considered in this work, where Poisson's ratio is 0.33. We observe that the actual stress reaches a maximum at the middle of the hole surface ( x = O, y = O. 5 t , z = 0 ), which is higher than the plane stress solution (shown as a dashed line). The stress decreases away from the center point and reaches a minimum at the plate surface (x = 0, y = 0, z = 0 ), which is lower than the plane stress solution. The magnitude of this variation decreases with the increase of r / t ratios. A larger r / t ratio produces a closer stress distri- bution to the plane stress solution. For r / t = 0.5, 1 and 2 the 'actual stresses are higher than the plane stress solution at the center of the hole surface by 6%, 3% and 1% respectively ; while at the plate surface they are lower by 10%, 5% and 2% respectively. Although we do not know the actual stress distribution for x > 0 at the present,it can be reasonably assumed that the difference between the

Vol.7, No. 1 7__hao Wei et al .: otress Intensity Factors for Corner Cracks 81
actual stress distribution and the plane stress solution is a highly localized phenomenon, and will rapidly disappear as it goes away from the hole surface. Fo r r / t = 2 the difference in stress
distribution can be omitted. For r / t = 1, al though the max imum difference is 5% its effect on the
stress intensity factors can also be neglected because it is averaged on the crack surface in the
integration. This can be borne out in Fig. 9 where the weight function result for a / t = 0.2, which is most influenced by the difference for r / t = 1, is still in a close agreement with the finite element
solution. For r / t = 0 . 5 the error of the plane stress solution reaches 10%. Owing to the localization
of the error its effect can still be negligible as long as the crack is long enough such as the cases of
r / t = 0.5 in Fig .5 and a / t = 0.5 in Fig.7 in which the crack lengths, c , are respectively equal to 2r and 0.5r. But for smaller cracks the e r ro r in the two-dimensional stress distribution will have signifi-
cant effect on the accuracy of stress intensity factors, as is shown by the case of a / t = 0.2 in Fig. 7 where the crack length, c , is equal to 0.2r. The weight funct ion solution for this case is 10% higher
than the finite element results at the plate surface. Since the error in platte stress solution is only 3% at the end of the a-axis of the crack and in the opposite direction fo that at the plate surface (see
Fig. 10) for this case, the agreement o f stress intensity factors obtained by the present method and in [3] is still very good near the hole surface.
IV. C O N C L U D I N G R E M A R K S Stress intensity factors for the two symmetric corner cracks at a hole in a wide plate under
remote tension are presented for r / t = 0.5, 1 ,2 ; a / c = 0.2, 0 .5, 1, 2 and d / t = 0 .2 , 0 .5 within
c / r = 2, most o f which are newly obtained solutions. Extensive comparisons and discussions have
shown that the present weight function solution would have an accuracy better than 95% except for
the one case of r / t = 0 . 5 and a / t = 0 . 2 where it is influenced by the approximation of the two-dimensional unflawed stress distribution. The discussion on the effect of the approximat ion of the two-dimensional stress distribution on the accuracy of stress intensity factors should draw some
proper at tention when the weight function methods are used in combinat ion with the two-dimensional
stress solutions to solve the three-dimensional crack problems involving stress concentrations,especially when the r / t and c / r ratios are small.
Acknowledgements : The authors are grateful to Dr . J. C. Newman, J r . , N A S A Langley Research Center, for his helpful discussions.
R E F E R E N C E S [ 1 ] Hechmer, J. L. and Bloom, J. M . , Int. J. Frac. 13 (1977), 7 3 2 - - 735. [ 2 ] Raju, I. S. and Newman, J. C. , Jr . , ASTM STP 677, C. W. Smith, E d . (1979), 411 - - 430.
[ 3 ] Nishioka, T. andAt lur i , S . N . , A I A A J . 21 (1983), 7 4 9 - - 757. [ 4 ] Zhao , W . , P h . D . thesis, Institute of Aeronautical Materials (1988).
[ 5] Zhao , W . , Wu, X .R . a n d Y a n , M . G . , Engng. Fracture Mech. 34 (1989), 5 9 3 - - 607. [ 6 ] Zhao , W . , Wu, X. R. and Yan, M . G . , Engng. Fracture Mech. 34 (1989), 6 0 9 - - 624. [ 7 ] Zhao , W . , Wu, X. R. and Yah, M . G . , in Proc. 4th National Symp. Fatigue (1989), 3 2 8 - - 331. [ 8 ] Zhao , W . , Wu, X. R. and Yah, M . G . , in Proc. Fatigue-90, 4th Int. Conf. Fa t . & Fat . Threshold (1990), 1477- - 1482.
[ 9 ] Zhao , W. and Wu, X. R. , Theoretical and Applied Fracture Mechanics. 13 (1990), 2 2 5 - 238.
[ 10] Zhao , W. and Wu, X. R. , Fatigue and Fracture Engng. Mater. Struc, 13 ( 1990 ), 3 4 7 - 360. [ 11 ] Wu , X. R. , Engng. Fractu re Mech. 20 ( 1984 ), 35 - - 49. [ 12] Wu, X. R. , Report 63, TRITA-HEL-0063 ISSN 0281 -1502, The Royal Institute of Technology, Stockholm, Sweden (1985). [ 13] 'Newman, J. C . , Jr. and Raju, I. S. , ASTM STP 791, Lewis, J. C. and Sines, G . , Eds. (1983), 1-238-- 1-256.
[14] Tan, P . W . , Raju, I . S . , Shivakumar, K . N . a n d N e w m a n , J . C . , Jr . , NASATM-101527 (1988).
[ 15] Folias, E . S . , Fracture Mechanics : 19th Symposium, ASTM STP 969, Cruse, T . A . , Ed. (1988), 5 6 - - 72.