Stress History of Soils from Cone Penetration Tests · Stress History of Soils from Cone...
14
Stress History of Soils from Cone Penetration Tests P.W. Mayne Abstract. Stress history is an important measurement in soils as it affects strength, stability, stiffness, and flow characteristics. The evaluation of the in-situ preconsolidation stress, or effective yield stress, from the results of piezocone penetration tests allows for an economical and expedient means to profile the stress history of clays, sands, and mixed soil types on geotechnical projects. The methodology is based on a derived analytical cavity expansion - critical state solution for clays and statistical inversion of data from calibration chamber tests on sands. Applications are given for case studies involving clay, silt, and sand where laboratory consolidation tests provide benchmark values for the stress history. Since yield stress demarcates contractive vs. dilative soil behavior, extended uses in screening soil susceptibility for concerns involving flow and cyclic liquefaction are also presented. Keywords: clay, cone penetration, overconsolidation, piezocone, preconsolidation, sand, stress history, yield stress. 1. Introduction The stress history of soils is a significant and impor- tant measure of its behavior in terms of stability, strength, deformational characteristics, and pore pressure behavior. The effective yield stress (s vy ’), or preconsolidation stress (s p ’= P c ’= s vmax ’), represents the demarcation between nor- mally-consolidated (NC) states and overconsolidated (OC) response. It also distinguishes the porewater pressures gen- erated during shear which can either be positive or nega- tive, and the volumetric strain characteristics that can be contractive or dilative. Traditionally, the preconsolidation stress was defined as the maximum past stress that had been physically and mechanically applied to the soil, such as due to overburden erosion or glaciation. The more general term of effective yield stress (s vy ’= s p ’) has been recommended (e.g., Lerou- eil & Barbosa 2000; Jardine et al., 2003) since many other geological and environmental processes can result in a quasi-preconsolidation effect, such as ageing, cyclic load- ing, desiccation, repeated wetting-drying, groundwater changes, alternating freezing-thawing, bio-chemical bond- ing, etc. 2. Effective Yield Stress The effective preconsolidation stress or yield stress of soils is best determined through a series of one-dimensional consolidation tests performed on undisturbed samples taken at different elevations in soil formation. A firm knowledge of the local engineering geology and terrain helps to put the stress history profile in a best perspective (Locat et al., 2003). Figure 1 shows an example consolida- tion test conducted on a specimen of silty clay taken from a depth of 6.5 m at a highway embankment site in Evergreen, North Carolina (w = 70.8%, LL = 44%, PI = 19%). Results are plotted in terms of void ratio (e) vs. log of effective ver- tical stress (s v ’), with a calculated in-situ effective overburden stress of s vo ’ = 43 kPa. Using the classical construction technique from Casa- grande (1936), a most probable magnitude of effective yield stress s p ’ = 80 kPa is determined. Following the or- ange dashed line, a minimum estimate of 65 kPa and maxi- mum estimate of 90 kPa can also be extracted. Beyond this procedure, some 30 different graphical methods have been developed for the evaluation of s p ’ from consolidation test data (Ku & Mayne 2013). The preconsolidation stress can be presented in dimensionless terms using a normalized form called the overconsolidation ratio (OCR), or the more generalized yield stress ratio (YSR), which is defined by: YSR o = ¢ ¢ s s p v (1) The yield stress and YSR affect the behavior of soils and the magnitude of many geoparameters. A partial listing of the influence and significance of s p ’ and YSR is given in Table 1. Another convenient parameter for representation of soil stress history is the yield stress difference, YSD, which is defined (Locat et al., 2003): YSD o = ¢- ¢ ( ) s s p v (2) The advantage of the YSD is that it is constant with depth for soil deposits that have become preconsolidated by erosion, glaciation, and/or excavation, where in contrast, the magnitude of YSR decreases with depth (Mayne 2007b). For soils that have a quasi-preconsolidation effect due to ageing, a constant YSR with depth is observed. While oedometer and consolidometer tests will re- main the benchmark for determining stress history profiles, there are often cases when “undisturbed” samples are diffi- Soils and Rocks, São Paulo, 40(3): 203-216, September-December, 2017. 203 Paul W. Mayne, Ph.D., Professor, Civil & Environmental Engineering, Georgia Institute of Technology, 790 Atlantic Drive, 30332-0355 Atlanta, GA, USA. e-mail: [email protected]. Invited Lecture, no discussions. DOI: 10.28927/SR.403203
Transcript of Stress History of Soils from Cone Penetration Tests · Stress History of Soils from Cone...

Stress History of Soils from Cone Penetration TestsP.W. Mayne
Abstract. Stress history is an important measurement in soils as it affects strength, stability, stiffness, and flowcharacteristics. The evaluation of the in-situ preconsolidation stress, or effective yield stress, from the results of piezoconepenetration tests allows for an economical and expedient means to profile the stress history of clays, sands, and mixed soiltypes on geotechnical projects. The methodology is based on a derived analytical cavity expansion - critical state solutionfor clays and statistical inversion of data from calibration chamber tests on sands. Applications are given for case studiesinvolving clay, silt, and sand where laboratory consolidation tests provide benchmark values for the stress history. Sinceyield stress demarcates contractive vs. dilative soil behavior, extended uses in screening soil susceptibility for concernsinvolving flow and cyclic liquefaction are also presented.Keywords: clay, cone penetration, overconsolidation, piezocone, preconsolidation, sand, stress history, yield stress.
1. Introduction
The stress history of soils is a significant and impor-tant measure of its behavior in terms of stability, strength,deformational characteristics, and pore pressure behavior.The effective yield stress (�vy’), or preconsolidation stress(�p’ = Pc’ = �vmax’), represents the demarcation between nor-mally-consolidated (NC) states and overconsolidated (OC)response. It also distinguishes the porewater pressures gen-erated during shear which can either be positive or nega-tive, and the volumetric strain characteristics that can becontractive or dilative.
Traditionally, the preconsolidation stress was definedas the maximum past stress that had been physically andmechanically applied to the soil, such as due to overburdenerosion or glaciation. The more general term of effectiveyield stress (�vy’ = �p’) has been recommended (e.g., Lerou-eil & Barbosa 2000; Jardine et al., 2003) since many othergeological and environmental processes can result in aquasi-preconsolidation effect, such as ageing, cyclic load-ing, desiccation, repeated wetting-drying, groundwaterchanges, alternating freezing-thawing, bio-chemical bond-ing, etc.
2. Effective Yield Stress
The effective preconsolidation stress or yield stress ofsoils is best determined through a series of one-dimensionalconsolidation tests performed on undisturbed samplestaken at different elevations in soil formation. A firmknowledge of the local engineering geology and terrainhelps to put the stress history profile in a best perspective(Locat et al., 2003). Figure 1 shows an example consolida-tion test conducted on a specimen of silty clay taken from adepth of 6.5 m at a highway embankment site in Evergreen,North Carolina (w = 70.8%, LL = 44%, PI = 19%). Resultsare plotted in terms of void ratio (e) vs. log of effective ver-
tical stress (�v’), with a calculated in-situ effectiveoverburden stress of �vo’ = 43 kPa.
Using the classical construction technique from Casa-grande (1936), a most probable magnitude of effectiveyield stress �p’ = 80 kPa is determined. Following the or-ange dashed line, a minimum estimate of 65 kPa and maxi-mum estimate of 90 kPa can also be extracted. Beyond thisprocedure, some 30 different graphical methods have beendeveloped for the evaluation of �p’ from consolidation testdata (Ku & Mayne 2013).
The preconsolidation stress can be presented indimensionless terms using a normalized form called theoverconsolidation ratio (OCR), or the more generalizedyield stress ratio (YSR), which is defined by:
YSRo
��
�
�
�p
v
(1)
The yield stress and YSR affect the behavior of soilsand the magnitude of many geoparameters. A partial listingof the influence and significance of �p’ and YSR is given inTable 1.
Another convenient parameter for representation ofsoil stress history is the yield stress difference, YSD, whichis defined (Locat et al., 2003):
YSD o� � � �( )� �p v (2)
The advantage of the YSD is that it is constant withdepth for soil deposits that have become preconsolidated byerosion, glaciation, and/or excavation, where in contrast,the magnitude of YSR decreases with depth (Mayne2007b). For soils that have a quasi-preconsolidation effectdue to ageing, a constant YSR with depth is observed.
While oedometer and consolidometer tests will re-main the benchmark for determining stress history profiles,there are often cases when “undisturbed” samples are diffi-
Soils and Rocks, São Paulo, 40(3): 203-216, September-December, 2017. 203
Paul W. Mayne, Ph.D., Professor, Civil & Environmental Engineering, Georgia Institute of Technology, 790 Atlantic Drive, 30332-0355 Atlanta, GA, USA. e-mail:[email protected] Lecture, no discussions.DOI: 10.28927/SR.403203

cult to procure because of the silty to sandy nature of theground, inevitable sample disturbance, ageing and storageeffects, and stress relief, as well as the expense and neces-sary time required for laboratory testing. Therefore, it hasbecome of great interest and motivation in seeking in-situtest based methods to evaluate stress history profiles ofsoils, specifically using the cone penetration test (CPT) andpiezocone (CPTu). These acquired data can be used to com-plement the laboratory program and fill in gaps betweensampling depths and locations.
The interpretation of a full suite of geoparameters us-ing CPT and CPTu is detailed elsewhere (Robertson 2009;Schnaid 2010; Mayne 2015).
3. Analytical SCE-CSSM Model for CPTU inClays
A hybrid analytical model for piezocone penetrationin clays was developed from Spherical Cavity Expansion
(SCE) theory and Critical State Soil Mechanics (CSSM), asdetailed by Mayne (1991, 2005) and Chen & Mayne(1994). The SCE-CSSM formulation provides for separateevaluations for the YSR in terms of the net cone resistance(qnet = qt - �vo) and/or the measured excess porewater pres-sure (�u = u2 - u0):
YSR
o
o�
��
� � ��
�
�
�
�
�
22
31
4
1
2
q
M I
t v
v
R
�
�
�(ln )
1
�
(3)
YSR o��
�
�
�
�
�
2
1
2
31
1
� �u
M I
v
R
�
ln( )(4)
where M = 6sin�’/(3 - sin�’) = frictional envelope in Cam-bridge University type q - p’ space, IR = G/su = undrained ri-gidity index, G = shear modulus, su = undrained shearstrength, and � = 1 - Cs/Cc = plastic volumetric strain poten-tial, with Cs = recompression or swelling index, andCc = virgin compression index. The value of � � 0.8 formost clays (Ladd & DeGroot 2003).
For soft to firm clays, the shear-component ofporewater pressures is small (< 20%) of the total measuredporewater pressures (Baligh 1986; Burns & Mayne 2002).Thus, neglecting that component, Eq. (4) can be reducedwithout much error to:
YSR o��
�
�
�
22
3
1
� �u
M I
v
R
�
ln( )(5)
Finally, by combining Eqs. (3) and (4), a third esti-mate of OCR can be formulated in terms of effective cone
204 Soils and Rocks, São Paulo, 40(3): 203-216, September-December, 2017.
Mayne
Table 1 - Importance of yield stress and YSR = �p’/�vo’ on soil behavior and geoparameters.
Geoparameter or behavioral facet Relevance
Degree of overconsolidation Separates normally-consolidated (NC) and overconsolidated (OC) regions
Settlement analysis Demarcates recompression from virgin compression on consolidation: e-log �v’
Undrained shear strength su/�vo’ = 1/2sin �’YSR� where � = 1 - Cs/Cc and �’ = friction angle
Geostatic lateral stress K0 = (1 - sin �’)YSRsin ��
Porewater pressures Skempton’s parameter Af
Anchors the yield surface Constitutive soil models
Elastic soil moduli E’ and Eu
Small-strain stiffness Gmax = F(e) p’ YSRk where F(e) = void ratio function p’ = effective stress and k =plasticity effect
Screening for flow liquefaction of soils Alternate to state parameter (�� separating contractive vs. dilative response
Screening for cyclic liquefaction potential Supplement to CSR and CRR
Figure 1 - Post-processing consolidation test results on clay fromEvergreen, North Carolina for evaluating yield stress.

resistance (qE = qt - u2) that removes the reliance on rigidityindex (IR):
YSRo
��
��
�
���
�
���
�
�
� 2
1
195 12
1
. M
q ut
v�
�
(6)
The above equations can be simplified from powerlaw expressions to form linear equations for evaluating ef-fective yield stress in intact clays. Adopting a value � = 1,the three CPTu formulae given by Eqs. (3), (5), and (6) arereduced to:
� ��
��
pt v
R
q
M Io
(1+ )13 ln
(7)
� ��
� p
R
u u
M I2 0
13 ln
(8)
� ��
�� p
tq u
M2
0 957 05. .(9)
3.1. Case study – Hartford, Connecticut
Geotechnical investigations for a five-story hotel inHartford, Connecticut included soil borings and series ofseismic piezocone tests (SCPTu) for settlement and bearingcapacity analyses of shallow spread footings. The site is lo-cated adjacent to the Connecticut River and a representa-tive SCPTu is shown in Fig. 2. The profile indicates anupper 11.5 m thick sand stratum underlain by a firm claythat extends to about 26 m. Lab data from the nearby BissellBridge are available (Long et al., 1978), with a summary ofdrained and undrained triaxial compression tests indicating
an effective stress friction angle �’ = 23° for the brown clay,as presented in Fig. 3. The SCPTu results can be used to es-timate the rigidity of the clay (G taken at 50% of strength)from a recent formulation developed by Krage et al. (2014):
( ).
( ) ( ). .I
G
qR
net v
500
0 75 0 25
181�
�� o
(10)
where G0 = �TVs
2 is the small-strain shear modulus and�T = total soil mass density. For the current data, an averagevalue of IR = 127 was obtained.
Using Eqs. (7), (8), and (9) with �’ = 23° and IR = 127gives the three separate and corresponding profiles of yieldstress and YSR shown in Fig. 4. These agree well with theresults of one-dimensional consolidation tests reported byLong et al. (1978).
Soils and Rocks, São Paulo, 40(3): 203-216, September-December, 2017. 205
Stress History of Soils from Cone Penetration Tests
Figure 2 - Representative seismic piezocone sounding at site in Hartford, Connecticut.
Figure 3 - Effective stress paths for CIDC and CIUC tests onbrown clay at Bissell Bridge, Hartford, Connecticut (data fromLong et al., 1978).

3.2. Yield stresses from CPTU in soft inorganic clays
The full range for measured effective stress frictionangle of natural clays is in the range 17° � �’ � 43°(Diaz-Rodriguez et al., 1992). A review of triaxial datafrom 453 clays indicates a mean �’ = 28.6° with standarddeviation S.D. � 5.0° (Mayne 2013). Ranges of the rigidityindex are much larger, yet the SCE-CSSM expressions area function of ln(IR), so much more forgiving in exactitude.Shear modulus is highly nonlinear from the nondestructiverange at G0 to intermediate values at medium strains (G)and low values at peak strength (Viana da Fonseca et al.,2011). Full ranges of laboratory-measured rigidity indicesfor soft clays is reported as: 40 � IR � 600 that decreaseswith increasing YSR (Casey et al., 2016). A default value isoften taken as IR = 100 (e.g., Teh & Houlsby 1991).
For intact inorganic clays of low sensitivity and lowOCR < 3, the SCE-CSSM expressions can be further sim-plified for practical use by adopting characteristic values of�’ = 30° and IR = 100 (Mayne 2001, 2005):
� � �� �p t vq033. ( )o (11)
� � �� p u u054 2. ( )o (12)
� � �� p tq u060 2. ( ) (13)
Of course, these coefficients should be adjusted basedon local geologies and site-specific geomaterials, wherepossible.
These relationships have been studied for a wide vari-ety of clays, including statistical studies involving: 206 dif-ferent sites (Chen & Mayne 1996); 22 sites in Canada(Demers & Leroueil 2002); 17 Norwegian clays (Karlsrudet al., 2005); as well as individual sites, e.g., Pisa, Italy
(Jamiolkowski & Pepe 2001); Costa Rica (Eller et al.,2014). Results from Swedish clays give similar valueshowever the coefficients appear to trend with plasticity in-dex (Larsson & Mulabdic 1991; Larsson & Åhnberg 2005),whereas the study involving clays of eastern Canada did notshow such a trend (Demers & Leroueil 2002).
3.3. Soft clay at Torp, Sweden
For soft intact clays, it is warranted to utilize all threeequations, as redundancy can be helpful in geotechnical sitecharacterization. If the three methods show consensus, thenthis helps to validate a “well-behaved” clay and encouragesfurther use of these relationships in the geological setting.An illustrative application of all three solutions given byEqs. (11), (12), and (13) is given in Fig. 5 for a soft clay sitein Torp, Sweden (Larsson & Åhnberg 2003). The estimatedprofiles of �p’ and YSR from the CPTu-estimates comparewell with the rather large set of consolidation test results atthis site.
If the three methods show disparities, then a closerexamination and scrutiny of the laboratory and/or field datamay be warranted, perhaps providing justification that ad-ditional testing and investigation should be conducted. lfunusual mineralogy exists in the soil (i.e., calcite, diatoms,forams, etc.), it may be possible to re-tune these equationsfor the particular geologic formation attributes (e.g., Mayne2005).
In highly sensitive or structured clays, it has been rec-ognized that Eq. (11) gives a slight underprediction in the�p’ profile, while a serious overestimation occurs withEq. (12) and a large underestimate when using Eq. (13). Forclays with a very pronounced strain-softening after peak in
206 Soils and Rocks, São Paulo, 40(3): 203-216, September-December, 2017.
Mayne
Figure 4 - Profiles of effective yield stress and YSR from consolidation tests and SCPTu at Hartford site.

their stress-strain-strength behavior, a modified SCE-CSSM is available (Agaiby & Mayne 2018).
3.4. Yield stresses in organic clays using CPTu
The fitted coefficients in Eqs. (11), (12), and (13) fora number of soft organic clays in Brazil are reportedly quitedifferent (Coutinho & Bello 2014). For instance, 0.125 qnet
and 0.154 qE are recommended (Baroni & Almeida 2017).This may reflect either a higher operational value of frictionangle and/or rigidity index than the above adopted “charac-teristic” values used in the SCE-CSSM solution, or perhapscan be related to the organic content and mineralogy ofthese clays. An adjustment for the coefficients is necessaryfor the organic sulfide clays of Sweden (Larsson et al.,2007). Here, the normal coefficients (0.33, 0.53, 0.60) arebetter fitted with values (0.22, 0.68, 0.28).
In lieu of adjusting the coefficients, an alternative ap-proach to addressing �p’ in organic clays is offered in theSection 5 of this paper.
4. Yield Stress Evaluation in Sand from CPT
A statistical review of over 626 calibration chambertests on 26 different clean sands of silica and quartz constit-uency has been compiled (Mayne 2001). By inversion, thisstudy determined relationships between the measured netcone resistance (qnet) and the applied stress state, includingeffective vertical stress (�vc’), lateral stress ratio(K0 = �vc’/�vc’), and induced OCR, as summarized in Fig. 6.A direct expression for evaluating the YSR in clean sands isgiven by (Mayne 2005):
YSRo
�
�
���
�
���
� ���
���
0192
1
0 22
.
( sin )
.q net
atm
v
atm
�
��
�
�
���
�
�
�
��
0 31
1
0 27
.
sin .�
(14)
Taking a characteristic value of friction angle�’ = 35.5° for clean sands, Eq. (14) reduces to the linear for-mat:
Soils and Rocks, São Paulo, 40(3): 203-216, September-December, 2017. 207
Stress History of Soils from Cone Penetration Tests
Figure 5 - CPTu data and YSR evaluations for Torp clay, Sweden (data from Larsson & Åhlberg 2003).
Figure 6 - Inversion relationship from CPT chamber tests on 26different quartz-silica sands.

� �� �p net atmq0 08 0 7 0 3. . . (15)
Using SI units, the reference stress is �atm = 1 bar =100 kPa, therefore Eq. (15) further diminishes to the evensimpler expression:
� �� p netq032 0 7. ( ). units of kPa (16)
which bears an uncanny resemblance to the expression forclay given by Eq. (11). As shown by Fig. 7, the simplifiedapproach for clean sands compares well with the more rig-
orous algorithm given by Eq. (14) for the specified rangesof �’, stress level (�vc’), and normalized cone resistance.For high stress levels and high values of �’, the simplifiedapproach will underpredict the yield stresses.
4.1. Case study from Blessington Sand Site, Ireland
The aforementioned approach can be applied to a casestudy involving dense OC sands in Blessington, Ireland(Doherty et al., 2012). The site is used by Univ. CollegeDublin for offshore pile research (Gavin et al., 2013). Theglacially-derived dense fine sands have an in-place relativedensity around 100% and mean particle size: 0.10 < D50
(mm) < 0.15 mm. Mineralogies include a predominance ofquartz with calcite component, and subsets of feldspar,mica, and kaolinite fractions.
Measured cone tip resistances from 4 CPT soundingsat the test site are presented in Fig. 8a. Samples of the sandwere procured using sonic drilling methods that were latertested in the laboratory consolidometer to define the yieldstress (�p’) per Casagrande method. The interpreted pro-files of yield stress from the simplified CPT approach areshown in Fig. 8b along with a comparison to the lab refer-ence values, with good agreement evident.
5. Generalized Profiling of YSR by CPT
For the general case of evaluating effective yieldstress in all soil types, Fig. 9 provides a compilation of datafrom a variety of natural formations, including sands, silts,clays, and mixed geomaterials. The independent expres-
208 Soils and Rocks, São Paulo, 40(3): 203-216, September-December, 2017.
Mayne
Figure 7 - Comparison of yield stress of sands from statistical al-gorithm and simplified solution.
Figure 8 - Profiles of cone resistance and yield stress ratio in dense overconsolidated sands at Blessington, Ireland (data from Doherty etal., 2012).

sions for clays and sands can be united to provide the gen-eral format:
� � ��
��
�
���
� �
� ��
p t vm atm
m
q033100
1
. ( )o (17)
where the exponent m’ increases with fines content and de-creases with mean grain size. Specifically, the value ofm’ � 0.72 in clean quartz sands, 0.8 in silty sands, 0.85 insilts, and is 1.0 in intact clays of low sensitivity. It may eventake on values of 1.1+ in fissured geomaterials. If only SIunits are used (kPa), the form simply becomes:
� � � �� �p t vmq033. ( ) ( )o in kPa (18)
For soft organic clays, it appears the exponent takeson value of around m’ = 0.9 � 0.1, thus site-specific calibra-tions will be required when working with these soils. As in-dicated in Section 3.5, an alternate approach is to adoptm’ = 1 and employ a lower coefficient.
5.1. Yield stress exponent from CPT material index
The CPT material index Ic is used to evaluate soil be-havioral type from cone penetrometer readings in naturalsoil formations (e.g., Riyis & Giacheti 2017), mine tailings(Schnaid et al., 2014), and soil liquefaction assessment(Rodrigues et al., 2016). Details are given by (Robertson2009) where the index is determined by:
I Q Fc tn� � � �( . log ) ( . log )3 47 1222 2 (19)
where Qtn = normalized cone resistance that is defined by:
Q
q
tn
t v
atm
v
atm
n�
�
��
���
�
���
�
�
�
�
o
o
(20)
and the normalized sleeve friction (F) is determined from:
Ff
qs
t v
(%) ��
100
� o
(21)
The exponent “n” varies from 1 in intact clays toaround 0.5 in sands. It is specifically determined from(Robertson 2009):
n I cv
atm
� ���
���
�
��� � �0381 0 05 0 05 10. . . .
�
�o (22)
Thus, an iterative solution is needed to find Ic. Interms of soil classification, sands are identified whenIc < 2.05 while clays are found when Ic > 2.95. Intermediatesoil types to these values include sandy mixtures and siltymixtures that are separated at Ic = 2.60, which is also thethreshold for soil behavior: i.e., drained when Ic < 2.60 andundrained when Ic > 2.60.
The material index Ic also provides a means of quanti-fying the magnitude of the yield stress exponent m’ for theautomatic CPT profiling of �p’ in homogeneous soils, het-erogeneous deposits, mixed geomaterials, and stratifiedformations. Figure 10 shows the trend between m’ and CPTindex (Ic) given by:
� � �
��
��
�
��
mI c
10 28
1265
25
.
.
(23)
Where possible, the interpreted �p’ results should be cross-checked and validated with other information, such as theresults from one-dimensional consolidation tests on high-quality undisturbed samples, as well as the geologic stresshistory. In certain cases, additional results and corrobora-tion may be obtained by running other in-situ tests, such asthe flat plate dilatometer test (DMT) and/or vane shear test(VST), as discussed elsewhere (Schnaid 2009).
5.2. British Columbia
A representative SCPTu sounding shows a stratifiedsoil profile from the Golden Ears Bridge south of Vancou-ver, British Columbia in Fig. 11 (Niazi et al., 2010). Theprofile indicates silty to sandy layers that occupy the upper40 m and overlie deeper deposits of clays to sensitive claysthat extend to at least 95 m below grade. The sand-clay de-marcation is evident from the change in porewater pres-sures readings at around 40 m, as well as the CPT materialindex profile shown in Fig. 12. Yet despite the abrupt tran-sitions from silts to sands to clays, the post-processing ofthe CPT data in these geologically-related Holocene units
Soils and Rocks, São Paulo, 40(3): 203-216, September-December, 2017. 209
Stress History of Soils from Cone Penetration Tests
Figure 9 - Yield stress vs. net cone resistance for wide range ofgeomaterials (after Mayne, Coop, Springman, Huang, andZornberg 2009).

shows a consistent and gradual yield stress profile indicat-ing lightly-overconsolidated sediments with low YSRs. Al-though no lab consolidation tests were available, estimated
yield stresses from shear wave velocity measurements(Mayne 2005) confirm the low values of YSR � 1.5, asshown by Fig. 12.
210 Soils and Rocks, São Paulo, 40(3): 203-216, September-December, 2017.
Mayne
Figure 10 - Exponent m’ for yield stress evaluation vs. CPT material index in non-cemented quartz-silica sands and inorganic clays oflow sensitivity.
Figure 11 - Representative SCPTu at Golden Ears Bridge, BC (Niazi et al., 2010).

6. Soil Liquefaction
Two primary concerns in soil dynamics include: (a)flow liquefaction associated with mine tailings and damstability; and (b) cyclic liquefaction caused by earthquakes.For both topics, critical state soil mechanics (CSSM) pro-vides a rational and useful framework for the understandingand evaluation of soils that are prone to liquefaction (Vianada Fonseca 2011).
The approach to using CSSM for flow and cyclic liq-uefaction in sands has been via use of the state parameter:� = e0 - eCSL, where e0 = initial in-situ void ratio andeCSL = void ratio at critical state for constant effective stress(Jefferies & Been 2006; Idriss & Boulanger 2008). Sandsthat are prone to liquefaction are contractive and have acharacteristic � > 0, while in contrast, dilative sands are notso susceptible and exhibit� < 0. The value of� = 0 is there-fore a theoretical screening value, however, often a thresh-old � = -0.05 has been adopted for practical purposes andconservative benchmark (Robertson 2010).
While � works well, the methodology can be alterna-tively represented in terms of YSR just as effectively.Herein, we shall explore its vantages within a simplifiedversion of CSSM (Mayne et al., 2009; Holtz et al., 2011).As presented in Fig. 13, the critical state line (CSL) can berepresented in terms of � as a drained stress path, or alter-nately as an equivalent YSR, termed YSRCSL. In fact, YSRand � have been interrelated through their compressibilityparameters (Cc, Cs) and frictional properties (�’), as shownby Been et al. (1988) and Plewes et al. (1992).
For the mode of simple shear, simplified CSSM pro-vides the magnitude of excess porewater pressures duringundrained shearing:
� �u v� � � � �( cos )1 12
� �YSR o (24)
For clays, a characteristic value of � = 0.80 � 0.10 iswell recognized (Ladd & DeGroot, 2003). Compressibilityparameters for various sands were reviewed by Been et al.(1987) including Monterey, Ticino, Hokksund, Ottawa,Reid Bedford, and Hilton Mines. The measured Cc and Cs
values indicate an overall mean � = 0.790 withS.D. = 0.164 (n = 24) for these sands. Thus, the value of
Soils and Rocks, São Paulo, 40(3): 203-216, September-December, 2017. 211
Stress History of Soils from Cone Penetration Tests
Figure 12 - Interpreted profiles at Golden Ears Bridge: (a) CPT material index; (b) soil behavioral type; and (c) effective yield stresses.
Figure 13 - Simplified critical state soil mechanics and definitionof state parameter.
� = 0.80 can be considered characteristic for soils in gen-eral.
The boundary separating contractive and dilative soilbehavior is defined when �u = 0 during undrained shear.The corresponding YSR at critical state is then calculatedas:
YSRCSL ��
�
���
�
���
21
cos �
�
�� �
Analogous to the � threshold, this YSRCSL becomesthe threshold for identifying contractive unstable soils fromthose that are dilative and rather stable (Mayne et al., 2017).In fact, Robertson (2012) suggested that a YSR = 4 was areasonable threshold for this purpose.
For purposes of calculating the yield stress ratio at thecritical state, the following equations can be recommendedfor the effective friction angle (Mayne 2007a):
when Ic < 2.6,
�’ = 17.6° + 11.0° log (Qtn)
when Ic > 2.6,
�’ = 29.5°Bq
0.121 [0.256 + 0.336Bq + log(Qtn)]
6.1. Flow liquefaction example - tailings
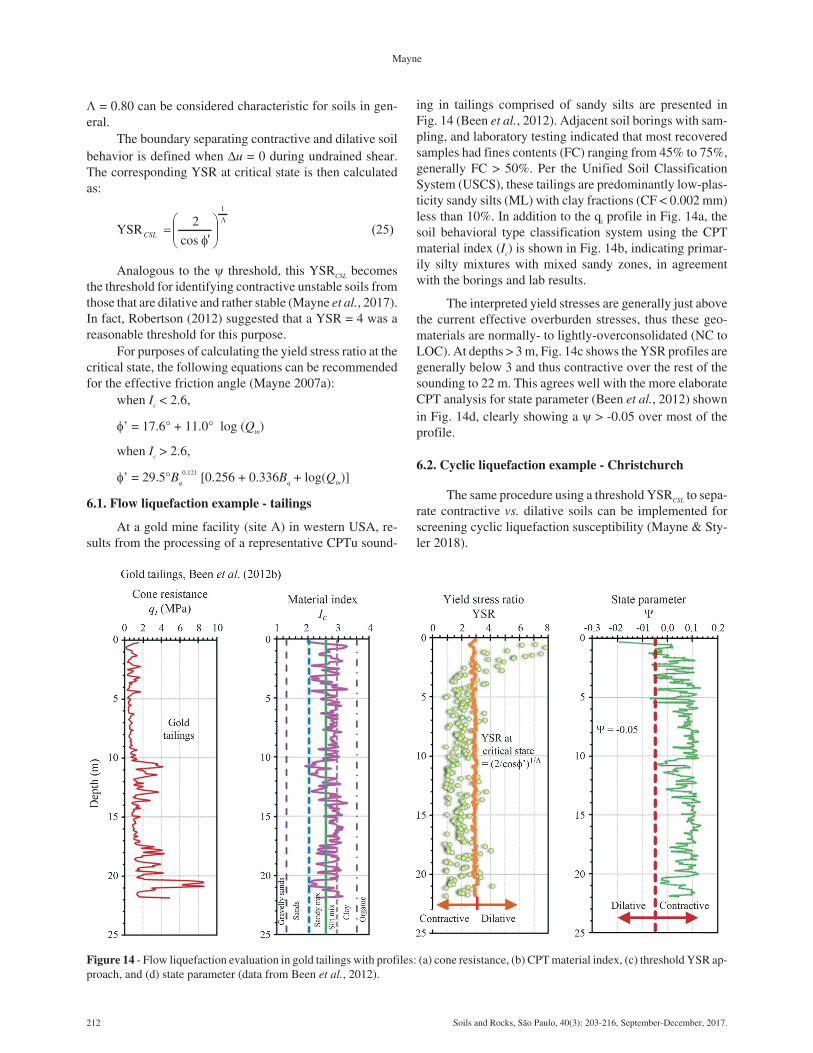
At a gold mine facility (site A) in western USA, re-sults from the processing of a representative CPTu sound-
ing in tailings comprised of sandy silts are presented inFig. 14 (Been et al., 2012). Adjacent soil borings with sam-pling, and laboratory testing indicated that most recoveredsamples had fines contents (FC) ranging from 45% to 75%,generally FC > 50%. Per the Unified Soil ClassificationSystem (USCS), these tailings are predominantly low-plas-ticity sandy silts (ML) with clay fractions (CF < 0.002 mm)less than 10%. In addition to the qt profile in Fig. 14a, thesoil behavioral type classification system using the CPTmaterial index (Ic) is shown in Fig. 14b, indicating primar-ily silty mixtures with mixed sandy zones, in agreementwith the borings and lab results.
The interpreted yield stresses are generally just abovethe current effective overburden stresses, thus these geo-materials are normally- to lightly-overconsolidated (NC toLOC). At depths > 3 m, Fig. 14c shows the YSR profiles aregenerally below 3 and thus contractive over the rest of thesounding to 22 m. This agrees well with the more elaborateCPT analysis for state parameter (Been et al., 2012) shownin Fig. 14d, clearly showing a � > -0.05 over most of theprofile.
6.2. Cyclic liquefaction example - Christchurch
The same procedure using a threshold YSRCSL to sepa-rate contractive vs. dilative soils can be implemented forscreening cyclic liquefaction susceptibility (Mayne & Sty-ler 2018).
212 Soils and Rocks, São Paulo, 40(3): 203-216, September-December, 2017.
Mayne
Figure 14 - Flow liquefaction evaluation in gold tailings with profiles: (a) cone resistance, (b) CPT material index, (c) threshold YSR ap-proach, and (d) state parameter (data from Been et al., 2012).

A selected liquefaction case study at Site 19 in Brigh-ton, a suburb of Christchurch, New Zealand that had expe-rienced damages during the 2010-2011 sequences of largeearthquakes will be used for illustration. Full details on theliquefaction site are given in Green et al. (2014) and a quicksummary of the post-processing of the CPTu sounding ispresented in Fig. 15. The measured cone tip resistance (qt)is shown in Fig. 15a with corresponding soil behavior typeby CPT index Ic given in Fig. 15b, indicating primarilysands over the 14 m profile, with a shallow silty sand tosandy silt evident in the 2 to 3 m depth range.
Using the YSRCSL threshold clearly shows contractivesoil layer in the 2-3 m depths and a thicker critical layerfrom 6 to 10.5 m. A full cyclic stress-based liquefactionanalysis was performed for this site using the standard pro-cedures (Robertson & Wride 1998; Youd et al., 2001). Thisapproach involves a number of steps, including: (a) evalu-ating of the cyclic stress ratio, CSR; (b) adoption of athreshold triggering curve termed the cyclic resistance ra-tio, CRR; (b) calculating the stress-normalized cone resis-tance, Qtn; (c) evaluating CPT index, Ic; (d) correcting thecone resistance to an equivalent value for clean sands, des-ignated: Qtn-cs based on estimated fines content: Qtn-cs = Kc
Qtn. For this site, a moment magnitude Mw = 6.2 and peakground acceleration PGA = 0.35 g were used in the stan-dard liquefaction procedures to determine the level ofground shaking (i.e., CSR) and the calculated Qtn-cs profileprovided the available soil resistance. This determined therelative profiles of CSR7.5 and CRR7.5 as shown in Fig. 15d.Green et al. (2014) identified sand layer 1 as the critical
layer, yet the analyses also showed a thinner and shallowersandy layer that has a high probability of liquefaction. Forboth layers, the threshold YSR approach clearly recognizesthese two sand layers as contractive. Those layers matchwell with the layers identified by the more rigorous and de-tailed post-processing procedures.
6.3. Flow liquefaction analysis at Neves Corvo mine,Portugal
Results from CPT and laboratory testing in copperand copper-tin mine tailings at the Neves Corvo mine insouthern Portugal are reported by Been et al. (2002). Soun-ding CPT-001 has been post-processed to look at the flowliquefaction potential in these fine-grained tailings, as pre-sented in Fig. 16. The tailings are a special paste fill withcement added to increase stability. Results are shown forthe following: (a) cone tip resistance, (b) material index ac-cording to Robertson (2009), (c) YSR and threshold valueat CSL; (d) state parameter per the Jefferies & Been (2006)type analysis reported by Been et al. (2002). For the latter, azone from 4 to 18 m is indicated to be contractive based onthe � criterion. Using the YSR criterion, however, a muchlarger zone of tailings can be considered contractive.
7. Conclusions
A generalized approach to profiling yield stresses insoils from cone penetration tests has been developed fromthree primary sources: (a) analytical cavity expansion - crit-ical state solution for clays; (b) database of large calibrationchamber tests on sands; (c) field and lab data from world-
Soils and Rocks, São Paulo, 40(3): 203-216, September-December, 2017. 213
Stress History of Soils from Cone Penetration Tests
Figure 15 - Cyclic liquefaction case study in natural sands at Site 19, Brighton, Christchurch with profiles: (a) cone resistance, (b) CPTmaterial index, (c) threshold YSR approach, and (d) traditional CRR-CSR comparison (data from Green et al., 2014).

wide sites for verification and geoparameter backfitting. InSI units of kilopascal, the yield stress is evaluated simplyfrom �p’ = 0.33(qnet)
m’ where the exponent m’ tracks wellwith CPT material index, Ic. The yield stress ratio(YSR = �p’/�vo’) demarcates the sorting of normally-con-solidated and overconsolidated soils, thus used extensivelyin embankment and foundation settlement analyses. TheYSR also affects the normalized undrained shear strength(su/�vo’), porewater pressures during shear (�u/�vo’), soilstiffness (e.g., Eu, Gmax), as well as the initial state (K0).Moreover, YSR within a critical state framework can beused to distinguish contractive and dilative soil behavior,thus find application in problems involving flow and cyclicliquefaction.
AcknowledgmentsThe author appreciates the support of ConeTec Inves-
tigations of Richmond, British Columbia and MinnesotaDepartment of Transportation in St. Paul in research activi-ties on cone penetration testing.
ReferencesAgaiby, S. & Mayne, P.W. (2018). Modified SCE-CSSM
solution for CPTu soundings in sensitive clays. Paper inpreparation. Civil & Environmental Engineering, Geor-gia Tech.
Baligh, M.M. (1986). Undrained deep penetration: Porepressures. Geotechnique, 36(4):487-501.
Baroni, M. & Almeida, M.S.S. (2017). Compressibility andstress history of very soft organic clays. Proc. Inst. Civ.Eng. – Geotechnical Engineering, 170(2):148-160.
Been, K.; Jefferies, M.G.; Crooks, J.H.A. & Rothenburg, L.(1987). The cone penetration test in sands: Part II, gen-eral inference of state. Geotechnique, 37(3):285-299.
Been, K.; Crooks, J.H.A. & Jefferies, M.G. (1988). Inter-pretation of Material State From the CPT in Sands andClays. Penetration Testing in the U.K. Thomas Telford,London, pp. 215-220.
Been, K.; Brown, E.T. & Hepworth, N. (2002). Liquefac-tion potential of paste fill at Neves Corvo mine, Portu-gal. Mining Technology, 111(1):47-58.
Been, K.; Romero, S.; Obermeyer, J. & Hebeler, G. (2012).Determining in-situ state of sand and silt tailings fromthe CPT. Proc. 12th Tailings and Mine Wastes, Key-stone, Colorado State University.
Burns, S.E. & Mayne, P.W. (2002). Analytical cavity ex-pansion-critical state model for piezocone dissipation infine-grained soils. Soils & Foundations, 42(2):131-137.
Casagrande, A. (1936). The determination of the precon-solidation load and its practical significance. Proc. 1stIntl. Conf. on Soil Mechanics & Foundation Engi-neering, Harvard Univ., Cambridge, v. 3, pp. 60-64.
Casey, B.; Germaine, J.T.; Abdulhadi, N.O.; Kontopoulos,N.S. & Jones, C.A. (2016). Undrained Young’s modu-lus of fine-grained soils. J. Geotechnical & Geoenviron-mental Engineering, 1090-0241/04015070.
Chen, B.S-Y. & Mayne, P.W. (1994). Profiling theOverconsolidation Ratio of Clays by Piezocone Tests.Report GIT-CEEGEO-94-1 to National Science Foun-dation by Georgia Tech Research Corp., Atlanta, 280 p.Download at http://geosystems.ce.gatech.edu/Fac-ulty/Mayne.
214 Soils and Rocks, São Paulo, 40(3): 203-216, September-December, 2017.
Mayne
Figure 16 - Flow liquefaction analysis in copper tailings in southern Portugal with profiles: (a) cone resistance, (b) CPT material index,(c) threshold YSR approach, and (d) state parameter (Note: CPT data and interpreted � from Been et al., 2002).

Chen, B.S-Y. and Mayne, P.W. (1996). Statistical relation-ships between piezocone measurements and stress his-tory of clays. Canadian Geotechnical J., 33(3):488-498.
Coutinho, R.Q. & Bello, M.I.M.C.V. (2014). Geotechnicalcharacterization of Suape soft clays, Brazil. Soils &Rocks, 37(3):257-276.
Demers, D. & Leroueil, S. (2002). Evaluation ofpreconsolidation pressure and the overconsolidation ra-tio from piezocone tests of clay deposits in Quebec. Ca-nadian Geotechnical Journal, 39(1):174-192.
Diaz-Rodriguez, J.A.; Leroueil, S. & Alem n, J.D. (1992).Yielding of Mexico City clay and other natural clays.Journal of Geotechnical Engineering, 118(7):981-995.
Doherty, P.; Kirwan, L.; Gavin, K. & Igoe, D. (2012). Soilproperties at the UCD geotechnical research site atBlessington. Proc. Bridge and Concrete Research in Ire-land, Dublin Institute of Technology and Trinity Col-lege Dublin, p. 499-504.
Eller, J.M.; McCullough, N.J.; Vargas-Herrera, L.A. &Coto-Loría, M. (2014). Role of CPTu in design of largeAtlantic port terminal in Costa Rica. Proc. 3rd IS ConePenetration Testing, Las Vegas, pp. 1129-1138.
Gavin, K., Cadogan, D., Tolooiyan, A. & Casey, P. (2013).The base resistance of non-displacement piles in sand.Part I. Proc. ICE – Geotechnical Engineering,166(6):540-548.
Green, R.A.; Cubrinovski, M.; Cox, B.; Wood, C.; Wo-therspoon, L.; Bradley, B. & Maurer, B. (2014). Selectliquefaction case histories from the 2010-2011 Canter-bury earthquake sequence. Earthquake Spectra,30(1):131-153.
Holtz, R.D.; Kovacs, W.D. & Sheehan, T.C. (2011). An In-troduction to Geotechnical Engineering, Second Edi-tion. Pearson Publishing, Upper Saddle River, 864 p.
Idriss, I.M. & Boulanger, R.W. (2008), Soil Liquefactionduring Earthquakes. Earthquake Engineering ResearchInstitute, Monograph 12, EERI MNO-12, Oakland,266 p.
Jamiolkowski, M. & Pepe, M.C. (2001). Vertical yieldstress of Pisa clay from piezocone tests. Journal ofGeotechnical & Geoenvironmental Engineering,127(10):893-897.
Jardine, R.J.; Smith, P.R. & Nicholson, D.P. (2003). Prop-erties of the soft Holocene Thames estuary clay fromQueensborough, Kent. In: Characterisation and Engi-neering Properties of Natural Soils. Swets & Zeitlinger,Lisse, v. 1, pp. 599-643.
Jefferies, M. & Been, K. (2006). Soil Liquefaction: A Criti-cal State Approach. Taylor and Francis Group, London,480 p.
Karlsrud, K.; Lunne, T.; Kort, D.A. & Strandvik, S. (2005).CPTU correlations for clays. Proc. 16th InternationalConference on Soil Mechanics and Geotechnical Engi-neering, Osaka, v. 2, pp. 693-702.
Krage, C.P.; Broussard, N.S. & DeJong, J.T. (2014). Esti-mating rigidity index based on CPT measurements.Proc. 3rd Intl. Symposium on Cone PenetrationTesting, CPT’14, Las Vegas, www.cpt14.com.
Ku, T. & Mayne, P.W. (2013). Yield stress history evalu-ated from paired in-situ shear moduli of differentmodes. Engineering Geology, 152(1):122-132.
Ladd, C.C. & DeGroot, D.J. (2003). Recommended prac-tice for soft ground site characterization. Soil & RockAmerica 2003. Proc. 12th Pan American Conference,MIT, Verlag Glückauf Publishing, Essen, v. 1, pp. 3-57.
Larsson, R. & Mulabdic, M. (1991). Piezocone Tests inClay. SGI Report 42. Swedish Geotechnical Institute,Linköping, 240 p.
Larsson, R. & Åhnberg, H. (2003). Long-term effects of ex-cavations at crests of slopes. SGI Report 61. SwedishGeotechnical Institute, Linköping, 372 p.
Larsson, R. & Åhnberg, H. (2005). On the evaluation of un-drained shear strength and preconsolidation pressurefrom common field tests in clays. Canadian Geo-technical Journal, 42(4):1221-1231.
Larsson, R.; Westerberg, B.; Albing, D.; Knutsson, S. &Carlsson, E. (2007). Sulfidjord. SGI Report 69. Swed-ish Geotechnical Institute, Linköping, 138 p.
Leroueil, S. & Barbosa, P.S. de A. (2000). Combined effectof fabric, bonding, and partial saturation on yielding ofsoils. Proc. Unsaturated Soils for Asia, Balkema, Rot-terdam, pp. 527-532.
Locat, J.; Tanaka, H.; Tan, T.S.; Dasari, G.R. & Lee, H.(2003). Natural soils: Geotechnical behavior and geo-logical knowledge. Proc. Characterisation & Engi-neering Properties of Natural Soils. Swets & Zeitlinger,Lisse, v. 1, pp. 3-28.
Long, R.P.; Healy, K.A. & Carey, P.J. (1978). Final report:Field consolidation of varved clay. Univ. ConnecticutReport JHR 78-113, Project 70-3 to Connecticut Dept.of Transportation, 162 p.
Mayne, P.W. (1991). Determination of OCR in clays bypiezocone tests using cavity expansion and critical stateconcepts. Soils and Foundations, 31(2):65-76.
Mayne, P.W. (2001). Stress-strain-strength-flow parame-ters from enhanced in-situ tests. Proc. InternationalConference on In-Situ Measurement of Soil Properties& Case Histories, Bali, Indonesia, pp. 27-47.
Mayne, P.W. (2005). Integrated ground behavior: In-situand lab tests. Deformation characteristics of geoma-terials. Proc. IS Lyon’03, Taylor & Francis Group, Lon-don, v. 2, pp. 155-177.
Mayne, P.W. (2007a). Synthesis 368: Cone PenetrationTesting. NCHRP, Transportation Research Board, Na-tional Academy Press, Washington, DC, 118 p.www.trb.org.
Mayne, P.W. (2007b). In-situ test calibrations for evaluat-ing soil parameters, characterization & engineering pro-
Soils and Rocks, São Paulo, 40(3): 203-216, September-December, 2017. 215
Stress History of Soils from Cone Penetration Tests

perties of natural soils. Proc. Singapore 2006, Taylor &Francis Group, London, v. 3, pp. 1602-1652.
Mayne, P.W.; Coop, M.R.; Springman, S.; Huang, A-B. &Zornberg, J. (2009). SOA-1: Geomaterial behavior andtesting. Proc. 17th Intl. Conf. Soil Mechanics & Geo-technical Engrg. ICSMGE, Alexandria, Millpress/IOSPress Rotterdam, v. 4, pp. 2777-2872.
Mayne, P.W. (2013). Updating our geotechnical curriculavia a balanced approach of in-situ, laboratory, and geo-physical testing of soil. Proc. 61st Annual GeotechnicalConference, Minnesota Geotechnical Society, Univer-sity of Minnesota, St. Paul, pp. 65-86.
Mayne, P.W. (2015). Keynote lecture: In-situ geocharac-terization of soils in the year 2016 and beyond. Ad-vances in Soil Mechanics: Geotechnical Synergy. Proc.PCSMGE, Buenos Aires. IOS Press, Amsterdam, v. 5,pp. 139-161.
Mayne, P.W.; Styler, M.; Woeller, D.J. & Sharp, J. (2017).Identifying contractive soils by CPT material index forflow liquefaction concerns. Proc. GeoOttawa - 70th Ca-nadian Geotechnical Conference, CanadianGeotechnical Society: www.cgs.ca.
Mayne, P.W. & Styler, M. (2018). Soil liquefaction evalua-tion using CPT yield stress profiles and simplified criti-cal state soil mechanics. Proc. Geotechnical EarthquakeEngineering and Soil Dynamics V, Austin, TX.
Niazi, F.; Mayne, P.W. & Woeller, D. (2010). Evaluatingdrilled shaft O-cell response at Golden Ears Bridgefrom in-situ seismic cone tests. The Art of FoundationEngineering Practice. Proc. Volume in Honor of ClydeBaker (GSP 198), ASCE, Reston, Virginia, pp. 452-469.
Plewes, H.D.; Davies, M.P. & Jefferies, M.G. (1992).CPT-based screening procedure for evaluating lique-faction susceptibility. Proc. 45th Canadian GeotechnicalConference, Paper 4, Toronto, Canadian Geotech Soci-ety: www.cgs.ca.
Riyis, M.T. & Giacheti, H.L. (2017). Resistivity piezoconein the conceptual site model definition. Soils & Rocks,40(2):93-107.
Robertson, P.K. & Wride, C.E. (1998). Evaluating cyclicliquefaction potential using the cone penetration test.Canadian Geotechnical J., 35(3):442-459.
Robertson, P.K. (2009). Interpretation of cone penetrationtests: A unified approach. Canadian Geotechnical Jour-nal, 46(11):1337-1355.
Robertson, P.K. (2010). Evaluation of flow liquefactionand liquefied strength using the cone penetration test. J.Geotechnical & Geoenvironmental Engineering,136(6):842-853.
Robertson, P.K. (2012). The James K. Mitchell Lecture: In-terpretation of in-situ tests - Some insights. Proc. Geo-technical & Geophysical Site Characterization 4, Per-nambuco, Taylor & Francis Group, London, v. 1,pp. 3-24.
Rodrigues, C.; Amoroso, S.; Cruz, N. & Viana da Fonseca,A. (2016). Liquefaction assessment CPTu tests in a sitein south Portugal. Geotechnical & Geophysical SiteCharacterization 5 (ISC-5), Australian GeomechanicsSociety, v. 1, pp. 633-638.
Schnaid, F. (2009). In Situ Testing in Geomechanics – TheMain Tests. Taylor & Francis, London and New York,352 p.
Schnaid, F.; Nierwinski, H.P.; Bedin, J. & Odebrecht, E.(2014). On the characterization and classification ofbauxite tailings. Soils & Rocks, 37(3):277-284.
Teh, C.I. & Houlsby, G.T. (1991). An analytical study ofthe cone penetration test in clay. Geotechnique,41(1):17-34.
Viana da Fonseca, A.; Coop, M.R.; Fahey, M. & Consoli,N.C. (2011). The interpretation of conventional andnon-conventional laboratory tests for challenging geo-technical problem. Proc. IS Deformation Characteris-tics of Geomaterials, Seoul, v. 1, pp. 84-119.
Youd, T.L., Idriss, I., Andrus, R.D., Arango, I., Castro, G.,Christian, J.T., Dobry, R., Finn, W.D.L., Harder Jr.,L.F., Hynes, M.E., Ishihara, K., Koester, J.P., Liao,S.S.C., Marcuson III, W.F., Martin, J.R., Mitchell, J.K.,Moriwaki, Y., Power, M.S., Robertson, P.K., Seed,R.B. & Stokoe, K.H. (2001). Liquefaction Resistance ofSoils: Summary Report from the 1996 NCEER and1998 NCEER/NSF Workshops on Evaluation of Lique-faction Resistance of Soils. Journal of Geotechnical andGeoenvironmental Engineering, 127(10):817-833.
216 Soils and Rocks, São Paulo, 40(3): 203-216, September-December, 2017.
Mayne