STRESS ANALYSIS OF THE SEPARATOR IN A LITHIUM …329/datastream/OBJ/... · stress analysis of the...
85
STRESS ANALYSIS OF THE SEPARATOR IN A LITHIUM-ION BATTERY By Danghe Shi A THESIS Submitted to Michigan State University in partial fulfillment of the requirements for the degree of MASTER OF SCIENCE Mechanical Engineering 2010
Transcript of STRESS ANALYSIS OF THE SEPARATOR IN A LITHIUM …329/datastream/OBJ/... · stress analysis of the...

STRESS ANALYSIS OF THE SEPARATOR IN A LITHIUM-ION
BATTERY
By
Danghe Shi
A THESIS
Submitted to
Michigan State University
in partial fulfillment of the requirements
for the degree of
MASTER OF SCIENCE
Mechanical Engineering
2010

ABSTRACT
STRESS ANALYSIS OF THE SEPARATOR IN A LITHIUM ION
BATTERY
By
Danghe Shi
A separator is a porous membrane that prevents the physical contact between the positive and
negative electrodes while enabling ionic transport. The integrity of the separator is vital to the
performance and reliability of a battery. Presently, there is no method to evaluate the stress in a
separator in situ in a battery. In this research, a numerical model is developed to address this
need. The stress in a separator is mainly caused by thermal expansion differential between
battery components and lithium diffusion induced deformation in the electrodes. To compute the
lithium concentration distribution and temperature change during battery operation, multi-
physics models were developed in COMSOL, and then mapped to a macro-scale prismatic cell
model in ANSYS. In this macro-scale model, the porous battery components were treated as
homogenized media and represented with the effective properties estimated using the rule of
mixtures for a composite material. The stress analysis showed that the maximum stress in the
separator always emerged in the area around the inner corner where the separator wrapped
around the edge of an anode and when the lithium ion battery was fully charged. Numerical
simulations were also conducted to investigate the influences of three groups of design
adjustable parameters on the locations and magnitudes of the maximum strain and stress of the
separator. The predicted results provide the reference conditions for the improvement of
separator materials and for the design of lithium ion batteries.

iii
ACKNOWLEDGEMENTS
I would like to express my deepest gratitude to my supervisor, Dr. Xinran Xiao. She guided me
onto the road of research, shared her life experience with me and instructed me to be an
independent thinker. Without her guidance, encouragement, understanding and patience, it would
have been impossible for me to finish this thesis. I thank everything she did for me. Many thanks
also go to Dr. Soonsung Hong and Dr. Farhang Pourboghrat for their participation in the thesis
committee and helpful suggestions.
I am also grateful for those people who kindly helped me throughout this research. Firstly, I
would like to thank Wei Wu for her willingness to discuss on problems and share her valuable
knowledge with me all the time. I puzzled over many problems with her. Secondly, I want to
give a special thanks to Dr. Xiaosong Huang and Dr. H. G. Kia of General Motors Company for
their support and guidance. They provided the background information for this research, and
feedbacks and suggestions during the progress of this thesis. Then, I want to thank Dr. Jixing
Wang and Dr. Zichao Huang for their technique support and helpful discussion. Last, I would
also like to thank Samuel Goodsitt for proofreading the thesis.
I also want to express my appreciation to my friends: Fang Hou, Wenzhe Zhu, Jifeng Wang, Zi
Liang, Hai Zhang, and Yalla Abushawashi. Thank them for participating in my life. Without
them, it‟s impossible to have such wonderful and memorable life here. Finally, and most

iv
importantly, I would like to thank my parents, my grandmother and my sister. Their endless love
and support are always the most powerful driving force of my life.
This research is supported by General Motors Company under a research contract ND4306101-
LT442.

v
TABLE OF CONTENTS
LIST OF TABLES ................................................................................................................... vii
LIST OF FIGURES ................................................................................................................ viii
CHAPTER 1 INTRODUCTION .................................................................................................1
1.1 Lithium-Ion Battery .......................................................................................................1
1.2 Separator .......................................................................................................................2
1.2.1 Functions of Separators .......................................................................................3
1.2.2 Characterizations of Separators ...........................................................................3
1.3 Stress Sources in the Separator ......................................................................................5
1.4 Summary of a Literature Review ...................................................................................6
1.5 Scope of the Work .........................................................................................................8
1.6 Scope of the Thesis ...................................................................................................... 10
CHAPTER 2 METHODS.......................................................................................................... 12
2.1 Multiple Phenomena Occurred inside the Lithium-Ion Battery ..................................... 12
2.1.1 Electrochemical Phenomena.............................................................................. 12
2.1.2 Thermal Phenomena ......................................................................................... 17
2.1.3 Mechanical Phenomena ..................................................................................... 19
2.2 Multi-physics Coupling ............................................................................................... 20
2.2.1 Lithium and Temperature Distributions ............................................................. 20
2.2.2 Stress Analysis .................................................................................................. 23
CHAPTER 3 MODEL .............................................................................................................. 24
3.1 Model Depiction .......................................................................................................... 25
3.1.1 Structure and Dimensions ................................................................................. 25
3.1.2 Boundary Conditions ........................................................................................ 26
3.2 Material Properties ...................................................................................................... 28
3.2.1 Effective Property ............................................................................................. 30
3.2.2 Material Constants ............................................................................................ 33
CHAPTER 4 SIMULATION .................................................................................................... 35
4.1 Simulation Conditions ................................................................................................. 35
4.2 Effective Length .......................................................................................................... 37
4.3 Thermal Effect ............................................................................................................. 39
4.3.1 Temperature Change ......................................................................................... 39
4.3.2 Thermal Effect .................................................................................................. 41
4.4 Model Validation ......................................................................................................... 44
4.5 Results and Discussion ................................................................................................ 44
4.5.1 Friction ............................................................................................................. 45
vi
4.5.2 Pressure ............................................................................................................ 49
4.5.3 Combination of Friction and Pressure................................................................ 52
4.5.4 Temperature ...................................................................................................... 54
4.5.5 Particle Radius .................................................................................................. 56
4.5.6 Thickness of Separator ...................................................................................... 60
CHAPTER 5 SUMMARY AND CONCLUSION ..................................................................... 62
5.1 Summary and Conclusion ............................................................................................ 62
5.2 Future Work ................................................................................................................ 64
5.2.1 Improvement of the Model ................................................................................ 64
5.2.2 Fundamental Studies on Material Constitutive Behaviors .................................. 65
APPENDIX A ........................................................................................................................... 67
APPENDIX B ........................................................................................................................... 68
APPENDIX C ........................................................................................................................... 71
REFERENCES ......................................................................................................................... 73

vii
LIST OF TABLES
Table 1.1 Comparison of typical properties of some commercial separators [9] ...........................5
Table 2.1 Initial species concentration ....................................................................................... 17
Table 3.1 Dimensions of the model ........................................................................................... 26
Table 3.2 Material property of different components in a lithium-ion battery............................. 33
Table 4.1 Assumed SOCs for both electrodes ............................................................................ 35
Table 4.2 Comparisons of the models with and without thermal effect ...................................... 43
Table 4.3 Categories of potential factors.................................................................................... 44
Table 4.4 Three pairs of particle radius...................................................................................... 57
Table A.1 Electrochemical boundary conditions for pseudo 2-D models [10,13] ....................... 67
Table B.1 Correspondence between thermal and mass diffusion parameters .............................. 70
34

viii
LIST OF FIGURES
Figure 1.1 Schematic of a typical lithium-ion battery (For interpretation of the references to color
in this and all other figures, the reader is referred to the electronic version of this thesis.) ............2
Figure 1.2 Schematic of a pouch cell ...........................................................................................9
Figure 2.1 Relationship between ionic conductivity and lithium concentration in electrolyte ..... 14
Figure 2.2 OCP of negative electrode and positive electrode ..................................................... 17
Figure 2.3 TU/ for anode ( 6LiC ) and cathode ( 42OLiMn ) .................................................. 19
Figure 2.4 Schematic of multiphysics coupling ......................................................................... 21
Figure 2.5 Lithium distributions in the real 2-D model .............................................................. 23
Figure 3.1 Schematic of the structure of the model .................................................................... 25
Figure 3.2 Thermal boundary conditions ................................................................................... 27
Figure 3.3 Schematic of mechanical boundary conditions for the real 2-D model ...................... 28
Figure 4.1 Final SOC of both anode and cathode ....................................................................... 36
Figure 4.2 Contours of strain components near the corner ......................................................... 38
Figure 4.3 Strain components versus model length .................................................................... 38
Figure 4.4 Macro scale 2-D model in ANSYS ........................................................................... 39
Figure 4.5 Temperature distribution of the whole battery........................................................... 40
Figure 4.6 X-displacement of the battery model ........................................................................ 41
Figure 4.7 Von Mises stress of the battery model ...................................................................... 43
Figure 4.8 1st principle stress of the battery ............................................................................... 43
Figure 4.9 Stresses versus friction coefficient ............................................................................ 46
Figure 4.10 Von Mises stress in the corner under different friction coefficient conditions ......... 47
Figure 4.11 Von Mises stress of the separator ............................................................................ 48

ix
Figure 4.12 Von Mises stress of the stable area of the separator ................................................ 48
Figure 4.13 Effect of pressure on (a) the average strain components, (b) the Von Mises stress of
the separator. ............................................................................................................................. 50
Figure 4.14 Von Mises stress condition of the separator under different pressures ..................... 51
Figure 4.15 Influences of both pressure and friction on the strain & stress conditions of the
separator ................................................................................................................................... 53
Figure 4.16 Maximum Von Mises stress of the separator versus temperature change ................. 55
Figure 4.17 Von Mises stress condition of the separator around the corner ................................ 56
Figure 4.18 Concentration distributions along the thickness of the electrodes ............................ 58
Figure 4.19 Maximum Von Mises stress of the separator under the conditions with different
particle radii .............................................................................................................................. 59
Figure 4.20 Von Mises stress of the separator versus thickness.................................................. 61
1
CHAPTER 1 INTRODUCTION
Lithium-ion batteries are widely used in portable electronics such as cell phones and mobile
computers. When compared with traditional batteries such as NiMH, lithium-ion technology
offers superior charging efficiency, stores more energy and provides a higher discharge power
density per weight and volume. The technology has been quickly advanced since its first
commercial introduction in 1991 by Sony. Today lithium-ion batteries are gradually being
implemented in the automotive industry with electric vehicles (EVs), hybrid vehicles (HEVs),
and plug-in hybrid vehicles (PHEVs).
1.1 Lithium-Ion Battery
Lithium-ion batteries are generally composed of three primary components: anode, cathode and
separator. The anode in a conventional lithium-ion battery is composed of carbon; the cathode is
made of lithium transition-metal oxides or lithium metal phosphates, and the separator is
synthetic polymers. All of them are placed in the electrolyte, which is a lithium salt in an organic
solvent [1, 2]. Figure 1.1 is a schematic of how lithium-ion battery cells operate. Lithium, which
resides within the crystal structure of the electrodes, carries current between the anode and
cathode when a battery is in operation. Usually, the cell is in a discharged state when constructed.
During charging, lithium ions move from the cathode through the separator to the anode.
Simultaneously electrons move from the cathode to the anode through the external circuit. This
process causes the potential of the cathode to rise and the anode to decrease, thus increasing the

2
voltage of the cell. The cell is discharged by connecting a load between the positive and negative
electrodes. This causes the direction of electron and ion motion to reverse. Consequently,
electrical energy is supplied to the load [3].
Figure 1.1 Schematic of a typical lithium-ion battery (For interpretation of the references to color
in this and all other figures, the reader is referred to the electronic version of this thesis.)
Battery cells come in button, cylindrical and prismatic forms. In general, prismatic cells are
custom-made for cell phones and other high volume items. For large scale applications,
regardless of a cells‟ design, cells are packaged together into a „module‟ unit; and several
connected modules make up a battery pack [4]. As the first step of stress analysis of a lithium-ion
battery, this thesis focuses on the stress in a separator in a prismatic cell.
1.2 Separator
Researchers of lithium-ion battery technology are mainly focused on optimizing four properties:
cost, performance, safety and life. These are major technical barriers that must be addressed in
Negative
Electrode
Positive
Electrode
Power Supply
Cu C
urren
t Collecto
r
Al C
urren
t Collecto
r
Sep
arator
Li+
Positive Plates
Negative Plates
Separator

3
order to use lithium-ion batteries in electric vehicles and power tools. These issues, especially
that of safety, become more severe as the cell sizes increase to that required to run vehicles [5].
No actual lithium-ion batteries are intrinsically safe. Short circuits due to separator failure,
overcharges, over-discharges, fractures, and high temperatures can lead to thermal runaways,
which may lead to fires and explosions [6]. A short circuit due to separator failure is considered
to be one of the main origins of these safety problems. To prevent separator failure, one must
fully understand the functionality of a separator and its working environment in a battery.
1.2.1 Functions of Separators
In production, the separators are sandwiched between positive and negative electrodes and then
spirally wound together in cylindrical or folded back and forth in prismatic configurations. The
pores of the separators are filled with some ionically conductive liquid electrolyte [7]. Separators
are intended to prevent electronic contact, enable ionic transport between the positive and
negative electrodes, provide ionic impedance at elevated temperatures, maintain good adhesion
to the electrodes, and work as a reservoir for electrolyte. In order to accomplish these functions,
separators must be chemically and electrochemically stable towards the electrodes and the
electrolyte, and mechanically strong to withstand the high tension during the battery assembly
and charge & discharge cycles during its life time [3, 7, 8].
1.2.2 Characterizations of Separators

4
The battery separators can be broadly divided into three categories: microporous polymer
membranes, non-woven fabric mats and inorganic composite membranes. They are featured by
the thinness, high porosity, and excellent thermal stability, respectively. Among them, the
microporous polyolefin membranes have been most widely used in liquid electrolyte batteries
due to their comprehensive advantages of performance, safety and cost [5, 8, 11].
Microporous separators have been developed from simple microporous films to complex
multilayer structures in order to meet the increasing demands of high-energy batteries. The thin
layers (<30μm) are made of polyethylene (PE), polypropylene (PP), or laminates of these two.
Essentially PE and PP are polyolefin materials, which could provide excellent chemical stability,
mechanical properties and acceptable cost to the cell [7].
The manufacturing methods of lithium-ion battery separators can be generally divided into a dry
process and a wet process. Both methods include one or more orientation steps to increase
porosity and improve tensile strength. Separators made by the dry process generally have slit-like
pores, anisotropic mechanic properties, and relatively low tensile strength in the lateral direction.
Those made by the wet process have large interconnected spherical or elliptical pores and good
isotropic mechanical properties [7, 8].
The separators are wound with the electrodes under tension. They must be mechanically strong
enough to withstand the tension operation during battery assembly. The mechanical strength is
mainly characterized by four terms: the tensile strength along the machine direction (MD) and
the transverse direction (TD), the tear resistance and the puncture strength [8]. Most of the

5
mechanical properties of separators can be measured or characterized by standard methods that
have been established by the American Society for Testing and Materials (ASTM). Table 1.1
shows typical properties of some commercial separators.
Table 1.1 Comparison of typical properties of some commercial separators [9]
Produce name Thickness
(μm)
Porosity Puncture
Strength
(g)
TD Tensile
Strength (MPa)
MD Tensile
strength (MPa)
Celgard 2325 25 39% >380 14.7 166.7
Celgard C500 25 35% >320 16.7 164.8
Celgard C300 20 36% >300 18.1 176.5
1.3 Stress Sources in the Separator
Failure study starts from stress analysis. Stresses in separators arise from multiple sources. The
first one is the deformation of the electrodes. For a typical 42OLiMn cathode and carbon anode,
the chemical reactions for cell discharging are shown as [10],
Negative electrode:
eCxLixLiLiC 66 1
Positive electrode:
4242 1 OMnxLiOLiMnxexLi
This moving mechanism is primarily based on the diffusion processes: deliver lithium ions to the
surface of the anode, transfer to and diffuse in electrolyte through the separator, and then transfer
to and diffuse into the cathode [6]. The charging process proceeds in the opposite direction. The
intercalation and deintercalation processes result in a volume change in the active electrode
6
materials, and thus the entire electrode. In a tightly packed battery, the fluctuations in the
electrodes‟ sizes cause the separators to deform.
The second source of the stress inside a separator is temperature change. The heat generation
accompanied with electrochemical reactions in a battery can be significant; this causes the
battery to experience temperature rise and a thermal expansion. Since different battery
components have different thermal expansion coefficients, the difference in the expansion rates
induces thermal stress in the separator.
It is important to note that while stresses from a single charge and discharge operation may not
be devastating, repeated stressing can initiate cracks and lead to eventual fracture of the separator.
1.4 Summary of a Literature Review
As discussed above, there is no stress directly generated inside the separator. To obtain the stress
status of the separator, one should fully understand the stress behavior of the electrodes and the
thermal behavior of the entire battery during operation.
There are a lot of researches focused on lithium-ion battery technologies; most of them are
researched from the electrochemical point of view. Doyle et al. developed a 1-D model (or
named pseudo 2-D model) of lithium-ion battery that considered the chemical performance of a
full battery. In this model, each porous electrode was treated as a pseudo homogeneous mixture

7
of solid active material and electrolyte [12,13]. The modeling results agreed with the
experimental results very well. It was used as the foundation for many later published papers.
In recent several years, researchers have started to pay attention to the stress behavior inside a
lithium-ion battery during the discharging or charging process. Most of the works consider a
single active particle of a spherical shape. Together with the pseudo 2D battery model, a 1D
spherical model can describe the generation of stress during intercalation and deintercalation.
Christensen and Newman studied the stress generated inside 42OLiMn [14] and carbon [15]
electrodes. Zhang et al. considered stress effect on diffusion and the stress distribution inside one
single electrode particle using numerical simulation [16]. Cheng and Verbrugge compared the
stress evolution process under galvanostatic and potentiostatic operation [17], and studied the
effects of surface tension and modulus on diffusion induced stress within spherical nonoparticles
[18]. Verbrugge and Cheng [19] also examined the stress in spherical particles under periodic
potential excitations. Renganathan et al. [20] considered the stress arising due to the phase
transformation in their model. Golmon et al. [21] presented a multi-scale finite element approach
to study the electrochemical-mechanical interaction phenomena at macro-, meso-, and micro-
scales.
It is well recognized that the material property of battery components will vary with temperature
and lithium concentration. However, due to the complexity of the problem and lack of data, the
material property was treated as constant in most of the studies. Recently Cai and White [22]
considered the temperature dependence of the diffusivity, open circuit potential, and thermal
conductivity.

8
Although most of the stress analysis was limited to one single particle, 2D models have appeared
in literatures. Garcia et al [23] developed a 2-D model to study the effects of distribution change
or size change of the particles, meanwhile considered more details of the microstructure of the
electrode. Xiao et al. [24] developed a multi-physics, multi-scale model for a lithium-ion battery
in a multi-physics code COMSOL taking into account the reaction kinetics, lithium diffusion and
diffusion induced stress. Unfortunately, due to the limitation of the COMSOL in its structural
module, the development of a robust model with contact between the battery components was
not successful and a continuous mesh had to be used across the components. The stress
calculated by this approach may represent the condition in the center of a cell but not at the
electrode edges. To consider the contact between battery components, a structural code with a
robust contact modeling capability is needed.
As to the thermal behavior of a lithium-ion battery, although several studies have addressed the
issue of heat generation inside lithium-ion batteries [25-27], most works were conducted to
describe the heat generation, temperature change or their influence on certain electrochemical
properties, few researches have considered the thermally induced stress. As an extension of
Xiao‟s work, Wei et al. [28] introduced thermal stress in 2-D lithium-ion battery model. The
results showed that, for the separator, the influence of the thermal stress were as important as that
of lithium diffusion induced stress.
1.5 Scope of the Work

9
It is well recognized that stress can have a significant impact on the performance of a separator.
Currently, there is no method to evaluate the stress inside a battery. There are no clear criteria for
the mechanical property requirement of the separators. To improve the performance of battery
separators, their stress conditions must be known.
The objective of this research is to develop a numerical model for the stress analysis of the
separator in a prismatic lithium ion battery cell. A prismatic cell is commonly known as a pouch
cell.
Figure 1.2 Schematic of a pouch cell [29]
A pouch cell is manufactured by stacking up layers of electrodes separated by separator films.
Figure 1.2 presents the schematic of a pouch cell [29]. The actual stacking and folding
configuration in batteries may vary. It is expected that the stress in a separator is higher near the
edge than in the center.
Limited by the availability of the data and understanding on the multi-physics processes in
lithium-ion batteries, the following assumptions are made at this stage of the work:
1) All materials are linear elastic and isotropic.
2) Material properties are considered to be independent of lithium concentration.
3) Material properties are considered to be independent of temperature.

10
4) The solid phase of electrode is assumed to only consist of active particles. The binders
and other additives are neglected.
5) The effects of stresses on electrochemical reactions and lithium diffusion are ignored.
1.6 Scope of the Thesis
This work is generally divided into two parts: the development of numerical models and the
study of the influence of some design adjustable parameters.
Chapter 1 provides the background information about this research, describes the objective and
scope of this work, and presents the organization of this thesis.
Chapter 2 introduces the main phenomena occurred inside the lithium-ion battery, and provides
the corresponding governing equations and the coupling relationships between various physical
phenomena.
Chapter 3 describes the lithium-ion battery model developed in this research and provides a
summary of the input parameters in the models. To consider the porosity of porous components,
a homogenization technique was used to obtain the effective properties and is discussed in this
chapter. In this thesis, a model for the stress analysis of a separator is developed based on two
commercial softwares: COMSOL and ANSYS. The way to use these two commercial softwares
is discussed at the end of this chapter.
11
Chapter 4 presented the simulation results. In this chapter, several important factors of a lithium-
ion battery are studied. The influences of each factor to the stress condition of the separator are
summarized. A series of optimized parameters are suggested at the end of this chapter.
Chapter 5 summarized the major findings in this work and suggested some directions for the
future work.

12
CHAPTER 2 METHODS
As introduced in Chapter 1, there are three major groups of phenomena occurring inside a
lithium-ion battery: electrochemical, thermal and mechanical phenomena. Since they are strongly
related to each other, they will be investigated as coupled phenomena in order to accurately and
systematically analyze the stress. This chapter will introduce the basic equations that used to
describe these phenomena and discuss the coupling methods.
2.1 Multiple Phenomena Occurred inside the Lithium-Ion Battery
The phenomena occurred inside the lithium-ion battery can be generally classified into three
groups: electrochemical phenomena, thermal phenomena and mechanical phenomena. Each
group is described by a different set of equations. The electrochemical reactions serve as the
foundation for all these analysis.
2.1.1 Electrochemical Phenomena
It has been proved that the multiple electrochemical phenomena inside a lithium-ion battery can
be described by a set of mathematical equations. Detailed mathematical models have already
been established by Doyle et al. [12, 13]. It was proved that the simulation results predicted by
these models match with experimental results very well. In this study, the analysis of
electrochemical phenomena is built upon these well established mathematical models.

13
2.1.1.1 Current Balance
In the solid phases of the electrodes, the current balance is described in terms of electronic
current density balance
ilociaieffi jS ___1,_1 )( (2.1)
where i=p,n, p denotes positive electrode, n denotes negative electrode, eff1_i,κ denotes the
effective electronic conductivity, 1_iφ is the potential of the solid electrode, a_i
S refers to the
specific surface area ( 32/mm ) , loc_ij is the local charge transfer current density. Equation 2.1
also represents the conservation of charge in the solid phase. The effective conductivity
considers porosity and tortuosity, the expression is given by
iieffi _1_1,_1 (2.2)
where 1_iκ is the electronic conductivity, 1_i
ε is the volume fraction of solid phase, γ is the
Bruggeman coefficient, which is set to 1.5 in this work.
In electrolyte phase, the current balance denotes the ionic charge balance. The equation for
binary 1:1 electrolytes can be given as
ilociaieffiDieffijSc
___2,__2,_2)ln()( (2.3)
where 2_iφ is the potential of electrolyte, 2_i
c is the salt concentration in electrolyte, eff2_i,κ is
the effective electronic conductivity, the expression is
iieffi _2_2,_2 (2.4)

14
where 2_iκ is the electrolyte ionic conductivity, which strongly depend on the electrolyte
composition. In this work, Newman‟s experimental data was used, as shown in Figure 2.1. 2_iε
is the volume fraction of electrolyte (porosity).
Figure 2.1 Relationship between ionic conductivity and lithium concentration in electrolyte
effD_i,κ is the diffusional conductivity, which is given by
)1)(ln
ln1(
2
_2
,_2,_
t
c
f
F
RT
i
effieffiD
(2.5)
where R denotes the gas constant, T denotes the temperature, f is the ionic activity coefficient,
and t is the transference number of the Li with respect to the velocity of solvent. In this work,
we assume the ionic activity coefficient does not change with the salt concentration, thus, the
diffusional conductivity can be rewritten as
)1(2 ,_2
,_ tF
RT effieffiD
(2.6)
0
0.06
0.12
0.18
0.24
0.3
0.36
0 1 2 3 4
Ionic
Co
nduct
ivit
y (
S/m
)
Concentration (mol/dm³)Concentration (mol/dm³)
Ionic C
onductiv
ity (S
/m)

15
2.1.1.2 Material Balance in the Electrolyte
The material balance in the electrolyte is given by
)1()(__
_2,_2_2
_2 tF
jScD
dt
dc ilociaieffi
ii (2.7)
where eff2_i,D is the effective diffusion coefficient in the electrolyte, which is calculated in the
same way as we do for effective conductivity.
2.1.1.3 Diffusion in the Solid Electrode Particles
Fick‟s second law describes the transport in the solid electrode particles and predicts the change
of concentration field with time by the following equation in spherical coordinates
0)]([1
_1_12
2
_1
ii
ic
rDr
rrdt
dc (2.8)
where 1_ic is the concentration of species in solid electrode.
2.1.1.4 Butler-Volmer Electrode Kinetics [10, 25]
Butler-Volmer electrode kinetics describes the fundamental relationship between electrical
current on an electrode, the electrode potential and the local specie concentration at the interface
between electrode and electrolyte. In particular, the rate of transfer of lithium ions from the
electrolyte to the active material is controlled by the local deviation of the surface potential with

16
respect to its equilibrium value. It serves as the link term between charge balance and material
balance. The Butler-Volmer relation is given as
]}exp[])1(
{exp[_0
_RT
F
RT
F
F
ij iii
iloc
(2.9)
where 0_ii is the exchange current density, iη is surface overpotential, and β is the symmetric
factor, which represents the fraction of the applied potential that promotes the cathodic
reactions[25]. The first term in the brace denotes the forward rate of the anodic process, while
the second term denotes the backward rate of the cathodic process [23]. The exchange current
density is given by
)()()( ,_11
,_1max,_11
_2_0_0 surfisurfiiiii ccccFki (2.10)
where 0_ik is the reaction rate constant, 2_ic is the concentration of lithium ion in the
electrolyte, surf1_i,c is the concentration of lithium ion on the surface of the solid electrode, and
)c(c surf1_i,max1_i, is the available space for lithium intercalation. The overpotential is given
by
iiii U ,2,1 (2.11)
where i1, is the potential of the solid electrode, i2, is the potential of the electrolyte, and iU is
the open circuit potential, or the electrode particle‟s equilibrium potential, which is a function of
the state of charge. It can be measured by experiment. In this work, the experimental results from
Reference 13 were used.
17
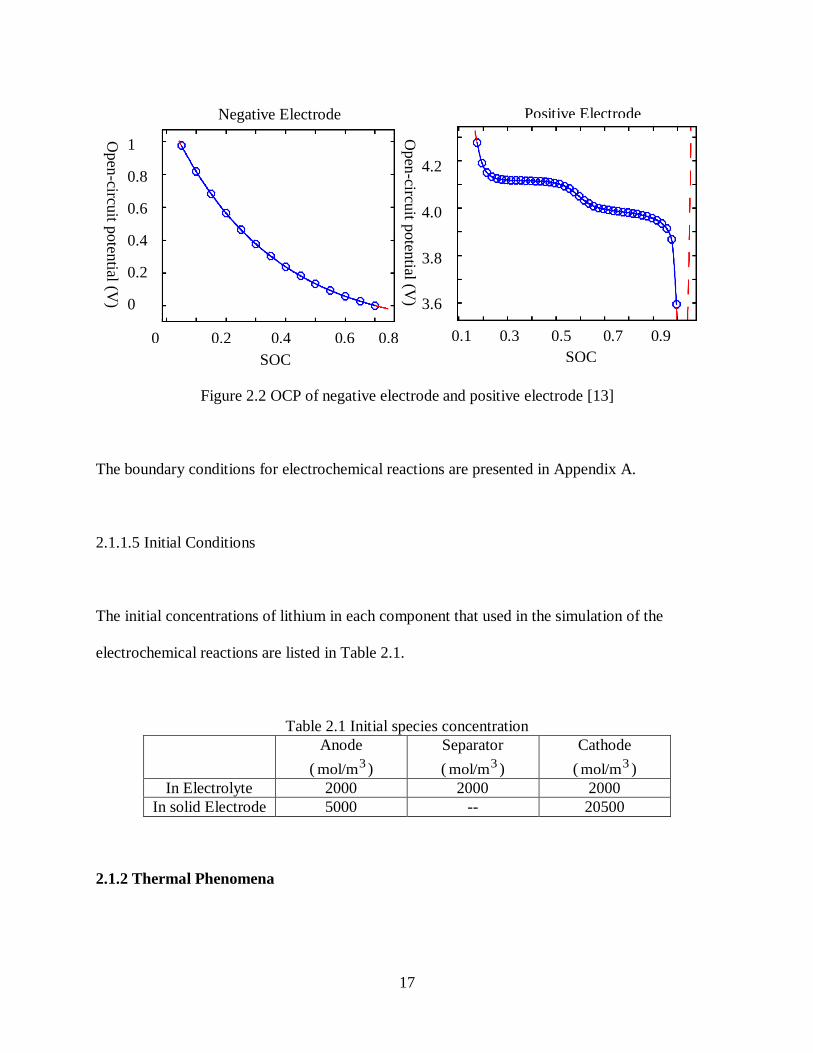
Figure 2.2 OCP of negative electrode and positive electrode [13]
The boundary conditions for electrochemical reactions are presented in Appendix A.
2.1.1.5 Initial Conditions
The initial concentrations of lithium in each component that used in the simulation of the
electrochemical reactions are listed in Table 2.1.
Table 2.1 Initial species concentration
Anode
( 3mol/m )
Separator
( 3mol/m )
Cathode
( 3mol/m )
In Electrolyte 2000 2000 2000
In solid Electrode 5000 -- 20500
2.1.2 Thermal Phenomena
Negative Electrode Positive Electrode
SOC SOC
0 0.2 0.4 0.6 0.8 0.1 0.3 0.5 0.7 0.9
1
0.8
0.6
0.4
0.2
0
Open
-circuit p
oten
tial (V)
4.2
4.0
3.8
3.6
Open
-circuit p
oten
tial (V)

18
Battery thermal management is a critical element for achieving the desired performance and
calendar life for battery packs. According to Wu et al. [28], the thermal stress imposed on the
separator due to the self-heating of the battery is substantial. To understand the stress behavior of
a lithium-ion battery, the self-heating of the battery must be considered.
To understand the thermal behavior of a lithium-ion battery, we introduced the energy balance,
given by [26, 30]
iiipi qTt
TC
)(_ (2.12)
where from left to right, the terms denote heat accumulation, heat conduction and heat generation.
For heat generation, there are mainly four sources [25, 28], which can be written as
dvt
cHHrH
T
UTjsUjsq
k r s
rsavgrsrsk
avgk
iinaiinai
)()( _21_ (2.13)
where as is the specific surface area ( 32/mm ), n_ij is the current density ( 2A/m ). The first term
is the irreversible resistive heat, represents the deviation of the cell potential from its equilibrium
potential; the second term is the reversible entropy heat; the third term is the chemical side
reaction heat, and the fourth term is the heat of mixing due to the generation and relaxation of
concentration gradients. As revealed in Reference 27, the heat of mixing is relatively small
compared to entropic and resistive heat, thus it can be neglected. In this study, a binary
electrolyte is assumed; side reactions and phase change effects are neglected. The energy balance
equation reduced to
T
UTjsUjsT
t
TC i
inaiinaiipi
_21__ )()( (2.14)

19
Experimental results of TU/ for 42OLiMn [31] and 6LiC [10, 32] are used in this study as
shown in Figure 2.3.
Figure 2.3 TU/ for anode ( 6LiC ) and cathode ( 42OLiMn )
The thermal boundary conditions are shown in Chapter 3.
2.1.3 Mechanical Phenomena
Linear elasticity is assumed in this research, and the Young‟s modulus is treated as a constant.
Therefore the strain would always vary proportionally with the stress. Besides the conventional
mechanical strain, thermal strain and diffusion induced strain also arise in lithium-ion batteries
[16, 24, 33]. The constitutive relationship can be written as:
ijijijijkkijcei
ijTei
ijmeijij cT
E
3
1))1((
1__ (2.15)
Negative Electrode
0.25 0.35 0.45 0.55 0.65
Positive Electrode
0.1 0.3 0.5 0.7 0.9
x in 6LiC y in 42OLiMn

20
where ijε are strain components, E is Young‟s modulus, ν is Poisson‟s ratio, ijζ are stress
components, ijδ is the Kronecker delta, ijα is thermal expansion coefficient, ΔT is the
temperature change from the reference value, Δc is the concentration change of diffusion
species from the reference value, and Ω is the partial molar volume. The partial molar volume
can be calculated by [24]:
max
3
yc
(2.16)
where ε is the intercalation induced strain along the major axis of the material, Δy is the change
of number of lithium atoms, and maxc is the Stoichiometric maximum concentration.
The mechanical boundary conditions are discussed in Chapter 3.
2.2 Multi-physics Coupling
The previous analysis has already shown that there are mainly two sources of stress in a
separator: lithium diffusion induced stress and thermal stress. Therefore the lithium and
temperature distribution are needed to perform stress analysis. In this work, the simulation is
divided into two steps: 1) obtain the lithium and temperature distributions using COMSOL, 2)
perform stress analysis in ANSYS. This is a one way coupling method. The influences of stress
on the lithium and temperature distributions are neglected.
2.2.1 Lithium and Temperature Distributions

21
The lithium distribution is predicted by a 1-D cross section model and the temperature
distribution is predicted by a macro-scale 2-D model. Both models are coupled with pseudo 2-D
battery models in COMSOL.
Figure 2.4 Schematic of multiphysics coupling
As shown in Figure 2.4, the first two models are called pseudo 2-D battery models (available in
COMSOL 3.5a), which was built upon the model developed by Doyle et al. [12, 13]. The pseudo
2-D model consists of a 1-D porous electrode model and a 2-D spherical particle model.
Generally the 1-D porous electrode model deals with the electronic current density balance, ionic
charge balance, ionic material balance, and Butler-Volmer electrode kinetics, while the 2-D
spherical particle model provides the lithium concentration distribution inside the particles and
the lithium concentration at the particle surface for the 1-D porous electrode model.
Electronic current density balance
Ionic charge balance
Ionic material balance
Butler-Volmer electrode kinetics
Solid state diffusion
Concentration homogenization
Thermal balance
Stress equilibrium
Local current density
Surface concentration
Electrode/Electrolyte potential
Local current density Average
concentration
Cross section
concentration
Temperature,
Strain, stress
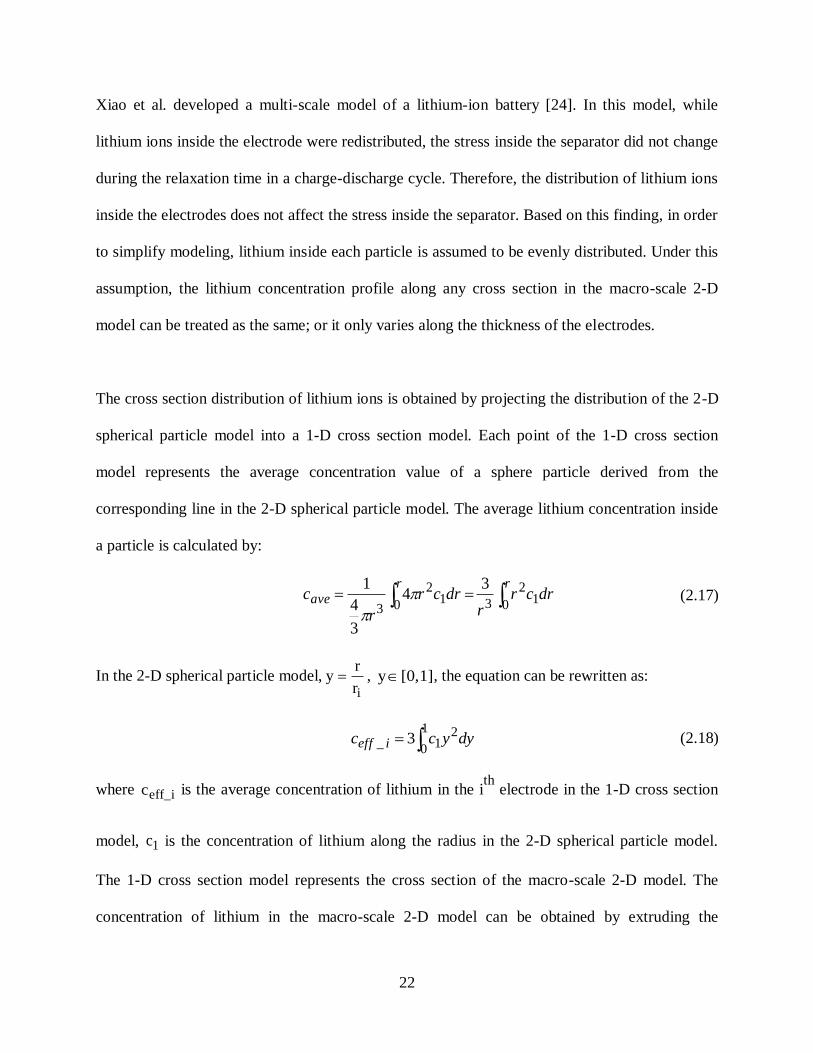
22
Xiao et al. developed a multi-scale model of a lithium-ion battery [24]. In this model, while
lithium ions inside the electrode were redistributed, the stress inside the separator did not change
during the relaxation time in a charge-discharge cycle. Therefore, the distribution of lithium ions
inside the electrodes does not affect the stress inside the separator. Based on this finding, in order
to simplify modeling, lithium inside each particle is assumed to be evenly distributed. Under this
assumption, the lithium concentration profile along any cross section in the macro-scale 2-D
model can be treated as the same; or it only varies along the thickness of the electrodes.
The cross section distribution of lithium ions is obtained by projecting the distribution of the 2-D
spherical particle model into a 1-D cross section model. Each point of the 1-D cross section
model represents the average concentration value of a sphere particle derived from the
corresponding line in the 2-D spherical particle model. The average lithium concentration inside
a particle is calculated by:
rr
ave drcrr
drcr
r
c0 1
2
30 12
3
34
3
4
1
(2.17)
In the 2-D spherical particle model,ir
ry , [0,1]y , the equation can be rewritten as:
1
0
21_ 3 dyycc ieff (2.18)
where eff_ic is the average concentration of lithium in the ith
electrode in the 1-D cross section
model, 1c is the concentration of lithium along the radius in the 2-D spherical particle model.
The 1-D cross section model represents the cross section of the macro-scale 2-D model. The
concentration of lithium in the macro-scale 2-D model can be obtained by extruding the

23
concentration values in the 1-D cross section model along the length of the macro-scale 2-D
model as shown in Figure 2.5.
Figure 2.5 Lithium distributions in the real 2-D model
After obtaining the concentration distribution, a thermal analysis can also be performed on the
macro-scale 2-D model. As presented in equation 4, variables, such as current density and
potential, are needed in addition to the lithium ion concentration in order to perform this thermal
analysis. These variables are directly projected from the 1-D porous electrode model.
2.2.2 Stress Analysis
After solving the strongly coupled electrochemical and thermal equations, the lithium and
temperature distributions are successfully extracted. The extracted distributions are used as input
for the macro-scale 2-D model and the stress analysis of the battery is performed subsequently in
ANSYS.
Concentration (mol/dm³)
Thick
ness (μ
m)
0 10000 20000 30000
160
120
80
40
0

24
CHAPTER 3 MODEL
In this study, we are interested in one cell of a prismatic lithium-ion battery. As introduced in
Chapter 1, each cell of the battery is composed of parallel layers of different components. The
stress at the middle part of the prismatic battery would converge to a stable value, but the stress
at the end of the battery could change greatly due to different wrapping methods of the separator
and actual shapes of the corners of the electrodes.
There are two ways to wrap the separator: wrap around the anode or wrap around the cathode. In
this thesis, an assumption, to be introduced in Chapter 4, is made that all lithium ions which
participate in reaction come from the cathode. Under this condition in one charge & discharge
cycle, deformation induced by lithium diffusion causes the cathode to first shrink and then
expand back to its original shape, and the anode to act in an opposite manner. Therefore, only the
separators wrapped around the anode are expected to experience high strain and stress
fluctuations. The addition of thermal expansion under these conditions will reduce stress and
strain regardless of the wrapping method. Since this research is aimed at determining the
maximum stress imposed on the separator, we mainly focus on the methods of wrapping the
separator around an anode.
The shape of the corner may change according to different assembly methods. For the model in
this research, the separator is wrapped tightly enough around the anode that the transition area

25
(corner) is considered to be annulus. This maximum stress yields from this model can be
considered the lowest value when compared with other possible conditions.
3.1 Model Depiction
3.1.1 Structure and Dimensions
The stress condition of a separator is closely related to material properties, the diffusion of
lithium, heat change, the actual stacking and folding configuration of the electrode assembly, and
the packing of the battery. In this research, all these conditions are finally exerted on a macro-
scale 2-D model. The macro-scale 2-D model is a representative 1.5 cell model as shown in
Figure 3.1. The model is regularly shaped with smooth surfaces. The components from the
bottom to the top are anode current collector (Cu), anode, separator, cathode, cathode current
collector (Al), and another cathode. The separator is wrapped around the anode and assembled
tightly with both the anode and the cathode.
Figure 3.1 Schematic of the structure of the model
r=5μm
Cathode2
Collector
Collector
Anode
Separator
Cathode1

26
It‟s important to note that a 1.5 cell model is built in this study instead of one full cell. If only
one full cell is modeled, one layer of cathode and one layer of collector would form an
asymmetric beam which tends to bend under diffusion induced stress in cathode layer and to peel
off from the separator. In reality, since the collector is coated with cathode layers on both sides,
the bending forces will be counteracted by each other. To represent this real condition, one needs
to add another cathode into the full cell model, and therefore a 1.5 cell model is formed. The
collector for the anode is coated at both sides as well. This is represented by a symmetrical
boundary condition at the lower surface of the current collector in the model. The boundary
condition will be discussed. The dimensions of the model are listed in Table 3.1.
Table 3.1 Dimensions of the model
*Estimated as the value of r50.
**Effective length. Its effectiveness is verified by numerical experiment in Chapter 4.
3.1.2 Boundary Conditions
Assigning proper boundary conditions to approximate the real conditions is critical to obtain a
correct solution for the problem. In this study, three groups of phenomena are investigated and
thus there are three sets of boundary conditions for different governing equations and simulation
models. As introduced in Chapter 2, the pseudo 2-D models are used to deal with
electrochemical reactions. The boundary conditions for them are presented in Appendix A. The
Unit Cu Anode Separator Cathode Al
Particle radius μm 11.5[34]* 3.35[35]
Thickness μm 10 45 25 60 15
Length** mm 7 7 7.025 6.98 6.98
Corner
radius
Inner μm 5
Outer μm 5 30

27
macro-scale real 2-D model is used to deal with both thermal and mechanical phenomena. The
boundary conditions for these phenomena are illustrated in Figure 3.2 and Figure 3.3.
Figure 3.2 presents the thermal boundary conditions of the macro-scale 2-D model. We assume
that for the right hand side boundaries, heat transfer with air is achieved by blowing the air along
the thickness of the cell; thus, a convective boundary condition is assigned to the right hand side
boundaries. For all the other sides, an adiabatic boundary condition is applied because of the
symmetric conditions. Inside the lithium-ion battery, heat can conduct freely from one
component to another; therefore, free conductive boundary conditions are applied for all the
inner boundaries.
Figure 3.2 Thermal boundary conditions
Figure 3.3 is the schematic of the mechanical boundary conditions of the macro-scale 2-D model.
Similarly, there are two groups of boundaries in this model: external and internal. For the
external boundaries, a symmetric displacement boundary condition is assigned to the left and
bottom boundaries, thus the model we study represents one quarter of 3.0 full cells. Distributed
normal pressure is assigned to the top boundary. The default value for this pressure is 10 psi.
Adiabatic
Adiabatic
Adiabatic
Convective

28
This value may change when conducting a pressure study in Chapter 4. The rest of the external
boundaries are free boundaries.
To set the internal boundary conditions, one needs to consider the production process of battery
cells. At the beginning of the production process, a cathode paste is spread on Al foil (cathode
collector) and an anode paste is spread on Cu foil (anode collector), therefore the electrodes and
their corresponding collectors are always bonded together. Then, these bonded components are
wounded up sequentially with separators [4]. Relative slip can occur on the surfaces between a
separator and its adjacent electrodes. Due to this production process a contact relationship is
assigned at the boundaries between the separator and electrodes in the model; and the boundaries
between the current collector and the electrode are modeled as continuous.
Figure 3.3 Schematic of mechanical boundary conditions for the real 2-D model
3.2 Material Properties
Pressure
Symmetric
Symmetric
Contact

29
Anodes for lithium-ion batteries can be made of lithium, carbon, lithium-alloying materials,
intermetallics, or silicon. Among these, carbon is selected as the anode materials. Carbon is the
common anode in commercial lithium-ion batteries due to its popularity as being a low cost and
highly available material [6, 36]. The corresponding current collector is Cu foil.
Materials used in cathodes in lithium-ion batteries include lithium-metal oxides (like 2LiCoO ,
42OLiMn , and 2zyx )OCoMnLi(Ni ), vanadium oxides, olivines or rechargeable lithium oxides
[36, 37]. In this research, the material considered is 42OLiMn . Manganese offers a low-cost
substitution with a high thermal threshold and excellent rate capabilities [6]. The material
parameters for 42OLiMn are well established. The corresponding current collector is Al foil.
In lithium-ion batteries the electrolyte is made of a solution of a fluorinated lithium salt in an
organic solvent, which enables current to transport by lithium ions. The solvent-based
electrolytes generally contains 84OLiBC ( LiBOB ), 6LiPF , ])F(CLi[PF 3523 [6]. We choose
6LiPF (hexafluorophosphate) as the lithium salt.
As introduced before, the separator considered in this work is a microporous film made by a wet
process.
Overall, a /AlOMn/Li/LiPFCCu/Li 42y66y cell has been selected in this research. All the
materials are the most common materials used in each corresponding component of lithium-ion
batteries.

30
3.2.1 Effective Property
As shown in Figure1.1, the separator and electrodes are porous. All the pores are filled with
electrolytes. However, in this research, each component is modeled as a homogeneous solid
medium. The materials‟ porosity is taken into consideration by applying effective properties.
This study is focused on the stress in the separator. It is assumed that, when observed
macroscopically, the local details of the electrodes will not contribute significant influence on the
stress in the separator, as long as the equivalent macroscopic strains of the electrodes are
generated. In other words, the same macroscopic behavior can be achieved by applying the Rule
of Mixture to each material property used in the equations.
3.2.1.1 Diffusion and Thermal Induced Expansion Coefficient
Each component can be treated as a compound of the local material and electrolyte. In this study
the electrolyte is considered to be compressible, but its volume variation due to Li+
concentration change is assumed to be negligible. Only the electrode particles experiences
lithium diffusion induced volume change. To account for this influence, an effective diffusion
expansion coefficient is estimated. The diffusion induced expansion coefficient is estimated by
the rule of mixtures similar to composite systems as [38]
i
ii
i
iieff VV3
1 (3.1)

31
where effβ is the effective diffusion expansion coefficient of the composite, iβ and iV are the
diffusion induced expansion coefficient and the volume fraction of the ith
phase, respectively.
Neglecting the contribution of the electrolyte phase, the expression can be reduced to
ppppeff VV 3
1 (3.2)
where pβ and pV are the diffusion induced expansion coefficient and the volume fraction of the
active particles, respectively. With this effective diffusion expansion coefficient, the
macroscopic equivalent strain of an electrode due to lithium insertion and extraction can be
obtained.
The effective thermal expansion coefficient of the electrode was estimated in the same way, but
the expansion of the electrolyte cannot be neglected. It is defined as:
i
iieff V (3.3)
where effα is the effective thermal expansion coefficient of the composite, iα is the diffusion
induced expansion coefficient of the ith
phase.
3.2.1.2 Thermal Conductivity and Specific Heat Capacity
The method used to obtain the effective thermal conductivity and specific heat capacity is very
similar to the one for expansion coefficients. It is important to ensure the overall performance is
still the same. The effective thermal conductivity can be calculated by:

32
i
i
i
ii
i
i
i
ii
effV
Vk
L
Lk
k3
3
(3.4)
where effk is the effective thermal conductivity of the composite, ik is the thermal conductivity
of the ith
phase, iL is the conduct length.
The effective specific heat capacity can be calculated by:
i
ii
i
iiip
i
i
i
iip
effpV
Vc
m
mc
c
__
_ (3.5)
where p_effc is the effective specific heat capacity of the composite, p_ic is the specific heat
capacity of the ith
phase, im is the ith
mass fraction, iρ is the density of the ith
phase.
3.2.1.3 Young‟s Modulus
Similarly, the Young‟s modulus of a porous electrode is different from that of an electrode
particle. The effective modulus of a composite consisting of particles dispersed in a matrix is
found to fall between the following upper and lower bounds, respectively.
Upper bound: ppmmeff VEVEE (3.6)
Lower bound: mppm
pmeff
EVEV
EEE
(3.7)
where effE is the effective Young‟s modulus of the composite, mE and pE are the Young‟s
modulus of the matrix and particles, respectively [38, 39]. The mass fraction of the active

33
materials in electrodes is assumed to be 0.8 [40]. From the mass fraction and densities of battery
components, the computed volume fractions of the active materials are 0.69 for the carbon anode
and 0.53 for the 42OLiMn cathode. At a high particle volume fraction, the upper bound
estimation provides a closer approximation. Therefore, the prediction found with Equation (3)
was used in this work to calculate the effective Young‟s modulus.
3.2.2 Material Constants
Table 3.2 lists a summary of the material constants and the effective values of some modified
parameters of different battery components.

34
Table 3.2 Material property of different components in a lithium-ion battery
Electrochemical Constants
Unit Cu Anode Separator* Cathode Al Electrolyte
Density kg/m3 8700 2223 900 4202 2700 1210
Stoichiometric maximum concentration mol/m3 2.64x10
4 [13] 2.29x10
4 [13]
Initial SOC 0.227 0.612 0.200
Diffusion coefficient m2/s 3.9x10
-14 7.08x10
-15
Partial molar volume m3/mol 4.17x10
-6 3.5x10
-6
Effective Partial molar volume m3/mol 2.88x10
-6 1.86x10
-6
Porosity 0.26 0.42[7] 0.407
Active volume fraction 0.69 0.53
Thermal Constants
Unit Cu Anode Separator Cathode Al Electrolyte
Thermal expansion coefficient
1/K
17x10-6
4.06x10⁻⁶
13.32x10⁻⁵
8.62x10⁻⁶
23.6x10⁻⁶
12.4x10⁻⁶
Effective Thermal expansion
coefficient
1/K
6.025x10⁻⁶
82.46x10⁻⁶
9.615x10⁻⁶
Specific heat capacity J/kg*K 386 623 1883 672 897 1800
Effective specific heat capacity J/kg*K 823 839[41]
Thermal conductivity W/m*K 398 6.5 2.16 6.2 237 0.099
Effective thermal conductivity W/m*K 3.81 3.28
Heat transfer coefficient of air W/m2*K 5
Mechanical Constants
Unit Cu Anode Separator Cathode Al Electrolyte
Young‟s modulus GPa 117 12 0.5 10 70 1MPa[23]
Effective Young‟s modulus** GPa 8.88 5.93
Poisson‟s ratio 0.35 0.3 0.35 0.3 0.34 0.25[23]
* All the data of separator are calculated by using wet separator, no effective values are needed.
** All the none-electrolyte parts are treated as solid particles.

35
CHAPTER 4 SIMULATION
4.1 Simulation Conditions
In this thesis, research is focused on the strain and stress of a separator at the end of a charging
period of the /AlOMn/Li/LiPFCCu/Li 42y66y battery. Charging procedures are composed of
two steps: charge the battery at constant current until reaching a voltage of 4.2 V, and then hold
the cell voltage at 4.2 V while gradually reducing the charging current until it drops to a small
percentage of the initial charge rate, such as 3%. At this point, the battery is considered to be
fully charged [42].
In this study, the lithium ion concentration is expressed in state of charge (SOC), which is the
ratio of the current lithium ion concentration to the battery‟s Stoichiometric maximum
concentration. The initial stresses in all battery components are assumed to be zero. Thus, the
stress free conditions are the conditions of the battery before the first charge. As shown in Table
4.1, based on the assumption that all lithium ions come from the cathodes, the stress free SOC is
0 for anodes. The initial SOC is calculated from Table 2.1.
Table 4.1 Assumed SOCs for both electrodes
Stress free SOC Initial SOC
Anode 0 0.208
Cathode 0.98 0.919

36
Due to the cyclical nature of rechargeable batteries, initial charging conditions match the final
conditions of discharge. In operation cycles, the degree of discharge (DOD) is in the range of
20%~90%. Table 4.1 also shows the assumed homogeneous initial SOCs of both electrodes.
Figure 4.1 depicts a fully charged SOC distribution for each electrode along the thickness of a
battery; this is obtained by charging a battery for 3400 seconds.
Figure 4.1 Final SOC of both anode and cathode
Anode
0.84
0.86
0.88
0.9
0.92
0.94
10 20 30 40 50 60
Distance (μm)
SO
C
Cathode
0.1656
0.1662
0.1668
0.1674
0.168
0.1686
80 90 100 110 120 130 140 150
Distance (μm)
SO
C

37
4.2 Effective Length
A pouch cell has a large length to thickness ratio. Therefore it is not feasible to build a finite
element model with the actual dimensions of each individual component layer for the entire
battery cell. To solve this problem, the influences of length on the local strain and stress
distribution of the separator are studied.
In this work, a group of models with different lengths are developed. The results show that the
maximum strain always emerges at the end of a charging period, and is located in the inner
surface of the separator where it wraps around the corner of the anode. Figure 4.2 presents the
strain contours obtained around a corner. Here strain is plotted in the x and y directions, and the
corresponding maximum values are found along the horizontal and vertical segments of the
separator near the edge. When plotted in the 1st principle strain, the maximum value of the
separator is found at the area in contact with the corner of the anode. As shown, the contour of
the 1st
principle strain of the separator around a corner follows the shape of the corner.

38
Figure 4.2 Contours of strain components near the corner
Figure 4.3 presents the maximum values of the strain components versus the model‟s length. As
shown, the variation trends for all the components are generally the same: firstly strains decrease
with increasing model length and then approach stable values when the length is larger than 4
mm. For this research, a length larger than 4 mm is deemed to be an effective length.
Correspondingly this model could represent the whole battery cell.
Figure 4.3 Strain components versus model length
0
1
2
3
4
5
6
0 5 10
Str
ain (
%)
Length (mm)
Max x-strain
Max y-strain
Max 1st Principal-strain
Length (mm)
Max x-strain
Max y-strain
Max First Principal -strain
39
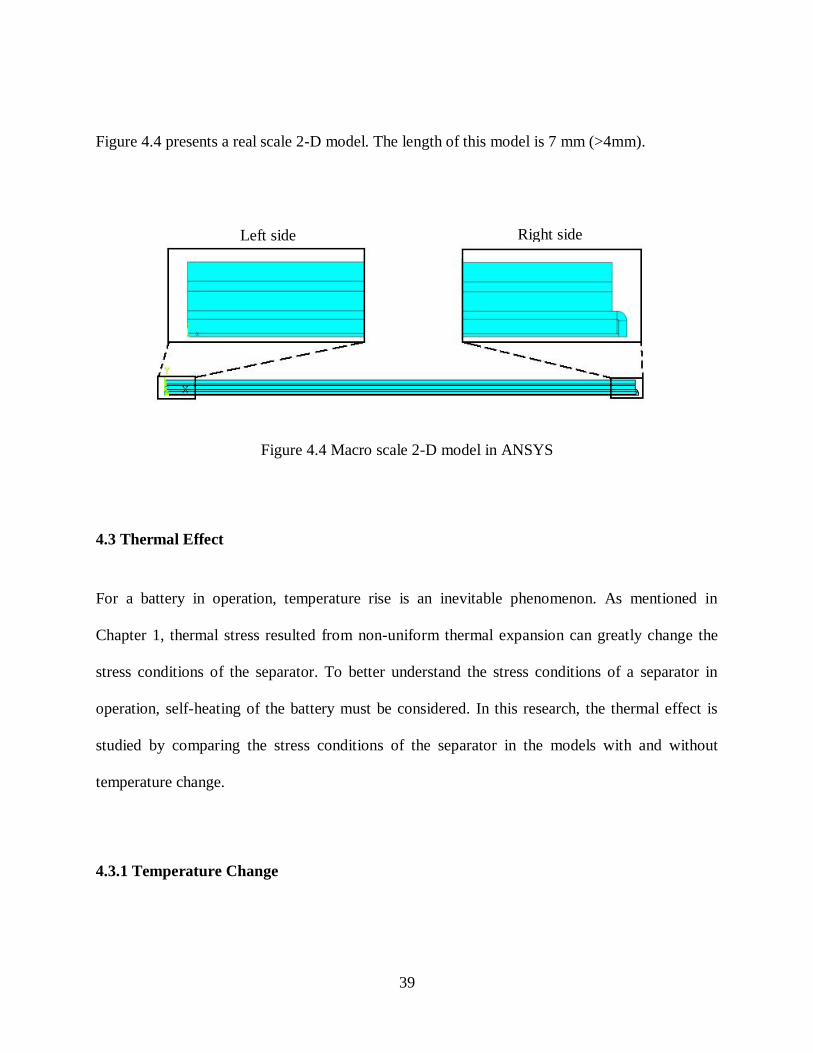
Figure 4.4 presents a real scale 2-D model. The length of this model is 7 mm (>4mm).
Figure 4.4 Macro scale 2-D model in ANSYS
4.3 Thermal Effect
For a battery in operation, temperature rise is an inevitable phenomenon. As mentioned in
Chapter 1, thermal stress resulted from non-uniform thermal expansion can greatly change the
stress conditions of the separator. To better understand the stress conditions of a separator in
operation, self-heating of the battery must be considered. In this research, the thermal effect is
studied by comparing the stress conditions of the separator in the models with and without
temperature change.
4.3.1 Temperature Change
Left side Right side

40
The temperature problem is solved with a full cell model in COMSOL. After running under
exactly the same electrochemical conditions for the same amount of time (3400s), the
temperature distribution of the whole battery is obtained. As shown in Fig. 4.5, the temperature
near the convective boundary is relatively low due to the direct convection with air. However,
the gradient of temperature is very small over the whole field, with an overall temperature
change of less than 0.006 (from 336.76 K to 336.766 K). This is because the lithium-ion battery
cell is very thin and most battery components are good thermal conductors. The temperature can
be treated as independent of position (homogeneous at any given time) [31].
Figure 4.5 Temperature distribution of the whole battery
In reality, a thermal management system is always designed as part of a battery to control the
temperature. This system is not just used to remove the heat generated inside the cells, but also
the heat from resistive circuit elements around the cells. It is rather complicated to add this
thermal management system into the simulation model in this research. However, since the best
operation temperature is always maintained between -10°C and 52°C, a uniform temperature can

41
be assumed within this range. In this study, the homogeneous temperature change is assumed to
be 38.8 K (within the best operation temperature range) during one charging period.
4.3.2 Thermal Effect
The thermal influence on separators is investigated by comparing the simulation results of the
models with and without temperature change. Figure 4.6 compares the x-displacement field for
the two cases. As expected, with thermal effects, the total x-displacement of all battery
components increases as a result of both mass diffusion expansion and thermal expansion. The
corresponding average x-strain of the separator increases from 0.729% to 0.806%.
a) Without thermal effect b) With thermal effect
Figure 4.6 X-displacement of the battery model
Figure 4.7 compares the Von Mises stress field for the two cases. As shown, in both conditions,
the maximum Von Mises stress occurs at the center of the inner surface of the separator, which is
the area in contact with the corner of the anode. This study also shows the stress in the separator

42
decreases dramatically after introducing thermal effects into the model. The maximum Von
Mises stress changes from 27.2 MPa to 15.5 MPa, which represents about a 43% decrease.
This phenomenon can be explained by the types of expansion and the differential in thermal
expansions among the battery components. In simulations without thermal effects, all
deformations of the separator are driven by the outer source, like the deformation of the
electrodes induced by lithium ion diffusion. With thermal effects, a part of the deformation in the
separator is contributed by thermal expansion (eigenstrain), and this deformation is much greater
than that of the other components of the battery because the thermal expansion coefficient of the
separator is much larger. Meanwhile, since the total strain of the separator and the anode would
remain the same, an increased eigenstrain would decrease lithium diffusion induced strain.
Overall, the much larger value of the thermal expansion coefficient of separator reduces the local
strain of the separator dramatically.
Figure 4.8 compares the 1st
principle stress field for the two cases. The distribution of the 1st
principle stress in the separator near the corner of the anode is very similar to that of the Von
Mises stress. For the models with and without thermal effects, the maximum 1st principle
stresses are 10.9 MPa and 17.8 MPa, respectively. The contour of the 1st
principle stress in this
area follows the shape of this corner.

43
a) Without thermal effect b) With thermal effect
Figure 4.7 Von Mises stress of the battery model
a) Without thermal effect b) With thermal effect
Figure 4.8 1st
principle stress of the battery
Table 4.2 Comparisons of the models with and without thermal effect
Average x-
strain (%)
Average y-
strain (%)
Maximum Von
mises stress
(MPa)
Maximum 1st
Principal stress
(MPa)
Without
thermal effect
0.729 -0.40 27.2 17.8
With thermal
effect
0.806 0.20 15.5 10.9

44
Above all, the comparisons of the models with and without thermal effects are listed in Table 4.2.
As presented, there would be a huge difference between the models with and without thermal
effects. To better approach the real working conditions of a battery, thermal effects in all the
simulation models will be considered in the following studies.
4.4 Model Validation
This study is sponsored by General Motors (GM). The model prediction is in reasonable
agreement with the experiments conducted at GM. The data will be released in a later time.
4.5 Results and Discussion
Lithium ion batteries all undergo a similar production process; however, there is variation
between batteries due to material selection and the shape of the battery components. Based on
the literature studies [13, 16, 23], a series of parameters were found to have a potential effect on
the strain & stress conditions of a separator. Some of these parameters include the porosity,
interactive forces between separator and electrodes, pressure on the upper surface, thickness of
the separator, particle sizes of the electrodes. They can be generally classified into three groups:
external factors, internal factors and manufacturing factors as shown in Table 4.3.
Table 4.3 Categories of potential factors
External factors Internal Factors
(for electrodes)
Manufacturing
Factors
Factors
Friction
Pressure
Temperature
Particle radius
Porosity
Diffusivity
Thickness
Multiple separators
Corner shape

45
In this work, each category of factors is investigated independently. With the aid of the model
discussed above, each of these factors will be optimized to form a more ideal battery design.
4.5.1 Friction
As introduced in Chapter 3, during the production process of a lithium ion battery, both
electrodes firstly attached to a collector and then come in contact with either side of the separator.
These contacts may result in friction and viscous resistance between the components. In the
simulation model, contact is defined between the separator and adjacent electrodes. A
corresponding effective friction is introduced for each pair of components in contact.
The effective frictions are used to simulate the effects of all kinds of interactions. Since the
separator is relatively soft, the influence of the interactions between the separator and the
electrodes can be significant. Without changing other conditions, the study of the effective
friction is transferred to the study of the effective friction coefficient between these surfaces. In
this work, simulation was conducted with different effective friction coefficients ranging from
0.0 to 0.4. Also the effective friction coefficient between the separator and the anode is assumed
to be the same with that between the separator and the cathode.
As shown in Figure 4.9, the influence of friction can be significant. Generally an increased
effective friction coefficient results in a greater maximum stress evaluated by both Von Mises
stress and the 1st
principal stress. This can be explained by the fact that in order to generate a

46
certain deformation, the separator needs to overcome the resistance coming from it and the
surrounding components. Since the resistance from the surrounding components increases with
friction, to generate the same amount of overall deformation, the local deformation of the
separator (where friction occurs) will also increase to counteract it.
The friction coefficient does not only affect the magnitude, but also the position of the maximum
stress. Figure 4.10 demonstrates this effect; as the value of the friction coefficient causes the
maximum stress to increase, its location in the separator gradually shifts from the center of the
corner to the upper part of the corner. This phenomenon can be explained by the fact that the
anode has a much larger contact surface with the upper side than the right side of the separator.
This large ratio results in the friction affected stress concentrating on the upper part of the
separator. It is also the reason why the stress values obtained by the numerical experiment
fluctuate around the trend lines in Figure 4.9.
Figure 4.9 Stresses versus friction coefficient
0
5
10
15
20
25
30
0 0.1 0.2 0.3 0.4 0.5
Str
ess
(MP
a)
Friction coefficient
Maximum Von mises stress
1st Principal stress
Friction coefficient
Maximum Von Mises stress
First Principal stress

47
In the numerical study shown in Figure 4.11, it has been found that homogeneous stress fields
are always formed in the majority of the separator, which is far away from its right side boundary.
By introducing friction, the Von Mises stress value of this area slightly drops from 2.71MPa to
2.62MPa, but variation of the friction coefficient doesn‟t affect the Von Mises stress. Figure 4.12
presents the Von Mises stress of this stable area of the separator versus different friction
coefficients.
Figure 4.10 Von Mises stress in the corner under different friction coefficient conditions

48
Figure 4.11 Von Mises stress of the separator
Figure 4.12 Von Mises stress of the stable area of the separator
From the above results, it can be concluded that friction can only affect the side part of the
separator by shifting the location of the maximum stress and increasing its value. Generally,
better stress conditions in a separator could be achieved by reducing or softening the interactions
0
0.5
1
1.5
2
2.5
3
0 0.1 0.2 0.3 0.4 0.5
Vo
n M
ises
str
ess
(MP
a)
Friction coefficientFriction coefficient

49
between the separator and its surrounding electrodes. This can be treated as a reference standard
when choosing materials for the components of lithium ion batteries.
4.5.2 Pressure
In this study, the prismatic pouch cells have a flexible, foil-type case. In applications, to maintain
the volume, the battery packs are clamped between a pair of parallel plates, which is equivalent
to applying a uniform pressure at the surface of a pouch cell. Pressure could affect the contact
conditions between different components, the overall electrochemical performance, as well as
the mechanical performance. In this research, only the influence of pressure on the mechanical
performance of the separator is studied. Considering the pressure could also change the friction
between the separator and its surrounding electrodes, all friction coefficients are assumed to be
zero in order to study the effects of pressure independently.
The pressure range considered in this study is 5psi ~ 90psi (0.0345MPa~0.621MPa). Figure
4.13a shows the influence of pressure on the average strain components. As presented, the x
component of the average strain increases with pressure, while the y component decreases with
pressure. The increment of the x component is relatively small compare to the decrement of the y
component. This is because the pressure is only added in the y direction and the dimension in the
x direction is much larger than that in the y direction, therefore the separator deforms more easily
in the y direction. The y component decreases with pressure because the thermally induced
eigenstrain is a positive value, thus lower average strain yields a larger deformation.

50
Figure 4.13 Effect of pressure on (a) the average strain components, (b) the Von Mises stress of
the separator.
Figure 4.13b shows how pressure influences the stress conditions on the separator. This chart
indicates that increasing pressure causes the maximum Von Mises stress to decrease and the
stable Von Mises stress on the left side of the separator to increase. The former effect can be
explained by the fact that higher pressure increases the deformation of the separator in x
direction; which, in order to maintain volume, decreases the anode expansion induced
0
0.2
0.4
0.6
0.8
1
0 50 100
Aver
age
stra
in (
%)
Pressure (psi)
x-component
y-component
a)
0
4
8
12
16
20
0 50 100
Vo
n m
ises
str
ess
(MP
a)
Pressure (psi)
Maximum stress
Stable stress
b)
Pressure (psi)
Pressure (psi)
Maximum stress
Stable stress
x-component
y-component

51
deformation at the same time. The latter effect is consistent with the change of the y component
of local strain as illustrated above. The change of the stable Von Mises stress is very small. It can
be treated as independent of pressure in the range of 5psi~90psi.
Unlike the friction, pressure does not affect the position of the maximum stress, which, as shown
in Figure 4.14, is always located in the inner surface near the corner of the anode. It‟s important
to note that in the upper surface of the separator near the corner of the cathode, a high stress area
gradually forms with increasing pressure. In this area the effect of the pressure is evident. Both
stress level and its area expand with increasing pressure.
P=10psi P=20psi
P=40psi P=80psi
Figure 4.14 Von Mises stress condition of the separator under different pressures

52
In summary, since higher pressure results in a lower maximum stress and unchanged stable stress
in the separator, the mechanical performance of the separator can be improved by introducing
higher pressure. However, in a general working condition, when the pressure just ranges from
5psi to 20psi; its influence over stress conditions in the separator is very small (within 1.5%,
predicted by this model).
4.5.3 Combination of Friction and Pressure
As discussed in 4.5.2, pressure is able to affect the stress conditions of the separator by changing
the deformation of the separator directly and friction between the separator and electrodes.
Therefore, when designing a battery, it is important to consider both friction and pressure. In this
study, both factors are explored in order to optimize the best external operating conditions on the
separator.
As shown in Fig. 4.15a and 4.15b, the scatters of both the x- and y- components of the average
strain overlap under different friction coefficients. In Fig. 4.15a, the x component of the average
strain remains constant under all friction and pressure conditions, which indicates the overall
deformation of the separator in the x direction is independent of both friction and pressure. In Fig.
4.15b, the y component of average strain decreases linearly with increasing pressure regardless
of the friction coefficient. This is inconsistent with the results obtained in 4.5.1 and 4.5.2.
Overall, it can be concluded that friction cannot effect the overall deformation of the separator,
and pressure can only produce some effect in the y direction.

53
Figure 4.15 Influences of both pressure and friction on the strain & stress conditions of the
separator
0
0.2
0.4
0.6
0.8
1
0 50 100X c
om
po
nen
t o
f av
erag
e st
rain
(%)
Pressure (psi)
f=0.1
f=0.2
f=0.3
a)
0
0.05
0.1
0.15
0.2
0.25
0 50 100
Y c
om
po
nen
t o
f av
erag
e
stra
in (
%)
Pressure (psi)
f=0.1
f=0.2
f=0.3
b)
0
7
14
21
28
35
0 50 100
Max
imu
m v
on m
ises
str
ess
(MP
a)
Pressure (psi)
f=0.1
f=0.2
f=0.3
c)
Pressure (psi)
Pressure (psi)
Pressure (psi)

54
However, the influences of both factors on local strain are significant as presented in Figure
4.15c. Generally, higher friction coefficients can result in larger maximum Von Mises stress.
When the friction coefficient is small (≤ 0.2), the maximum Von Mises stress increases with
pressure. When the friction coefficient is relatively large, such as 0.3, the maximum Von Mises
stress fluctuates around a certain value.
For a general operating pressure of less than 20psi, and a friction coefficient less than 0.2, the
value of the maximum Von Mises stress stays in a relatively small range. This condition can be
recognized as the best external operation conditions for the separator.
4.5.4 Temperature
Battery temperatures are capable of affecting the battery‟s performance and life. As mentioned in
4.3, the thermal management of the battery is a critical element for achieving the desired
performance and calendar life for the battery; for this reason researchers are paying increasing
attention to battery thermal analysis and management. For the linear system considered in this
study, thermal effect is only represented by thermal expansion, which is a result of temperature
change. Since the best operating temperature is always maintained in the range of -10°C~ 52°C,
uniform temperature change is assumed to range between 10K and 60K.
As presented in Fig. 4.16, the maximum Von Mises stress decreases linearly with increasing
temperature change. This value can drop dramatically from 24MPa to 9.6MPa as shown in Fig.
4.17. This phenomenon can also be explained by the differential in thermal expansions of the

55
battery components. The relatively large thermal expansion coefficient of the separator can
further reduce the local strain of the separator under larger temperature change by introducing
more thermal eigenstrains.
Figure 4.16 Maximum Von Mises stress of the separator versus temperature change
Figure 4.17 shows the position of the maximum Von Mises stress gradually shifts from the
center to the lower side of the corner of the separator.
In conclusion, higher temperature change results in a lower maximum stress in the separator,
lowering the possibility of failure. However, it should be noted that higher temperatures can
affect the electrochemical performance of a lithium ion battery, or even cause safety problems.
Therefore temperature change should be managed properly. The assumed temperature change
(38.76K) in this study is a reasonable value.
0
5
10
15
20
25
30
0 20 40 60 80
Max
imu
m v
on m
ises
str
ess
(MP
a)
Temperature change (K)Temperature change (K)

56
ΔT=20K ΔT=30K
ΔT=50K ΔT=60K
Figure 4.17 Von Mises stress condition of the separator around the corner
4.5.5 Particle Radius
Particle radius is an important factor that researchers are interested in. Researchers have shown
that smaller particle radii can result in smaller lithium gradient induced hydrostatic stresses
inside the electrode [16, 23]. However, the influence of particle radii on the overall deformation
of the electrode and the separator is not known.

57
In this part of study, three pairs of particle radii of the anode and cathode are used to perform the
analysis. They are estimated from Reference 34 and Reference 35 by using the values of the r10,
r50 and r90 particle radii, as shown in Table 4.4.
Table 4.4 Three pairs of particle radius
Pair1 (r10)
(μm)
Pair2 (r50)
(μm)
Pair3 (r90)
(μm)
Anode 8.4 11.5 16
Cathode 2.45 3.35 4.65
*The definition of r10 is: the equivalent radius that 10 % particles of the electrode have a smaller
equivalent radius than this value [43]. The definition of r50 and r90 can be derived similarly.
In this study, the particle radius is changed under the same volume fraction of active materials
for both electrodes. Figure 4.18 presents the lithium concentration of both the anode and cathode
along the thickness at the end of a charging period with different particle radii.
As shown, the particle radius can change the average cross-section lithium concentration. For the
anode, higher anodic particle radii result in a smaller lithium concentration gradient, while the
cathodic particle radii can only change the absolute value of the concentration. For the cathode,
higher cathodic particle radii result in a larger concentration gradient, while the anodic particle
radii can nonlinearly change the absolute value of the concentration.

58
Figure 4.18 Concentration distributions along the thickness of the electrodes
22500
22800
23100
23400
23700
24000
24300
24600
0 10 20 30 40 50 60
Lit
hiu
m C
once
ntr
atio
n (
mo
l/m
³)
Thickness (μm)
8.4-2.45
8.4-3.35
8.4-4.65
11.5-2.45
11.5-3.35
11.5-4.65
16-2.45
16-3.35
16-4.65
Rneg - Rpos
Anode
3780
3790
3800
3810
3820
3830
3840
3850
3860
70 90 110 130 150
Lit
hiu
m C
once
ntr
atio
n (
mo
l/m
³)
Thickness (μm)
8.4-2.45
8.4-3.35
8.4-4.65
11.5-2.45
11.5-3.35
11.5-4.65
16-2.45
16-3.35
16-4.65
Rneg - Rpos
Cathode
Thickness (μm)
Thickness (μm)
Anode
Cathode

59
Figure 4.19 presents the maximum Von Mises stress of the separator under differing particle
radii. As shown, the maximum Von Mises stress is maintained around 15.5MPa regardless of the
particle radii. This can be explained by the fact that even though the lithium concentration along
the thickness is changed by the particle radii, the overall changes in both electrodes are very
small. Taking the anode as an example, high particle radii, like 16-4.65μm, can increase the
concentration in lower thickness area up to 1.2%, but it can also decrease the concentration in
higher thickness area by the same percentage. Therefore, the average concentration in the whole
anode changes very slightly.
Figure 4.19 Maximum Von Mises stress of the separator under the conditions with different
particle radii
In conclusion, under the same volume fraction of active materials for both electrodes and the
same temperature change, the particle radii do not yield any effect on the maximum stress of the
separator. However, in reality smaller particles are often preferred due to some other
0
3
6
9
12
15
18
7 12 17Max
imu
m v
on m
ises
str
ess
(MP
a)
Anodic particle radius (μm)
Same cathodic paricle radius
0
3
6
9
12
15
18
2 2.7 3.4 4.1 4.8
Cathodic particle radius (μm)
Same anodic particle radius
Anodic particle radius (μm) Cathodic particle radius (μm)
Same cathodic
particle radius Same anodic
particle radius

60
performances, like particles with smaller size may deliver more power, energy, and decrease the
lithium gradients induced hydrostatic stresses inside the particles of active materials. [16, 23]
4.5.6 Thickness of Separator
For high energy density applications, smaller separator thickness is desirable in order to achieve
a lower internal resistance. However, the safety concern with respect to mechanical integrity and
penetration must be considered. The thicker the separator, the greater the mechanical strength
and the lower the probability of punctures during cell assembly, but the larger the overall volume
of the whole battery. In recent years, a trend to achieve higher capacity is by reducing the
thickness of the separators [8], which gives more space for active materials. The most widely
used thickness for the separator of lithium ion batteries ranges from 20μm to 30μm.
As shown in Fig. 4.20, in the range of 20μm to 30μm, the maximum Von Mises stress in the
separator increases with increasing thickness as the stress in the stable parts of the separator
slightly decreases. This indicates that a thinner separator sustains a relatively small maximum
stress during cell operation.

61
Figure 4.20 Von Mises stress of the separator versus thickness
In conclusion, thinner separators can result in smaller maximum stresses in the separator in
operation. However, it should be noted that shorter thickness could also bring in lower
mechanical strength and higher probability of punctures during cell assembly.
0
4
8
12
16
20
19 24 29 34
Vo
n m
ises
str
ess
(MP
a)
Thickness of separator (μm)
Maximum stress
Stable stress
Maximum stress
Stable stress
Thickness of the separator (μm)

62
CHAPTER 5 SUMMARY AND CONCLUSION
5.1 Summary and Conclusion
In this research, a numerical model for the stress analysis of separator in a prismatic lithium ion
battery is developed. Three groups of phenomena that occurred inside the battery cell were
considered in order to perform the stress analysis. They are electrochemical, thermal and
mechanical phenomena. The two main sources of stress on a separator investigated in this study
are lithium diffusion induced and thermally induced stress.
By introducing self-heating phenomena and a modified strain relationship into the pseudo 2-D
models proposed by Doyle et al., a macro-scale 2-D 1.5-cell model was developed to evaluate
stresses in the separator of a pouch cell. In this model, the electrodes and the separator were
treated as homogenized media. The porous electrodes were considered a composite of electrode
particles in an electrolyte matrix, and their effective properties were computed using the rule of
mixtures. To couple these two models, this study also introduced two other connecting models.
The simulation processes were divided into two steps: obtain the lithium and temperature
distributions in COMSOL, and then perform stress analysis in ANSYS. The mechanical
influences of stress on the lithium and temperature distributions were neglected. This
approximation was discussed in Chapter 4.

63
It was demonstrated that the maximum Von Mises stress of the separator always emerged at the
inner center of its corner when the lithium ion battery was fully charged, and the rest of the
separator was in a relatively low and stable stress state. This study focused on this area
vulnerable of failure.
A verified effective length was used in this study to solve the infeasibility of building an entire
battery due to its large length to thickness ratio.
Thermal effects were demonstrated to be significant. The simulations revealed that although the
thermal expansion increased the average strains in the electrodes and in the separator, the local
maximum stress and strain in the separator actually decreased with rising temperature.
External, internal and manufacturing factors were studied with a 2-D battery cell model at the
same fully charged state. It was shown that the maximum Von Mises stress increased with
increasing separator thickness and interactions between the separator and its adjacent electrodes,
while the stress decreased with increasing surface pressure and temperature change of the battery.
Under the same volume fractions of active materials, the particle radii of both electrodes didn‟t
affect the stress conditions in the separator. Thus, the optimized conditions for these factors are:
low effective friction coefficient (<0.2), high pressure, large temperature change and thin
thickness. However, it should be noted that in reality some additional performances of a battery
should be considered when optimizing these parameters. For example, thinner thickness can
result in lower mechanical strength and a higher probability of punctures during cell assembly,
and the temperature cannot exceed the best operating temperature range.

64
In summary, the simulation models made in this study can be used as a design tool to optimize
the stress conditions in separators. The predicted results can work as reference conditions for the
design of lithium ion batteries.
5.2 Future Work
This is the first reported work on stress analysis of a separator inside a lithium ion battery.
Limited by the knowledge on the multi-physics problems and database, linear and homogeneous
assumptions were made in the model, thus the stress values derived from this model are not
accurate. However, this model can be used to analyze the general stress conditions of the
separator in a lithium ion battery cell and the trend of the influence of some design adjustable
parameters. In order to advance this study, further work is need in the following two aspects: (1)
improvement of the existing model, and (2) fundamental studies on material constitutive
behaviors.
5.2.1 Improvement of the Model
The accuracy of the simulation models and the coupling methods may be improved. The areas to
be improved include:
1) Develop a realistic porous material model to replace the homogeneous solid models.
2) Consider the shape of micro-scale particles around the area of potential failure.

65
3) Improve the robustness of the contact definition in COMSOL so that all the phenomena
may be simulated simultaneously.
4) Consider the effect of stress on diffusion.
With an improved model, in addition to revisiting the parameters investigated in this thesis,
further investigations may be conducted to study the prismatic cells with alternative methods of
wrapping and to study the stress in cylindrical cells.
5.2.2 Fundamental Studies on Material Constitutive Behaviors
In order to better approximate real world conditions, nonlinear relationships should be
considered instead of linear assumptions. In a parallel project, the viscoelastic behavior of
polymeric separator in battery environment and its modeling is under investigation [46]. In future
work, a time, temperature dependent constitutive model for separator can be incorporated into
the model developed in this work.
Recent studies revealed that, with increasing lithium concentration, the Young‟s modulus of the
anode materials can change up to three folds. It was reported that Si–Li phase decreases [47]
whereas the Young modulus of C-Li phase increases [48] with lithium concentration.
Experimental investigations will be conducted to verify these computational results and
concentration dependent constitutive models will be developed.

66
APPENDICES
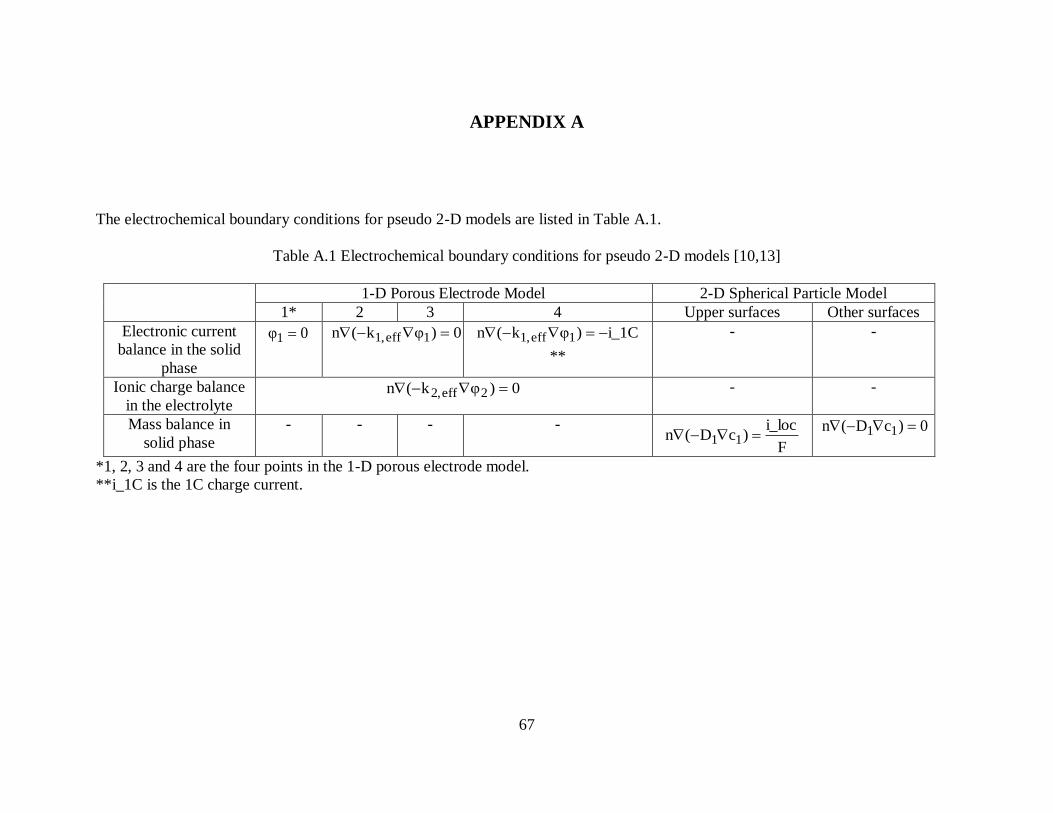
67
APPENDIX A
The electrochemical boundary conditions for pseudo 2-D models are listed in Table A.1.
Table A.1 Electrochemical boundary conditions for pseudo 2-D models [10,13]
1-D Porous Electrode Model 2-D Spherical Particle Model
1* 2 3 4 Upper surfaces Other surfaces
Electronic current
balance in the solid
phase
0φ1 0)φk(n 1eff1,
i_1C)φk(n 1eff1,
**
- -
Ionic charge balance
in the electrolyte 0)φk(n 2eff2, - -
Mass balance in
solid phase
- - - -
F
i_loc)cD(n 11
0)cD(n 11
*1, 2, 3 and 4 are the four points in the 1-D porous electrode model.
**i_1C is the 1C charge current.

68
APPENDIX B
In this study, to have a robust contact definition between the separator and its adjacent electrodes,
the macro-scale 2-D model is solved in ANSYS instead of COMSOL. Diffusion analysis is not
available in ANSYS. Based on thermal-diffusion analogy, mass diffusion analysis can be
performed using the thermal module. The correlation between mass diffusion and thermal
diffusion is derived and depicted in this appendix.
B.1 Diffusion Equation
In AYSYS, the basis for thermal analysis is a heat balance equation obtained from the principle
of conservation of energy [44], as shown in Equation B.1 in Cartesian co-ordinates. [45]
qz
Tk
zy
Tk
yx
Tk
xz
TV
y
TV
x
TV
t
Tc zyxzyxp
)()()()( (B.1)
where, ρ is density, pc is specific heat capacity, T is temperature, t is time, V is velocity, k is
thermal conductivity, and q is heat generation rate per unit volume. This is also the general form
of the convection–diffusion equation. In this work, only diffusion is considered. The heat balance
equation for the 2-D model can be simplified as:
qy
Tk
yx
Tk
xt
Tc yxp
)()( (B.2)
While the concentration field induced by diffusion can be predicted by Fick‟s second law as
presented in Equation B.3

69
)()(y
cD
yx
cD
xt
cyx
(B.3)
where c is the concentration, D is the diffusion coefficient. Comparing Equation B.2 and B.3, q
is assumed to be zero since no mass is generated inside the lithium ion battery. In this work, the
diffusion coefficient is also assumed to be isotropic. Therefore, Equation B.2 and B.3 can be
simplified into Equation B.4 and B.5 respectively.
Tc
k
t
T
p
2
(B.4)
cDt
c 2
(B.5)
By comparison, the relationship between diffusion coefficient and effective thermal conductivity
is assumed as shown in Equation B.6.
Dc
k
p
(B.6)
In order to make proper substitutions for all the constants, the boundary conditions should also
be considered.
Thermal flux TkJT
Mass flux cDJ M (B.7)
To obtain the same boundary flux, the thermal conductivity is assumed to be the diffusion
coefficient. Meanwhile, Equation B.6 should also be satisfied. Thus,
1pc (B.8)
B.2 Diffusion Induced Strain

70
In order to obtain the equivalent diffusion induced strain by using heat conduction equation, the
strain law should adjusted accordingly. By comparing thermal induced strain and mass diffusion
induced strain in an isotropic material as shown in Equation B.9, the assumption is given by
Equation B.10.
Thermal strain ijTei
ij T _
Mass diffusion induced strain ijcei
ij c 3
1_ (B.9)
3
1 (B.10)
A correspondence between the thermal and mass diffusion parameters is presented in Table B.1.
Table B.1 Correspondence between thermal and mass diffusion parameters
Mass diffusion Parameter Thermal Parameter Relationship
Description Symbol Description Symbol
Thermal
conductivity
D Diffusion
coefficient
k k=D
Density ρ Density ρ ρ=ρ
- - Specific heat
capacity pc
ρ
1cp
Mass generation
rate per unit
volume
m
Heat generation
rate per unit
volume
q
0mq
Partial molar
volume
Ω Thermal expansion
coefficient
α α=1/3Ω

71
APPENDIX C
As introduced in Appendix B, for the 2-D macro-scale 2-D model the thermal module in ANSYS
has already been converted into a mass diffusion module to analyze the diffusion induced stress.
In order to add temperature change on this converted module, the temperature change should be
converted to an effective concentration change to introduce equivalent effects.
As shown in Equation 2.15, to generate the same amount of strain, the relationship between
temperature and effective concentration is
Tc effeff 3
1 (C.1)
where effΔc is the effective concentration, ΔT is the temperature change, effα is the effective
thermal expansion coefficient. Thermal expansion coefficients of solid electrode particles and
electrolytes are different. The effective thermal expansion coefficient for the whole electrode can
be obtained by applying the rule of mixture. The effective concentration can be calculated by:
TVV
Tceeppeff
eff
)(33 (C.2)
It should be noted that the expansion of some the other small parts of the electrodes, like the
binders, are neglected.

72
REFERENCES

73
REFERENCES
1. M. Silberberg, Chemistry: The Molecular Nature of Matter and Change, 4th ed. New York:
McGraw-Hill Education, 2006.
2. S. S. Zhang, “Battery Separator”, SciTopics, July 22, 2008, accessed July 2, 2010,
http://www.scitopics.com/Battery_Separator.html.
3. K. Nishio and N. Furukawa, “Practical Batteries”, in Handbook of Battery Materials, ed. J. O.
Besenhard, New York: Wiley-VCH, 1999.
4. L. Gaines and R. Cuenca, “Costs of Lithium-Ion Batteries for Vehicles”, accessed August 11,
2010, http://www.transportation.anl.gov/pdfs/TA/149.pdf.
5. M. D. Farrington, “Safety of Lithium Batteries in Transportation”, Journal of Power Sources,
96, (2001), 260-265.
6. C. Daniel, “Materials and Processing for Lithium-Ion Batteries”, JOM, Vol. 60 No.9, 2008,
http://www.tms.org/pubs/journals/jom/0809/daniel-0809.html.
7. P. Arora and Z. M. Zhang, “Battery separators”, Chem. Rev. 2004, 104, 4419-4462.
8. S. S. Zhang, “A review on the separators of liquid electrolyte Li-ion batteries”, Journal of
Power Sources, 164 (2007) 351–364.
9. “Products”, accessed October 12, 2010, http://www.celgard.com/.
10. “A Rechargeable Lithium-ion Battery Model – Charge and Discharge Behavior”, COMSOL,
accessed December 2, 2010, http://www.comsol.asia/showroom/gallery/686/.
11. Advisory Notice: “Transportation Of Lithium Batteries”, Federal Register, 65, No. 174,
(2000), Notice No. P54336.
12. M. Doyle, T.F. Fuller, J. Newman, “Modeling of Galvanostatic Charge and Discharge of the
Lithium/Polymer/Insertion Cell”, Journal of the Electrochemical Society, 140 (1993) 1526–
1533.
13. M. Doyle, J. Newman, A.S. Gozdz, C.N. Schmutz and J.M. Tarascon, “Comparison of
Modeling Predictions with Experimental Data from Plastic Lithium Ion Cells”, Journal of the
Electrochemical Society, 143 (1996) 1890–1903.
14. J. Christensen and J. Newman, “A Mathematical Model of Stress Generation and Fracture in
Lithium Manganese Oxide”, Journal of the Electrochemical Society, 153 (2006), A1019–
A1030.
74
15. J. Christensen and J. Newman, “Stress Generation and Fracture in Lithium Insertion
Materials”, Journal of Solid State Electrochemistry, 10 (2006) 293–319.
16. X.C. Zhang, W. Shyy and A.M. Sastry, “Numerical Simulation of Intercalation-Induced
Stress in Li-Ion Battery Electrode Particles”, Journal of the Electrochemical Society, 154,
(2007) A910–A916.
17. Y.T. Cheng and M.W. Verbrugge, “Evolution of Stress within a Spherical Insertion Electrode
Particle under Potentiostatic and Galvanostatic Operation”, Journal of Power Sources, 190
(2009) 453–460.
18. Y.T. Cheng and M.W. Verbrugge, “The Influence of Surface Mechanics on Diffusion Induced
Stresses within Spherical Nanoparticles”, Journal of Applied Physics, 104, 083521 (2008).
19. M.W. Verbrugge and Y.T. Cheng, “Stress and Strain-Energy Distributions within Diffusion-
Controlled Insertion-Electrode Particles Subjected to Periodic Potential Excitations”, Journal
of the Electrochemical Society, 156 (2009), A927–A937.
20. S. Renganathan, G. Sikha, S. Santhanagopalan and R. E. White, “Theoretical Analysis of
Stresses in a Lithium Ion cell”, Journal of the Electrochemical Society, 157 (2) (2010) A155-
A163.
21. S. Golmon, K. Maute and M. L. Dunn, “Numerical Modeling of Electrochemical-Mechanical
Interactions in Lithium Polymer Batteries”, Computers and Structures, 87 (2009) 1567–1579.
22. L. Cai and R. E. White, “Mathematical Modeling of a Lithium Ion Battery”, Proceedings of
the COMSOL Conference 2009 Boston.
23. R. E. Garcia, Y.M. Chiang, W.C. Carter, P. Limthongkul and C.M. Bishop, “Microstructural
Modeling and Design of Rechargeable Lithium-Ion Batteries”, Journal of the Electrochemical
Society, 152 (2005) A255–A263.
24. X. Xiao, W. Wu and X. Huang, “A Multi-Scale Approach for the Stress Analysis of
Polymeric Separators in a Lithium-Ion Battery”, Journal of Power Sources, 195, (2010),
7649-60.
25. X. C. Zhang, A. M. Sastry and W.Shyy, “Intercalation-Induced Stress and Heat Generation
within Single Lithium-Ion Battery Cathode Particles”, Journal of the Electrochemical Society,
155 (7) (2008) A542-A552.
26. V. Srinivasan and C. Y. Wang, “Analysis of Electrochemical and Thermal Behavior of Li-Ion
Cells”, Journal of the Electrochemical Society, 150 (1) (2003) A98-A106.
27. K. E. Thomas and J. Newman, “Thermal Modeling of Porous Insertion Electrodes”, Journal
of the Electrochemical Society, 150 (2) (2003) A176-A192.
28. W. Wu, X. Xiao and D. Shi, “Heat Transfer and Thermal Stress in a Lithium-Ion Battery”,
IMECE2010-37870, Proceedings of the ASME 2010 Congress, Nov, 2010.

75
29. M. Alamgir, “Primary & Secondary Batteries – Other Technologies”, Presentation at the 26th
International Battery Seminar & Exhibit, March 16-19, 2009, Fort Lauderdale, Florida.
30. K. Kumaresan, G. Sikha, and R. E. White, “Thermal Model for a Li-Ion Cell”, Journal of the
Electrochemical Society, 155 (2) (2008) A164-A171.
31. K. E. Thomas, C. Bogatu and J. Newman, “Measurement of the Entropy of Reaction as a
Function of State of Charge in Doped and Undoped Lithium Manganese Oxide”, Journal of
the Electrochemical Society, 148 (6) (2001) A570-A575.
32. S. A. Hallaj, R. Venkatachalapathy, J. Prakash and J. R. Selman, “Entropy Changes Due to
Structural Transformation in the Graphite Anode and Phase Change of the LiCoO2 Cathode”,
Journal of the Electrochemical Society, 147 (7) (2000) 2432-2436.
33. R. Deshpande, Y. Qi and Y. T. Cheng, “Effects of Concentration-Dependent Elastic Modulus
on Diffusion-Induced Stresses for Battery Applications”, Journal of the Electrochemical
Society, 157 (8) (2010) A967-A971.
34. Products, Timcal Graphite & Carbon, accessed December 1, 2010,
http://www.timcal.com/scopi/group/timcal/timcal.nsf.
35. Products, Toda America, accessed December 1, 2010,
http://www.todaamerica.com/products/products.html.
36. A. K. Shucla and T. P. Kumar, “Materials for Next Generation Lithium Batteries”, Current
Science Association, 94(3) (2008), pp. 314-331.
37. M. S. Whittingham, “Materials Challenges Facing Electrical Energy Storage”, MRS Bulletin,
33 (4) (2008), pp.411-419.
38. K. K. Chawla, Composite Materials Science and Engineering, New York: Springer-Verlag,
1987.
39. W.D. Callister, Materials Science and Engineering, an Introduction, 5th ed, New York: John
Wiley & Sons, Inc, 2000.
40. S. J. Harris, A. Timmons, D. R. Baker and C. Monroe, “Direct In-Situ Measurements Of Li
Transport in Li-Ion Battery Negative Electrodes”, Chemical Physics Letters, 485 (2010) 265-
274.
41. R. Spotnitz and J. Franklin, “Abuse Behavior of High-Power, Lithium-Ion Cells”, Journal of
Power Sources, 113 (2003) 81–100.
42. “Charging lithium-ion batteries”, Battery University, accessed November 14,
http://batteryuniversity.com/index.php/learn/article/charging_lithium_ion_batteries;
43. “D10, D50 and D90”, accessed November 16,
http://www.lactose.com/particle_size/d10_d50_d90.html.

76
44. “ANSYS Thermal Analysis Guide”, accessed October 21, 2010,
http://www1.ansys.com/customer/content/documentation/100/ansys/gthe100.pdf.
45. D. R. Hose, B. Griffiths, S. Mahmood, J. Gunn, D. Sweeney, J. Kelly and P. V. Lawford,
“Modelling drug delivery from stents using ANSYS”, accessed July 2, 2010,
http://www.technet-alliance.com/uploads/tx_caeworld/drugdelivery.pdf.
46. A. Sheidaei, X, Xiao, J. Wang and X. Huang, “Mechanical Characterization of a Lithium Ion
Battery Separator Using a Dynamic Mechanical Analyzer”, SAE 2011-PFL-168, Detroit MI,
April, 2011.
47. V. B, Shenoy, P. Johari and Y. Qi, “Elastic Softening of Amorphous and Crystalline Li-Si
Phases with Increasing Li Concentration: A First-Principles Study”, Journal of Power
Sources, 195 (2010) 6825–6830.
48. Y. Qi, H. Guo, L.G. J. Hector and A. Timmons, “Three-Fold Increase in the Young's Modulus
of Graphite Negative Electrode during Lithium Intercalation”, J Electrochemical Society, 157
(2010) A558-566.