
Stress Analysis of Bolted, Segmented Cylindrical Shells ... · PDF fileAmerican Institute of...
20
American Institute of Aeronautics and Astronautics 092407 1 Stress Analysis of Bolted, Segmented Cylindrical Shells Exhibiting Flange Mating-Surface Waviness Norman F. Knight, Jr. 1 General Dynamics – Advanced Information Systems, Chantilly, VA 20151 Dawn R. Phillips 2 NASA Marshall Space Flight Center, Huntsville, AL 35812 and Ivatury S. Raju 3 NASA Langley Research Center, Hampton, VA 23666 Bolted, segmented cylindrical shells are a common structural component in many engineering systems especially for aerospace launch vehicles. Segmented shells are often needed due to limitations of manufacturing capabilities or transportation issues related to very long, large-diameter cylindrical shells. These cylindrical shells typically have a flange or ring welded to opposite ends so that shell segments can be mated together and bolted to form a larger structural system. As the diameter of these shells increases, maintaining strict fabrication tolerances for the flanges to be flat and parallel on a welded structure is an extreme challenge. Local fit-up stresses develop in the structure due to flange mating-surface mismatch (flange waviness). These local stresses need to be considered when predicting a critical initial flaw size. Flange waviness is one contributor to the fit-up stress state. The present paper describes the modeling and analysis effort to simulate fit-up stresses due to flange waviness in a typical bolted, segmented cylindrical shell. Results from parametric studies are presented for various flange mating-surface waviness distributions and amplitudes I. Introduction HE manufacturing and assembly of large-diameter cylindrical shells and annular ring segments are difficult tasks in terms of maintaining stringent assembly tolerances on flatness, perpendicularity, and parallelism of the mating surfaces. Shell segment mating tests can be performed by stacking shell segments together and taking gap measurements on the front (i.e., outside diameter or OD) and back (i.e., inside diameter or ID) sides of the flange mating surfaces. These gap measurements are referred to as the “free-state” gaps since only the dead weight of the top shell segment is applied and bolt preload is not applied. Shimming using either mechanical shims, liquid shimming, or a combination is one way to mitigate the magnitude of any measured gaps along the OD and/or the ID. A combined shimming process involves mechanical shims of varying sizes used with liquid shimming material applied to even out the flange-mating surface. Assuming that the free-state gaps are shimmed, any remaining gaps around the circumference of the shell segment would be less than some specified limit, say 10 mils. The distribution of the remaining gaps is anticipated to be somewhat random and not readily characterized. As an alternative to shimming, the flange-mating surfaces may be machined flat and parallel after the welding process is completed; that is, provided sufficient flange material remains to carry the load. One example of a bolted, segmented cylindrical shell structure is the ARES I-X Upper Stage Simulator (USS). A critical initial flaw size (CIFS) assessment was performed and accounted for residual thermal stresses from the welding process, fit-up stresses due to flange waviness, and applied stresses determined from bounding loads analysis [1-6]. The present paper examines the influence of flange mating-surface waviness on the local axial stress 1 Chief Engineer, Structural Mechanics. Associate Fellow AIAA, Fellow ASME. 2 Aerospace Engineer. Member AIAA. 3 NASA Technical Fellow for Structures, NASA Engineering and Safety Center. Fellow AIAA, Member ASME. T https://ntrs.nasa.gov/search.jsp?R=20090020406 2018-05-19T03:46:57+00:00Z
Transcript of Stress Analysis of Bolted, Segmented Cylindrical Shells ... · PDF fileAmerican Institute of...

American Institute of Aeronautics and Astronautics
092407
1
Stress Analysis of Bolted, Segmented Cylindrical Shells Exhibiting Flange Mating-Surface Waviness
Norman F. Knight, Jr.1 General Dynamics – Advanced Information Systems, Chantilly, VA 20151
Dawn R. Phillips2
NASA Marshall Space Flight Center, Huntsville, AL 35812
and
Ivatury S. Raju3 NASA Langley Research Center, Hampton, VA 23666
Bolted, segmented cylindrical shells are a common structural component in many engineering systems especially for aerospace launch vehicles. Segmented shells are often needed due to limitations of manufacturing capabilities or transportation issues related to very long, large-diameter cylindrical shells. These cylindrical shells typically have a flange or ring welded to opposite ends so that shell segments can be mated together and bolted to form a larger structural system. As the diameter of these shells increases, maintaining strict fabrication tolerances for the flanges to be flat and parallel on a welded structure is an extreme challenge. Local fit-up stresses develop in the structure due to flange mating-surface mismatch (flange waviness). These local stresses need to be considered when predicting a critical initial flaw size. Flange waviness is one contributor to the fit-up stress state. The present paper describes the modeling and analysis effort to simulate fit-up stresses due to flange waviness in a typical bolted, segmented cylindrical shell. Results from parametric studies are presented for various flange mating-surface waviness distributions and amplitudes
I. Introduction HE manufacturing and assembly of large-diameter cylindrical shells and annular ring segments are difficult tasks in terms of maintaining stringent assembly tolerances on flatness, perpendicularity, and parallelism of the
mating surfaces. Shell segment mating tests can be performed by stacking shell segments together and taking gap measurements on the front (i.e., outside diameter or OD) and back (i.e., inside diameter or ID) sides of the flange mating surfaces. These gap measurements are referred to as the “free-state” gaps since only the dead weight of the top shell segment is applied and bolt preload is not applied. Shimming using either mechanical shims, liquid shimming, or a combination is one way to mitigate the magnitude of any measured gaps along the OD and/or the ID. A combined shimming process involves mechanical shims of varying sizes used with liquid shimming material applied to even out the flange-mating surface. Assuming that the free-state gaps are shimmed, any remaining gaps around the circumference of the shell segment would be less than some specified limit, say 10 mils. The distribution of the remaining gaps is anticipated to be somewhat random and not readily characterized. As an alternative to shimming, the flange-mating surfaces may be machined flat and parallel after the welding process is completed; that is, provided sufficient flange material remains to carry the load.
One example of a bolted, segmented cylindrical shell structure is the ARES I-X Upper Stage Simulator (USS). A critical initial flaw size (CIFS) assessment was performed and accounted for residual thermal stresses from the welding process, fit-up stresses due to flange waviness, and applied stresses determined from bounding loads analysis [1-6]. The present paper examines the influence of flange mating-surface waviness on the local axial stress
1 Chief Engineer, Structural Mechanics. Associate Fellow AIAA, Fellow ASME. 2 Aerospace Engineer. Member AIAA. 3 NASA Technical Fellow for Structures, NASA Engineering and Safety Center. Fellow AIAA, Member ASME.
T
https://ntrs.nasa.gov/search.jsp?R=20090020406 2018-05-19T03:46:57+00:00Z
American Institute of Aeronautics and Astronautics
092407
2
state as part of the CIFS assessment. The influence of flange mating-surface mismatch due to local initial geometric surface imperfections along the flange mating surface on the peak tensile axial stress at the top of the fillet weld is assessed for the bolt preload step of the structural analysis from a stress free state (i.e., residual stresses from the welding process are not included in the present paper) and for representative bounding axial flight loads.
The outline of the paper is as follows. First, the shell configuration is described, and the approach to simulating the flange surface-mismatch distribution is discussed. Then, the modeling assumptions are stated. Finally, numerical results and discussion are presented. Three factors that influence the structural response of these shell structures are mismatch distribution, peak gap amplitude, and bolt preload force magnitude. The present paper includes parametric studies performed to understand the influence of these factors on the local axial stress state near the fillet weld.
II. Shell Configuration A common USS cylindrical shell segment shown in Figure 1 is 115 inches tall and 216 inches in diameter with a
0.5-inch-thick shell wall. The radius-to-thickness ratio (R/t) is 216, and the shell length to radius ratio (ℓ/R) is approximately unity. On each end of the cylindrical shell segment, a one-inch-thick flange is welded to the shell wall using a full penetration butt weld and an interior fillet weld. The flange is six inches wide measured from its OD to its ID. To aid in the flange-to-shell assembly, 0.5-inch-thick gussets are installed on the interior of the shell as indicated in Figure 1, and the gussets are spaced 10 apart around the circumference. Each gusset has roughly a 6-inch by 12-inch planform. At the shell-to-flange intersection, each gusset has a 1.5-inch-square cutout to accommodate the fillet weld. This cutout is commonly referred to as a “mouse hole”. Adjacent USS segments are assembled together through a series of 180 bolts with a 2 spacing along the flanges as shown in Figure 2. Nominally, these 7/8-inch-diameter bolts have washers under the bolt head and under the nut, and the bolts are preloaded. The preload axial force in a bolt often is not known precisely; however, for the present paper, a bolt preload axial force of 36,500-lb was used. The dimensions of this bolted joint assembly are presented in Figure 3. Utilizing symmetry, a representative 10-wedge segment could be analyzed for bounding axial running loads. Typical finite element discretization of a 10-wedge segment is shown in Figures 1 and 2.
III. Analysis Approach Flange mating-surface mismatch (flange waviness) studies are performed using the finite element model shown in
Figure 2. The flange-waviness modeling procedure involves extracting the nodes on the mating surface of the flange on the upper shell segment and perturbing their longitudinal location from the original plane defining a perfect flange mating surface. Once perturbed, the finite element model is reflected thereby generating a mirror image of the surface mismatch on the opposite flange. When interelement penetration of a perturbed node location is detected, the node location is adjusted to be exactly on the mating surface (i.e., no mismatch or gap at that node).
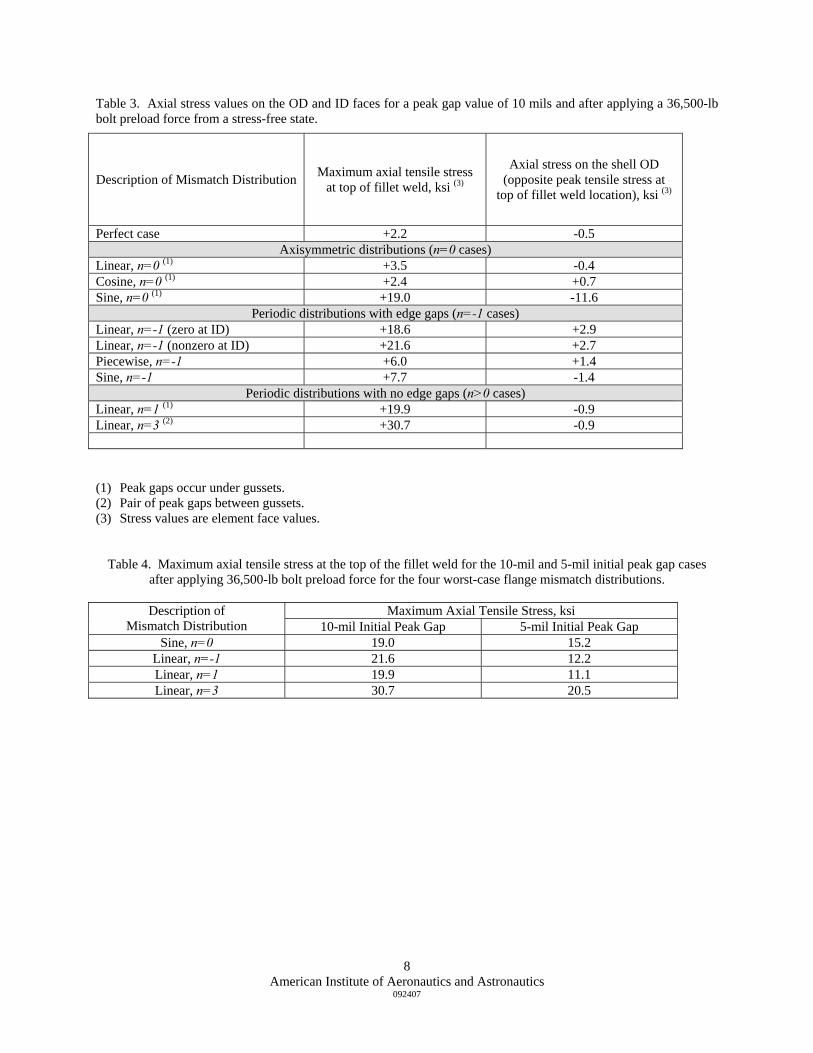
The flange mating-surface mismatch is defined using parametric representations in the radial and circumferential directions as given by:
0)()(),( grfr (1)
using the symbols and nomenclature defined on Figures 4 and 5. The total amplitude of the gap between the two flange outer surfaces is required to be greater than or equal to zero. When the functional form given by Eq. (1) returns a negative value, gap amplitude is assigned a value of zero, thereby avoiding issues of interelement penetration.
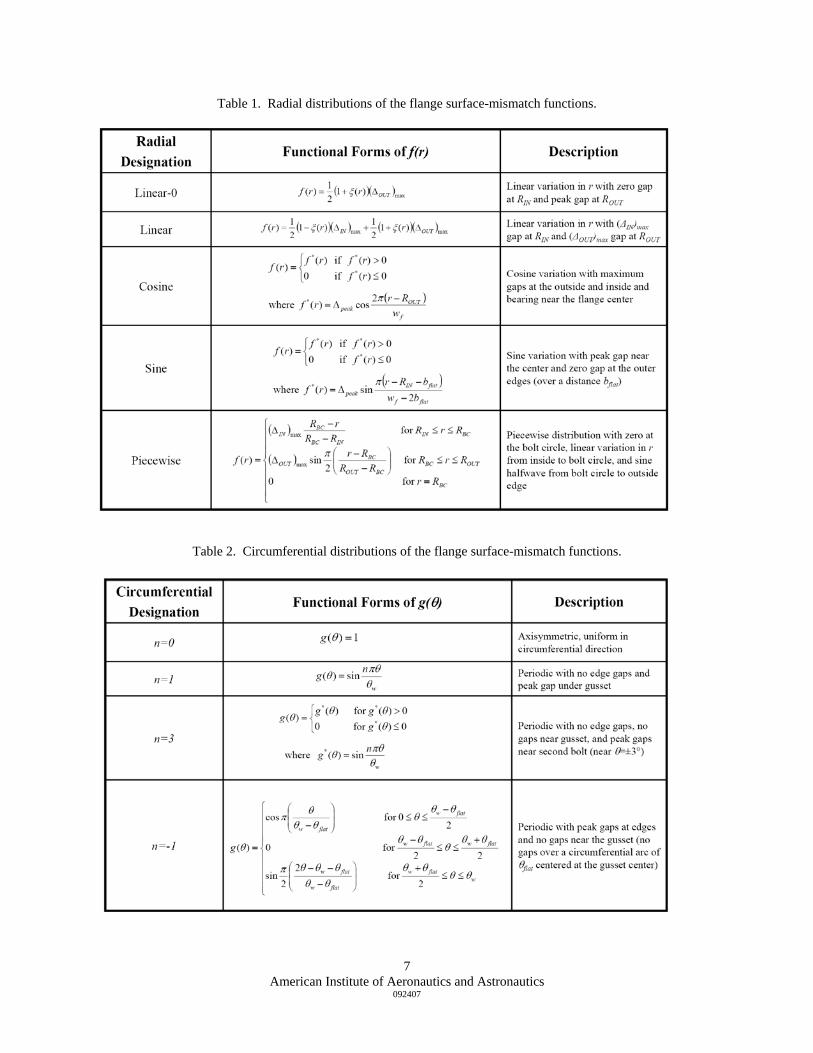
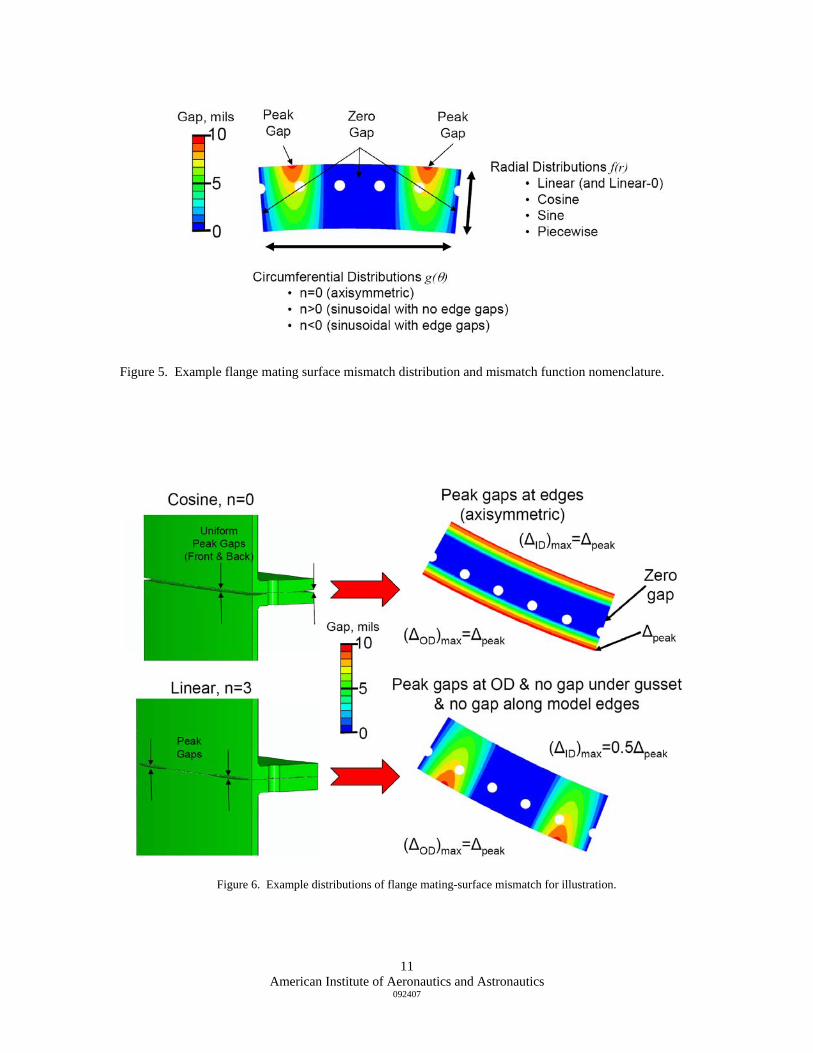
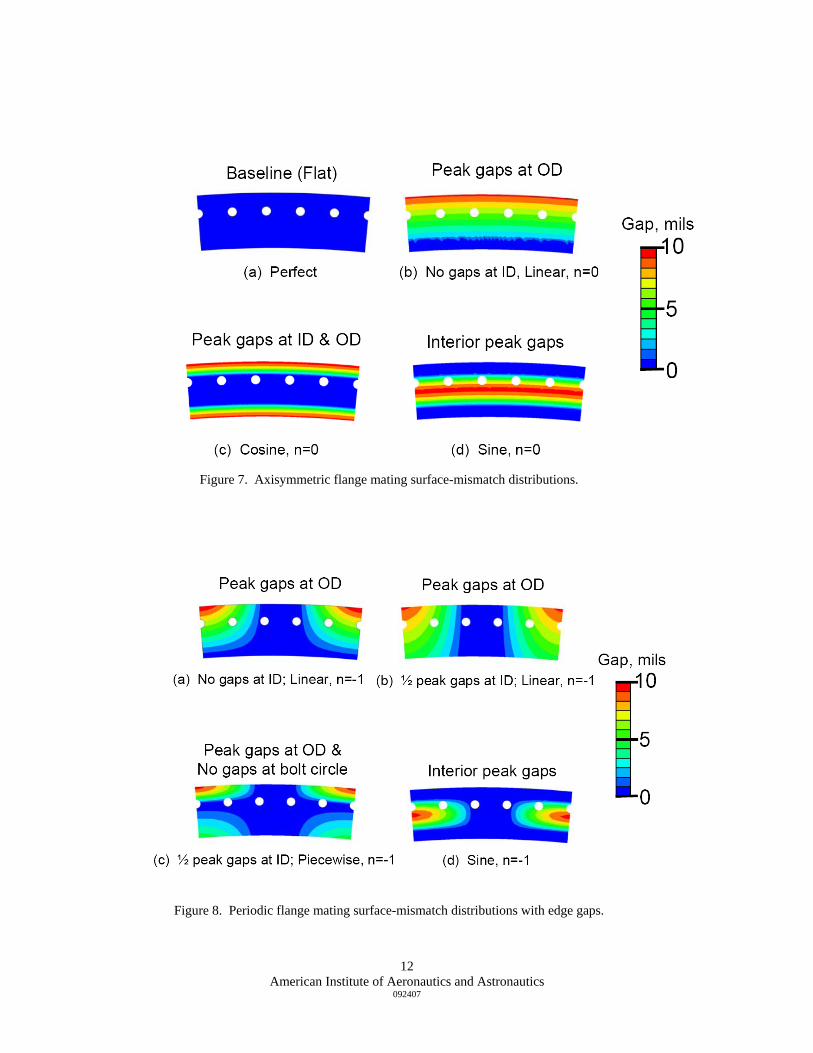
Five radial functions f(r) listed in Table 1 and four circumferential functions g() listed in Table 2 are constructed and provide a capability to generate twenty different flange surface-mismatch distributions. Two distributions are illustrated in Figure 6 where blue represents zero gap amplitude and red represents peak gap amplitudes. For most of the analyses, a 10-mil peak gap amplitude is assumed. Of the twenty possible functional forms represented by Eq. 1 and the functions given in Tables 1 and 2, only the nine different flange surface-mismatch distributions shown in Figures 7 through 9 were analyzed as representative flange-waviness distributions. These flange surface-mismatch distributions are formed by combining the radial and circumferential functions as indicated by Eq. 1 and are divided into three groups: axisymmetric; periodic with edge gaps; and periodic with no edge gaps. Here ‘edge gaps’ implies that the flange mating surfaces at the symmetry planes are not in contact. The axisymmetric distributions shown in Figure 7 exhibit the same mismatch distribution for every circumferential location (i.e., 0)()( rfr ).
The periodic distributions with edge gaps shown in Figure 8 exhibit a flange surface-mismatch gap between the
American Institute of Aeronautics and Astronautics
092407
3
gussets and no gap near the gusset. These distributions are generated using the n=-1 circumferential function. The periodic distributions with no edge gaps shown in Figure 9 exhibit peak gaps along the OD and zero gaps along the symmetry planes of the finite element model. These distributions are generated using the linear radial function and the n>0 circumferential functions.
IV. Modeling Assumptions Several fundamental assumptions are common in the development of models used in the stress analyses. Each
assumption is described next.
1. The bolts, nuts, and washers were not explicitly represented in the finite element models, but rather their influence was simulated. The bolts were represented as one-dimensional linear elastic beams. The washers were represented as sets of kinematic coupling constraints that extended from the bolt centerline to a specified distance around the bolt hole on the non-mating flange surfaces to simulate the bearing load. Kinematic coupling constrained the nodes associated with the washer-bearing surface to the translation and rotation of a node on the bolt. Hence, this type of constraint can represent the effects of bolt bending on the local stress state in the flange near the washer. The washer-bearing-surface modeling assumptions are discussed in Ref. 7, where the extent of the kinematic coupling constraints extends a distance radially outward from the edge of the bolt hole.
2. The finite element models were developed to accommodate different material properties in regions as
indicated in Figure 3. The shell wall is welded to the flange using a through-the-thickness butt weld followed by a fillet weld along the shell-wall-to-flange intersection on the back side of the L-shaped structure. In the present analyses, all regions, including the weld and heat-affect zone (HAZ), used the parent material properties.
The computational effort for these finite element models is reduced by incorporating two different modeling
regions as indicated in Figure 2. Away from the local joint region, a two-dimensional shell finite element model, incorporating the ABAQUS4 S4 standard shell element, was used to represent the structure. While a shell element has more nodal degrees of freedom than a solid element, no explicit through-the-thickness modeling is required because of the kinematic assumptions employed by shell elements. The use of two-dimensional shell elements for the far-field response readily accommodates the specification of shell running loads or end displacements. Near the joint region, three-dimensional solid finite element modeling is employed. The three-dimensional finite element modeling incorporates the ABAQUS C3D8I 8-node solid element, which includes incompatible modes as element shape functions for improved bending response (see Ref. 8). At the interface of the two-dimensional and three-dimensional regions, multi-point constraints are defined through a shell-to-solid coupling constraint for connecting a two-dimensional shell finite element model to a three-dimensional solid finite element model.
V. Numerical Results and Discussion All engineering analyses of the bolted, segmented cylindrical shell configuration shown in Figure 1 were
performed using ABAQUS/Standard. The analysis process involved two basic stages. The first stage increased the bolt preload axial force from zero to a specified value while monitoring local deformation and stress behavior. The second stage, starting from the preloaded state, applied bounding values for the in-plane axial loads and determined the local axial stress state in the vicinity of the flange-to-shell circumferential fillet weld on the shell’s inside surface. These analyses are nonlinear due to the explicit contact modeling between the adjacent flange faces and to account for any geometric or material nonlinearities.
Each of the nine flange surface-mismatch distributions and the original perfect flange case (see Figures 7-9) were analyzed using only a 36,500-lb bolt preload force as the loading condition, and residual stresses due to welding [5] were ignored. The influence on the local axial stress at the top of the fillet weld of these assembly mismatches along the flange mating surfaces was determined. These so-called “fit-up stresses” contribute to the CIFS analyses. These fit-up stresses have been estimated to be approximately 15% of the parent material yield stress (approximately 6 ksi for the data used in this paper). Maximum axial tensile stress values at the top of the fillet weld are reported in
4 ABAQUS/Standard is a registered trademark of ABAQUS, Inc.

American Institute of Aeronautics and Astronautics
092407
4
Table 3 for these nine mismatch cases and the perfect case. The axial stress values reported are element face values. The effects of the 36,500-lb bolt preload force on the gap pattern were also examined.
First, the influence of the axisymmetric mismatch distributions (n=0 cases) as shown in Figure 7 is discussed. The bolt preload force is 36,500 lb, and the initial peak gaps are 10 mils. For each of the four cases presented in Figure 7, the remaining gap patterns after application of the 36,500 lb bolt preload force are presented in Figure 10. As a basis for comparison, the perfect case in Figure 7(a) (no gapping, perfect mating of the flange surfaces) resulted in only a 2.2 ksi maximum axial tensile stress at the top of the fillet weld (see Figure 3). Next, a linear distribution with no gaps along the ID edges of the flanges and peak gaps along the OD (linear, n=0, see Figure 7(b)) was analyzed. This distribution represents a tilting of the flange outer surface, and the bolt preload gradually closes the gap, as shown in Figure 10b, without significantly increasing the axial stress level (3.5 ksi). The third case (cosine, n=0) exhibits peak gaps on both ID and OD edges of the flanges (including under the gusset) and near zero gaps along the bolt circle (see Figure 7(c)). Applying the bolt preload does not increase the axial stress level (2.4 ksi) and does not eliminate the free-state gaps (see Figure 10(c)). The fourth case (sine, n=0) shown in Figure 7(d) exhibits a uniform “bubble” gap that is not easily detected, since the gaps along the OD and ID edges of the flanges are zero. This bubble also extends underneath the gusset. When the OD and ID edges of the flange are in contact and provide bearing surfaces, imposing the bolt preload force does not completely eliminate the gap (see Figure 10(d)), does cause local bending near the top of the fillet weld on the inside surface, and does significantly increase the axial stress level to 19.0 ksi – nearly an order of magnitude larger than the perfect case.
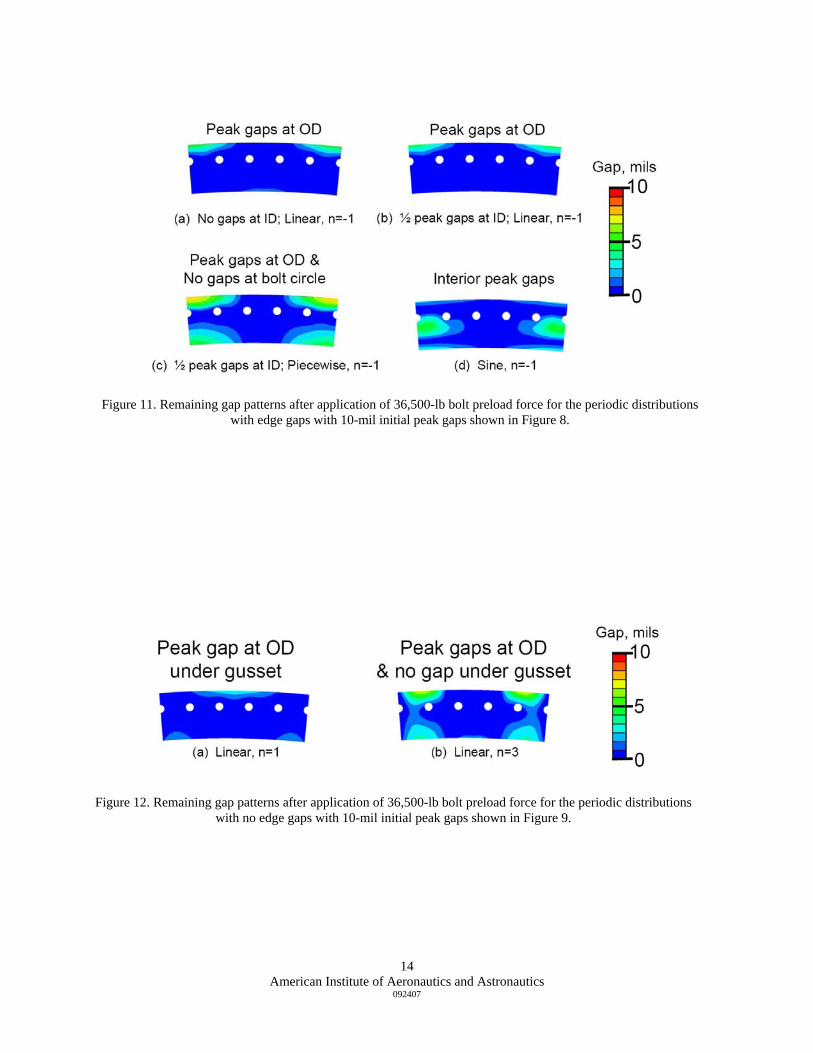
Second, the influence of the periodic mismatch distributions with edge gaps (n=-1 cases) as shown in Figure 8 is discussed. For each of the four cases presented in Figure 8, the remaining gap patterns after application of the 36,500 lb bolt preload force are presented in Figure 11. The bolt preload force is 36,500 lb, and the initial peak gaps are 10 mils. In the four distributions analyzed, there is no mismatch near the gusset (±1 on either side of the center of the gusset). The two cases in Figures 8(a) and 8(b) exhibit linear radial distributions: one with zero gaps on the ID (see Figure 8(a)) and the other with one half of the initial peak gap on the ID (see Figure 8(b)). Both cases behave in a similar manner with OD gaps remaining after applying the bolt preload as shown in Figures 11(a) and 11(b), and increased values for the maximum axial tensile stress developing at the top of the fillet weld (18.6 ksi and 21.6 ksi, respectively). The third case, Figure 8(c), has an initial peak gap at the OD on the symmetry boundary edges and half the initial peak gap on the ID (piecewise, n=-1). However, near the bolt circle, the flange mating-surface mismatch is nearly zero. The bolt preload neither increases the axial stress level significantly over that of the perfect case (6.0 ksi compared to 2.2 ksi) nor eliminates the free-state gaps when the gapping along the bolt circle is minimal (see Figure 11(c)). The fourth case, Figure 8(d), has a series of interior “bubble” mismatches between the gussets and zero gaps along the OD and ID (sine, n=-1). The gaps remain as shown in Figure 11(d), and the axial stress level is only marginally increased (7.7 ksi) compared to the perfect case.
Third, the influence of the periodic mismatch distributions with no edge gaps (n>0 cases) as shown in Figure 9 is discussed. For both cases presented in Figure 9, the remaining gap patterns after application of the 36,500 lb bolt preload force are presented in Figure 12. The bolt preload force is 36,500 lb, and the initial peak gaps are 10 mils. Both cases assume a linear radial mismatch distribution with zero gaps along the symmetry edges of the analysis model. The first case, Figure 9(a), is a sinusoidal circumferential distribution (n=1) with the initial peak gaps occurring underneath the gusset. Here, the bolt preload force was able to close most of the free-state gapping as shown in Figure 12(a); however, the maximum axial tensile stress was significantly increased to 19.9 ksi from 2.2 ksi for the perfect case. The second case, Figure 9(b), is a sinusoidal circumferential distribution (n=3) with two initial peak gaps occurring between gussets and no gaps near the gusset. Local bending of the flange-to-skin interface increased the maximum axial tensile stress level to 30.7 ksi without eliminating the initial free-state gaps as indicated in Figure 12(b).
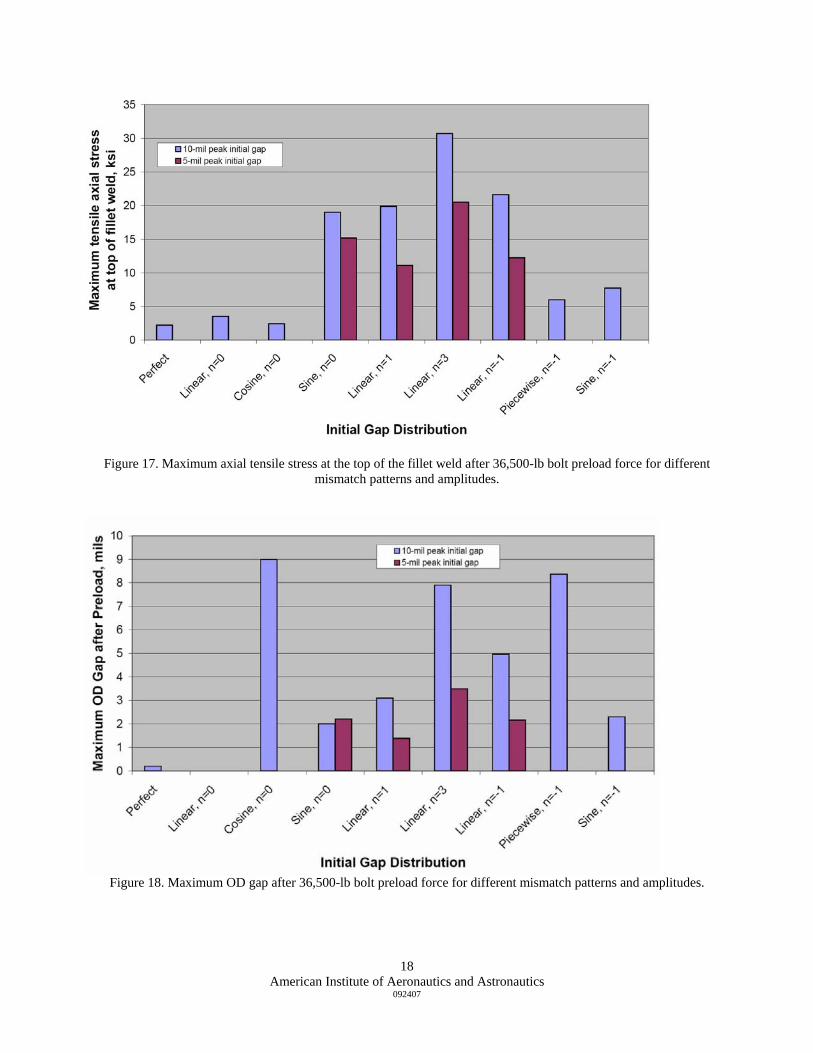
Of the nine distributions analyzed, four flange surface-mismatch distributions significantly increased the maximum axial tensile stress at the top of the fillet weld (see Figure 3). These findings are summarized in Figure 13. The sine, n=0 case in Figure 13(a) is an axisymmetric case with the peak gaps occurring near the bolt circle including under the gussets but with no gaps on either the OD or the ID. The linear, n=-1 case in Figure 13(b) is a periodic case with edge gaps but no gaps under the gussets. This distribution has one peak gap region between each gusset pair. The linear, n=1 case in Figure 13(c) is a periodic case with no edge gaps but peak gaps occurring directly under the gussets. The linear, n=3 case in Figure 13(d) is also a periodic case with no edge gaps and also no gaps under the gussets. This distribution exhibits two peak gap regions between each gusset pair. Limited gap measurement data on as-built hardware indicated that gaps under the gussets on the OD and ID edges of the flanges and multiple peak gap openings between gussets have not been observed; hence, the linear, n=-1 case is the bounding case having an observed mismatch pattern. While not shown explicitly, it was noted that the location of

American Institute of Aeronautics and Astronautics
092407
5
the maximum axial tensile stress at the top of the fillet weld tended to correspond to the location of the peak gaps in the free-state mismatch distribution. This observation is substantiated later.
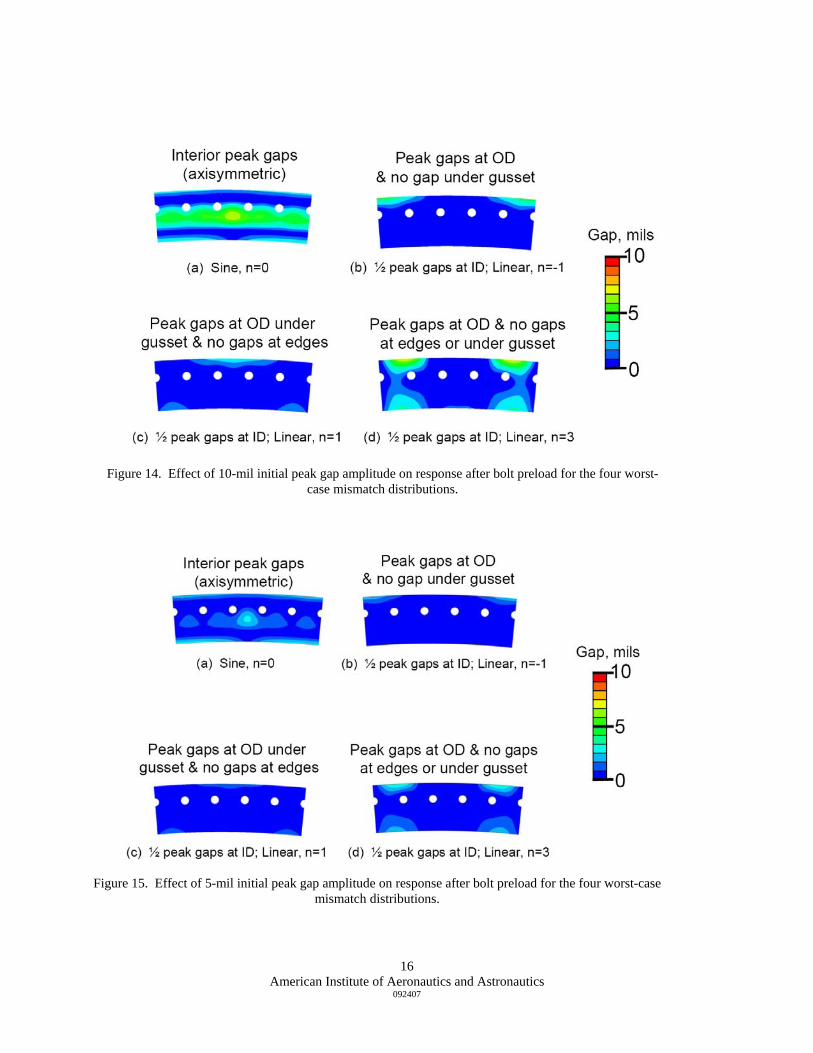
The results just described indicate that some flange surface-mismatch distributions have only a minor effect, while others, such as the four indicated in Figure 13, can have a significant effect on the local maximum axial stress at the top of the fillet weld on the shell’s inner surface (see Figure 3). The effect of the amplitude of the initial peak gap and the magnitude of the bolt preload force are each examined next using the four cases identified in Figure 13. First, the size of the initial peak gap was assumed to be 5 mils, while maintaining the bolt preload force at 36,500 lb. The free-state gap distributions for the 5-mil cases are similar in pattern to those for the 10-mil cases shown in Figure 13. For the four cases shown in Figure 13, the remaining gap patterns after application of the preload for the 10-mil initial peak gap are shown in Figure 14. The post-bolt-preload gap results for the 5-mil initial peak gap are shown in Figure 15. For the 5-mil cases, nearly all the free-state gapping is eliminated. The maximum axial tensile stress levels for the 10-mil and 5-mil initial peak gap cases are presented in Table 4. For the 5-mil cases, the maximum stress levels are reduced by approximately 25% compared to the 10-mil cases.
Next, the effect of bolt preload force is analyzed using three values of the preload force: 34,000 lb; 36,500 lb (baseline value); and 44,100 lb. The flange surface-mismatch distribution was defined as the linear, n=-1 case with a 10-mil initial peak gap (i.e., one of the worst-case flange surface-mismatch distributions). Results shown in Figure 16 indicate only a marginal influence on the remaining gap distribution for the three bolt preload force values analyzed. The effect of bolt preload force on the maximum axial tensile stress level is minimal. The maximum axial tensile stress at the top of the fillet weld increased only by approximately 5% for a 30% increase in bolt preload force (i.e., when the bolt preload force increased from 34,000 lb to 44,100 lb).
All results are summarized in Figures 17 and 18 in terms of the maximum axial tensile stress at the top of the fillet weld and the maximum OD gap after applying the bolt preload force of 36,500 lb. The results shown for the linear, n=-1 case have nonzero gaps at the ID edges of the flange (see Figure 8b). The sensitivity of the structural response to different flange surface-mismatch distributions is clearly evident in these maximum axial tensile stress values. Reducing the initial peak gap amplitude does reduce the maximum axial tensile stress values but not significantly.
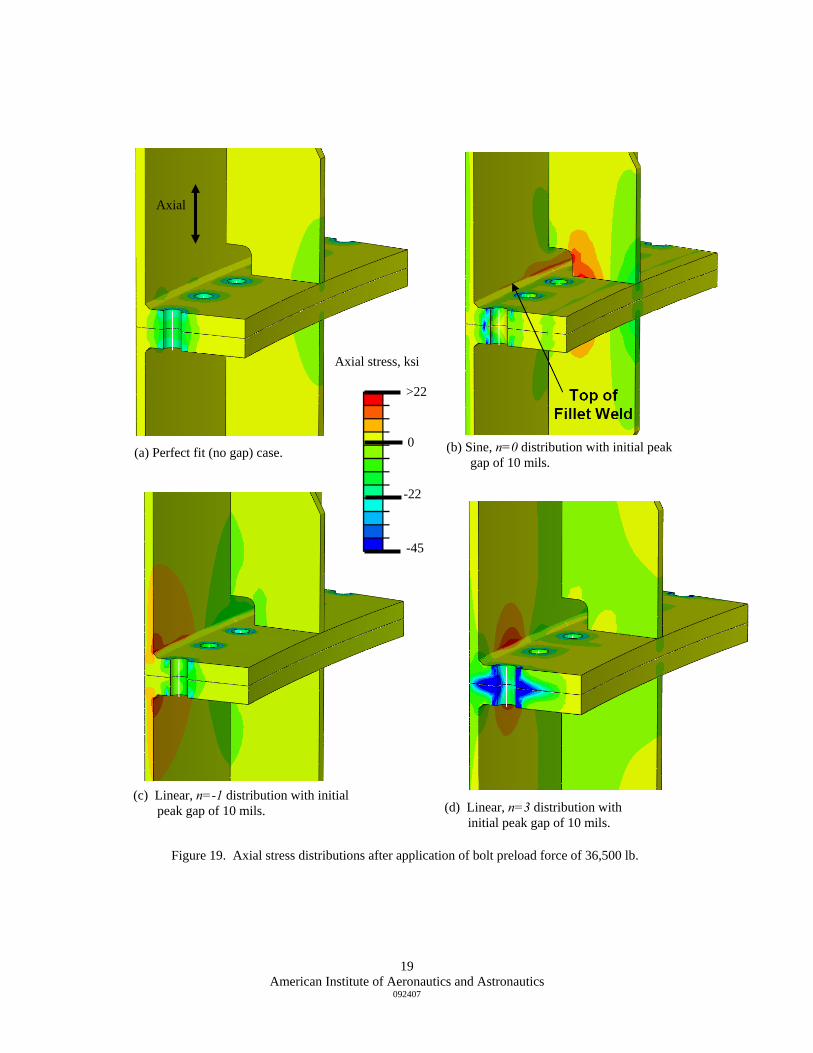
Finally, the overall axial stress distributions shown in Figures 19 and 20 using a fixed range for the contour intervals were examined for the case of perfect flanges and three mismatch cases (Sine, n=0; Linear, n=-1; and Linear, n=3; see Figure 13). In Figure 19, the axial stress distributions shown are due to the application of the 36,500-lb bolt preload force only. The stress distribution for the perfect case is shown in Figure 19(a) with a maximum axial tensile stress of 2.2 ksi at the top of the fillet weld near the gusset. The stress distribution for the axisymmetric mismatch distribution with only an interior gap (sine, n=0 case) is shown in Figure 19(b) with a maximum axial tensile stress of 19.0 ksi at the top of the fillet weld near the gusset mouse hole. The stress distribution for a periodic mismatch distribution with edge gaps (linear, n=-1) is shown in Figure 19(c) with a maximum axial tensile stress of 21.6 ksi at the top of the fillet weld at the symmetry plane – essentially at the same circumferential position as the free-state peak gap on the OD. This value is used in the CIFS analysis as the fit-up stresses caused by flange mating-surface imperfections and combined with the residual weld stresses to define the mean stress level [1]. The stress distribution for a periodic mismatch distribution with no edge gaps (linear, n=3) is shown in Figure 19(d) with a maximum axial tensile stress of 30.7 ksi at the top of the fillet weld opposite the second bolt hole – again, this maximum stress occurs essentially at the same circumferential position as the free-state peak gap.
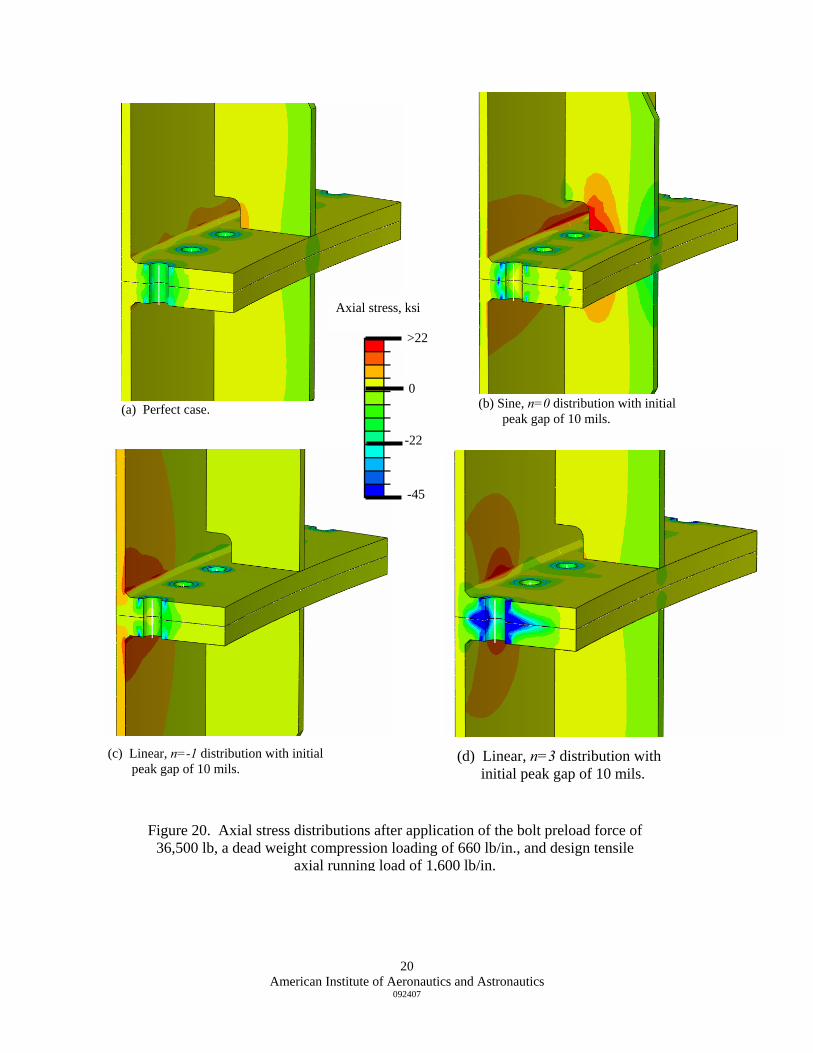
The overall axial stress distributions shown in Figure 20 correspond to the stress state after applying the 36,500-lb bolt preload force, a compressive axial running load of 660 lb/in. simulating the dead weight of a stacked assembly of several shell segments, and followed by applying the maximum axial tensile running load of 1,600 lb/in. from the ascent conditions [2]. The stress distribution for the perfect case is shown in Figure 20(a) with a maximum axial tensile stress of 12.5 ksi at the top of the fillet weld near the gusset. This value is used as the cyclic stress in the CIFS analysis for the response to the applied mechanical loads [1]. The stress distribution for the axisymmetric mismatch distribution with only an interior gap (sine, n=0 case) is shown in Figure 20(b) with a maximum axial tensile stress of 29.0 ksi at the top of the fillet weld near the gusset mouse hole. The stress distribution for a periodic mismatch distribution with edge gaps (linear, n=-1) is shown in Figure 20(c) with a maximum axial tensile stress of 22.3 ksi. The stress distribution for a periodic mismatch distribution with no edge gaps (linear, n=3) is shown in Figure 20(d) with a maximum axial tensile stress of 28.1 ksi. These results indicate that the maximum axial tensile stress at the top of the fillet weld and its circumferential location are dependent on the flange mating-surface mismatch more than the applied external axial loading. In addition, the axial stress distribution after applying the maximum axial tensile flight running load has a higher magnitude and is more widespread for the axisymmetric mismatch distribution with an interior gap (sine, n=0 case) than the other cases analyzed.
American Institute of Aeronautics and Astronautics
092407
6
VI. Concluding Remarks This paper describes structural analyses of a bolted, segmented cylindrical shell structure with initial flange waviness. Basic modeling and analysis requirements and parameters that have significant effect on the local axial stress state are discussed. The analyses are elasto-plastic, large-deformation nonlinear finite element analyses performed using the ABAQUS/Standard finite element code. Three factors have been determined to influence the local stress response of bolted segmented cylindrical shells: flange mismatch distribution, peak gap amplitude, and bolt preload force magnitude. Several implications of the flange surface-mismatch assessment are noted. First, flange mating-surface waviness can significantly increase the fit-up stresses at the top of the fillet weld in the flange-to-skin weld. Second, mismatch distributions with substantial bearing contact tend to cause only a mild increase of the local axial tensile stress. Third, reducing the peak gaps also reduces the maximum axial tensile stress. Fourth, the axial tensile stress is nearly insensitive to changes in bolt preload force. Fifth, the circumferential location of the maximum axial tensile stress tends to correspond to the circumferential location of the free-state peak gaps on the front face. Overall, fit-up stresses near the fillet weld, which develop due to bolting of non-planar flange mating surfaces, are sensitive to the initial flange gapping distribution and magnitudes.
References 1. Cheston, D., Raju, I., Piascik, R., Russell, S., Larsen, C., Hudak, S., Knight, N., Reuter, W., Brust, F., Dawicke,
D., Womack, J., Hayes, M., and Phillips, D., Independent Evaluation of the Critical Initial Flaw Size for Ares I-X (AIX) Upper Stage Simulator (USS) Common Segment Flange-to-Skin Welds, NASA Engineering and Safety Center Report No. NESC RP-08-09, February 26, 2008.
2. Larsen, C. and Mackey, A., ARES I-X USS Fracture Analysis Loads Spectra Development, NASA TM-2008-215335 (also as NESC-RP-08-09/06-081-E), September 2008.
3. Knight, N. F., Jr., Phillips, D. R., and Raju, I. S., ARES I-X Upper Stage Simulator Structural Analyses Supporting the NESC Critical Initial Flaw Size Assessment, NASA TM-2008-215336 (also as NESC-RP-08-09/06-081-E), August 2008.
4. Dawicke, D. S., Raju, I. S., and Cheston, D. J., Critical Initial Flaw Size Analysis, NASA TM-2008-215337 (also as NESC-RP-08-09/06-081-E), September 2008.
5. Raju, I. S., Brust, F. W., Phillips, D. R., and Cheston, D., Ares I-X Upper Stage Simulator Residual Stress Analysis, NASA TM-2008-215339 (also as NESC-RP-08-09/06-081-E), September 2008.
6. Chell, G. G. and Hudak, S. J., Jr., Elastic-Plastic Fracture Mechanics Analysis of Critical Flaw Size in ARES I-X Flange-to-Skin Welds, NASA CR-2008-215340 (also as NESC-RP-08-09/06-081-E), August 2008.
7. Knight, N. F., Jr., Phillips, D. R., and Raju, I. S., “Simulating the Structural Response of a Bolted Joint,” AIAA Paper No. 2008-1842, presented at the AIAA/ASME/ASCE/AHS/ASC 49th Structures, Structural Dynamics, and Materials Conference, Schaumburg, IL, April 7-10, 2008.
8. Sun, E. Q., “Shear Locking and Hourglassing in MSC Nastran, ABAQUS, and ANSYS,” presented at the MSC.Software Virtual Product Development Conference (VPD2006), Paper No. 27, July 17-19, 2006, Huntington Beach, CA.
American Institute of Aeronautics and Astronautics
092407
7
Table 1. Radial distributions of the flange surface-mismatch functions.
Table 2. Circumferential distributions of the flange surface-mismatch functions.
American Institute of Aeronautics and Astronautics
092407
8
Table 3. Axial stress values on the OD and ID faces for a peak gap value of 10 mils and after applying a 36,500-lb bolt preload force from a stress-free state.
(1) Peak gaps occur under gussets. (2) Pair of peak gaps between gussets. (3) Stress values are element face values.
Table 4. Maximum axial tensile stress at the top of the fillet weld for the 10-mil and 5-mil initial peak gap cases after applying 36,500-lb bolt preload force for the four worst-case flange mismatch distributions.
Maximum Axial Tensile Stress, ksi Description of
Mismatch Distribution 10-mil Initial Peak Gap 5-mil Initial Peak Gap Sine, n=0 19.0 15.2
Linear, n=-1 21.6 12.2 Linear, n=1 19.9 11.1 Linear, n=3 30.7 20.5
Description of Mismatch Distribution Maximum axial tensile stress
at top of fillet weld, ksi (3)
Axial stress on the shell OD (opposite peak tensile stress at
top of fillet weld location), ksi (3)
Perfect case +2.2 -0.5 Axisymmetric distributions (n=0 cases)
Linear, n=0 (1) +3.5 -0.4 Cosine, n=0 (1) +2.4 +0.7 Sine, n=0 (1) +19.0 -11.6
Periodic distributions with edge gaps (n=-1 cases) Linear, n=-1 (zero at ID) +18.6 +2.9 Linear, n=-1 (nonzero at ID) +21.6 +2.7 Piecewise, n=-1 +6.0 +1.4 Sine, n=-1 +7.7 -1.4
Periodic distributions with no edge gaps (n>0 cases) Linear, n=1 (1) +19.9 -0.9 Linear, n=3 (2) +30.7 -0.9

American Institute of Aeronautics and Astronautics
092407
9
Figure 1. Typical USS shell segment and single 10-wedge model.
Figure 2. Two cylindrical shell segments representing a segmented shell assembly.

American Institute of Aeronautics and Astronautics
092407
10
Figure 4. Example flange mating surface mismatch distribution and mismatch function symbol definitions.
Figure 3. Cross-section of bolted joint for typical mating of two shell segments.
American Institute of Aeronautics and Astronautics
092407
11
Figure 6. Example distributions of flange mating-surface mismatch for illustration.
Figure 5. Example flange mating surface mismatch distribution and mismatch function nomenclature.
American Institute of Aeronautics and Astronautics
092407
12
Figure 8. Periodic flange mating surface-mismatch distributions with edge gaps.
Figure 7. Axisymmetric flange mating surface-mismatch distributions.

American Institute of Aeronautics and Astronautics
092407
13
Figure 9. Periodic flange mating surface-mismatch distributions with no edge gaps.
Figure 10. Remaining gap patterns after application of 36,500-lb bolt preload force for the axisymmetric distributions with 10-mil initial peak gaps shown in Figure 7.
American Institute of Aeronautics and Astronautics
092407
14
Figure 11. Remaining gap patterns after application of 36,500-lb bolt preload force for the periodic distributions with edge gaps with 10-mil initial peak gaps shown in Figure 8.
Figure 12. Remaining gap patterns after application of 36,500-lb bolt preload force for the periodic distributions with no edge gaps with 10-mil initial peak gaps shown in Figure 9.

American Institute of Aeronautics and Astronautics
092407
15
Fig
ure
13.
Fou
r fr
ee-s
tate
fla
nge
surf
ace
mis
mat
ch c
ases
res
ulti
ng in
hig
h ax
ial t
ensi
le s
tres
s le
vel.
American Institute of Aeronautics and Astronautics
092407
16
Figure 14. Effect of 10-mil initial peak gap amplitude on response after bolt preload for the four worst-case mismatch distributions.
Figure 15. Effect of 5-mil initial peak gap amplitude on response after bolt preload for the four worst-case mismatch distributions.

American Institute of Aeronautics and Astronautics
092407
17
Figure 16. Effect of bolt preload on flange gapping response for a 10-mil initial peak gap.
American Institute of Aeronautics and Astronautics
092407
18
Figure 17. Maximum axial tensile stress at the top of the fillet weld after 36,500-lb bolt preload force for different
mismatch patterns and amplitudes.
Figure 18. Maximum OD gap after 36,500-lb bolt preload force for different mismatch patterns and amplitudes.
American Institute of Aeronautics and Astronautics
092407
19
(a) Perfect fit (no gap) case.
(c) Linear, n=-1 distribution with initial peak gap of 10 mils.
Axial
(b) Sine, n=0 distribution with initial peak gap of 10 mils.
Figure 19. Axial stress distributions after application of bolt preload force of 36,500 lb.
(d) Linear, n=3 distribution with initial peak gap of 10 mils.
>22
-22
-45
0
Axial stress, ksi
American Institute of Aeronautics and Astronautics
092407
20
(c) Linear, n=-1 distribution with initial
peak gap of 10 mils.
(a) Perfect case.
>22
-22
-45
0
Axial stress, ksi
(b) Sine, n=0 distribution with initial peak gap of 10 mils.
Figure 20. Axial stress distributions after application of the bolt preload force of 36,500 lb, a dead weight compression loading of 660 lb/in., and design tensile
axial running load of 1,600 lb/in.
(d) Linear, n=3 distribution with initial peak gap of 10 mils.