Strengthening Natural Resources Management building on Local Knowledge Systems for Sustaining the...
24
Strengthening Natural Strengthening Natural Resources Management building Resources Management building on Local Knowledge Systems on Local Knowledge Systems for Sustaining the for Sustaining the Productivity and Viability of Productivity and Viability of Agricultural Heritage Systems Agricultural Heritage Systems Presentation by Sally Bunning, Land Management Officer, FAO Presentation by Sally Bunning, Land Management Officer, FAO
-
Upload
hector-chase -
Category
Documents
-
view
216 -
download
0
Transcript of Strengthening Natural Resources Management building on Local Knowledge Systems for Sustaining the...

Strengthening Natural Strengthening Natural Resources Management Resources Management
building on Local Knowledge building on Local Knowledge SystemsSystems
for Sustaining the Productivity for Sustaining the Productivity and Viability of Agricultural and Viability of Agricultural
Heritage SystemsHeritage Systems
Presentation by Sally Bunning, Land Management Officer, FAOPresentation by Sally Bunning, Land Management Officer, FAO

Multitude of traditional agricultural Multitude of traditional agricultural systemssystems
Agricultural systemsAgricultural systems• Pastoralist• Mixed rainfed farming: crops, livestock, trees, fish• Irrigated agriculture• Agro-forestry/multi-storey
Developed from natural Developed from natural vegetation and ecosystemsvegetation and ecosystems • grasslands• bush/shrub/forest system• wetlands incl. oases
Adapted to agro-ecological zone: dry, (sub)humid, tropical...Adapted to agro-ecological zone: dry, (sub)humid, tropical...
Make use of planned and wild species and habitatsMake use of planned and wild species and habitats
Continuously adapting to socioeconomic context & Continuously adapting to socioeconomic context & knowledgeknowledge

Hunger Task Force- Millennium ProjectHunger Task Force- Millennium Project
Who are the Hungry and where is Aid channeled today: Who are the Hungry and where is Aid channeled today: Paradigm that 92% of the hungry suffer chronic malnutrition and only 8% suffer from Paradigm that 92% of the hungry suffer chronic malnutrition and only 8% suffer from extreme events but disproportionate amount of development aid targets emergencies extreme events but disproportionate amount of development aid targets emergencies (civil strife, drought, flood) (civil strife, drought, flood) Of the hungry (Sarah Scherr): Of the hungry (Sarah Scherr):
– 50% smallholders; 50% smallholders; –20% landless; 20% landless; – 20% urban poor and 20% urban poor and – 10% forest dwellers, pastoralists and fisherfolk10% forest dwellers, pastoralists and fisherfolk
Hunger hot spots (nutrition, poverty,...)Hunger hot spots (nutrition, poverty,...)
The Project will focus on 6 priorities: The Project will focus on 6 priorities: Political action Political action Enabling policy reformEnabling policy reform Agricultural productivity of food insecureAgricultural productivity of food insecure } to address} to address Market access and income generationMarket access and income generation } community} community Restoring natural assetsRestoring natural assets } wellbeing } wellbeing Improve nutrition of vulnerableImprove nutrition of vulnerable } +health} +health

Agricultural Landscapes and BiodiversityAgricultural Landscapes and Biodiversity
Biophysical determinantsBiophysical determinants1. Farm size and fragmentation 2. Soil types, slope and water availability 3. Mix of enterprises e.g. maize, beans, fruit trees4. Variation in space and time: intercrops, field
borders, rotations, fallows5. Maintenance and use of wild species (trees, hedges)
Socio-economic determinantsSocio-economic determinants1. Population pressure2. Socio-economic status – tools, capital, inputs3. Access to natural resources and tenure security4. Knowledge and skills – IK and modern 5. Community organisation and decision making- by
laws6. Policy and infrastructure: roads, water, markets

Pressures on ecosystemsPressures on ecosystems
• Clearing, fragmentation, Clearing, fragmentation, habitat conversionhabitat conversion (incl. impact on wetlands/ aquatic systems)
• Intensification and Intensification and inappropriate land use:inappropriate land use: (population pressures, economic drivers e.g. trend to HYV)
• Over-exploitation and Over-exploitation and harvesting of natural harvesting of natural resources:resources: (traditional, socio-economic, cultural e.g. land tenure / user rights)
• Alien invasive speciesAlien invasive species e.g. weeds, pests, diseases, pathogens
Example of a Dryland ecosystem
Sensitive, Resilient environmentsbut pressures lead to degradation,
biodiversity loss, reduced productivity + loss of ecosystem
services

Schema: Ecosystem approach & DPSIR Schema: Ecosystem approach & DPSIR FrameworkFramework
Pressures: habitat conversion/fragmentation, land use intensification
State of Natural ResourcesSoil and water degradationLoss of species/ecosystems
Pest impacts – weeds, disease, pathogensLoss of ecological functions
e.g. hydrological regime, nutrient cycling,carbon sequestration
Management issuesSoil and water management
Fertilizer useFire regime
Grazing intensity Livestock type and breed
Pest and disease managementCrop selection
Irrigation method
Socio-economic driving forcespopulation, poverty, policy failure
State of Agricultural biodiversityLoss of pasture, crop/animal species and
decline in wild gene poolLoss of production support services
State of PeopleDecrease income, food security, nutrition
Poor health; Increased vulnerabilityLoss of options
ResponsesChange NRM strategies, socio-economic inter-ventions; enabling policy + legal environment

Ecosystem approach – interactionsEcosystem approach – interactionsManagement practices - household and community Soil and water management Selection of crops and livestock types Grazing and cropping intensity Use of inputs: seed, fertilizer, pesticide, irrigation, feed Fire regime- burning of residues, natural vegetation Pest and disease management Common property resources- woodlots, wetlands,
Determine State of NR andSoil health + water qualitySpecies + habitatsPest impacts: weeds, diseaseEcological functions- hydro-logical regime, nutrient and carbon cycles
State of Agricultural biodiversityLoss of pasture, crop, tree varieties/ species, animal breeds (gene pool)Decline in wild genetic resourcesLoss of production support services-pollination, pest control, soil fertility, soil water retention
State of People/Livelihoods: Income; food security, nutrition, risk alleviation/vulnerability, health, available options

Interactions farm-household to Interactions farm-household to micro-catchment to river basinmicro-catchment to river basin
AA
BB
CC

What can we look at to understand the What can we look at to understand the interactions and human responses?interactions and human responses?
Indicators ofIndicators of1.1. Overall Ecosystem Functioning- Overall Ecosystem Functioning- resilience, recoveryresilience, recovery2.2. Soil health - Soil health - impacts on H20 regime, fertility, C stocksimpacts on H20 regime, fertility, C stocks3.3. Vegetation – Vegetation – protection, food and other goods, protection, food and other goods, 4.4. Water quality and recharge- Water quality and recharge- food, access to waterfood, access to water5.5. Agricultural biodiversity Agricultural biodiversity – ecosystem, species, genetic levels– ecosystem, species, genetic levels6.6. Food and livelihood security Food and livelihood security – nutrition, hungry periods– nutrition, hungry periods7.7. Management practices- Management practices- returns/unit labour, win-win, communityreturns/unit labour, win-win, community8.8. Policy and legal incentives/regulations- Policy and legal incentives/regulations- local empowermentlocal empowerment
Selection of simple monitoring indicators with stakeholders: Selection of simple monitoring indicators with stakeholders: (land users, community, local authority, technical sectors) - as a tool for management at local, community and district levelas a tool for management at local, community and district level- to demonstrate value/benefits, status/trends for sectoral/policy - to demonstrate value/benefits, status/trends for sectoral/policy considerationconsideration
Minimum Set of indicators at various levels depends on Minimum Set of indicators at various levels depends on - user needs, local knowledge user needs, local knowledge - priority issuespriority issues- management strategiesmanagement strategies

Who to involve and what to focus onWho to involve and what to focus on
Local level:Local level: Participatory PRA process, local team- range of resource users/stakeholders; local knowledge+ indicators
–Field, boundaries, farm-household: focus on local knowledge, quality of resources (soil, water, biological) on site processes/health- Micro-catchment (land use- habitat change, species loss, processes, impacts on livelihoods)
Agro-ecological zone, agro-ecosystem level Agro-ecological zone, agro-ecosystem level
Interaction among technical sectors with communities to identify key issues, successes and constraints, minimum set of indicators,
e.g. micro to larger catchment effects (groundwater recharge, water quality, flood events, road damage etc…), productivity, food security...
District authorities can help identify planning and impact indicators
Link to national level dataLink to national level dataWork with planners/policy makers to demonstrate multiple values of AHS, compare with higher inputs systems (cost/benefits; pilots – national support)

Interactions and knowledge systems within Interactions and knowledge systems within the communitythe community
Farm HouseholdsFarm Households – FHH, MHH, landless, labour force, AIDS – FHH, MHH, landless, labour force, AIDS affected...affected...
Farmer types-Farmer types- small-large, access to resources single- small-large, access to resources single-diverse enterprises, off farm income, education, skillsdiverse enterprises, off farm income, education, skills
Ethnic/social groups-Ethnic/social groups- pastoral, cropping, mixed; labourers pastoral, cropping, mixed; labourers Decision makersDecision makers – – Knowledge systemsKnowledge systems are differentiated by gender and are differentiated by gender and
socioeconomic groups- each member has valuable socioeconomic groups- each member has valuable knowledge and use sit in different ways for survival and knowledge and use sit in different ways for survival and livelihood goals livelihood goals
GIAHS should among others improve recognition and help GIAHS should among others improve recognition and help communities to address inequality issues: tenure security, communities to address inequality issues: tenure security, inheritance rights of women, access to resources (land, inheritance rights of women, access to resources (land, water trees etc).water trees etc).

Biodiversity management and local livelihoodsBiodiversity management and local livelihoods
Closely interlinked, complex and locally specific
Coping strategies of local populationsCoping strategies of local populations can be affected through degradation, loss of biodiversity, pressures on resources, poor health and nutrition
Need understanding of the dynamic relationships and ofNeed understanding of the dynamic relationships and of socioeconomic drivers (popn, disease, poverty, policy failure), pressures and impact on resources, and impacts of environmental condition on different societal groups to design initiatives that address poverty and biodiversity conservationto develop effective and sustainable policy options
Two way feedbackTwo way feedback: : Biodiversity can be a useful indicator of sustainability and Biodiversity can be a useful indicator of sustainability and livelihood security livelihood security Degradation and loss of biodiversity affects resilience, Degradation and loss of biodiversity affects resilience, capacity and time to recover and increases vulnerability to capacity and time to recover and increases vulnerability to food insecurityfood insecurity

Ecosystem level indicators for farm-Ecosystem level indicators for farm-household, micro-catchment and AEZhousehold, micro-catchment and AEZ
State of biodiversity and natural resources Local HH
microcatchment
AEZ/river basin
Status/Diversity of Ecosystems/habitats
Change in vegetation (cover, key spp., structure)Degree of fragmentation / ecosystem ( forest type)Rate of conversion (forest to grazing/agriculture)Land use change Change in surface water area % of threatened habitats +species protectedArable and permanent crop land/fallowType/Intensity of agricultural system
XXXXXXX
XXXX*XXXX*
Loss of species Loss of key species (economic, cultural, eco-
services)Flora and fauna species diversity Rate of harvesting of certain wild target speciesPolicies + plans to control harvesting of wild
speciesNo. of threatened species protected
XX
XXXX
X*X*XX
Demographic DriversHuman Population growthPovertyRural exodus
xX
XXX
XXX

Agrobiodiversity indicatorsAgrobiodiversity indicators • Crop diversityCrop diversity
– Number of species cultivated Number of species cultivated – Share of crop varieties in total production of that cropShare of crop varieties in total production of that crop– No. and propNo. and propnn of endangered crop varieties used of endangered crop varieties used
• Livestock diversityLivestock diversity– Proportion of various livestock categoriesProportion of various livestock categories– No. of breeds by livestock categoriesNo. of breeds by livestock categories– No. and proportion of endangered breeds usedNo. and proportion of endangered breeds used– No. and type per household No. and type per household
Nutritional status of households (gender; age)Nutritional status of households (gender; age)Food security of householdsFood security of households
• Weeds, pests, diseases, pathogensWeeds, pests, diseases, pathogens– Survival, growth, appearanceSurvival, growth, appearance – Incidence and spread Incidence and spread
– labour for weeding, alternatives e.g cover cropslabour for weeding, alternatives e.g cover crops Interspecies interactions – Interspecies interactions – pollination, pest control, BNF Links to Crop and livestock productivityLinks to Crop and livestock productivity

Soil quality (biophysical condition)• Surface condition e.g. cover, sealing, pondingSurface condition e.g. cover, sealing, ponding• Erosion: qualitative and quantitative Erosion: qualitative and quantitative • Salt depositsSalt deposits• Plant indicators (e.g. acid /infertile soils)Plant indicators (e.g. acid /infertile soils)• Plant nutrient deficiencies (and impacts)Plant nutrient deficiencies (and impacts)• Presence/abundance of earthworms (OM,porosity)Presence/abundance of earthworms (OM,porosity)
TerrainTerrain• Slope %, position (erosion risk)Slope %, position (erosion risk)• Aspect (risk of frost)Aspect (risk of frost)
Natural VegetationNatural Vegetation• Species/taxa diversity: functional groups; key speciesSpecies/taxa diversity: functional groups; key species• Structural diversity- storeysStructural diversity- storeys• Proportion/cover of alien or invasive speciesProportion/cover of alien or invasive species• Number/amount of wild food species consumedNumber/amount of wild food species consumed• Time taken to collect firewoodTime taken to collect firewood
Soil, terrain and vegetation indicatorsSoil, terrain and vegetation indicators
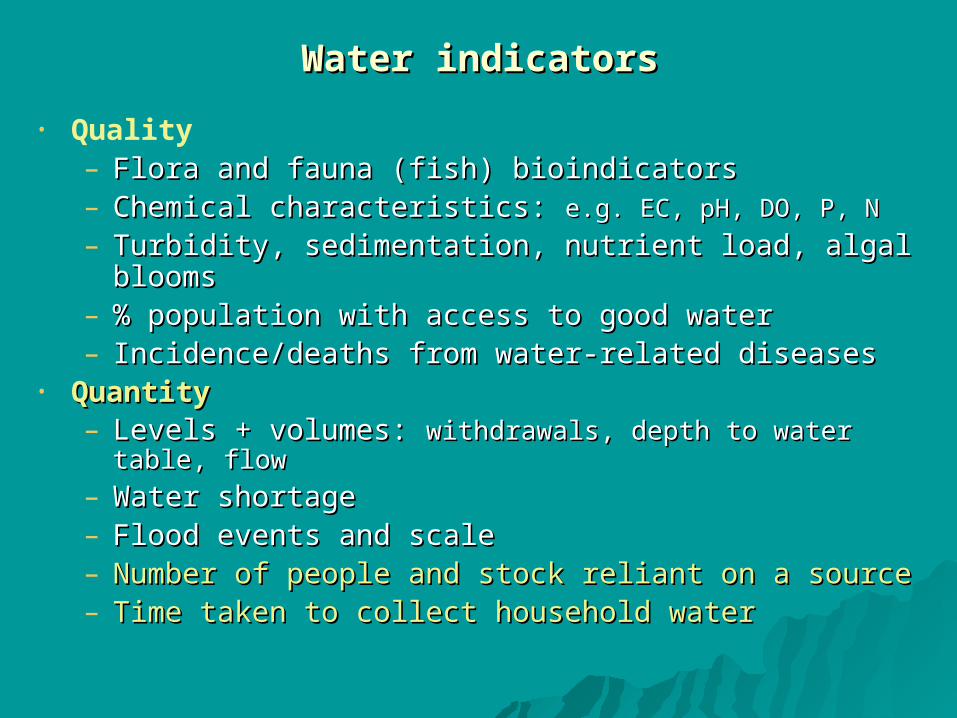
Water indicatorsWater indicators
• Quality– Flora and fauna (fish) bioindicatorsFlora and fauna (fish) bioindicators– Chemical characteristics: Chemical characteristics: e.g. EC, pH, DO, P, Ne.g. EC, pH, DO, P, N – Turbidity, sedimentation, nutrient load, algal bloomsTurbidity, sedimentation, nutrient load, algal blooms– % population with access to good water% population with access to good water– Incidence/deaths from water-related diseasesIncidence/deaths from water-related diseases
• QuantityQuantity– Levels + volumes: Levels + volumes: withdrawals, depth to water table, flow withdrawals, depth to water table, flow – Water shortageWater shortage– Flood events and scaleFlood events and scale– Number of people and stock reliant on a source Number of people and stock reliant on a source – Time taken to collect household waterTime taken to collect household water

Farm/land Management indicatorsFarm/land Management indicators
• Livestock grazing/feeding regime (stocking Livestock grazing/feeding regime (stocking weight, frequency, timing, intensity)weight, frequency, timing, intensity)
• Tillage and sowing methods Tillage and sowing methods • Fertiliser/nutrient cycling strategiesFertiliser/nutrient cycling strategies• Crop rotation, inter- and cover cropCrop rotation, inter- and cover crop• Fallow, improved fallowFallow, improved fallow• Water harvesting/management practices Water harvesting/management practices • Weed, pest and disease managementWeed, pest and disease management• Fire regimeFire regime• Protection of river banksProtection of river banks

Food & livelihood security indicatorsFood & livelihood security indicators
• Farm size and area under cultivationFarm size and area under cultivation• No. in HH by gender and age groupNo. in HH by gender and age group• Dependency ratioDependency ratio• Education levelEducation level• Income – HH, per capita, farm profitsIncome – HH, per capita, farm profits• PropPropnn of income from livestock, crops, other of income from livestock, crops, other• Land tenureLand tenure• Agricultural productivityAgricultural productivity• Time to nearest marketTime to nearest market• Disasters (flood, drought, war)Disasters (flood, drought, war)
The Sustainable Livelihoods Framework (5 The Sustainable Livelihoods Framework (5 capitals: natural, physical, social, human, capitals: natural, physical, social, human,
financial) is well suited to GIAHSfinancial) is well suited to GIAHS

System Management indicator
Land Degradation/ Restoration
Examples of responses
Pastoral Animal nos. /breed (stocking weight)Degree of uniformity within breeds Cross-breeding with indigenous and/or exotic breeds Density+ distribution of water pointsChange in grazing mobility/ access Seasonal use of different habitats
Intensity of water use
Waste management
Extent, timing and frequency of fires
Over- or under-grazing
Local loss of species and habitatsReduced diversity/ adapt-ability, susceptibility to disease, NR degradation Over- or under-grazing
Range degradation through overgrazingDegradation of soil, water, vegetation and ecosystem functionsDecrease in groundwater quantity and quality, Soil and water pollutionDegradation of pasture and savanna, loss of functional groups and key species
Vary stocking weight, stock type; adapted breedsDiversify breeds, cross breed with local breeds, keep stock that are adapted to conditions
Manipulate distn or number;
Reduce stocking weightModify strategies according to habitat ecological requirements and seasonal fluctuationsImprove water use efficiencyImprove waste management systemMinimize fire frequency and intensity, develop/revise fire management plan

Benefits of Sustainable Land management Benefits of Sustainable Land management example of Conservation Agricultureexample of Conservation Agriculture
For FarmersFor Farmers Less labour, time Less cost, inputs/power More stable yields Less risk Increase yields Increase profit Nutrition + wellbeing
For FarmersFor Farmers Less labour, time Less cost, inputs/power More stable yields Less risk Increase yields Increase profit Nutrition + wellbeing
for Community +Catchmentfor Community +Catchment More constant water flows in
rivers, recharge wells/springs Cleaner water (less erosion) Less flooding Less impact extreme climate Less cost road/ waterway
maintenance Better food security
for Community +Catchmentfor Community +Catchment More constant water flows in
rivers, recharge wells/springs Cleaner water (less erosion) Less flooding Less impact extreme climate Less cost road/ waterway
maintenance Better food security
At Global level: Carbon sequestration - less GHG emissions, soil restorationMinimal erosion (loss of potential + associated costs)Less fuel (for tractor powered 30-60% energy savings)Less nutrient leaching/water pollution; recharge of the aquifers

Arrangements to improve NRMArrangements to improve NRM
Upstream-downstream linkages in rural watersheds
• land users upstream – erosion, runoff, sediments
• water users downstream value water supply and quality
Pastoralists and smallholder farmers
• pastoralists require access to dry season grazing
• farmers need manure; need to manage vegetation
How can local NRM arrangements be supported?
• Community support for woodlots, tree planting/perennials fruit and vegetables (e.g. fuelwood, nutrition...)
• Farmer-pastoral agreements
• District support to reduce costs of road damage, water ..
• Labour sharing + planning among farm-households
• Local by laws to control grazing, burning...

How can we support AHS for the environmental How can we support AHS for the environmental services they provide?services they provide?
How to provide flexible, direct and promising compensation mechanisms by which service providers are:
• paid by service users PES) or
• supported in other ways by local/national governments
a) in (small) watersheds - mechanisms to compensate upstream landowners to maintain or modify a given land use which is affecting downstream water resource (regular flow, recharge, less salts/sediments, quality)
b) at a broader scale: instruments to pay (provide support) for wider environmental benefits e.g. biodiversity conservation, scenic beauty, carbon sequestration
Advantages : educate on value of NRM (economic, social, envt’l benefits), knowledge on impacts, promote efficient use of resources, resolve conflicts, support restoration, benefit sharing
Limitations: impacts; cost effectiveness, users willingness to pay, how to ensure demand driven, perverse incentives, sustainability,

Policy level: Opportunities and need for Policy level: Opportunities and need for synergy among relevant processessynergy among relevant processes
UNCCD NAPs UNCCD NAPs – poverty and degradation links (dryland and drought focus); hotspots and bright spots
CBDCBD NBSAPs NBSAPs - agro-biodiversity, dry and sub-humid lands, indicators and assessment; ecosystem approach
UNFCCC- climate change mitigation; Kyoto protocol- forestry UNFCCC- climate change mitigation; Kyoto protocol- forestry and land use changeand land use change
FAO State of worlds domestic animal resources and SOW FAO State of worlds domestic animal resources and SOW plant genetic resources and International Treatyplant genetic resources and International Treaty
World Food Summit + WSSD and MDG goals and action World Food Summit + WSSD and MDG goals and action
plansplans: : Food security and sustainable agriculture and rural development
OECDOECD- - agro-ecosystem indicators; support for agricultural landscapes, water quality, etc.
How can we optimise support to GIAHS through these processes?

Thank you for your attentionThank you for your attention