Strengthening Illinois Businesses through Investments … · ees to have in the 21st century,...
16
Strengthening Illinois Businesses through Investments in Early Care and Education How Investments in Early Learning Increase Sales from Local Businesses, Create Jobs and Grow the Economy A report by: Strengthening Businesses Through Proven Investments in Kids
Transcript of Strengthening Illinois Businesses through Investments … · ees to have in the 21st century,...

Strengthening Illinois Businesses through Investments
in Early Care and EducationHow Investments in Early Learning
Increase Sales from Local Businesses, Create Jobs and Grow the Economy
A report by:Strengthening Businesses Through Proven Investments in Kids

Strengthening Illinois Businesses through Investments in Early Care and Education
Who We Are
The business leaders of AmericA’s edge take a critical look at the knowledge, skills and abilities businesses need their employ-ees to have in the 21st century, including the ability to be communicators, collaborators and critical thinkers. Using that analysis, we educate policy-makers and the public about high-quality, proven investments that strengthen businesses, es-tablish a foundation for sustained economic growth, and protect America’s competitive edge in a global market place, while helping our nation’s children get on the right track.
Acknowledgements
This report was authored by Stephanie Schaefer, Ph.D., Susan L. Gates, and Mike Kiernan.
AmericA’s edge commissioned an analysis of the linkage effects of the early care and education sector. AmericA’s edge thanks David Kay, member of the faculty, Cornell University Department of Developmental Psychology, for conducting these analyses and for offering technical input into the presentation of these economic data.
The following individuals also contributed to this report: William Christeson, Soren Messner-Zidell, David Kass, Miriam Rol-lin, Joey R. Weedon, Tim Carpenter, Alena Chaps, Erica Cribbs, Jeff Kirsch, and Ted Eismeier.
America’s Edge also thanks David Alexander, Ph.D., Research Director at Illinois Action for Children, for his helpful feedback on documenting the number of children served by early learning programs in Illinois.
AmericA’s edge is supported by tax-deductible contributions from foundations, individuals and corporations. AmericA’s edge ac-cepts no funds from federal, state or local governments. Major funding for AmericA’s edge is provided by The Annie E. Casey Foundation, The Hagedorn Foundation, The James Irvine Foundation, and the W.K. Kellogg Foundation.
AmericA’s edge © 2010 All Rights Reserved
Strengthening Businesses Through Proven Investments in Kids
Strengthening Illinois Businesses through Investments in Early Care and Education
How Early Learning Investments Can Help Expand Illinois’ Economy
Illinois business leaders recognize that the key to jump-starting the state’s economy and keeping struggling companies in business is to generate additional sales of local goods and services, while also creating new jobs. That is why, after taking a hard look at the research and calculating proven returns on investment, Illinois business leaders are calling on the governor and state legislators to invest in early care and education. This report documents that investments in early learning provide a significant, immediate economic boost for local businesses and help build stronger communities over the long term.
Fully investing in early care and education would generate billions of dollars in sales of goods and services for Illinois businesses and create tens of thousands of jobs in the state. In fact, investments in quality early learning generate as much or more new spending for local businesses as investments in eight other major economic sectors. For every $1 invested in early care and education in Illinois, an additional 94 cents are generated for a total of $1.94 in new spending in the state. This strong economic boost for local businesses is comparable to or higher than investments in other major sectors such as construction, retail trade, manufacturing, transportation and utilities.
Expanding early care and education should be a critical component of Illinois’ economic recovery. To provide increased access to quality early care and education in keeping with Illinois’ Preschool for All plan, while also expanding access to Illinois’ youngest children from birth through age two, would require an investment of an additional $1.2 billion. That investment would generate $2.3 billion in total new spending in Illinois businesses. And nearly all of these dollars generated in Illinois would stay in Illinois – helping local businesses prosper while also creating up to 34,000 new jobs, including 7,000 jobs outside the early learning sector.
Such an investment will also save Illinois businesses money every day through reduced absenteeism and turnover. The average working parent in America misses five to nine days of work per year because of child care problems. This costs U.S. businesses
$3 billion a year in lost productivity. Research confirms that if parents have quality early care and education available in their communities, not only will absenteeism and turnover go down, but productivity will also go up – immediately improving businesses’ bottom lines.
Yet another strategic reason for this investment is that access to quality early care and education will increase the ability of Illinois businesses to attract skilled employees. Quality programs for our youngest children are needed for the same reasons communities strive to have a strong K-12 education system to attract skilled workers and new businesses. The U.S. Department of Education has warned that 60 percent of new jobs in the 21st century will require skills possessed by only 20 percent of the current workforce. As our economy begins to turn around, Illinois businesses need the right resources to attract and retain the best workers. To attract the best employees, communities must be able to ensure that quality early learning is available for their children.
Finally, such an investment will establish a foundation for sustained economic growth because quality early learning is key to ensuring that future employees have the 21st century skills Illinois businesses need. To remain competitive in a global marketplace, businesses need communicators, collaborators and critical thinkers. Research confirms that quality early learning is the crucial first step in the development of those skills. And research shows that the return on investment is impressive: Studies of high-quality early education programs for at-risk children have shown that quality programs can save as much as $16 for every dollar invested.
The bottom line: With limited funds available to help businesses and our economy get back and stay on track, few investments make as much sense for Illinois businesses’ balance sheets as do expanded investments in high-quality early care and education.
Executive Summary

1
Strengthening Illinois Businesses through Investments in Early Care and Education
Strengthening Illinois Businesses through Investments in Early Care and Education
Immediate Short-Term Economic Gains
Critical Issues for Illinois Businesses
Even in today’s tough economy, many businesses are experiencing a short supply of employees with 21st century skills in large part because high school and college graduates lack the knowledge and ability businesses need. Consider these facts. In the United States:
• 31 percent of high school students do not graduate on time;
• 70 percent of eighth graders are below grade level in math;
• 68 percent of fourth graders read below grade level; and
• 60 percent of three- to five-year-olds do not have the basic skills needed to enter kindergarten, such as counting to ten and recognizing letters in the alphabet.1
Each year, dropping out costs the United States dearly in lost productivity. In fact, high school dropouts are so much less productive than high school graduates that each class of dropouts will make $335 billion less over their lifetime than they would have as graduates.2 Deficits in basic skills are also an unsustainable expense, costing our nation $3.7 billion annually in remedial education costs and reduced earning potential.3
Increasing Sales of Local Goods and Services
New research by AmericA’s edge found that increasing the skill level of current and future employees, increasing graduation rates and future earnings, strengthening local and state economies immediately, and improving businesses’ bottom lines can be achieved through cost effective and proven investments in quality early childhood education programs.4
What economic modeling is the most effective way to determine early education’s economic impact in Illinois? This report used IMPLAN, an economic modeling system first developed 17 years ago that is widely used for conducting a variety of economic impact and related analyses, to find the answer. This study employed the most recent available (2008) data sets and IMPLAN models and adheres fully to standard input-output and IMPLAN conventions (see the Appendix for a complete explanation of
IMPLAN and the report’s methodology).
This economic impact modeling system found that, for every additional $1 invested in early care and education in Illinois, $1.94 is generated in total new spending within the state. This strong economic boost for local businesses is comparable to or higher than investments in other major sectors such as construction ($1.99), retail trade ($1.93), transportation ($1.91), manufacturing ($1.79) and utilities ($1.44).5 Research shows that among Illinois’ major economic sectors that will spur economic growth, early care and education offers one of the smartest ways to create additional buying power for consumers and help local companies stay in business.
To provide increased access to quality early care and education in keeping with Illinois’ Preschool for All plan, while also expanding access to Illinois’ youngest children from birth through age two, would require an investment of an additional $1.2 billion. That investment would yield $1.1 billion in additional sales in Illinois’ economy outside of early care and education, for a total of $2.3 billion of new money infused into the state (see Appendix C).6 And most of these dollars generated in Illinois would stay in Illinois – helping local businesses improve sales in almost every sector. Here are some examples of the
Every $1 spent in Illinois on early learning generates an
additional 94 cents in other sectors of the economy:
OTHER (2) 25%
SERVICES (1)25%
RETAIL/WHOLESALE 13%
INSURANCE/MONEY/FINANCE
19%
CONSTRUCTION/REAL ESTATE
18%
1. Professional, business, information, entertainment, rental, and utility services.2. Farming, logging, fishing, and hunting: mining, oil, and gas; manufacturing; and transportation.
Source: IMPLAN, 2008
2
Strengthening Illinois Businesses through Investments in Early Care and Education
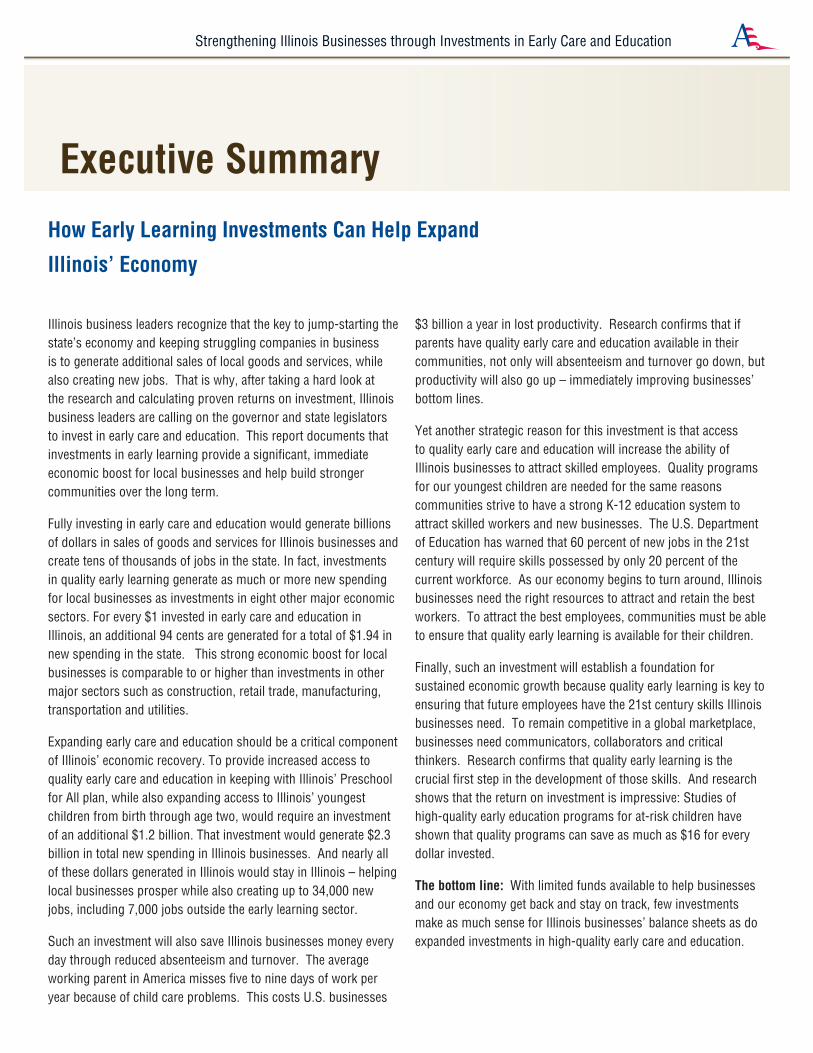
economic impact that investing in early learning would have on the major economic sectors in Illinois:
• Approximately $275 million in new sales in the state’s services sector, which employs the majority of workers in Illinois. The additional dollars would benefit many small businesses including dry cleaners, mobile phone and cable companies, and numerous professional firms such as accounting, law and tax offices.7
• Nearly $200 million in new sales in real estate and construction – providing a boost to the slumping real estate market and helping many low- and middle-income families keep up with their mortgage or rental payments.8
• Over $200 million in new dollars to Illinois’ insurance and finance sectors, including local banks and insurance companies.9
• Over $140 million in new sales in Illinois’ retail and wholesale trade sectors, including grocery stores, department stores, and auto dealers.10
The $1.1 billion in additional spending outside of early care and education will be generated in over 400 economic categories. Of those 400-plus categories, here are just a few concrete examples of increased sales for Illinois businesses:
• Over $40 million in sales at local restaurants, the cost for over 13,000 households of four to eat out for one year;11
• Over $20 million in sales from local electric companies, the cost of monthly electric bills for over 16,000 families of four;12
• $10 million in sales from local supermarkets, the cost of a year of groceries for over 2,000 families of four;13
• Over $5 million in sales from local clothing stores, the cost of annual clothing purchases for over 2,000 families of four;14
• Over $7 million in sales from local car and automobile parts dealers, the cost, for example, for over 400 families to get a new compact car.15
The early learning sector is comparable to or greater than other major economic sectors in generating additional spending in the economy:
Economic Sectors Ouput Multipliers
Early Care and Education1 $1.94
Other Major Sectors
Construction $1.99
Retail Trade $1.93
Wholesale Trade $1.92
Transportation $1.91
Manufacturing $1.79
Mining, Oil, Gas $1.70
Farming, Forest, Fishing, Hunting $1.55
Utilities $1.44
1. The early care and education sector is part of the larger services sector, which on average generates a multiplier of $1.98 for every $1 invested.
Source: IMPLAN, 2008 analysis of Type SAM Output Multipliers for Illinois
Every $1 invested in the early learning sector generates an additional 94 cents in the local economy.
How Early Learning Investments Help Illinois Businesses
New Investments
New Sales
Make Purchases
MoreJobs
Main Street
Businesses
$
$
Teachers & Staff
$
Early Learning Centers
$

3
Strengthening Illinois Businesses through Investments in Early Care and Education
The key point is that investments in the early learning sector are very competitive with investments in other major sectors, and these investments create an immediate infusion of dollars throughout Illinois’ local businesses. 34,000 New Jobs in Illinois
Fully investing in early care and education would also create thousands of new jobs. For every four jobs created in the early care and education sector, more than one job is created outside that sector in Illinois’ economy.18
An analysis of the IMPLAN economic data for Illinois shows that a $1.2 billion investment to provide increased access to quality early care and education in keeping with Illinois’ Preschool for All plan, while also expanding access to Illinois’ youngest children from birth through age two, would create 34,000 new jobs, including 7,000 new jobs in other economic sectors.19 These additional jobs are created when expanded early learning programs and their employees purchase additional local goods and services. As demand for goods increases, so does the need to supply those goods, which creates jobs.
Thus, investment in early learning, with the increased spending power from newly-employed individuals, would help Illinois begin
to reduce its unemployment rate and immediately strengthen local businesses.
Cost Savings and Increased Productivity for Businesses
Quality early learning saves businesses money through reduced absenteeism and turnover. The average working parent in America misses five to nine days of work, or one to two weeks per year, because of child care problems. In fact, according to a study published by Cornell University, this problem costs U.S. businesses $3 billion every year.20 Research confirms that if parents have quality early care and education available in their communities, not only will absenteeism and turnover go down, but retention and productivity will also go up.21 Reduced absenteeism and turnover and increased retention and productivity translate into immediate savings and increased profits for businesses—good news to Illinois businesses on both sides of their balance sheets.
Attracting Skilled Employees
Even in tough economic times, businesses often struggle to attract qualified applicants to fill skilled positions. Having access to quality early care and education services currently
The dollars initially invested in an early learning program re-circulate through the local economy. The first dollar of spending goes directly to early care and education programs, and the additional spending is generated in two ways: (1) when early learning centers purchase local goods and services to operate their programs; and (2) when early learning teachers and staff spend their wages on local goods and services. All this additional spending is generated through what is known as the “multiplier effect.”
Although every industry generates some additional spending in these two ways (see table on page 2 for a comparison of economic output multipliers for different sectors), the early child care and education sector has one of the highest output multipliers because a high proportion of the spending by early learning programs and staff is spent locally. Much of the investment in early education goes to teacher wages, and the person-to-person nature of this
service means that it must be provided and delivered locally. This is different from many industries that are based on products that could be manufactured outside of Illinois or on services that can be provided remotely (e.g., customer service representatives via phone lines from other states or even internationally).
In turn, since early education teachers and staff are low- and moderate-wage workers (child care workers have median annual incomes of $17,440)16, they typically spend rather than save their wages, purchasing local goods and services, including housing and retail products.
Here’s what this means in actual dollars and cents: Every dollar spent on early care and education in Illinois yields a total of $1.94 in the state economy.17
Early Learning Spending Stays in Illinois Here’s how it works:
4
Strengthening Illinois Businesses through Investments in Early Care and Education
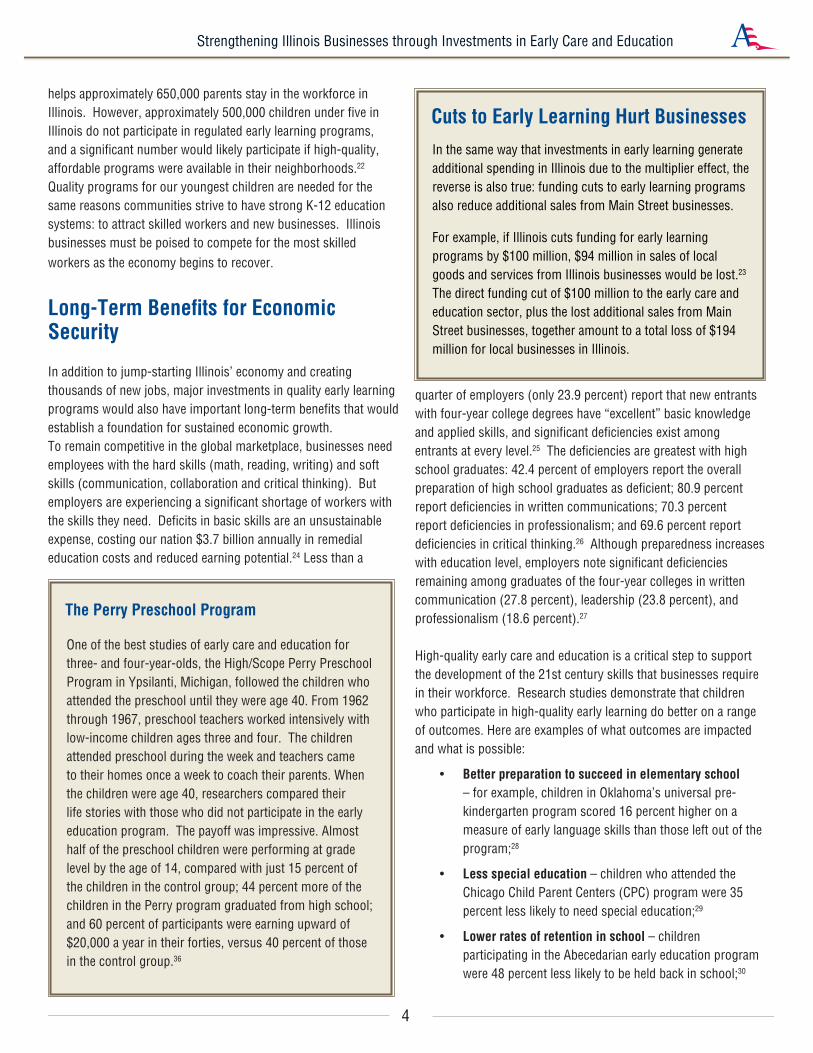
helps approximately 650,000 parents stay in the workforce in Illinois. However, approximately 500,000 children under five in Illinois do not participate in regulated early learning programs, and a significant number would likely participate if high-quality, affordable programs were available in their neighborhoods.22 Quality programs for our youngest children are needed for the same reasons communities strive to have strong K-12 education systems: to attract skilled workers and new businesses. Illinois businesses must be poised to compete for the most skilled workers as the economy begins to recover.
Long-Term Benefits for Economic Security
In addition to jump-starting Illinois’ economy and creating thousands of new jobs, major investments in quality early learning programs would also have important long-term benefits that would establish a foundation for sustained economic growth. To remain competitive in the global marketplace, businesses need employees with the hard skills (math, reading, writing) and soft skills (communication, collaboration and critical thinking). But employers are experiencing a significant shortage of workers with the skills they need. Deficits in basic skills are an unsustainable expense, costing our nation $3.7 billion annually in remedial education costs and reduced earning potential.24 Less than a
quarter of employers (only 23.9 percent) report that new entrants with four-year college degrees have “excellent” basic knowledge and applied skills, and significant deficiencies exist among entrants at every level.25 The deficiencies are greatest with high school graduates: 42.4 percent of employers report the overall preparation of high school graduates as deficient; 80.9 percent report deficiencies in written communications; 70.3 percent report deficiencies in professionalism; and 69.6 percent report deficiencies in critical thinking.26 Although preparedness increases with education level, employers note significant deficiencies remaining among graduates of the four-year colleges in written communication (27.8 percent), leadership (23.8 percent), and professionalism (18.6 percent).27
High-quality early care and education is a critical step to support the development of the 21st century skills that businesses require in their workforce. Research studies demonstrate that children who participate in high-quality early learning do better on a range of outcomes. Here are examples of what outcomes are impacted and what is possible:
• Better preparation to succeed in elementary school – for example, children in Oklahoma’s universal pre-kindergarten program scored 16 percent higher on a measure of early language skills than those left out of the program;28
• Less special education – children who attended the Chicago Child Parent Centers (CPC) program were 35 percent less likely to need special education;29
• Lower rates of retention in school – children participating in the Abecedarian early education program were 48 percent less likely to be held back in school;30
One of the best studies of early care and education for three- and four-year-olds, the High/Scope Perry Preschool Program in Ypsilanti, Michigan, followed the children who attended the preschool until they were age 40. From 1962 through 1967, preschool teachers worked intensively with low-income children ages three and four. The children attended preschool during the week and teachers came to their homes once a week to coach their parents. When the children were age 40, researchers compared their life stories with those who did not participate in the early education program. The payoff was impressive. Almost half of the preschool children were performing at grade level by the age of 14, compared with just 15 percent of the children in the control group; 44 percent more of the children in the Perry program graduated from high school; and 60 percent of participants were earning upward of $20,000 a year in their forties, versus 40 percent of those in the control group.36
The Perry Preschool Program
In the same way that investments in early learning generate additional spending in Illinois due to the multiplier effect, the reverse is also true: funding cuts to early learning programs also reduce additional sales from Main Street businesses.
For example, if Illinois cuts funding for early learning programs by $100 million, $94 million in sales of local goods and services from Illinois businesses would be lost.23 The direct funding cut of $100 million to the early care and education sector, plus the lost additional sales from Main Street businesses, together amount to a total loss of $194 million for local businesses in Illinois.
Cuts to Early Learning Hurt Businesses
5
Strengthening Illinois Businesses through Investments in Early Care and Education
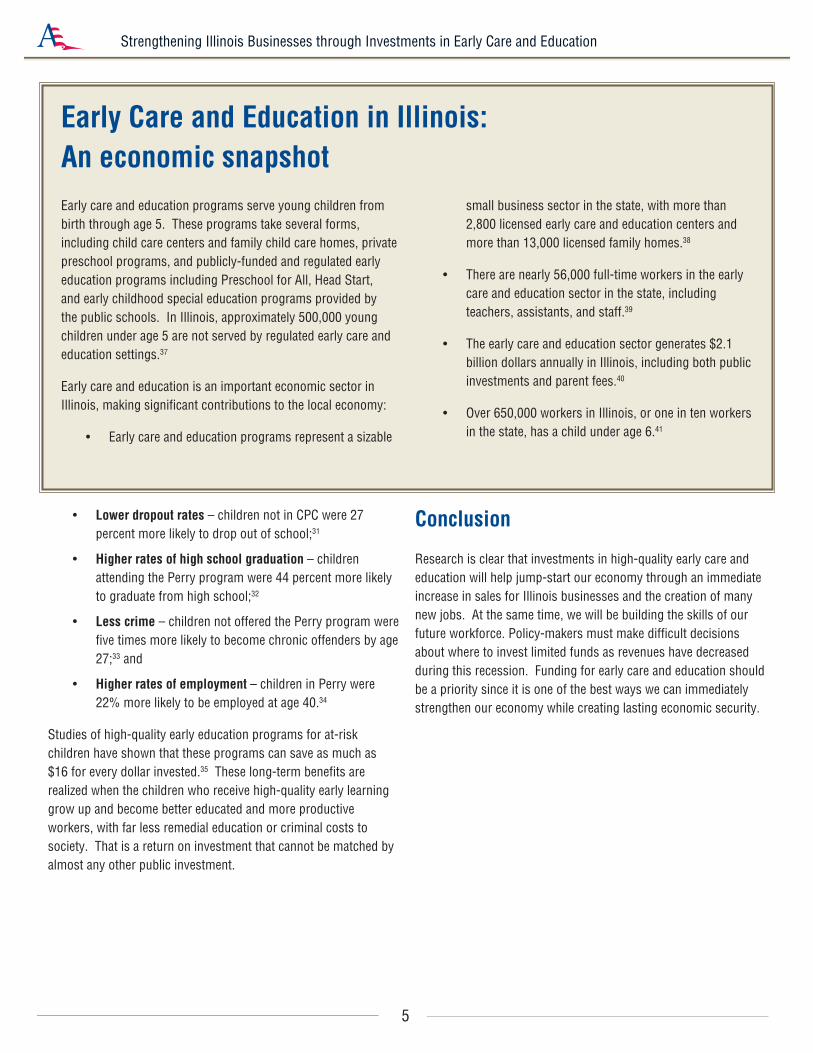
• Lower dropout rates – children not in CPC were 27 percent more likely to drop out of school;31
• Higher rates of high school graduation – children attending the Perry program were 44 percent more likely to graduate from high school;32
• Less crime – children not offered the Perry program were five times more likely to become chronic offenders by age 27;33 and
• Higher rates of employment – children in Perry were 22% more likely to be employed at age 40.34
Studies of high-quality early education programs for at-risk children have shown that these programs can save as much as $16 for every dollar invested.35 These long-term benefits are realized when the children who receive high-quality early learning grow up and become better educated and more productive workers, with far less remedial education or criminal costs to society. That is a return on investment that cannot be matched by almost any other public investment.
Conclusion
Research is clear that investments in high-quality early care and education will help jump-start our economy through an immediate increase in sales for Illinois businesses and the creation of many new jobs. At the same time, we will be building the skills of our future workforce. Policy-makers must make difficult decisions about where to invest limited funds as revenues have decreased during this recession. Funding for early care and education should be a priority since it is one of the best ways we can immediately strengthen our economy while creating lasting economic security.
Early care and education programs serve young children from birth through age 5. These programs take several forms, including child care centers and family child care homes, private preschool programs, and publicly-funded and regulated early education programs including Preschool for All, Head Start, and early childhood special education programs provided by the public schools. In Illinois, approximately 500,000 young children under age 5 are not served by regulated early care and education settings.37
Early care and education is an important economic sector in Illinois, making significant contributions to the local economy:
Early care and education programs represent a sizable •
small business sector in the state, with more than 2,800 licensed early care and education centers and more than 13,000 licensed family homes.38
There are nearly 56,000 full-time workers in the early •care and education sector in the state, including teachers, assistants, and staff.39
The early care and education sector generates $2.1 •billion dollars annually in Illinois, including both public investments and parent fees.40
Over 650,000 workers in Illinois, or one in ten workers •in the state, has a child under age 6.41
Early Care and Education in Illinois:An economic snapshot
6
Strengthening Illinois Businesses through Investments in Early Care and Education
Appendix A
Economic Multipliers AnalysisEconomists have documented the contributions that early care and education sector makes to the economy in the short term through economic multiplier effects.
The short-term economic development benefits of the early child care and education sector are based on estimates calculated from what are called input-output economic models. These models show the linkages between all sectors in the economy, creating a matrix detailing how spending in each sector ripples through other economic sectors via the purchases of goods and services from other sectors.
There are three types of economic linkage effects that this input-output analysis captures. Direct effects of new spending in the child care sector are seen within the sector itself, through new money spent on child care programs. Indirect effects reflect the inter-industry expenditures generated when child care businesses purchase goods and services from other sectors. These businesses, in turn, are stimulated to increase their input purchases, and so on in widening ripple effects throughout the economy. Induced effects reflect similar economy-wide impacts due to the increased spending on goods and services of early education workers as first their wages increase, and then the wages of workers in other affected industries increase. The combined linkage effect of indirect (inter-industry spending) and induced (household spending) is called a Type SAM multiplier.
Early learning investments generate new dollars and jobs throughout Illinois’ economy. Every new dollar spent on early learning yields a total of $1.94 in the state economy.
AmericA’s edge commissioned an analysis of the most recent available data for Illinois on the economic impact of the early care and education sector on other sectors.
All input-output modeling results were generated using the Minnesota IMPLAN Group, Inc (MIG, Inc) IMPLAN® economic impact modeling system. First developed in 1993, the system now is in widespread use for conducting a wide variety of economic impact and related analyses.
This study employed the most recently available (2008) data sets and IMPLAN models. One model was created for Illinois. Our modeling approach and analyses adhere fully to standard input-output and IMPLAN conventions.
Multipliers were generated for the model using two separate sets of assumptions about regional purchase coefficients (RPC), or the proportion of purchases in each sector that occur regionally (locally). First, the multipliers were generated based on estimates from MIG, Inc.’s recently-completed National Trade Flow Model. Second, in order to facilitate comparison with earlier IMPLAN modeling work, multipliers were also generated based on the previous IMPLAN standard for RPC estimates, namely an econometric model.
The reported results are based on fully disaggregated models (i.e. 440 distinct sectors). The disaggregated sectors are defined by MIG, inc. but are based upon and cross-walked with the North American Industrial Classification System (NAICS), which several years ago replaced the Standard Industrial Classification (SIC) code system. Additional analysis was also conducted using models we aggregated into a small number of very broad sectors (e.g. Agriculture, Manufacturing, Services, etc.).
To illustrate the impact of increased spending on child care, we used the models created to estimate the indirect and induced effects on each sector of the economy of exogenous increases (e.g. of a $1,000,000) in the demand for child care services. Because government spending is determined as much by policy decisions as by the regional dynamics of economic forces, government spending is conventionally treated as a source of exogenous demand. We focus on this source.
For additional information and background on input-output analyses of the early care and education sector, see the following resources:
Zhilin, L., Ribeiro, R., & Warner, M. (2004). Child care multipliers: Analysis from fifty states. Linking Economic Development and Child Care Research Project. Ithaca, NY: Cornell University, Cornell Cooperative Extension. Retrieved from http://government.cce.cornell.edu/doc/pdf/50StatesBrochure.pdf
Zhilin, L., Ribeiro, R., & Warner, M. (2004). Comparing child care multipliers in the regional economy: Analysis from 50 states. Linking Economic Development and Child Care Research Project. Ithaca, NY: Cornell University, Cornell Cooperative Extension. Retrieved from http://government.cce.cornell.edu/doc/pdf/50States.pdf
7
Strengthening Illinois Businesses through Investments in Early Care and Education
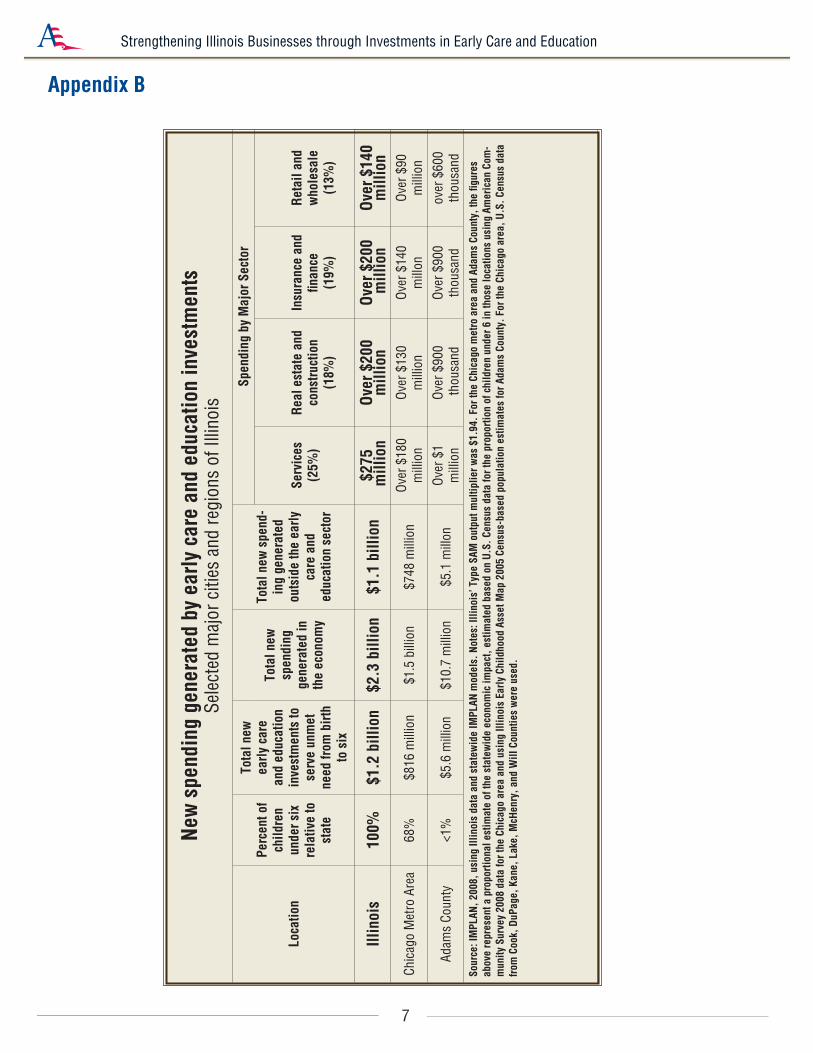
Appendix B
New
spe
ndin
g ge
nera
ted
by e
arly
car
e an
d ed
ucat
ion
inve
stm
ents
Se
lect
ed m
ajor
citi
es a
nd re
gion
s of
Illin
ois
Loca
tion
Perc
ent o
f ch
ildre
n un
der s
ix
rela
tive
to
stat
e
Tota
l new
ea
rly c
are
and
educ
atio
n in
vest
men
ts to
se
rve
unm
et
need
from
birt
h to
six
Tota
l new
sp
endi
ng
gene
rate
d in
th
e ec
onom
y
Tota
l new
spe
nd-
ing
gene
rate
d ou
tsid
e th
e ea
rly
care
and
ed
ucat
ion
sect
or
Spen
ding
by
Maj
or S
ecto
r
Serv
ices
(2
5%)
Real
est
ate
and
cons
truct
ion
(1
8%)
Insu
ranc
e an
d fin
ance
(1
9%)
Reta
il an
d w
hole
sale
(1
3%)
Illin
ois
100%
$1.2
bill
ion
$2.3
bill
ion
$1.1
bill
ion
$275
mill
ion
Over
$20
0 m
illio
nOv
er $
200
mill
ion
Over
$14
0 m
illio
n
Chic
ago
Met
ro A
rea
68%
$816
mill
ion
$1.5
bill
ion
$748
mill
ion
Over
$18
0 m
illio
nOv
er $
130
mill
ion
Over
$14
0 m
illon
Over
$90
m
illio
n
Adam
s Co
unty
<1%
$5.6
mill
ion
$10.
7 m
illio
n$5
.1 m
illon
Over
$1
mill
ion
Over
$90
0 th
ousa
ndOv
er $
900
thou
sand
over
$60
0th
ousa
ndSo
urce
: IM
PLAN
, 200
8, u
sing
Illin
ois
data
and
sta
tew
ide
IMPL
AN m
odel
s. N
otes
: Illi
nois
’ Typ
e SA
M o
utpu
t mul
tiplie
r was
$1.
94. F
or th
e Ch
icag
o m
etro
are
a an
d Ad
ams
Coun
ty, t
he fi
gure
s ab
ove
repr
esen
t a p
ropo
rtion
al e
stim
ate
of th
e st
atew
ide
econ
omic
impa
ct, e
stim
ated
bas
ed o
n U.
S. C
ensu
s da
ta fo
r the
pro
porti
on o
f chi
ldre
n un
der 6
in th
ose
loca
tions
usi
ng A
mer
ican
Com
-m
unity
Sur
vey
2008
dat
a fo
r the
Chi
cago
are
a an
d us
ing
Illin
ois
Early
Chi
ldho
od A
sset
Map
200
5 Ce
nsus
-bas
ed p
opul
atio
n es
timat
es fo
r Ada
ms
Coun
ty. F
or th
e Ch
icag
o ar
ea, U
.S. C
ensu
s da
ta
from
Coo
k, D
uPag
e, K
ane,
Lak
e, M
cHen
ry, a
nd W
ill C
ount
ies
wer
e us
ed.
8
Strengthening Illinois Businesses through Investments in Early Care and Education
Calculations for New Early Care and Education Investments in Illinois
AmericA’s edge estimates that $1.2 billion in new early care and education investments are needed in Illinois to serve an additional 150,000 young children from birth through age four currently un-served by these programs.
Goals for providing high-quality early learning to Illinois children
AmericA’s edge supports the goal laid out in Illinois’ Preschool for All plan that 60% of all 4-year-olds be served by high-quality early care and education programs, and that 50% of all younger children (from birth through age 3) be served by high-quality early care and education programs. While several states have proposed and implemented higher participation rates in early learning programs – Oklahoma, the national leader on access to early learning pro-grams, serves 71% of its 4-year-olds with pre-k, and serves 88% of its 4-year-olds with pre-k, Head Start, or early childhood special education programs – the Preschool for All plan provides a realis-tic short-term goal for increased access to early learning in Illinois.
The Preschool for All plan was developed by the Illinois Early Learning Council, established in 2003 by the governor and the Illinois General Assembly and comprised of gubernatorial and legislative appointees who serve on a voluntary, unpaid basis to plan a comprehensive statewide early learning system. This Pre-school for All plan set the goal for three- and four-year-olds while acknowledging the need for increased support for younger chil-dren. For the purposes of this estimate, AmericA’s edge has ex-tended the goal for three-year-olds to younger children as well. To serve 60% of all 4-year-olds (60% of 180,715 children, or 108,429 children) and 50% of all 3-year-olds (50% of 177,584 children, or 88,792 children), 2-year-olds (50% of 178,790 children, or 89,395 children), 1-year-olds (50% of 180,178 children, or 90,089 children), and children under age 1 (50% of 181,010 children, or 90,505 children) yields a total of 467,210 children under age 5 who need to be served by high-quality early learning programs to reach this goal. Illinois Early Childhood Asset Map. (2010). Popu-lation (2005 estimates). Champaign, IL: University of Illinois. Re-trieved on April 27, 2010 from http://iecam.crc.uiuc.edu/; Barnett, W.S., Epstein, D.J., Friedman, A.H., Boyd, J.S., & Hustedt, J.T. (2008). The state of preschool 2008 – State preschool yearbook. Rutgers, NJ: Rutgers Universirty, National Institue for Early Educa-tion Research.
Economic multipliers calculations for new investments needed
The $2.3 billion estimate for of the total new spending generated in Illinois’ economy from $1.2 billion in new early care and education spending was calculated by taking the Type SAM Output multiplier for Illinois, $1.94, and multiplying it by the $1.2 billion, which yields $2.3 billion in new spending. This new spending includes the $1.2 billion new direct spending in the ECE sector, plus the new indirect and induced spending (with a subtotal of $1.1 billion) which ripple out to other sectors of Illinois’ economy, yielding $2.3 billion in new total spending.
Estimates of current capacity in early care and education pro-grams
In Illinois, there are an estimated 898,000 children (898,277) un-der age five living in families. Illinois Early Childhood Asset Map. (2010). Population (2005 estimates). Champaign, IL: University of Illinois. Retrieved on April 27, 2010 from http://iecam.crc.uiuc.edu/. To estimate the number of children under age five in regulat-ed early care and education programs, AmericA’s edge obtained the most recently available figures from state data sources document-ing enrollment in the various early care and education programs.
AmericA’s edge was able to obtain estimates of program capacity or enrollment for each major type of early care and education pro-gram available to children and families in Illinois.
Pre-kindergarten: 95,300 children were enrolled in the Illinois State Board of Education (ISBE) preK program in 2009. Illinois Early Childhood Asset Map. (2010). ISBE Prek/PFA (FY 2009). Champaign, IL: University of Illinois. Retrieved on April 26, 2010 from http://iecam.crc.uiuc.edu/
Head Start: 36,438 children were enrolled in Head Start programs in Illinois, based on May 2006 funded enrollment data. Illinois Early Childhood Asset Map. (2010). Head Start (FY 2006). Cham-paign, IL: University of Illinois. Retrieved on April 26, 2010 from http://iecam.crc.uiuc.edu/
Child care centers and family child care homes: the total number of young children in regulated child care programs (which included child care centers or family child care homes) was 204,621 chil-dren, based on June 2007 state data from the Illinois Network of Child Care Resource and Referral Agencies (INCCRRA) and from Illinois Action for Children for Chicago and Cook County. This figure was calculated by adding the total number of children from birth to age 2 in centers (58,233 children) and the number of chil-
Appendix C
9
Strengthening Illinois Businesses through Investments in Early Care and Education
dren aged 3 through Kindergarten in centers (101,380 children), along with the number of children from birth to age 2 in licensed family child care homes (24,864 children) and the number of pre-schoolers in licensed family child care homes (20,144 children). Illinois Action for Children. (2007). Child care and early education programs. (2007). Chicago, IL: Author. Retrieved on April 27, 2010 from http://www.actforchildren.org/_uploads/documents/live/2007_Child_Care_and_Early_Education_Programs_.pdf
Family, friend, and neighbor care: Additional children participate in family friend and neighbor care arrangements, but the informal, unregulated nature of these early care arrangements makes them very difficult to document, and they are not included in this count, except for those family, friend or neighbor care arrangements for which families are receiving child care assistance. 32,807 children age 5 and under were served by family, friend and neighbor care and also received child care assistance for this care. This figure was calculated first for children from birth to age 2 by multiply-ing the number of children age 0-2 receiving child care assistance (46,278 children) by the percentage of children who are in family, friend, and neighbor care (35%), yielding 16,197 children. And for children aged 3-5, this figure was calculated by multiplying the number of children age 3-5 receiving child care assistance (51,906 children) by the percentage of children who are in family, friend, and neighbor care (32%), yielding 16,610 children. Illinois Action for Children. (2007). Children eligible for Illinois child care assistance. Chicago, IL: Author. Retrieved on April 27, 2010 from http://www.actforchildren.org/_uploads/documents/live/2007_Chil-dren_Eligible_for_Child_Care_Assistance.pdf; Illinois Action for Children. (2007). Child care in the homes of family, friends or neighbors (2007). Chicago, IL: Author. Retrieved on April 27, 2010 from http://www.actforchildren.org/_uploads/documents/live/2007_Family_Friend_and_Neighbor_Child_Care.pdf.
Private preschool programs: There were 33,052 spaces for chil-dren in private preschool programs in Illinois, based on June 2007 Child Care Resource and Referral Agency data. Illinois Action for Children. (2007). Child care and early education programs. (2007). Chicago, IL: Author. Retrieved on April 27, 2010 from http://www.actforchildren.org/_uploads/documents/live/2007_Child_Care_and_Early_Education_Programs_.pdf
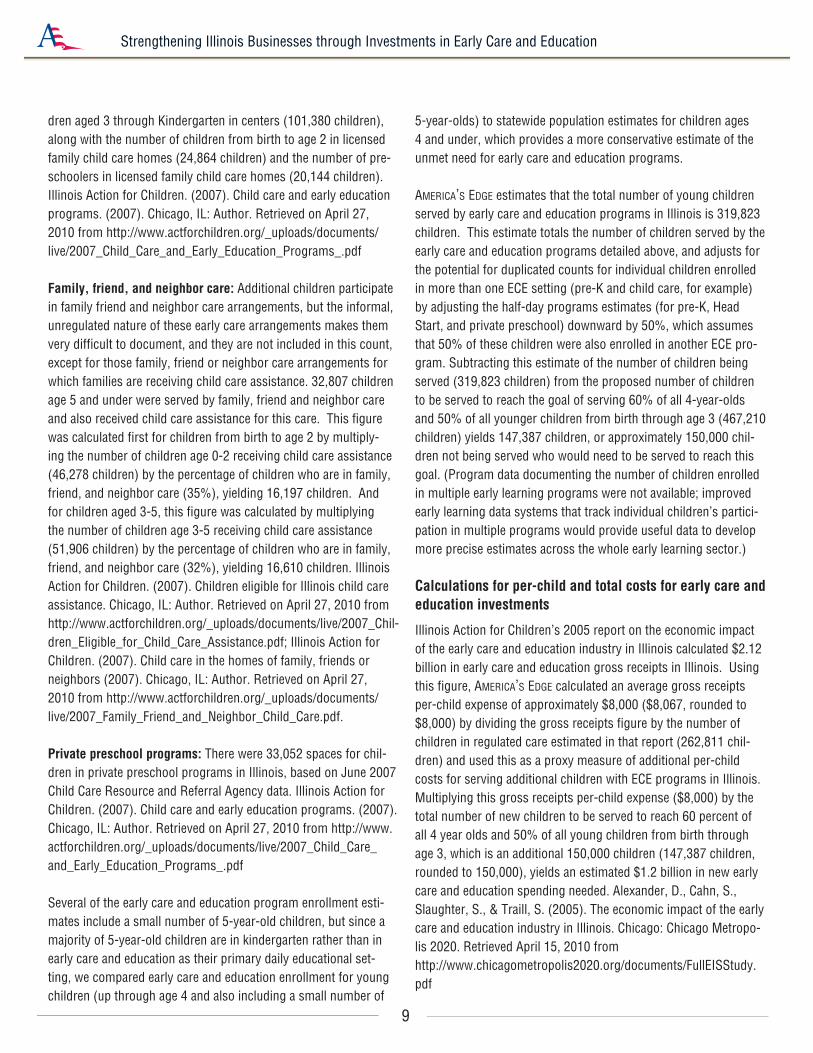
Several of the early care and education program enrollment esti-mates include a small number of 5-year-old children, but since a majority of 5-year-old children are in kindergarten rather than in early care and education as their primary daily educational set-ting, we compared early care and education enrollment for young children (up through age 4 and also including a small number of
5-year-olds) to statewide population estimates for children ages 4 and under, which provides a more conservative estimate of the unmet need for early care and education programs. AmericA’s edge estimates that the total number of young children served by early care and education programs in Illinois is 319,823 children. This estimate totals the number of children served by the early care and education programs detailed above, and adjusts for the potential for duplicated counts for individual children enrolled in more than one ECE setting (pre-K and child care, for example) by adjusting the half-day programs estimates (for pre-K, Head Start, and private preschool) downward by 50%, which assumes that 50% of these children were also enrolled in another ECE pro-gram. Subtracting this estimate of the number of children being served (319,823 children) from the proposed number of children to be served to reach the goal of serving 60% of all 4-year-olds and 50% of all younger children from birth through age 3 (467,210 children) yields 147,387 children, or approximately 150,000 chil-dren not being served who would need to be served to reach this goal. (Program data documenting the number of children enrolled in multiple early learning programs were not available; improved early learning data systems that track individual children’s partici-pation in multiple programs would provide useful data to develop more precise estimates across the whole early learning sector.)
Calculations for per-child and total costs for early care and education investments
Illinois Action for Children’s 2005 report on the economic impact of the early care and education industry in Illinois calculated $2.12 billion in early care and education gross receipts in Illinois. Using this figure, AmericA’s edge calculated an average gross receipts per-child expense of approximately $8,000 ($8,067, rounded to $8,000) by dividing the gross receipts figure by the number of children in regulated care estimated in that report (262,811 chil-dren) and used this as a proxy measure of additional per-child costs for serving additional children with ECE programs in Illinois. Multiplying this gross receipts per-child expense ($8,000) by the total number of new children to be served to reach 60 percent of all 4 year olds and 50% of all young children from birth through age 3, which is an additional 150,000 children (147,387 children, rounded to 150,000), yields an estimated $1.2 billion in new early care and education spending needed. Alexander, D., Cahn, S., Slaughter, S., & Traill, S. (2005). The economic impact of the early care and education industry in Illinois. Chicago: Chicago Metropo-lis 2020. Retrieved April 15, 2010 from http://www.chicagometropolis2020.org/documents/FullEISStudy.pdf
10
Strengthening Illinois Businesses through Investments in Early Care and Education
1 EPE Research Center. (2009). High school graduation rate improves over past decade: Recent declines
threaten progress. Bethesda, MD: Education Week. Retrieved on March 1, 2010 from http://www.edweek.
org/media/ew/dc/2009/DC09_PressPackage_FINAL.pdf Lee, J., Grigg, W., & Donahue, P. (2007). The
Nation’s Report Card: Reading 2007 (NCES 2007–496). National Center for Education Statistics, Institute of
Education Sciences, U.S. Department of Education. Washington, DC; Lee, J., Grigg, W., & Dion, G. (2007).
The Nation’s Report Card: Mathematics 2007 (NCES 2007-494). National Center for Education Statistics,
Institute of Education Sciences, U.S. Department of Education, Washington, DC; Nord, C.W., Lennon, J.,
Baiming, L., & Chandler, K. (1999). Home literacy activities and signs of children’s emerging literacy, 1993
and 1999. Washington, DC: U.S. Department of Education. Retrieved on April 6, 2010 from http://nces.
ed.gov/pubs2000/2000026.pdf
2 Alliance for Excellent Education. (August 2009). The high cost of high school dropouts: What the nation
pays for inadequate high schools. Washington, DC: Author. Retrieved on October 12, 2010 from: http://
www.all4ed.org/files/HighCost.pdf
3 Alliance for Excellent Education. (2006). Paying double: Inadequate high schools and community college
remediation. Washington, DC: Author. Retrieved on February 25, 2010 from http://www.all4ed.org/files/
remediation.pdf
4 High-quality early care and education programs include the following essential features: Highly-
qualified teachers with appropriate compensation, comprehensive and age-appropriate curricula, strong
family involvement, small staff-to-child ratios to ensure that each child gets sufficient attention, small, age-
appropriate class sizes, and screening and referral services for developmental, health, or behavior problems.
Several studies show that high quality early care and education teachers have at least a four-year degree,
partake in on-going training, and are paid well. Whitebook, M. (2003). Early education quality: Higher
teacher qualifications for better learning environments—A review of the literature. Berkeley, CA: Institute
of Industrial Relations. Retrieved on February 25, 2010 from http://iir.berkeley.edu/cscce/pdf/teacher.
pdf; Katz, L. (1999). Curriculum disputes in early childhood education. Champaign, IL: Clearinghouse on
Early Education and Parenting. Retrieved on February 25, 2010 from http://ceep.crc.uiuc.edu/eearly care
and educationarchive/digests/1999/katz99b.html; Goffin, S. G., & Wilson, C. (2001). Curriculum models
and early childhood education: Appraising the relationship (2nd ed.). Upper Saddle River, NJ: Merrill/
Prentice Hall; Some examples of a strong parent-involvement component include the home visits in the
High/Scope Perry Pre-kindergarten and Syracuse University Family Development programs, the intensive
parent coaching in Chicago Child-Parent Centers, and the parent volunteers in Head Start. For Perry Pre-
kindergarten see: Schweinhart, L. J., Barnes, H. V., & Weikart, D. P. (1993). Significant benefits: The High/
Scope Perry Pre-kindergarten study through age 27. Ypsilanti, MI: High/Scope Press. See also D. R. Powell
(Ed.). (1988). Parent education as early childhood intervention: Emerging directions in theory, research,
and practice (pp. 79-104). Norwood, NJ: Ablex Publishing. For preschool classrooms, the staff-to-child ratio
should be not more than 10 children per teacher. In early learning settings for infants, the child-staff ratio
should be not more than three children per teacher, and for toddlers, not more than four children per teacher.
American Academy of Pediatrics, American Public Health Association, and National Resource Center for
Health and Safety in Child Care and Early Education (2002). Caring for Our Children: National Health and
Safety Performance Standards: Guidelines for Out-of-Home Child Care Programs, 2nd edition. Elk Grove
Village, IL: American Academy of Pediatrics and Washington, DC: American Public Health Association;
Barnett, W.S., Epstein, D.J., Friedman, D.J., Boyd, J.S., & Hustedt, J.T. (2008). The state of preschool 2008:
State preschool yearbook. New Brunswick, NJ: National Institute of Early Education Research; Dunkle,
M., & Vismara, L. (2004). Developmental checkups: They’re good, they’re cheap and they’re almost never
done. What’s wrong with this picture? Retrieved on February 25, 2010 from http://www.child-autism-parent-
cafe.com/child-development.html
5 AmericA’s edge commissioned an analysis of the linkage effects of early care and education. Analyses
were conducted using fully disaggregated models and using models aggregated into nine very broad sectors.
This analysis calculated the Type SAM (Social Accounting Matrix) Output multipliers for all nine major
aggregated economic sectors in the state using IMPLAN models. The analysis was conducted on 2008 data,
the most recently available data set for Illinois. The early care and education sector’s Type SAM output
multiplier for Illinois was $1.94. See Table 1 for Type SAM output multipliers of each sector analyzed. See
Appendix A, Economic Multipliers Analysis, for more details on analysis and methods.
6 AmericA’s edge estimates that $1.2 billion in new early care and education investments are needed in
Illinois to serve an additional 150,000 young children from birth through age four currently unserved by these
programs. See Appendix C for calculations of new early care and education investments in Illinois.
7 The services sector includes professional, business, information, entertainment, rental, and utility services.
It represented 25 percent of the new spending generated outside the early care and education sector. The
$275 million figure was calculated by taking 25 percent of $1.1 billion, which is the amount of the total $2.3
billion in new spending that is generated outside the early care and education sector (the first $1.2 billion
dollars invested is spent directly, in the early care and education sector).
8 The real estate and construction sectors represented 18 percent of the new spending generated outside the
early care and education sector. The nearly $200 million figure was calculated by taking 18 percent of $1.1
billion, which is the amount of the total $2.3 billion in new spending that is generated outside the early care
and education sector. These numbers illustrate how far the nearly $200 million figure would go in terms of
average mortgage payments. Housing sector economic demand included real estate and construction industry
spending due to early care and education sector spending.
9 The insurance and finance sectors represented 19 percent of the new spending generated outside the early
care and education sector. The over $200 million figure was calculated by taking 19 percent of $1.1 billion,
which is the amount of the total $2.3 billion in new spending that is generated outside the early care and
education sector.
10 The retail and wholesale trade sectors represented 13 percent of the new spending generated outside the
early care and education sector. The over $140 million figure was calculated by taking 13 percent of $1.1
billion, which is the amount of the total $2.3 billion in new spending that is generated outside the early care
and education sector.
11 Based on input-output analysis using fully disaggregated IMPLAN models with 440 distinct economic
sectors in the 2008 Illinois model. See Appendix A, Economic Multipliers Analysis, for more details on
analysis and methods. Bureau of Labor Statistics. (2010). Consumer Expenditure Survey. Washington, DC:
U.S. Department of Labor. Retrieved on April 15, 2010 from http://www.bls.gov/cex/. The national figure for
yearly out-of-home food spending is adjusted to reflect lower expenses in the Midwest, using other data from
the same Census database.
12 Based on input-output analysis using fully disaggregated IMPLAN models with 440 distinct economic
sectors in the 2008 Illinois model. See Appendix A, Economic Multipliers Analysis, for more details on
analysis and methods. Bureau of Labor Statistics. (2010). Consumer Expenditure Survey. Washington, DC:
U.S. Department of Labor. Retrieved on April 15, 2010 from http://www.bls.gov/cex/. The national figure for
spending on electricity is adjusted to reflect lower expenses in the Midwest, using other data from the same
Census database.
13 Based on input-output analysis using fully disaggregated IMPLAN models with 440 distinct economic
sectors in the 2008 Illinois model. See Appendix A, Economic Multipliers Analysis, for more details on
analysis and methods. Bureau of Labor Statistics. (2010). Consumer Expenditure Survey. Washington, DC:
U.S. Department of Labor. Retrieved on April 15, 2010 from http://www.bls.gov/cex/. The national figure for
in-home food spending is adjusted to reflect lower expenses in the Midwest, using other data from the same
Census database.
14 Based on input-output analysis using fully disaggregated IMPLAN models with 440 distinct economic
sectors in the 2008 Illinois model. See Appendix A, Economic Multipliers Analysis, for more details on
analysis and methods. Bureau of Labor Statistics. (2010). Consumer Expenditure Survey. Washington, DC:
U.S. Department of Labor. Retrieved on April 15, 2010 from http://www.bls.gov/cex/. The national figure for
spending on clothing and accessories is adjusted to reflect lower expenses in the Midwest, using other data
from the same Census database.
15 Based on input-output analysis using fully disaggregated IMPLAN models with 440 distinct economic
sectors in the 2008 Illinois model. See Appendix A, Economic Multipliers Analysis, for more details on
analysis and methods. The estimate cost of a 2009 Ford Focus, including taxes and fees, financing, and
insurance is $18,343. Automotive.com. (2010). 2009 Ford Focus ownership costs. Bonita Springs, FL:
Source Interlink Media. Retrieved on April 23, 2010 from http://www.automotive.com/2009/12/ford/focus/
ownership-costs/index.html
16 Bureau of Labor Statistics. (2008). Child day care services. Career Guide To Industries. Washington,
DC: U.S. Department of Labor. Retrieved on April 15, 2010 from http://www.bls.gov/oco/cg/cgs032.
htm#earnings
17 AmericA’s edge commissioned an analysis of the linkage effects of early care and education using
IMPLAN models. Analyses were conducted using fully disaggregated models and using models aggregated
into nine very broad sectors. The analysis was conducted on 2008 data, the most recently available data set
for Illinois. The early care and education sector’s Type SAM output multiplier for Illinois was $1.94. See
Appendix A, Economic Multipliers Analysis, for more details on analysis and methods.
18 The linkage effects of the early care and education sector were analyzed using IMPLAN models for
Illinois using 2008 data, the most recently available for the state. The Type SAM employment multiplier
for early care and education for Illinois was 1.27. This means that for every one new job in the ECE sector,
an additional 0.27 jobs are created outside that sector in other parts of the state economy. Multiplying both
numbers by four yields this reformulation of the same finding: for every 4 jobs created in the ECE sector,
1.08 jobs are created outside the sector.
19 The $1.2 billion investment in early care and education programs was applied to the 2008 Illinois em-
ployment multiplier findings for the ECE sector (with a Type SAM multiplier of 1.27 using IMPLAN), and
yielded 34,560 total jobs, or approximately 34,000 jobs), with 7,440 of these jobs (or approximately 7,000
jobs) being in other economic sectors outside early care and education. See Appendix A, Economic Multipli-
ers Analysis, for more details on analysis and methods.
20 Shellenback, K. (2004). Child care and parent productivity: Making the business case. Linking Economic
Development & Child Care Research Project. Ithaca, NY: Cornell University, Cornell Cooperative Extension.
Retrieved on February 26, 2010 from http://government.cce.cornell.edu/doc/pdf/ChildCareParentProductiv-
ity.pdf; Alliance for Excellent Education. (2006). Paying double: Inadequate high schools and community
college remediation. Washington, DC: Author. Retrieved on February 25, 2010 from http://www.all4ed.org/
files/remediation.pdf
21 Shellenback, K. (2004). Child care and parent productivity: Making the business case. Linking Economic
Development & Child Care Research Project. Ithaca, NY: Cornell University, Cornell Cooperative Extension.
Retrieved on February 26, 2010 from http://government.cce.cornell.edu/doc/pdf/ChildCareParentProductiv-
ity.pdf
Endnotes
11
Strengthening Illinois Businesses through Investments in Early Care and Education
22 Although estimates of the number of children participating in regulated early learning programs vary, a
conservative estimate suggests that about 500,000 young children under age 5 in Illinois were not in regulated
early learning programs. This estimate was calculated by subtracting the total number of young children in
early learning programs, 402,218 children, (using the most generous estimate totaling up the number of chil-
dren from each type of early learning program), from the Census-based population estimates of the number
of children under age 5 in Illinois (898,277 children), yielding 496,059, or approximately 500,000 children.
The types of early learning programs included in this estimate are: preK, Head Start, private preschool, child
care centers and family child care homes, and also those family, friend and neighbor care arrangements for
which families receive child care assistance. Note that this estimate was not adjusted for the likelihood that
some children participate in more than one program and thus are double-counted. If we used a more conser-
vative estimate which would adjust for the potential for double-counting of some children who participate
in more than one early learning program, that more conservative estimate of 319,823 young children served
by regulated early learning programs would yield an even higher estimate of the number of young children
unserved by regulated early learning programs: approximately 580,000 children. Additional children partici-
pate in family friend and neighbor care arrangements, but the informal, unregulated nature of these early care
arrangements makes them very difficult to document, and they are not included in this count, except for those
family, friend or neighbor care arrangements for which families are receiving child care assistance. (See
endnote 6 for a fuller explanation of the number of children served in each type of early learning program in
Illinois.) So, in conclusion, while it is likely that the actual figure is even higher, in order to be conservative,
we estimate for this report that the about 500,000 young children under age 5 in Illinois were not in regulated
early learning programs.
Illinois Early Childhood Asset Map. (2010). Population (2005 estimates). Champaign, IL: University of
Illinois. Retrieved on April 26, 2010 from http://iecam.crc.uiuc.edu/.
23 The additional lost spending to local businesses was calculated by applying the 1.94 Type SAM output
multiplier for the early care and education sector in Illinois to a $100 million reduction in spending, which
yields an additional $94 million in lost spending which would have been generated had the $100 million been
spent on early care and education.
24 Alliance for Excellent Education. (2006). Paying double: Inadequate high schools and community college
remediation. Washington, D.C.: Author. Retrieved on February 25, 2010 from http://www.all4ed.org/files/
remediation.pdf
25 Casner-Lotto, K., & Benner, M.W. (2006). Are they really ready to work? Employers’ perspectives on the
basic knowledge and applied skills of new entrants to the 21st century U.S. workforce. Retrieved on February
26, 2010 from
http://www.21stcenturyskills.org/documents/FINAL_REPORT_PDF09-29-06.pdf
26 Casner-Lotto, K., & Benner, M.W. (2006). Are they really ready to work? Employers’ perspectives on the
basic knowledge and applied skills of new entrants to the 21st century U.S. workforce. Retrieved on February
26, 2010 from
http://www.21stcenturyskills.org/documents/FINAL_REPORT_PDF09-29-06.pdf
27 Casner-Lotto, K., & Benner, M.W. (2006). Are they really ready to work? Employers’ perspectives on the
basic knowledge and applied skills of new entrants to the 21st century U.S. workforce. Retrieved on February
26, 2010 from
http://www.21stcenturyskills.org/documents/FINAL_REPORT_PDF09-29-06.pdf
28 Gormley, W.T., & Phillips, D. (2003). The effects of universal pre-k in Oklahoma: Research highlights
and policy implications. Washington, DC: Georgetown University, Center for Research on Children in
the United States. Retrieved on February 25, 2010 from http://www.crocus.georgetown.edu/working.
paper.2.pdf; Reynolds, A. J., Temple, J. A., Robertson, D. L., & Mann, E. A. (2001). Long-term effects of
an early childhood intervention on educational achievement and juvenile arrest. Journal of the American
Medical Association, 285(12), 2339-2380.; Schweinhart, L.J., Montie, J., Xiang, Z.,Barnett, W.S., Belfield,
C.R., & Nores, M. (2005). Lifetime effects: The High Scope/Perry Preschool Study through age 40. Ypsilanti,
MI: High/Scope Press.
29 Reynolds, A. J., Temple, J. A., Robertson, D. L., & Mann, E. A. (2001). Long-term effects of an early
childhood intervention on educational achievement and juvenile arrest. Journal of the American Medical
Association, 285(12), 2339-2380. Schweinhart, L.J., Montie, J., Xiang, Z., Barnett, W.S., Belfield, C.R., &
Nores, M. (2005). Lifetime effects: The High Scope/Perry Preschool Study through age 40. Ypsilanti, MI:
High/Scope Press.
30 Reynolds, A. J., Temple, J. A., Robertson, D. L., & Mann, E. A. (2001). Long-term effects of an early
childhood intervention on educational achievement and juvenile arrest. Journal of the American Medical
Association, 285(12), 2339 – 2380; Barnett, W.S., & Masse, L.N. (2007). Comparative benefit-cost analysis
of the Abecedarian program and its policy implications. Economics of Education Review, 26, 113 – 125
31 Schweinhart, L.J., Montie, J., Xiang, Z., Barnett, W.S., Belfield, C.R., & Nores, M. (2005). Lifetime
effects: The High Scope/Perry Preschool Study through age 40. Ypsilanti, MI: High/Scope Press; Barnett,
W.S., & Masse, L.N. (2007). Comparative benefit-cost analysis of the Abecedarian program and its policy
implications. Economics of Education Review, 26, 113 – 125 ; Reynolds, A. J., Temple, J. A., Robertson, D.
L., & Mann, E. A. (2001). Long-term effects of an early childhood intervention on educational achievement
and juvenile arrest. Journal of the American Medical Association, 285(12), 2339-2380.
32 Schweinhart, L.J., Montie, J., Xiang, Z.,Barnett, W.S., Belfield, C.R., & Nores, M. (2005). Lifetime ef-
fects: The High Scope/Perry Preschool Study through age 40. Ypsilanti, MI: High/Scope Press; Reynolds, A.
J., Temple, J. A., Ou, S., Robertson, D. L., Mersky, J. P., Topitzes, J. W., and Niles, M. D. (2007). Effects of
a school-based, early childhood intervention on adult health and well-being: A 19-year follow-up of low-
income families. Archives of Pediatrics & Adolescent Medicine, 161(8), 730 – 739.
33 Schweinhart, L.J., Montie, J., Xiang, Z., Barnett, W.S., Belfield, C.R., & Nores, M. (2005). Lifetime
effects: The High Scope/Perry Preschool Study through age 40. Ypsilanti, MI: High/Scope Press; Reynolds,
A. J., Temple, J. A., Ou, S., Robertson, D. L., Mersky, J. P., Topitzes, J. W., and Niles, M. D. (2007). Ef-
fects of a school-based, early childhood intervention on adult health and well-being: A 19-year follow-up of
low-income families. Archives of Pediatrics & Adolescent Medicine, 161(8), 730 – 739; Schweinhart, L. J.,
Barnes, H. V., & Weikart, D. P. (1993). Significant benefits: The High/Scope Perry Pre-kindergarten study
through age 27. Ypsilanti, MI: High/Scope Press
34 Reynolds, A. J., Temple, J. A., Ou, S., Robertson, D. L., Mersky, J. P., Topitzes, J. W., and Niles, M.
D. (2007). Effects of a school-based, early childhood intervention on adult health and well-being: A 19-
year follow-up of low-income families. Archives of Pediatrics & Adolescent Medicine, 161(8), 730 – 739;
Schweinhart, L.J., Montie, J., Xiang, Z., Barnett, W.S., Belfield, C.R., & Nores, M. (2005). Lifetime effects:
The High Scope/Perry Preschool Study through age 40. Ypsilanti, MI: High/Scope Press.; Schweinhart, L.
J., Barnes, H. V., & Weikart, D. P. (1993). Significant benefits: The High/Scope Perry Pre-kindergarten study
through age 27. Ypsilanti, MI: High/Scope Press
35 Schweinhart, L.J., Montie, J., Xiang, Z., Barnett, W.S., Belfield, C.R., & Nores, M. (2005). Lifetime ef-
fects: The High Scope/Perry Preschool Study through age 40. Ypsilanti, MI: High/Scope Press.
36 Schweinhart, L.J., Montie, J., Xiang, Z.,Barnett, W.S., Belfield, C.R., & Nores, M. (2005). Lifetime ef-
fects: The High Scope/Perry Preschool Study through age 40. Ypsilanti, MI: High/Scope Press.
37 Although estimates of the number of children participating in regulated early learning programs vary, a
conservative estimate suggests that about 500,000 young children under age 5 in Illinois were not in regulated
early learning programs. This estimate was calculated by subtracting the total number of young children in
early learning programs, 402,218 children, (using the most generous estimate totaling up the number of chil-
dren from each type of early learning program), from the Census-based population estimates of the number
of children under age 5 in Illinois (898,277 children), yielding 496,059, or approximately 500,000 children.
The types of early learning programs included in this estimate are: preK, Head Start, private preschool, child
care centers and family child care homes, and also those family, friend and neighbor care arrangements for
which families receive child care assistance. Note that this estimate was not adjusted for the likelihood that
some children participate in more than one program and thus are double-counted. If we used a more conser-
vative estimate which would adjust for the potential for double-counting of some children who participate
in more than one early learning program, that more conservative estimate of 319,823 young children served
by regulated early learning programs would yield an even higher estimate of the number of young children
unserved by regulated early learning programs: approximately 580,000 children. Additional children partici-
pate in family friend and neighbor care arrangements, but the informal, unregulated nature of these early care
arrangements makes them very difficult to document, and they are not included in this count, except for those
family, friend or neighbor care arrangements for which families are receiving child care assistance. (See
endnote 6 for a fuller explanation of the number of children served in each type of early learning program in
Illinois.) So, in conclusion, while it is likely that the actual figure is even higher, in order to be conservative,
we estimate for this report that the about 500,000 young children under age 5 in Illinois were not in regulated
early learning programs. Illinois Early Childhood Asset Map. (2010). Population (2005 estimates). Cham-
paign, IL: University of Illinois. Retrieved on April 26, 2010 from http://iecam.crc.uiuc.edu/.
38 Alexander, D., Cahn, S., Slaughter, S., & Traill, S. (2005). The economic impact of the early care and
education industry in Illinois. Chicago: Chicago Metropolis 2020. Retrieved April 15, 2010 from
http://www.chicagometropolis2020.org/documents/FullEISStudy.pdf
39 Alexander, D., Cahn, S., Slaughter, S., & Traill, S. (2005). The economic impact of the early care and
education industry in Illinois. Chicago: Chicago Metropolis 2020. Retrieved April 15, 2010 from
http://www.chicagometropolis2020.org/documents/FullEISStudy.pdf
40 Alexander, D., Cahn, S., Slaughter, S., & Traill, S. (2005). The economic impact of the early care and
education industry in Illinois. Chicago: Chicago Metropolis 2020. Retrieved April 15, 2010 from
http://www.chicagometropolis2020.org/documents/FullEISStudy.pdf
41 Bureau of Labor Statistics. (2004). Geographic profile of employment and unemployment, 2002. Wash-
ington, D.C.: U.S. Department of Labor. Retrieved on April 26, 2010 from http://www.bls.gov/opub/gp/pdf/
gp02full.pdf; Alexander, D., Cahn, S., Slaughter, S., & Traill, S. (2005). The economic impact of the
early care and education industry in Illinois. Chicago: Chicago Metropolis 2020. Retrieved April 15, 2010
from http://www.chicagometropolis2020.org/documents/FullEISStudy.pdf

12
Strengthening Illinois Businesses through Investments in Early Care and Education
Susan L. Gates National Director
(202) 408-9284 [email protected]
NATIONAL OFFICE 1212 New York Ave., NWWashington, D.C. 20005
Erica CribbsMembership Associate(202) 408-9282 x107
MichiganK.P. Pelleran, State DirectorBoji Tower, Suite 1220124 W. Allegan St.Lansing, MI 48933(517) [email protected]
MontanaJames Fleischmann, State Director738 8th AvenueHelena, MT 59601(406) [email protected]
New YorkLori King-Kocsis, State Director3 Columbia Pl, Floor 2Albany, NY 12207(518) [email protected]
STATE OFFICES
Strengthening Businesses Through Proven Investments in Kids
CaliforniaJennifer Ortega, State Director211 Sutter Street, Suite, 401San Francisco, CA 94108(415) [email protected]
IllinoisAlena Chaps70 E. Lake Street., Suite 720Chicago, IL 60601(312) [email protected]
MaineKim Gore, State Director4 Jersey CircleTopsham, ME 04086(207) [email protected]

1212 New York Avenue, NW, Suite 300 – Washington, DC 20005 Tel: 202-408-9284 Fax: 202-776-0110 – www.AmericasEdge.org
Strengthening Businesses Through Proven Investments in Kids