
Strengthening European Food Chain Sustainability by ... · Barilla, Barilla Group (Italy) 25....
77
Strengthening European Food Chain Sustainability by Quality and Procurement Policy Deliverable 4.1: REPORT ON THE DETERMINANTS OF FARMERS’ ENGAGEMENT IN FOOD QUALITY SCHEMES August 2017 Contract number 678024 Project acronym Strength2Food Dissemination level Public Nature R (Report) Responsible Partner(s) WU – CREA – Coldiretti Author(s) Luca Cesaro, Liesbeth Dries, Hermen Luchtenbelt, Sonia Marongiu, Jack Peerlings, Leon van de Pol Keywords FQS, PDO, PGI, Organic, EU, Italy This project has received funding from the European Union’s Horizon 2020 research and innovation programme under grant agreement No 678024.
Transcript of Strengthening European Food Chain Sustainability by ... · Barilla, Barilla Group (Italy) 25....

Strengthening European Food Chain Sustainability by Quality and Procurement Policy
Deliverable 4.1:
REPORT ON THE DETERMINANTS OF FARMERS’ ENGAGEMENT IN FOOD
QUALITY SCHEMES
August 2017
Contract number 678024
Project acronym Strength2Food
Dissemination level Public
Nature R (Report)
Responsible Partner(s) WU – CREA – Coldiretti
Author(s) Luca Cesaro, Liesbeth Dries, Hermen Luchtenbelt, Sonia Marongiu, Jack Peerlings, Leon van de Pol
Keywords FQS, PDO, PGI, Organic, EU, Italy
This project has received funding from the European Union’s Horizon 2020 research and innovation programme under grant agreement No 678024.

Strength2Food D4.1 – Determinants of farmers’ engagement in FQS
2 | P a g e
Academic Partners
1. UNEW, Newcastle University (United Kingdom) 2. UNIPR, University of Parma (Italy)
3. UNED, University of Edinburgh (United Kingdom) 4. WU, Wageningen University (Netherlands)
5. AUTH, Aristotle University of Thessaloniki (Greece) 6. INRA, National Institute for Agricultural Research (France)
7. BEL, University of Belgrade (Serbia) 8. UBO, University of Bonn (Germany)
9. HiOA, National Institute for Consumer Research (Oslo and Akershus University College) (Norway)
10. ZAG, University of Zagreb (Croatia) 11. CREDA, Centre for Agro-Food Economy & Development (Catalonia Polytechnic
University) (Spain) 12. UMIL, University of Milan (Italy)
13. SGGW, Warsaw University of Life Sciences (Poland) 14. KU, Kasetsart University (Thailand)
15. UEH, University of Economics Ho Chi Minh City (Vietnam)
Dedicated Communication and Training Partners
16. EUFIC, European Food Information Council AISBL (Belgium) 17. BSN, Balkan Security Network (Serbia)
18. TOPCL, Top Class Centre for Foreign Languages (Serbia)
Stakeholder Partners
19. Coldiretti, Coldiretti (Italy) 20. ECO-SEN, ECO-SENSUS Research and Communication Non-profit Ltd (Hungary)
21. GIJHARS, Quality Inspection of Agriculture and Food (Poland) 22. FOODNAT, Food Nation CIC (United Kingdom)
23. CREA, Council for Agricultural Research and Economics (Italy) 24. Barilla, Barilla Group (Italy)
25. MPNTR, Ministry of Education, Science and Technological Development (Serbia) 26. Konzum, Konzum (Croatia)
27. Arilje, Municipality of Arilje (Serbia) 28. CPR, Consortium of Parmigiano-Reggiano (Italy)
29. ECOZEPT, ECOZEPT (Germany) 30. IMPMENT, Impact Measurement Ltd (United Kingdom)

Strength2Food D4.1 – Determinants of farmers’ engagement in FQS
3 | P a g e
TABLE OF CONTENTS
EXECUTIVE SUMMARY ....................................................................................................... 5
LIST OF TABLES ................................................................................................................. 7
LIST OF FIGURES ................................................................................................................ 8
LIST OF ABBREVIATIONS AND ACRONYMS .......................................................................... 9
1. EXPLAINING THE SPATIAL DISTRIBUTION IN THE UPTAKE OF PDO AND PGI IN EUROPE –
LEON VAN DE POL, JACK PEERLINGS & LIESBETH DRIES ............................................ 10
1.1. Introduction ......................................................................................................... 10
1.2. The EU food quality schemes: the PDO, PGI and TSG label.................................. 11
1.2.1. The different labels in Regulation 1151/2012 ................................................. 11
1.2.2. The registration and monitoring process......................................................... 12
1.2.3. The objectives of the quality scheme.............................................................. 13
1.2.4. Drawbacks of the scheme .............................................................................. 17
1.2.5. Use of the PDO/PGI label per member state................................................... 19
1.3. Engagement in PDO/PGI labels – a regional analysis ............................................ 21
1.3.1. What explains the uptake of the PDO/PGI labels? .......................................... 21
1.3.2. Data.............................................................................................................. 23
1.3.3. Data description ............................................................................................ 24
1.3.4. Empirical model and results .......................................................................... 26
1.4. Conclusions and discussion .................................................................................. 30
REFERENCES .................................................................................................................... 32
ANNEX A.1 OVERVIEW OF VARIABLES .............................................................................. 36
2. THE DEVELOPMENT OF FOOD QUALITY SCHEMES IN EUROPE – HERMEN LUCHTENBELT ,
JACK PEERLINGS & LIESBETH DRIES .......................................................................... 38
2.1. Introduction ......................................................................................................... 38
2.2. Theoretical framework ......................................................................................... 38
2.2.1. Diffusion of innovation ................................................................................. 38
2.2.2. The five forces model.................................................................................... 39
2.3. Change in uptake of PDO/PGI schemes in the EU: a regional analysis ................... 43
2.3.1. Descriptive statistics ..................................................................................... 43
2.3.2. Independent variables.................................................................................... 43
2.3.3. Empirical model............................................................................................ 47
2.3.4. Results.......................................................................................................... 49
2.4. Discussion & conclusions..................................................................................... 51

Strength2Food D4.1 – Determinants of farmers’ engagement in FQS
4 | P a g e
REFERENCES .................................................................................................................... 53
ANNEX A.2A: TOBIT OUTPUT AND POST-ESTIMATION STATISTICS FOR MODEL 1 ................ 55
ANNEX A.2B: TOBIT OUTPUT AND POST-ESTIMATION STATISTICS FOR MODEL 2 ................ 56
ANNEX A.2C: TOBIT OUTPUT AND POST-ESTIMATION STATISTICS FOR MODEL 3 ................ 57
ANNEX A.2D: TOBIT OUTPUT AND POST-ESTIMATION STATISTICS FOR MODEL 4 ................ 58
3. DETERMINANTS OF FARMERS’ PARTICIPATION IN FOOD QUALITY SCHEMES IN ITALY: A
FARM-LEVEL ANALYSIS BASED ON FADN DATA – SONIA MARONGIU & LUCA CESARO .. 59
3.1. Introduction ......................................................................................................... 59
3.2. Food Quality Systems in Italy: the geographical indication system and organic farming 60
3.2.1. Geographical Indications in Italy: PDO, PGI, TSG ......................................... 60
3.2.2. Organic farming in Italy ................................................................................ 64
3.3. Characteristics of the FADN dataset ..................................................................... 66
3.4. Results of the econometric model ......................................................................... 69
3.4.1. Determinants of farmers participation in PDO and PGI scheme ...................... 69
3.4.2. Determinants of farmers participation in an organic farming scheme............... 72
3.5. Summary of results .............................................................................................. 75
REFERENCES .................................................................................................................... 76

Strength2Food D4.1 – Determinants of farmers’ engagement in FQS
5 | P a g e
EXECUTIVE SUMMARY
Regulation 1151/2012 – the basis for the current EU Food Quality Schemes policy –
provides a framework for the protection of PDO, PGI and TSG in the EU as tools to preserve food quality and to better market products by highlighting the link between quality and origin.
A main motivation for the EU FQS is to contribute to rural development in remote, marginalized and mountainous areas, where geographical constraints increase production costs and lower competitiveness of products on the basis of price.
The literature review on the use and effects of PDO/PGI/TSG schemes shows that: (i) the direction of causality between rural development and FQS registrations is unclear; (ii) some countries use other tools to protect food quality as a consequence of historical practices; (iii)
some countries provide more support to use PDO and PGI than other countries; (iv) trust between producers to cooperate within a region can affect the willingness to participate in PDO and PGI; (v) consumer recognition of the labels is low; (vi) procedures for registration and monitoring, and support by national authorities differ between countries; (vii) EU FQS may be
beneficial to small-scale producers who have more difficulties to compete using a cost minimization strategy but smaller-scale producers can also be excluded from using the protected name depending on local circumstances.
Determinants of PDO/PGI uptake are grouped in five categories: (i) regional characteristics; (ii) institutional factors; (iii) economic factors; (iv) rural accessibility; (v) characteristics of the agricultural sector and farming.
An EU-wide analysis of PDO/PGI uptake and the determinants of this uptake across
NUTS-2 level regions was performed. The analysis shows that regions that are less productive
and are located in Less Favoured Areas make more use of PDO and PGI. Also, in more sparsely populated areas, more marginalized and remote areas, the use of the quality label is higher. Regions with more agricultural production also make more use of the label. The importance of food and how it is imbedded in certain countries increases the likelihood of using the quality label.
In regions where small-scale farming is predominant and farmers are not much market oriented,
the use of the label is low. In those regions where the label is not yet used, the number of tourists is low and the share of employment in the agricultural sector is large. The use of the label is also lower in case farmers use a large part of their production for own consumption.
The second chapter investigates the factors that cause the increase in uptake of PDOs and
PGIs over time in European NUTS-2 regions. A theoretical framework based on the diffusion of innovations and Porter’s five forces model is used as a starting point.
Regional variables are more important then socio-economic and institutional variables to explain changing uptake of PDO/PGI over time. Especially Eastern EU regions have
experienced the highest increase in the use of PDOs and PGIs over time . In 2007 the PDOs and PGIs were mainly located in the South, while there were only few PDOs and PGIs registered in the Eastern region. It seems that there is a transition going on from the Southern regions towards the Eastern regions of the European Union. This may represent a catching up
effect caused by the entrance of New Member States in the EU in 2004 and 2007.
Other regional variables that help to explain the increase of PDOs and PGIs are hectares of
mountainous area and the total number of PDOs and PGIs already present in a region. For the socio-economic and institutional variables, the most important variables are the number of years

Strength2Food D4.1 – Determinants of farmers’ engagement in FQS
6 | P a g e
of EU membership, education levels and to a lesser extent the employment levels in the agricultural sector.
The third chapter uses FADN data for Italy to investigate the determinants of farmers’ engagement in PDO/PGI and organic quality schemes .
The results show that PDO/PGI uptake is lower in less favoured areas, while organic farming is more prevalent in these areas. PDO/PGI as well as organic FQS uptake is higher in Italian hilly and mountainous areas. PDO/PGI schemes are mainly used by farms with permanent cultivations (e.g. grapes and apples). Organic farms, on the other hand, are more often
specialized in arable crops, permanent crops and livestock. Farmers in the south of Italy (including the islands) are less likely to engage in PDO/PGI, compared to central and northern Italy. Such a regional divide could not be observed for engagament in the organic scheme. With regard to farm size, it seems that in the Italian case, larger farms are more likely to engage in
FQS, both PDO/PGI and organic. The results highlight the importance of age and higher education as determinants of engagmenet in FQS. Looking at the external characteristics, the touristic infrastructures have a positive influence on the uptake of PDO/PGI, while they seem to be negatively related to the uptake of the organic scheme.

Strength2Food D4.1 – Determinants of farmers’ engagement in FQS
7 | P a g e
LIST OF TABLES
Table 1.1 Description of the PDO, PGI and TSG label ........................................................ 12
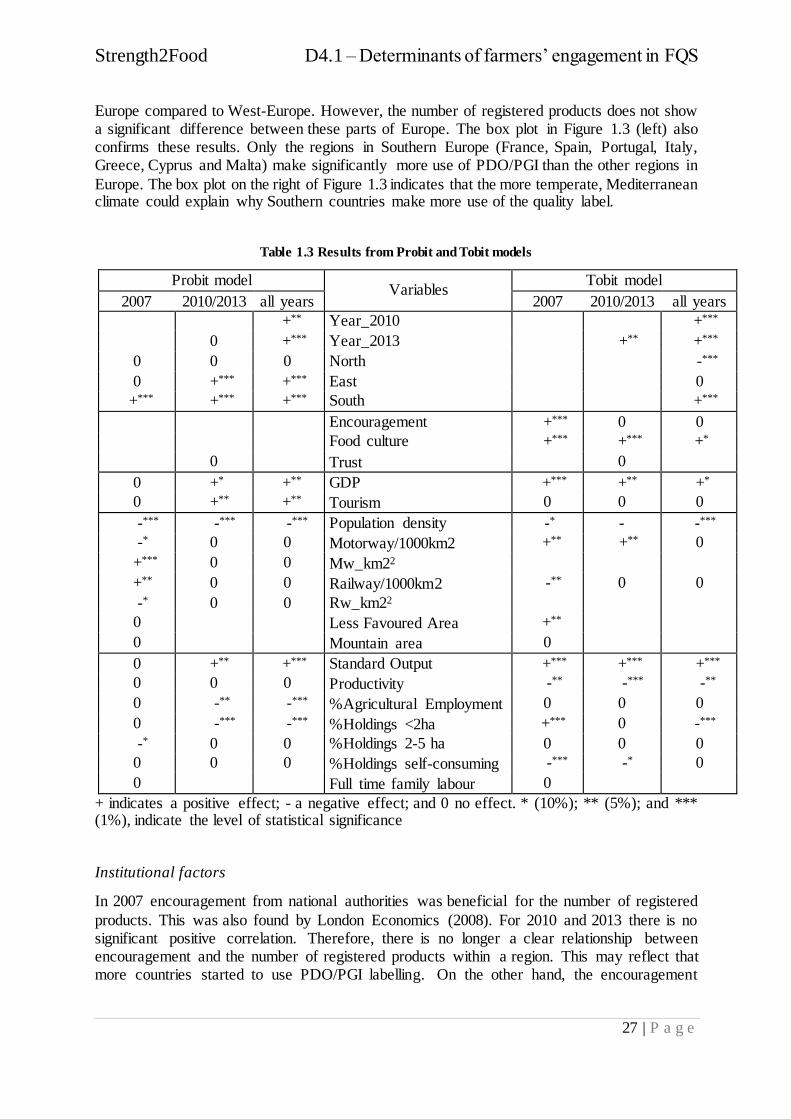
Table 1.2 Overview of the development of PDO, PGI and TSG over time and across countries ......................................................................................................................................... 19 Table 1.3 Results from Probit and Tobit models .................................................................. 27 Table 2.1: Descriptive statistics of the independent variables ............................................... 46
Table 2.2: Four different estimation models ........................................................................ 48 Table 2.3: Overview of coefficients for the four different models ........................................ 50 Table 3.1: Geographical Indication in Italy at 31 December 2015: a global framework ......... 60 Table 3.2: Number of Geographical Indications in Italy at 31 December 2015 ..................... 61
Table 3.3: PDO/PGI/TSG certified operators in Italy per Region, macro-area, altitude and gender (number and hectares)............................................................................................. 63 Table 3.4: Number of organic operators in Italy in 2015 ...................................................... 65 Table 3.5: Organic area in the Italian Regions ..................................................................... 66
Table 3.6: Description of the variables used in the LOGIT model ........................................ 69 Table 3.7: Estimates for the PDO and PGI participation scheme .......................................... 70 Table 3.8: Estimates of the determinants of participation in the organic farming scheme ...... 73
Strength2Food D4.1 – Determinants of farmers’ engagement in FQS
8 | P a g e
LIST OF FIGURES
Figure 1.1 Registered products per product category ........................................................... 21
Figure 1.2 PDO and PGI registrations per region, 2013 ....................................................... 24 Figure 1.3. Box plot of registered products per region (left) and registered products per biogeographical region (right) ............................................................................................ 28 Figure 2.1 The five forces model (Porter, 2008) .................................................................. 40
Figure 2.2 Change in PDO/PGI uptake between 2007-2010 (left) and 2010-2013 (right) ...... 43 Figure 2.3 The distribution of the change in PDO/PGI uptake between 2007 and 2010 (left) and 2010 and 2013 (right)......................................................................................................... 47
Strength2Food D4.1 – Determinants of farmers’ engagement in FQS
9 | P a g e
LIST OF ABBREVIATIONS AND ACRONYMS
DOOR – DATABASE OF ORIGIN & REGISTRATION
EC – EUROPEAN COMMISSION
EU – EUROPEAN UNION
FADN – FARM ACCOUNTANCY DATA NETWORK
FQS – FOOD QUALITY SCHEME
LFA – LESS-FAVOURED AREAS
NUTS – NOMENCLATURE OF TERRITORIAL UNITS FOR STATISTICS
PDO – PROTECTED DENOMINATION OF ORIGIN
PGI – PROTECTED GEOGRAPHICAL INDICATION
TSG – TRADITIONAL SPECIALITY GUARANTEED
Strength2Food D4.1 – Determinants of farmers’ engagement in FQS
10 | P a g e
D4.1 REPORT ON THE DETERMINANTS OF FARMERS’ ENGAGEMENT IN FOOD
QUALITY SCHEMES – Luca Cesaro, Liesbeth Dries, Hermen Luchtenbelt, Sonia Marongiu, Jack Peerlings, Leon van de Pol
1. EXPLAINING THE SPATIAL DISTRIBUTION IN THE UPTAKE OF PDO AND PGI IN EUROPE –
LEON VAN DE POL, JACK PEERLINGS & LIESBETH DRIES
1.1. Introduction
With average incomes increasing in Europe and more attention being paid to environmental and social characteristics of agricultural and food production, the demand for quality, fresh and local food in Europe is increasing (EC, 2017a). This has motivated several trends in agri-food supply chains. Over the past years there has been an increase in the number of local food
systems and short food supply chains in Europe (Kneafsey et al., 2013). To signal that products are produced locally and are of high quality, food quality schemes (FQS) can be used. According to JRC (2006), product differentiation is one of the main drivers to use FQS, as product differentiation has the potential to create value added for producers.
There are many FQS operating in the European Union (EU). Examples are the organic scheme; food quality assurance schemes; and geographical indications (see Becker, 2009). FQS indicate
that products or production processes fulfil specific quality requirements (JRC, 2006). These schemes are useful because consumers are unable to detect these requirements even after purchase (Darby & Karni, 1973). The EU promotes the use of FQS because they strengthen the relationship between different actors in the supply chain; improve the traceability of food
products along the supply chain; and meet the demand of consumers for products that are safe and of high quality (JRC, 2006).
In 1992, the EU food quality policy came into effect, which was based mainly on guaranteeing the origin of a food product to consumers and on protecting the name of products against fraudulent use. This scheme contains three labels: the Protected Designation of Origin (PDO); the Protected Geographical Indication (PGI); and the Traditional Speciality Guaranteed (TSG).
The first two labels can be used when there is a link between the product and the geographical area where the product is produced. The TSG label, on the other hand, requires the use of traditional ingredients or processes without a specific requirement on locality of production.
The spatial distribution in the uptake of PDO and PGI in Europe has so far not been explained on a regional level.1 London Economics (2008) is one of the exceptions that analysed the uptake of PDO and PGI products across Europe at the country level. Several case studies have also been carried out to explain why specific products are registered (London Economics, 2008;
JRC, 2006) or not (Marescotti, 2003). These case studies are either diachronic (looking at one product before and after its registration) or synchronic (comparing two similar products where only one has a label) (Barjolle et al., 2009). Other studies provide explanations why there are differences in the number of applications across the EU (Belletti & Marescotti, 2002;
Marescotti, 2003; Ackermann & Russo, 2010; Belletti and Marescotti, 2011; Santini et al., 2015). The aim of this chapter is to provide a quantitative analysis on the uptake of the PDO and PGI label in Europe on a regional level. So far, this has not been done and little attention is paid to explain what farm-related characteristics and regional determinants influence the uptake
of PDO and PGI. By explaining the spatial distribution of the PDO and PGI label at the regional
1 Because of our interest in the spatial distribution of FQS and regional factors explaining this, this chapter will focus mainly on PDO and PGI products and less on TSG, where the territorial dimension is not required.

Strength2Food D4.1 – Determinants of farmers’ engagement in FQS
11 | P a g e
level in Europe, we improve understanding on the effectiveness in the uptake of the quality scheme.
Specific attention will be paid to the role of regional characteristics for explaining differences in uptake. In particular, one of the main goals of the EU FQS has been to stimulate rural development in the most remote and marginalized areas in Europe (EC, 2012). However, some research suggests that the label is used more in developed rural areas (Belletti & Marescotti,
2002). This chapter will investigate if PDO/PGI uptake is lagging in remote and marginalized areas, and if this is the case, then what are potential barriers that can explain the limited use of FQS in these regions. A better understanding of the effectiveness in the uptake of PDO and PGI can assist policy makers in achieving the goals of the scheme.
Section two contains an introduction into the PDO/PGI/TSG labels in the EU. The focus is on the objectives of the scheme, its advantages and drawbacks. The section ends with an overview
of EU FQS adoption in different member states. The data, empirical analysis and results are described in section four. This section uses existing datasets (EC, 2017b; Charron et al, 2016; EUROSTAT, 2017) to analyse the engagement in FQS at the regional NUTS2 level for the PDO/PGI label. The dataset contains information for 270 different regions in the EU and covers
the years 2007 to 2013. Logit and Tobit models are used to quantify the effect of different determinants on PDO and PGI uptake. After discussing the results, section five ends with a conclusion and a discussion on the research limitations.
1.2. The EU food quality schemes: the PDO, PGI and TSG label
1.2.1. The different labels in Regulation 1151/2012
With the reform of the Common Agricultural Policy (CAP) in 1992, the orientation of the EU’s agricultural policy shifted from using instruments related to increasing food quantity, such as
price support to stimulating rural development and increasing food quality (Becker, 2009). One of the adopted regulations that aimed at increasing food quality was Regulation 2081/92 (EC, 1992) on the protection of geographical indications and designations of origin for agricultural products and foodstuffs. As the CAP developed over time, so did the regulation on the
protection of agricultural products. Regulation 510/2006 (EC, 2006) and subsequently Regulation 1151/2012 (EC, 2012) replaced the older version to improve the legislation. According to the EU this regulation provides a marketing tool to producers to highlight the qualities and traditions of their products and assure consumers that these are the genuine
products by providing legal protection from the misuse of the product name (EC, 2017c). In order to highlight the qualities and tradition of a registered product, three different logos are used to inform consumers about the origin of the product. To use one of these labels, the product has to fulfil specific requirements. The differences between the labels are summarized in Table 1.1.
There are two ways in which the link between the quality of a product and its geographical
origin is established (Arfini et al., 2011). In the first place, an area may have a specific microclimate that influences the quality of raw materials and, in combination with local skills on how to cope with the raw materials and environmental factors, results in a specific product quality. In France they use the word ‘terroir’ to indicate this interplay between microclimate,
environmental and human factors. In the second place, there is the knowledge dissemination of production methods within the local community that leads to a reputation.

Strength2Food D4.1 – Determinants of farmers’ engagement in FQS
12 | P a g e
The requirements in Table 2.1 illustrate that a product registered as a PDO2 is more strictly linked to its geographical origin than a PGI, and that a TSG is not linked to a specific geographical area. This means that it is possible to produce a TSG registered product outside of the historical production area as long as traditional production methods and recipes are followed.
Table 1.1 Description of the PDO, PGI and TSG label
Label PDO PGI TSG
Name Protected Designation of Origin
Protected Geographical Indication
Traditional Speciality Guaranteed
Logo
Place of origin A specific place, region or, in exceptional cases, a country.
Originating in a specific place, region or country.
Originating in a specific place, region or country.
Link between quality and place of origin (EC, 2012; Art 5 and Art 18).
Quality or characteristics are essentially or exclusively due to a particular geographical environment with its inherent natural and human factors.
Quality, reputation or other characteristics are essentially attributable to their geographical origin.
No direct l ink between quality and origin. The product results from a mode of production, processing or composition corresponding to traditional practices.
Production steps that have to take place in defined geographical
area
All production steps have to take place in the defined geographical area.
At least one of the production steps has to take place in the defined geographical area.
The production could take place everywhere as long as the product is produced according to traditional practices.
Examples (see the DOOR database for a
comprehensive overview)
Roquefort;
Beurre d’Ardenne;
Feta
Limone di Sorrento;
Scottish Wild Salmon;
Dortmunder Bier
Boerenkaas;
Jamón Serrano;
Pizza Napoletana
Source: Own compilation based on EC (2017c)
1.2.2. The registration and monitoring process
Art. 7 of Regulation 1151/2012 (EC, 2012) lists the specifications that are required to use one of the logos. To specify the product, the application has to include at least: the name that is protected; a description of the product including raw materials as well as physical, chemical
and organoleptic characteristics; a definition of the geographical area; evidence that the product originates in the defined geographical area; a description of the methods for obtaining the product; details that establish the link between the quality or characteristics of the product and the geographical environment; and finally the name and address of the applicant group and of
the authorities that verify compliance with the provision of the product specifications. This set
2 Art. 5.3 (EC, 2012) mentions that it is possible to register a product as a PDO when special conditions are defined for the raw materials (only for live animals, meat and milk) that originate from another geographical area.

Strength2Food D4.1 – Determinants of farmers’ engagement in FQS
13 | P a g e
of product specifications is also referred to as ‘the Code of Rules’. In order to apply, also a declaration by the member state is required that the application lodges by the group and meets the conditions in the regulation (EC, 2012; Art 8.2).
During the approval by the member state any natural or legal person within the member state is able to protest against the application based on different grounds. They have the opportunity to protest if they think the name is a generic term; if the registered name jeopardises the existence
of already existing products that have protection through a trademark or if the conditions set out in the product specification are incorrect (EC, 2012; Art. 10.1). After the approval by the national authority, the EC has six months to scrutinize whether all documents meet the requirements set out in the quality scheme. If the Commission approves the application, a
member state or any natural or legal person has the opportunity to protest within three months of the date of publication (EC, 2012; Art 49-50).
Once the product is granted the label, monitoring becomes important to prevent free riding behaviour and fraud. Monitoring the supply chain on whether producers and processors continue to comply with the Code of Rules (as established during application) and monitoring the market about any misuse of the name is key. Member states are obliged to designate
competent authorities to perform official controls to verify compliance with Regulation 1151/2012 on these points. National authorities can contribute to the costs for certification and controls (EC, 2012; Art. 37). This allows producers who have difficulties to bear part of the costs for controls and compliance to also participate in the FQS. The regulation only gives
guidelines and provides flexibility to the member states on how to operate the application and how to monitor any abuse of the protected name (Belletti et al., 2007).
1.2.3. The objectives of the quality scheme
Signal quality and tradition to consumers and use as a marketing tool for differentiation
One of the main objectives of the quality scheme is to provide sufficient information to consumers about the specific characteristics of the products to enable consumers to make more
informed choices when purchasing a product (EC, 2012).With consumers looking increasingly for quality, traditional products, a demand for agricultural products with a link to their geographical origin exists (EC, 2012). The problem for consumers is that they are not able to recognize all characteristics of a product by looking and tasting the product. This means that
using a PDO or PGI label helps to inform consumers that the product they buy is produced according to traditional standards which are not otherwise detectable.
The quality scheme also allows producers to better market their products. Using the PDO, PGI or TSG label allows actors in the supply chain to better identify, communicate and promote the characteristics and quality of their products to consumers (EC, 2012). In this way, producers can differentiate their product from other products due to its link to the geographical origin
(Belletti et al., 2007). Using the PDO and PGI label as a differentiation tool is especially interesting for producers in areas that are not able to compete with the mass-production of agro-industrial products (Ackermann & Russo, 2010). This differentiation is necessary to survive and compete with firms that apply a cost minimization strategy (Barjolle et al., 2005). Having
a clear marketing strategy in combination with the PDO or PGI can increase sales; create new distribution channels; and reduce uncertainty in price and volumes sold (Hajdukiewicz, 2014).
Ackermann & Russo (2010) investigated to what extent the PDO/PGI/TSG label serves as a marketing tool. According to these authors, the logo only functions to identify a product that has special characteristics that are linked to its origin to improve its marketing potential. Arfini et al. (2011) argue something similar. They mention that whether the product is successful in

Strength2Food D4.1 – Determinants of farmers’ engagement in FQS
14 | P a g e
increasing sales is mainly determined by the marketing strategy. Most PDOs and PGIs are sold close to the area of production where consumers are familiar and recognize the quality of the product. When the distance from the production area increases, the more important marketing strategy becomes to promote the traditions and quality of the product to convince consumers to buy the product and pay a price premium (Arfini et al., 2011).
Using a PDO is thus not a ‘miracle means in itself’ that creates market demand and adds quality
to a product (Ackermann & Russo, 2010). However, the same authors state that the quality scheme contributes to value-adding and helps to differentiate the product in the market, but it is not the main determinant of success. Also, to serve as a successful marketing tool, it is important that producers build a reputation that is recognized by consumers (JRC, 2006). This
can be achieved by investing in high quality standards and the execution of strict quality controls.
Differentiation allows producers to create a niche market (Vandecandelaere, 2015). In order to establish a niche market, a successful marketing strategy is important for producers to receive a fair reward for their product or the mode of production (EC, 2012). Receiving a price premium is necessary because costs of the (artisan) production methods to improve quality are in most cases higher than for more standardized production methods (Belletti et al., 2007).
When the PDO or PGI is perceived to be of high quality, consumers are willing to pay a higher
price compared to a similar non-registered product. In terms of achieving a higher income for producers there is no consistent evidence that shows that producing a PDO or PGI certified product results in a higher income in comparison to producing a similar non-labelled product. However, research by AND-International (2012) found that for agricultural products and
foodstuffs the price premium compared to non-labelled products is 1.55 Euros. Also, Areté (2013) performed multiple case studies by comparing PDOs with comparable non-registered products and found that PDOs receive a higher price.
It should be noted, however, that consumer price premiums do not automatically result in higher margins, because producers of PDO and PGI face on average higher production costs due to labour intensive production methods (Hajdukiewicz, 2014). Although member states and funds
from the EU are available to pay for certification and registration costs, a price premium therefore remains necessary to achieve improvements in income (Hajdukiewicz, 2014). Moreover, not only producers can benefit from the price premium, also the margins for processing companies, the packing industry and retailers can increase (JRC, 2006). However,
because of a lack of data it is hard to indicate which segments of the supply chain exactly benefit from PDO/PGI certification.
Legal protection of the product‘s name
Linked to this objective is to protect producers of origin labelled products form imitation and
fraudulent use. Producing products that are perceived by consumers as having a high quality and a positive reputation enables producers to receive a higher price for their products. This, in combination with the fact that we are dealing with credence goods because the origin of the product cannot be observed at the time of consumption, makes agricultural products with a link
to their geographical origin more sensitive to be imitated. Additionally, Belletti and Marescotti (2002) mention that origin labelled products are most often not known by the firm’s name but by the geographical name of the territory where the product is produced. This makes PDO and PGI labelled products even more prone to imitation. Regulation 1151/2012 prevents:
(a) any direct or indirect commercial use of a registered name; (b) any misuse, imitation or evocation by translating the protected name or products accompanied by an expression such as ‘style’, ‘type’, ‘method’ or
similar; (c) any false or misleading indication to the provenance, origin or nature of essential qualities of the

Strength2Food D4.1 – Determinants of farmers’ engagement in FQS
15 | P a g e
product on packaging and advertising material; and (d) any other practice liable to mislead consumers about the true origin of the product (EC, 2012; Art. 13).
In this way the EU enables actors in the supply chain to protect their intellectual property from fraudulent use and create fair competition between producers with PDO or PGI registered products. Under this regulation, member states have the authority to take juridical steps to prevent any misuse of PDO or PGI registered names.
The regulation can be said to be successful based on the high and increasing number of
registered products and the protection of registered names. In order to understand more deeply the strength of protection and the usefulness of the PDO and PGI scheme, it is important to know what alternative protective schemes there are. The main alternative for using PDO/PGI is a trademark. There are two types of trademarks, namely the collective and the certification trademark.
There are some important differences between GIs and these types of trademarks. In
comparison to trademarks, where a temporary monopoly is granted to patent holders to stimulate innovation, PDO/PGI does not protect an innovation (London Economics, 2008). What is protected is the reputation of a product that is associated with qualitative characteristics that are linked to the geographical production area to prevent free riding behaviour on reputation
(Giovannucci et al., 2009). Another difference is that registered PDOs and PGIs are non-transferable since they are publicly owned. On the other hand, trademarks are privately owned; are transferable and have to be renewed over time. Also, the costs to register a trademark are much higher compared to GIs (Ackermann & Russo, 2010).
A collective mark is more similar to PDO and PGI, however, it is privately owned and does not protect as strongly as a geographical indication does. The collective mark has a few advantages
over a GI, namely that holders of the collective mark are able to restrict the number of users. Also, they do not have to go through a lengthy process of registration. Finally, a collective trademark is useful when there is a low level of commitment from actors in the sector to register as a PDO or PGI (Ackermann & Russo, 2010). However, GIs are more beneficial in defining
more specifically the mode of production; in coordinating the production in the supply chain; and in allowing support by public authorities and co-financing options (Gangjee, 2015).
Whether to choose for collective trademarks or for GI is thus dependent on the objectives of the producers in terms of protection and the characteristics of the product. Also the focus of countries on how to improve food quality is different. It is important to take this into account when analysing the uptake of PDO and PGI because in some countries the use of trademarks is more common (Becker, 2009).
London Economics (2008) found that multiple PDOs and PGIs are combined with a trademark.
According to this research, PDOs and trademarks are complements. Where the PDO serves for a high level of protection and signals quality and reputation, the trademark is more used for marketing purposes and brand recognition. This, for example, holds for producers that produce a PDO or PGI under an umbrella brand which holds multiple products (e.g. Prosecco PDO).
Thus, the PDO signals quality while the umbrella brand is used for marketing purposes. The GI is thus effective to provide information about the origin of the product and production methods, and combined with a trademark, it forms a strong marketing tool to signal quality (London Economics, 2008).
Contribute to rural development
The final objective of the quality scheme is to contribute to and complement rural development policy especially in less-favoured areas (LFA), mountain areas and the most remote areas (EC,

Strength2Food D4.1 – Determinants of farmers’ engagement in FQS
16 | P a g e
2012). This quality scheme is particularly useful to contribute to rural development in these areas because the agricultural sector forms an important part of the economy here. Due to demographic, infrastructural and geographical ‘handicaps’ these areas have higher production costs compared to other areas. Examples of these handicaps are low temperatures that induce
shorter growth seasons, steep slopes that require more time to harvest, less fertile soils and poor accessibility which increases transportation costs (Santini et al., 2015). These handicaps make it more difficult to compete on price in marginalized areas and product differentiation becomes a better alternative to compete (Belletti & Marescotti, 2011).
The rural development policy of the EU is oriented to supporting the diversification of economic and social activities in rural areas to improve the standards and quality of living in
marginalized areas (Belletti & Marescotti, 2002). PDO and PGI can serve as a multifunctiona l tool that contributes to rural development by producing public goods and integrating all economic and social activities at a local level (Marescotti, 2003). By supporting farmers in marginalized areas to use local resources and production methods they contribute to the
conservation of resources, development of landscapes and to the preservation of biodiversity (Gangjee, 2015). Besides public goods, these quality schemes could also improve the income of farmers and help to retain rural populations due to the development of economic activities such as agro-tourism (Vandecandelaere, 2015) and create job opportunities and spillovers to other sectors (London Economics, 2008).
Indicating whether PDO or PGI lead to more rural development is very hard to measure because
of a lack of data. The fact that it is hard to separate the effect of the PDO or PGI from other factors that influence rural development makes it difficult to scrutinize this objective. Some authors argue that PDO and PGI could hinder rural development when the collective initiative is not well organized and structured (Belletti & Marescotti, 2002). This is possible because
external large companies could extract resources from the designated area for their own benefits when products have established a strong reputation (Belletti & Marescotti, 2002).3 Also excludability of producers can hinder rural development.
London Economics (2008) investigated the effect of PDO and PGI on rural development. They found that for different products the effect is not significant in the case where producers were already organized; when there was little competition from similar products; or if the production
is small scale. They also found cases with a significant effect. In these examples there was illegitimate use of the protected name or the PDO/PGI was linked to developing economic activities such as agro-tourism. In order to study the impact of GIs on rural development, London Economics (2008) performed eighteen case studies for different products across
Europe. This means that their findings are more qualitative, but it shows that the impact on rural development depends on the characteristics within the production area and the objective of the application group. Santini et al. (2015) add that the impact of a GI is larger when more local economic actors are involved in the production area and when agriculture and the food sector contribute to a large share of the regional economy.
A few authors question the direction of causality between the use of the quality scheme and
rural development (Montresor, 2002). This is the case for instance of Italy where most PDOs are found in the most developed rural regions (i.e. Tuscany, Veneto and Emilia Romagna). It is important to study this also for other member states and to show whether there are other factors
3 Producers of the ‘Cherry of Lari’ near Pisa (Italy), were afraid that registration of the cherries as a PDO would
result in this behaviour. They decided not to register their product to keep their name less known outside the local area (Marescotti, 2003).

Strength2Food D4.1 – Determinants of farmers’ engagement in FQS
17 | P a g e
that can explain these observations. Belletti and Marescotti (2002) also recognize the lack of scientific work on this relation.
1.2.4. Drawbacks of the scheme
Some authors have also investigated the drawbacks of Regulation 1151/2012. Such (perceived)
drawbacks can provide explanations of the limited uptake of PDO / PGI schemes by producers. They may also help to explain differences between regions.
Flaws in the application process
Under the current regulation there is no clear-cut definition that indicates whether a product can
be protected or not (Ackermann & Russo, 2010). This means that whether products are registered as a PDO or PGI is a matter of interpretation by the competent authority that decides whether a product should deserve protection. This causes a drawback in the regulation because there is the potential for collusion between governments and local producers (Bowen, 2010).
This is possible because public authorities in most countries initiate, facilitate and assess the application of producers. As a result, this creates a bias for applicants that aim for PDO or PGI registration (Gangjee, 2015). Broude (2005) for example, describes different cases where producers invented traditions in order to market their products better.
The application process allows groups to create a Code of Rules where the production standards and production area are determined in such a way as to illegitimately represent the interest of
the applicants instead of being beneficial for the entire supply chain (Gangjee, 2015). This is possible because there are a number of gaps in the registration process. Certification authorities are only able to scrutinize the materials that are delivered to them. Underlying reasons for application such as to restrict supply or to create a monopoly position are not mentioned in the
application forms. For example, the PDO ‘Opperdoezer Ronde’ (a Dutch potato variety) and Comté Cheese from France deliberately reduce supply to receive a higher price (JRC, 2006).
Differences in registration procedures
There are large differences between countries in the execution of the regulation (London
Economics, 2008; Gangjee, 2015). Irregular procedures result in situations where the application in one country is more strictly assessed than in another country. London Economics (2008) did research about the application, certification and monitoring authorities in different countries. They found that the certification bodies differ across nations. In Austria, Germany
and the Czech Republic it is not the government but an IP body that analyses the application of producers. Also the degree of state involvement differs between nations. Some member states provide assistance in the registration process while others do not. This could negatively affect the uptake in member states that do not provide help or promote the advantages of using
certification (Dimara et al, 2004). Also, there are differences in how often member states perform inspection controls to prevent any misuse of the PDO or PGI. Only in Luxembour g and Italy, public authorities employ agents that are specifically dedicated to look for any misuse in the market place (London Economics, 2008). According to Gangjee (2015), steps need to be taken to overcome these shortcomings.
Excludability of producers
The regulation may exclude (small) producers or processors from using the PDO or PGI label or from marketing the product under the protected name. To prevent this, it is important how
the Code of Rules is defined and this has consequences for how the production process should be monitored (Belletti et al., 2007). Conflicts can arise when the boundaries of the geographical area have to be defined; about the characteristics of the production techniques; and the quality
Strength2Food D4.1 – Determinants of farmers’ engagement in FQS
18 | P a g e
and characteristics of the product (Belletti & Marescotti, 2011). An arbitrary definition of the geographical area can result in producers who previously used the name of the registered product to no longer be able to use the protected name because they are located outside the defined area (Belletti & Marescotti, 2011). This conflict can exist when public authorities want
to improve rural development by using GI. In the eyes of the national authority it is beneficial to have a large area to enable more producers in the region to use the PDO or PGI. On the other hand, producers want to designate a smaller area to prevent other producers from legitimate ly producing their product (Marescotti, 2003).
Another reason for which (small) firms who want to participate in the quality scheme are excluded is because they are not able to make the necessary investments (Belletti et al., 2007).
Due to specified production techniques, firms could be unable to afford the transformation costs to adapt the firm structure or production process in such a way that they could meet the requirements that are specified in the Code of Rules. Examples are costs to run separate production lines, administrative costs and psychological costs.4
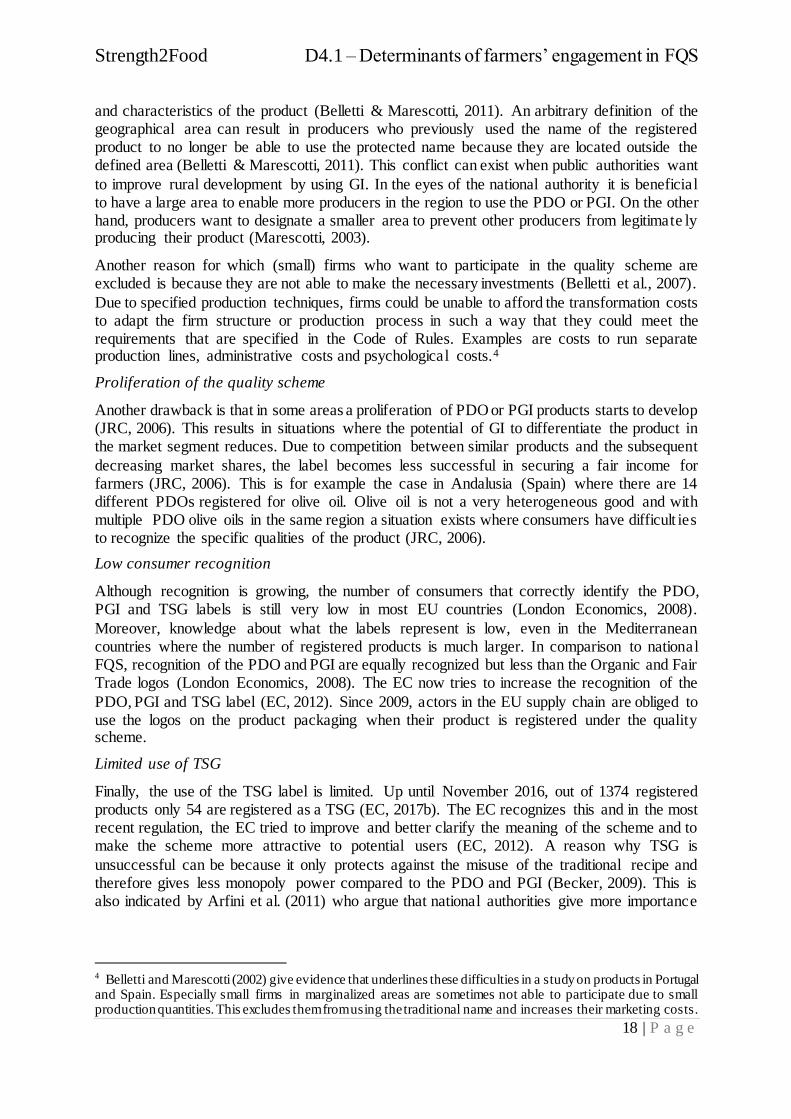
Proliferation of the quality scheme
Another drawback is that in some areas a proliferation of PDO or PGI products starts to develop (JRC, 2006). This results in situations where the potential of GI to differentiate the product in the market segment reduces. Due to competition between similar products and the subsequent
decreasing market shares, the label becomes less successful in securing a fair income for farmers (JRC, 2006). This is for example the case in Andalusia (Spain) where there are 14 different PDOs registered for olive oil. Olive oil is not a very heterogeneous good and with multiple PDO olive oils in the same region a situation exists where consumers have difficult ies to recognize the specific qualities of the product (JRC, 2006).
Low consumer recognition
Although recognition is growing, the number of consumers that correctly identify the PDO, PGI and TSG labels is still very low in most EU countries (London Economics, 2008).
Moreover, knowledge about what the labels represent is low, even in the Mediterranean countries where the number of registered products is much larger. In comparison to national FQS, recognition of the PDO and PGI are equally recognized but less than the Organic and Fair Trade logos (London Economics, 2008). The EC now tries to increase the recognition of the
PDO, PGI and TSG label (EC, 2012). Since 2009, actors in the EU supply chain are obliged to use the logos on the product packaging when their product is registered under the quality scheme.
Limited use of TSG
Finally, the use of the TSG label is limited. Up until November 2016, out of 1374 registered products only 54 are registered as a TSG (EC, 2017b). The EC recognizes this and in the most recent regulation, the EC tried to improve and better clarify the meaning of the scheme and to make the scheme more attractive to potential users (EC, 2012). A reason why TSG is
unsuccessful can be because it only protects against the misuse of the traditional recipe and therefore gives less monopoly power compared to the PDO and PGI (Becker, 2009). This is also indicated by Arfini et al. (2011) who argue that national authorities give more importance
4 Belletti and Marescotti (2002) give evidence that underlines these difficulties in a study on products in Portugal and Spain. Especially small firms in marginalized areas are sometimes not able to participate due to small production quantities. This excludes them from using the traditional name and increases their marketing costs.

Strength2Food D4.1 – Determinants of farmers’ engagement in FQS
19 | P a g e
to PDO and PGI because these can be copied less easily and because the TSG label is less recognized by consumers.
1.2.5. Use of the PDO/PGI label per member state
This section describes the actual uptake of the different labels, providing an overview of the development of the quality scheme over time and across countries, and across product
categories. The data is derived from the DOOR database (EC, 2017b). Table 1.2 summarizes these findings. The 28 EU member states are divided into different groups based on the total number of registered products, the number of registrations over time and location. The Mediterranean countries (Italy, France, Spain, Portugal and Greece) are characterized by a high
number of PDO and PGI registrations compared to all other member states. When the EU enabled producers and national authorities to protect registered names from 1992 onwards, theses five countries together were responsible for 83% of the total registered products up to 2000. A difference between these countries is that the number of new registrations is decreasing
over time in Greece and Portugal. However, the number of new registered products remains high and stable in Italy, France and Spain.
Table 1.2 Overview of the development of PDO, PGI and TSG over time and across countries
Class* Countries Registrations per country
Time dimension Main product categories
Mediterranean 1 Italy (IT),
France (FR),
Spain (ES)
>190,
only PDO and
PGI
Every 5 years > 30
products registered
High use of all
categories
Mediterranean 2 Portugal (PT),
Greece (EL)
100 – 150,
only PDO and
PGI
1996 -2000 >75
registrations;
Last 5 years between 10-20
PT high use for meat
and fruit/veg. EL
mainly cheese; oil; and fruit/vegetables
Western Europe 1 Germany (DE),
United Kingdom (UK)
60 – 100,
more PGI than PDO
Stable number of
registrations per 5 years: 10 - 25
High use of multiple
categories
Western Europe 2 Austria (AT),
Belgium (BE),
Netherlands (NL)
10 – 20,
all three labels
used
Around 5 - 10
between 1996 -
2000; more recently
between’12 -’16:
around 5 products
Almost only cheeses
and vegetables
(BE also beer as TSG)
Eastern Europe Poland (PL),
Czech Republic (CZ),
Croatia (HR),
Slovakia (SL),
Slovenia (SK), Hungary (HU)
15 – 40,
More PGI than
PDO and high
use of TSG
compared to other classes
Started to register
as of 2007 (CZ in
2003). PL and CZ
more than others;
> 5 registrations per 5 year
Mainly meat (as PGI
or TSG); cheese (SL,
HU, PL, HR);
fruit/veg. (PL); beers
(CZ) and bread/ pastry (CZ, PL)
Northern Europe Sweden (SE), Finland
(FI), Denmark (DK), Ireland (IR), Latvia
(LV), Lithuania (LT)
5 – 10, all three
labels used
SE, FI, DK and IR
as of 1996 but low numbers. LA, LV
as of 2010.
Registration of mainly
cheeses; fresh fish; meat; vegetables; and
bread and pastry
Potential users Bulgaria (BG),
Cyprus (CY), Romania (RO)
> 3, CY and RO
mainly PGI, BG mainly TSG
RO and BG as of
2011. Increasing registrations as of
2015
BG meat;
CY pastries; RO diverse

Strength2Food D4.1 – Determinants of farmers’ engagement in FQS
20 | P a g e
Source: based on DOOR, EC (2017b)
* Class based on the number of registrations and location
The countries in Western Europe can be divided into two groups. On the one hand there are the UK and Germany and on the other hand the smaller countries Austria, Belgium and the Netherlands. The UK and Germany have more registered products and also use a larger variety of product categories to register products. What is interesting is that Austria, Belgium and the
Netherlands registered most products at the start of the quality scheme between 1996 and 1998. Only few registrations happened in the period between 1999 and 2014. However, between 2015 and 2016, these three countries each have 5 products registered or under registration.
With the enlargement of the EU, also producers in Central European countries could use PDO, PGI and TSG to label their products. As of 2007, these countries have established an interest in using all three labels to protect their products again misuse. Especially Poland and the Czech
Republic and recently Croatia (which joined the EU in 2013) registered a significant number of products since the accession to the EU. The countries in Eastern Europe use the PGI more than the PDO label. Also their interest in TSG is larger than in other regions in Europe.
The group that is classified as ‘potential users’ (Bulgaria, Cyprus, Romania) have only few products registered as PDO, PGI or TSG at the time of this study (Spring 2017). However, looking at the registered products in the last two years and the number of products under
application, it seems that these countries do have an interest in using the quality scheme. To what extent is not clear yet. What stands out is that after accession to the EU each country requires some time to adjust to the EU Regulation. This could explain the time between the year of accession and the year that the first product is registered for Bulgaria and Romania.
The countries classified in Northern Europe use the quality scheme only to a limited extent. These countries do not show a specialization in one or two product categories either. Finally,
there are the small laggards. These small member states, except for Luxembourg, do not have any products registered yet.
Looking at the product categories, fruit, vegetables and cereals are most often registered. Together with cheeses, fresh meat, meat products, and fats and oils, these categories account for 79% of the total registrations (Figure 1.1).
Small laggards Luxembourg (LU),
Estonia (EE),
Malta (MT)
< 5 LU (4) between
1996 -2000; while
EE (0), MT (0)
Non for EE and MT.
LU diverse use.

Strength2Food D4.1 – Determinants of farmers’ engagement in FQS
21 | P a g e
Figure 1.1 Registered products per product category
Source: Data from DOOR database
1.3. Engagement in PDO/PGI labels – a regional analysis
1.3.1. What explains the uptake of the PDO/PGI labels?
Based on the literature, the factors that potentially play a role are grouped under five headings: regional factors; institutional factors; economic factors; accessibility of rural areas; and characteristics of the agricultural sector.
Regional factors
At the member state level there are large spatial differences in the uptake of PDO/PGI. In the Mediterranean countries there are many more registered products than in the rest of Europe. At the basis of this lies a long history of systems that protect products of origin in Spain, Italy (Denominazione di Origine Controllata, DOC), France (Appellation d'Origine Contrôlée, AOC)
and Portugal (Becker, 2009). The AOC and DOC also served as a basis for the first EU Regulation on the quality schemes for agricultural products and foodstuffs. To measure differences between regions in uptake, different regional dummies are included.
Moreover, it is hypothesized that climate and weather can have an impact on the number of registrations. In Mediterranean countries the temperate climate allows larger growth seasons and more favourable weather to produce agricultural products more locally (Lee & Rund,
2003). On the other hand, Northern regions are faced with more severe weather where less agricultural production takes place; this could result in fewer PDO and PGI registrations.
Institutional factors
The discussion in section 1.2 suggests that the number of registered products can be influenced
by the national registration procedures (Dimara, 2004; London Economics, 2008). The assistance of national authorities in the registration process can have a positive effect on the use of the quality scheme.
Another reason that can explain the differences in uptake is food culture (Ilbery et al., 2000). Food culture refers to how a group perceives food and how a group uses food to express identity, community, status or values. It also includes ideas about how, why and with whom food should

Strength2Food D4.1 – Determinants of farmers’ engagement in FQS
22 | P a g e
be consumed (Long, 2016). This can also be linked to differences in perception of quality of food (Becker, 2009). For example, in Southern countries quality is more perceived as traditional and local food, while in Northern countries quality is more perceived in terms of safety and high production standards.
The idea of food culture can be related to consumer recognition of the different labels. It can be argued that in member states where consumers do not recognize the labels, producers are also
less likely to use the quality scheme. The other way around, it is also possible that the use of PDO and PGI within a region affects the recognition of the labels by consumers.
Trust and a strong network structure between farmers in a region is important to exploit the PDO or PGI label effectively. Case studies performed in Slovenia (Istinic, 2010) and Romania (Voicilas & Alboiu, 2014) show that there was/is a low use of PDO and PGI in these countries because of a lack of tight connections and trust between producers. When producers lack trust
and tight connections with other producers, it is hard to establish a cooperative structure to market products successfully. Ackermann and Russo (2010) mention that a precondition for a successful marketing strategy is that a cooperative structure is in place. This could be measured by looking at the number of cooperatives in an area or through a measure of trust within a region.
Economic factors
The income within a region can potentially correlate with the use of quality schemes. When income increases, the demand for more quality and local products increases. However, the label
is designed for more remote areas, where it is expected that Gross Domestic Product (GDP) is lower. The link between GDP and FQS uptake is therefore ambiguous.
The number of tourists in a region could have a positive contribution to the number of registered products. Most registered products are known and consumed locally (Arfini et al., 2011). It is assumed that tourists are likely to try local products. A well-known name of registered products can attract more tourists. Thus, producers can use the label to signal authenticity and quality to
promote the name of the region and attract (rural) tourists. The EU also tries to link the use of the label with developing agro-tourism within the region to contribute to rural development.
Accessibility
One of the objectives of the EU FQS is to improve rural development in especially more remote,
mountainous and less favourable areas (LFA). It is therefore hypothesized that there are more products registered in these areas than in other European regions. Variables that could be used to measure remoteness are population density, the amount of roads or the number of cities in a region. Whether regions are mountain areas or less favoured areas can be measured using the amount of hectares of agricultural land that are respectively indicated as mountainous or LFA.
Characteristics of the agricultural sector
Different indicators that are related to the agricultural sector can be included to explain conditions for uptake of the scheme. First of all, the size of the agricultural sector is expected
to positively influence the uptake of the quality scheme. The more products are produced in a region, the more products could be registered as PDO and PGI. This could be measured using the value added or using Standard Output as an indicator of the size of agricultural production within a region. Agricultural productivity within a region can also be linked to uptake: FQS are
expected to occur more in areas with natural constraints, where output per hectare is lower. Another indicator is the share of agricultural employment in total employment in a region. We can expect that the use of PDO and PGI is lower in regions where the agri-food chain is less

Strength2Food D4.1 – Determinants of farmers’ engagement in FQS
23 | P a g e
developed. As a consequence, the share of people that work in the agricultural sector is expected to be negatively correlated with the use of PDO and PGI.
Hypotheses can be also made about the relation between the use of PDO and PGI and the size of farms. Because the PDO and PGI label serve as a differentiation tool, it is most likely that farmers with a smaller land size engage more in PDO/PGI than farmers with a large area of land. From the theory on reputation (Shapiro, 1983) it is expected that large firms are more
likely to invest in a private mark to protect their reputation instead of using GI. However, Belletti et al. (2007) argue that very small, artisan farms face high costs in order to use PDO or PGI labelling. Therefore, the correlation between the use of the quality scheme and very small farms may be negative.
Vuylsteke et al. (2005) found that older farmers in Belgium, with no successor, no family support and low agricultural education are more often excluded from certification. Related to
this argument, it is hypothesized that more active farmers engage in certification. Therefore, full-time farming is included in the research. Full-time farmers have to get all their income from farming and are therefore more likely to engage in PDO or PGI to get a higher income as compared to farmers who also earn off-farm income.
1.3.2. Data
To explain the difference in the number of PDO and PGI products between regions, data on the number of PDOs and PGIs in each region is required. Data is collected for three years: 2007, 2010 and 2013. Firstly, these years are chosen because of the availability of data for the different explanatory variables that are of interest for this research. Secondly, between these years there
are similar intervals, and thirdly, before 2007 the countries that accessed the EU in 2004 barely made use of the PDO/PGI certification. Finally, using different years gives the opportunity to compare the reasons to participate in the PDO and PGI label not only across regions but also across time. Because there are changes made in the regulation for the protection of agricultural
products and foodstuffs in 2006 and 2012, it is interesting to see if the conditions required for farmers and processors to engage in PDO and PGI changed over time.
To analyse the differences across regions, data is collected at the European NUTS2 level. Using the NUTS classification has multiple advantages. The Nomenclature of Territorial Units for Statistics (NUTS) is a standard that is created by the EU and is primarily based on normative, institutional criteria (EUROSTAT, 2011). The NUTS2 level is similar to provinces; regions;
departments and sometimes to an entire country as it is the case for the Baltic countries, Cyprus, Malta and Luxembourg. For this research, the NUTS2 classification applicable from 1 January 2012 is used. Data is collected for all regions that are part of the European Union up to 2013. Only the autonomous regions of Spain, Ceuta and Melilla, are removed because of a lack of data.
The number of PDOs and PGIs per region is derived from the Database of Origin & Registration
(DOOR). This database contains an overview of all registered products under the PDO, PGI and TSG label, and the respective geographical area in which it is produced. It is possible that a PDO (e.g. Feta cheese) is produced in more than one NUTS2 region (the mainland of Greece and Lesbos). In this case, the PDO is registered accordingly in the database.
Data on the possible determinants of the uptake of FQS across regions is retrieved from the EUROSTAT (EUROSTAT, 2017) and the Quality of Governance EU Regional dataset
(Charron et al., 2016). For some variables there is a lack of data for all three years. This limits the possibility to do a panel data analysis. Also, for some NUTS2 regions there is a lack of data.

Strength2Food D4.1 – Determinants of farmers’ engagement in FQS
24 | P a g e
In these cases, estimations are made for this specific region by using data from NUTS1 level or based on data from previous years. In rare cases data from another year is used.
1.3.3. Data description
An overview of the variables and their expected effect on the number of registered products is given in Annex A.1. In total 268 NUTS2 regions are included in the dataset. These are all the
NUTS2 regions of the 27 EU member states (excluding Ceuta and Melilla) according to the classification applicable from 2012 as mentioned before. Croatia is excluded because of a lack of data for 2007 and 2010. For each of these regions the number of PDO plus the number of PGI products is registered. Figure 1.2 indicates to what extent each region uses the food quality
label. It is clear from the map that the Mediterranean countries make most use of PDO and PGI. However, also regions in Scotland, Finland, the Czech Republic and Germany make more use of the label than other regions in Europe.
Figure 1.2 PDO and PGI registrations per region, 2013

Strength2Food D4.1 – Determinants of farmers’ engagement in FQS
25 | P a g e
Regional factors
A variable that reflects different climate zones is included in the dataset based on the different
biogeographical conditions from the European Environment Agency (EEA, 2012). Also regional dummies are included for the East, West, North and South of Europe.
Institutional factors
The level of encouragement from national authorities in the registration process is included as
a dummy variable based on London Economics (2008) who held a questionnaire in which they asked each authority that is responsible for approving registrations whether they provide support to the applicant. This support could for example be in the form of a contact person or information about how to successfully apply for a PDO/PGI on their website.
Food culture is approximated by the number of accommodations and food service activities per country. This measurement combines tourism accommodations and food serving
accommodations to measure the attractiveness of the region in relation to food. When there is more than 1 accommodation per 2500 inhabitant, the country is said to have a food culture.5
As a proxy for trust, the Corruption Pillar of the European Quality of Governance Index is used. This corruption pillar is a normalized score with 0 for the EU average. This score is based on 4 different questions that relate to corruption in the prevalent area (QoG, 2010).
Economic factors
Regional GDP is included through two measurements: GDP per inhabitant and GDP in billion Euros. Both measurements are in Purchasing Power Standard (PPS), to make GDP comparable across regions. To measure the attractiveness of the region for tourists, data on the number of nights spent by tourists within a region is used.
Accessibility
Three variables are included to measure the remoteness of the region: population density; kilometres of motorway per 1000km2; and kilometres of railway per 1000km2. It is expected that kilometres motorway and railway per 1000km2 is negatively correlated with the number of
PDO/PGI. However, it is also arguable that at least some infrastructure is required to provide a minimum access to markets. Therefore, also the squares of these variables are included.
To measure how marginalized a region is, two different variables are included: the amount of LFA in hectares and the amount of hectares of mountain area. In the EU, LFA is a term used to describe an area with natural handicaps (lack of water, climate, short crop season and tendencies of depopulation), or that is mountainous or hilly, as defined by its altitude and slope (OECD,
2002). In the context of European cohesion and enlargement, mountain regions are considered as having permanent natural handicaps, due to topographic and climatic restrictions on economic activity and/or peripherality (NORDREGIO, 2004).
Characteristics of the agricultural sector
Different variables are included to measure specific characteristics of the agricultural sector within the region. The size of the agricultural sector is measured as the standard output in Euros. Productivity is measured as the standard output per hectare of land. Other indicators include: (i) employment in the agricultural sector as a share of total employment; (ii) the share of
holdings that is smaller than 2 hectares and (iii) the share of holdings between 2 and 4.9 ha. Percentages are used to make these variables more comparable between regions.
5 This ratio of 1:2500 is arbitrary.

Strength2Food D4.1 – Determinants of farmers’ engagement in FQS
26 | P a g e
Vuylsteke et al. (2005) found that farmers that consume most of their agricultural production by themselves are less likely to engage in food quality labelling. Therefore, the share of farms within a region that use more than 50% of production for own consumption is included. Secondly, Vuylsteke et al. (2005) mention that farmers who are not full-time active at the farm
are less likely to engage in food quality labelling. Therefore, the total family labour that is full-time employed at the farm is used as a share of total family labour in Labour Working Units.
1.3.4. Empirical model and results
The dependent variable is the number of PDO and PGI products per region (Total_P). There are several regions in the dataset that do not possess a PDO or PGI certified product. This means that the dependent variable either takes the value 0 or has a positive, continuous value resulting in a distribution that is skewed to the right. Using Ordinary Least Squares (OLS) is therefore
not applicable because it gives incorrect estimators. We have therefore applied two separate models. A Probit model was used to explain whether or not a region engages in PDO/PGI production at all. A Tobit model was estimated to investigate the determinants of the number of PDO/PGI registrations per region. In this case, a Tobit model is appropriate because multiple
observations are 0. Estimating the Tobit model corrects for the skewness because it assumes that the data is not normally distributed.
For each of the two model specifications, three regressions are performed. The first model uses the data for 2007, the second model uses the data from 2010 and 2013, a third model uses data for all years. The distinction in two periods allows to see if there are different explanations for the distribution of PDO and PGI before and after Central European member states started to use
the food quality scheme. The dependent variable is transformed to a natural logarithm (ln) in the Tobit model to reduce the skewness and kurtosis in the data. Following Cameron and Trivedi (2010), tests show that the data are not normally distributed and are heteroskedastic. The fact that the data is not normally distributed is a result of the censored distribution and is
solved by using the Tobit model. Heteroskedasticity indicates that the variance in the error term is not constant and there could be a misspecification in the model. In order to solve for heteroskedasticity, robust standard errors are applied both in the Logit and the Tobit model specifications (Verbeek, 2012). Correlation coefficients were calculated for all independent
variables, which led to the exclusion of variables that were most highly correlated. Table 1.3 summarizes the results of the analysis.
Regional Factors
If we compare 2007 with 2010, there are more PDO and PGI products registered. Also more
regions started to use the label. The number of regions that uses the quality scheme increased from 168 to 197 (29 new regions). When we compare 2010 to 2013 there are more PDO and PGI products registered. The number of NUTS regions that are using the label increased from 197 to 214 (17 new regions) but this increase is not statistically significant. At the end of 2013 there were still 54 regions that did not use PDO/PGI certification.
In terms of regional differences in the use of PDO and PGI, results are in line with prior
expectations. In Southern Europe the likelihood to use PDO and PGI is larger and also the number of registered products per region is larger than elsewhere in Europe. When West- and North-Europe are compared there are no clear differences in the decision to certify products. However, the number of registered products per region is lower in Northern than in Western
countries. This is also reflected by the low number of registered products in Northern European countries up to 2013 (26 products). The likelihood to use PDO or PGI is higher in Central-
Strength2Food D4.1 – Determinants of farmers’ engagement in FQS
27 | P a g e
Europe compared to West-Europe. However, the number of registered products does not show a significant difference between these parts of Europe. The box plot in Figure 1.3 (left) also confirms these results. Only the regions in Southern Europe (France, Spain, Portugal, Italy, Greece, Cyprus and Malta) make significantly more use of PDO/PGI than the other regions in
Europe. The box plot on the right of Figure 1.3 indicates that the more temperate, Mediterranean climate could explain why Southern countries make more use of the quality label.
Table 1.3 Results from Probit and Tobit models
Probit model Variables
Tobit model
2007 2010/2013 all years 2007 2010/2013 all years +** Year_2010 +*** 0 +*** Year_2013 +** +***
0 0 0 North -***
0 +*** +*** East 0
+*** +*** +*** South +*** Encouragement +*** 0 0 Food culture +*** +*** +* 0 Trust 0
0 +* +** GDP +*** +** +*
0 +** +** Tourism 0 0 0
-*** -*** -*** Population density -* - -***
-* 0 0 Motorway/1000km2 +** +** 0
+*** 0 0 Mw_km22
+** 0 0 Railway/1000km2 -** 0 0
-* 0 0 Rw_km22
0 Less Favoured Area +**
0 Mountain area 0
0 +** +*** Standard Output +*** +*** +***
0 0 0 Productivity -** -*** -**
0 -** -*** %Agricultural Employment 0 0 0
0 -*** -*** %Holdings <2ha +*** 0 -***
-* 0 0 %Holdings 2-5 ha 0 0 0
0 0 0 %Holdings self-consuming -*** -* 0
0 Full time family labour 0
+ indicates a positive effect; - a negative effect; and 0 no effect. * (10%); ** (5%); and *** (1%), indicate the level of statistical significance
Institutional factors
In 2007 encouragement from national authorities was beneficial for the number of registered
products. This was also found by London Economics (2008). For 2010 and 2013 there is no significant positive correlation. Therefore, there is no longer a clear relationship between encouragement and the number of registered products within a region. This may reflect that more countries started to use PDO/PGI labelling. On the other hand, the encouragement

Strength2Food D4.1 – Determinants of farmers’ engagement in FQS
28 | P a g e
010
20
30
40
50
To
tal_
P
E N S W
010
20
30
40
50
To
tal_
P
A B C D M Ma P S
variable was observed in 2007 only so that insignificance in more recent periods may reflect that this variable has become outdated.
Food culture has a positive effect on the number of registered products within a region. It is likely that food is very important in these regions and both producers and consumers appreciate quality labelling to signal the origin of the product more than in other regions. This finding is similar to the findings from London Economics (2008).
Trust does not seem to have an effect on the uptake of PDO and PGI.
Figure 1.3. Box plot of registered products per region (left) and registered products per biogeographical region (right)
Economic factors
We find a positive coefficient for GDP when the measurement of the domestic product in
billions is used. When the measurement per inhabitant is used, no significant relation is found. The GDP measured in billions is correlated with the standard output as well, although no collinearity is found between the variables in the regression. This correlation with standard output could explain the positive sign. Based on the coefficient for GDP/inhabitant there is no
relation in terms of rich or poor regions and the use of the quality label. Therefore, no clear relation between GDP and the uptake of PDO and PGI was found.
Areas where there are few tourists seem to be less interested in using PDO or PGI. This confirms the idea that producers are more likely to use the label in order to promote their products in touristic areas.
Accessibility
The use of the quality label is lower in densely populated areas (which are also dominantly urban areas). Moreover, the number of registered products increases when a region becomes more sparsely populated. The effect of remoteness is hard to judge by looking at the kilometres of motorway per 1000 square kilometre. The Tobit model gives a positive relation in
remoteness, while the Probit model gives a negative relation for 2007. Also, after 2007 no correlation was found. It is likely that motorway is not a good measure because it is not
Legend:
E = East N = North
S = South W = West
Legend:
A = Alpine B = Boreal
C = Continental D = Atlantic
M = Mediterranean Ma = Macaronesia
P = Pannonian S = Steppic

Strength2Food D4.1 – Determinants of farmers’ engagement in FQS
29 | P a g e
comparable between countries. Based on the kilometres of railways per 1000km2, which are better comparable across countries in terms of judging remoteness, a relation is found as expected for 2007. The Probit model tells us that there is at least some infrastructure required to be interested in using the quality label. This would suggest that producers require some access
to markets to make it interesting use PDO or PGI. Also the Tobit model shows that the more remote a region is, the more use of the quality label is made based on the results of 2007. However, the other years do not show any significant effect for railway/1000km2. This observation may be caused by large differences between the older member states and the member states that acceded after 2004.
In the decision whether to use PDO or PGI, the amount of LFA is not significant. However in
areas with more LFA in hectares, also more products are registered. This is in line with what the PDO and PGI label is intended for. Regions that make a lot of use of the PDO or PGI and are for a large part designated as LFA are Scotland, North- and East-Finland, the centre of France, South- and West-Spain, Tirol in Austria and the Franken region in Bayern, Germany.
Whether a region is located in a mountain area is not significantly correlated with the number of registered products. This contradicts research performed by Santini et al. (2015) who found that there are more products labelled in mountain areas compared to plain areas.
Characteristics of the agricultural sector
The estimate for standard output shows that regions with a large agricultural production make more use of the quality label. This finding is as expected and is similar to the findings from London Economics (2008). On the other hand, both the Probit and the Tobit model show that regions that are less productive make more use of the quality label. This is in line with the
finding for the amount of LFA in a region. Less productive regions or regions with tougher production conditions make more use of PDO and PGI.
Areas where the share of agricultural employment is high have not (yet) shown interest in using the quality label. A transition in these regions is necessary to start using the label. Areas that lag behind in the use of the quality label are found in Bulgaria, Romania, Finland and some areas in the UK, Belgium, Austria, Poland, Germany and the overseas territories of France.
Interpretation of the results related to the farm size is difficult. There is no clear indication on whether there is a difference between the smallest size farms (< 2 ha) and the small size farms
(2 - <5 ha). It does show that regions with a large share of very small farms are not (yet) ready to implement the quality label. This could be related to the idea that the supply chain is not well developed and farms may have less power. When both variables are combined to measure the share of farms lower than 5ha, then there is a positive correlation between the share of small
size farms and the use of the quality label. This shows that smaller farms are more interested in using the quality label compared to large farms as a means of product differentiation.
Farmers that consume high shares of their own crop production are less likely to be engaged in PDO/PGI. This observation may be related to the high levels of self-consumption in Central Europe. There is no correlation found between full-time family labour and the use of the PDO or PGI label. Only for Central Europe a positive correlation was found in 2007. The
characteristics of the agricultural sector in Bulgaria and Romania could contribute to the outcomes of the Probit models. This outcome suggests that in less developed countries there is no interest for PDO and PGI at this moment. A possible explanation is that in less developed areas there are a lot of small scale farmers with a lack of power. Also, there is no demand for
quality certification from retailers and consumers are not willing to pay a higher price for high quality (Voicilas and Alboiu, 2014).

Strength2Food D4.1 – Determinants of farmers’ engagement in FQS
30 | P a g e
1.4. Conclusions and discussion
This chapter has investigated the factors that explain the uptake of PDO and PGI in Europe
using regression analysis. Previous research is mainly based on case studies for individua l products or a registered product is compared to a similar, non-registered product. No overarching research has been performed taking into account the entire EU by looking at the regional level.
The analysis shows that regions that are less productive and are located in Less Favoured Areas indeed make more use of PDO and PGI. Also, in more sparsely populated areas, more
marginalized and remote areas, the use of the quality label is higher. Regions with more agricultural production also make more use of the label. The importance of food and how it is imbedded in certain countries increases the likelihood of using the quality label. These reasons provide an understanding of why Mediterranean regions, make more use of the label than other regions.
Moreover, a coordinated supply chain is important for the number of registered products. In
regions where there is a lot of small scale farming and farmers are not much market oriented, the use of the label is low. In those regions where the label is not yet used, the number of tourists is low and the share of employment in the agricultural sector is large. This is currently the case in Bulgaria and Romania. Based on the characteristics of the agricultural sector in Eastern Europe, there is potential to make more use of the quality label.
What types of farms are more likely to engage is hard to interpret based on the quantitative
research. At least we do see a positive relation between smaller sized farms and the use of the label. Also on the regional level, the use of the label is lower in case farmers consume a large part of their own production. This could serve as a proxy that market orientation is important. However, more research is necessary to confirm this result.
Understanding what regions and farms are more likely to engage in geographical indications can improve the effectiveness of food quality schemes in Europe. Knowing who, where and
why producers engage in PDO and PGI helps to give policy makers a better understanding about this food quality scheme and gives an idea in which areas the scheme can be promoted more. This research also indicates in what regions knowledge about PDO and PGI is well established. Support should be provided to those regions that are suitable for using geographical
indication but do not make much use of it. Good knowledge is required by both producers and national authorities to reduce proliferation of the quality scheme.
Finally, it seems to be true that not the most remote areas and those areas with the worst agricultural conditions apply the scheme the most. However, the scheme is used more in sparsely populated areas and areas that are less productive. There are producers that use the scheme mainly as a tool to protect their name from misuse in other areas than what the scheme is mainly intended for.
This research has some caveats. The theoretical basis for engagement in PDO and PGI is
limited. Therefore, it was hard to make strong assumptions about what could explain the engagement of producers and processors in food quality schemes. This chapter tried to cope with the lack of theory by conducting a large literature study on PDO, PGI and TSG. This study is used to get a better understanding of the participation of farmers in PDO and PGI and the
reasons or conditions that are required to engage in this food quality scheme. The outcomes of this qualitative research were then used as an indication of what data should be collected.
To analyse the spatial distribution in the uptake of PDO and PGI, the number of PDOs and PGIs per NUTS2 region was used as the dependent variable. London Economics (2008) mentions

Strength2Food D4.1 – Determinants of farmers’ engagement in FQS
31 | P a g e
that using the number of PDOs or PGIs may not be a good measure of the use of this quality scheme. Although PDO or PGI registrations may exist, in certain cases they are not produced. Also, the data collected for the variables mountain area and trust contain some measurement errors. In the case of measuring the amount of mountain area the error is that the entire region
is used as a unit without making a distinction between mountain area and plain area within the NUTS2 regions. Santini et al. (2015) made a distinction between mountain; part-mountain; and peripheral mountain PDOs and PGIs. Therefore, the outcome of the regression for mountain area is hard to interpret.
It is possible that the corruption index is an incorrect proxy to measure trust. The Quality of Governance database also acknowledges that there are measurement errors in the corruption
index (Charron et al., 2016). Due to a lack of consistent data for each of the member states about PDO and PGI, this chapter compiled a new dataset on the use of PDO and PGI in Europe. Although it contains some measurement errors, this dataset is used as a first indication to explain reasons and conditions for the uptake of this quality scheme.
Despite these caveats this chapter fills a knowledge gap and can serve as a stepping stone for further research on the regional differences in the uptake of food quality schemes.

Strength2Food D4.1 – Determinants of farmers’ engagement in FQS
32 | P a g e
REFERENCES
Ackermann, N., & Russo, F. (2010). Adding value to traditional products of regional origin: A
guide to creating a quality consortium. Vienna: United Nations Industrial Development
Organization.
Aliexpress (2017). Toscane Urban Landschap. Retrieved from:
https://nl.aliexpress.com/item/Tuscany-Urban-Landscape-Scenery-Poster-Silk-Fabric-Print-
Picture/32445875053.html?spm=2114.48010308.4.82.XqBuEm
AND-International (2012). Value of production of agricultural products and foodstuffs, wines,
aromatised wines and spirits protected by a geographical indication (GI). Final Report.
Areté (2013). Study on assessing the added value of PDO/PGI products. Executive summary.
Arfini, F., Albisu, L., & Giacomini, C. (2011). Current Situation and Potential Development of
Geographical Indication in Europe. In E. Barham, & B. Sylvander, Labels of origin for food:
Local development, global recognition (pp. 29-44). CABI.
Barjolle, D., Paus, M., & Perret, A. (2009). Impact of Geographical Indications: Review of
Methods and Empirical Evidences. Contribution paper prepared for presentation at the
International Association of Agricultural Economics Conference, Beijing, China, August 16 -
22, 2009, (p. 14).
Barjolle, D., Reviron, S., & Chappuis, J. M. (2005). Organization and Performance of the Origin
Labelled Food Alliances. In A. R. Bellows, Focus on Agricultural Economics (pp. 91-126).
New York, USA: Nova Science Publishers.
Becker, T. (2009). European Food Quality Policy: The Importance of Geographical Indications,
Organic Certification and Food Quality Assurance Schemes in European Countries. Estey
Centre Journal of International Law and Trade Policy , 10(1), 11-130.
Belletti, G., & Marescotti, A. (2002). Link between Origin Labelled Products and rural
development. DOLPHINS Concerted Action, WP3, Final report.
Belletti, G., & Marescotti, A. (2011). Origin Products, Geographical Indication and Rural
Development. In E. Barham, & B. Sylvander, Labels of origin for food: local development,
global recognition (pp. 75-91). CABI.
Belletti, G., Burgassi, T., Marescotti, A., & Scaramuzzi, S. (2007). The effects of certification
costs on the succes of a PDO/PGI. In L. Theuvsen, A. Spiller, M. Peupert, & G. Jahn, Quality
Management in Food Chains (p. 512). Wageningen, the Netherlands: Wageningen Academic
Publishers.
Benavente, D. (2013). The economics of geographical indications. Geneva: Graduate Institute
Publications.
Bowen, S. (2010). Embedding local places in global spaces: Geographical indications as a
territiorial development strategy. Rural Sociology , 75(2), 209-243.
Strength2Food D4.1 – Determinants of farmers’ engagement in FQS
33 | P a g e
Broude, T. (2005). Taking "Trade and Culture" Seriously: Geographical Indications and
Cultural Protection in WTO Law. Journal of International Law , 26(4), 623-692.
Cameron, C., & Trivedi, P. (2010). Microeconometrics Using Stata, Revised Edition. STATA
Press.
Charron, N., Dahlberg, S., Holmberg, S., Rothstein, B., Khomenko, A., & Svensson, R. (2016).
The Quality of Government EU Regional Dataset, version sep16. University of Gothenburg:
The Quality of Governance Institute.
Darby, M., & Karni, E. (1973). Free Competition and the Optimal Amount of Fraud. The
Journal of Law & Economics , 16(1), pp. 67-88.
Dimara, E., Petrou, A., & Skuras, D. (2004). Agricultural policy for quality and producers'
evaluations of quality marketing indicators: a Greek case study. Food Policy , 29, 485-506.
European Commission (EC) (2006). Council Regulation (EC) No 510/2006 of 20 March 2006
on the protection of geographical indications and designations of origin for agricultural products
and foodstuffs.
European Commission (EC) (1992). Council Regulation (EEC) No 2081/92 of 14 July 1992 on
the protection of geographical indications and designations of origin for agricultural products
and foodstuffs.
European Commission (EC) (2017b). Database of Origin & Registration (DOOR). Retrieved
from: http://ec.europa.eu/agriculture/quality/door/list.html?locale=en.
European Commission (EC) (2017c, January 23). EU agricultural product quality policy.
Retrieved September 8, 2016, from http://ec.europa.eu/agriculture/quality_en
European Commission (EC) (2017a, January 23). Optional quality terms and voluntary
certification schemes. Retrieved September 5, 2016, from
https://ec.europa.eu/agriculture/quality/local-farming-direct-sales_en
European Commission (EC) (2012). REGULATION (EU) No 1151/2012 OF THE
EUROPEAN PARLIAMENT AND OF THE COUNCIL of 21 November 2012 on quality
schemes for agricultural products and foodstuffs.
European Environmental Agency (EEA) (2012). Biogeographic regions in Europe. This report
is available as a website at http://www.eea.europa.eu/data-and-maps/figures/biogeographical-
regionsin-.
EUROSTAT (2017). EUROSTAT Database. Retrieved from:
http://ec.europa.eu/eurostat/data/database.
EUROSTAT (2011). Regions in the European Union: Nomenclature of territorial units for
statistics NUTS 2010/EU-27. Luxembourg: Publication Office of the European Union.
Gangjee, D. (2015). Proving Provenance? Geographical Indications Certification and its
Ambiguities. World Development , In press.

Strength2Food D4.1 – Determinants of farmers’ engagement in FQS
34 | P a g e
Giovannucci, D., Josling, T., Kerr, W., O'Connor, B., & Yeung, M. (2009). Guide to
Geographical Indications: Linking products and their origin. International Trade Centre,
Geneva.
Hajdukiewicz (2014). European Union agri-food quality schemes for the protection and
promotion of geographical indications and traditional specialities: an economic perspective.
Folia Horticulturae , 26(1), 3-17.
Ilbery, B., Kneafsey, M., & Bamford, M. (2000). Protecting and promoting regional speciality
food and drink products in the European Union. Outlook on Agriculture , 29(1), 31-37.
Istenic, M. (2010). Successes and failures of EU food quality schemes: experience from the
case of ‘Scent of Prekmurje’, Slovenia. European Association of Agricultural
Economists>118th Seminar, August 25-27, 2010, Ljubljana, Slovenia , 173-188.
JRC (2006). Economics of food quality assurance and certification schemes managed within
an intergrated supply chain. Final report.
Kneafsey, M., Venn, L., Schmutz, U., Balázs, B., Trenchard, L., Eyden-Wood, T., et al. (2013).
Short Food Supply Chains and Local Food Systems in the EU. A State of Play of their Socio-
Economic Characteristics. Luxembourg: Publications Office of the European Union, 2013.
Lee, J., & Rund, B. (2003). EU-protected Geographical Indications: An analysis of 603 Cases.
GIANT Project, American University.
London Economics (2008). Evaluation of the CAP policy on protected designations of origin
(PDO) and protected geographical indications (PGI). Final report.
Long, L. (2017). Food culture. Retrieved November 21, 2016, from Lexicon of food:
https://www.lexiconoffood.com/food-action/food-culture
Marescotti, A. (2003). Typical products and rural development: Who benefits from PDO/PGI
recognition? 83rd EAAE SEMINAR, Food Quality Products in the Advent of the 21st Century:
Production, Demand and Public Policy, 4th-7th Septmeber, 2003 - Chania, Greece, (pp. 1-18).
Montresor, E. (2002). Comment évaluer la contribution des produits typiques au développment
des zones rurales. DOLPHINS Concerted Action, Barcelona Seminar, 8th February.
NORDREGIO (2004). Mountain Areas in Europe: Analysis of mountain areas in EU member
states, acceding and other European countries. Final report.
OECD (2002). Glossary of statistical terms: less-favoured area. Retrieved November 20, 2016,
from https://stats.oecd.org/glossary/detail.asp?ID=1520
Quality of Government Institute (QoG) (2010). Measuring the quality of government and
subnational variation. Sweden: University of Gothenburg.
Santini, F., Guri, F., Aubard, A., & Paloma, S. (2015). Geographical Indications and Territories
with Specific Geographical Features in the EU: the Cases of Mountain and Island Areas. Paper
prepared for the 145th EAAE Seminar “Intellectual Property Rights for Geographical
Indications: What is at Stake in the TTIP?”. Parma, Italy, April 14-15, 2015.
Strength2Food D4.1 – Determinants of farmers’ engagement in FQS
35 | P a g e
Shapiro, C. (1983). Premium for High Quallity Products as Returns to Reputations. The
Quarterly Journal of Economics , 98(4), 659-680.
Thieidg, F., & Sylvander, B. (2000). Welcome to the club? An economic approach to
geographical indicators in the European Union . Agrarwirtschaft , 49(12), 428-437.
Tregear, A., Török, Á., & Gorton, M. (2016). Geographical indications and upgrading of small-
scale producers in global agro-food chains: A case study of the Mako ́ Onion Protected
Designation of Origin. Environment and Planning , 48(2), 433-451.
Vandecandelaere, E. (2015). Geographical Indications as a Tool for More Sustainable Food
Systems. European Association of Agricultural Economists>145th Seminar. Parma, Italy, April
14-15, 2015: [PowerPoint presentation].
Verbeek, M. (2012). A guide to modern econometrics. Wiley, 4th edition.
Voicilas, D., & Alboiu, C. (2014). Applied EU Quality Schemes and Organic Products on
Romanian Market. Economics of Agriculture , 61 (2) 381-395.
Vuylsteke, A., Huylenbroeck, G., Collet, E., & Mormont, M. (2005). Exclus ion of farmers as
a cons equence of quality certification and standardisation. In K. Mattas, & E. Tsakiridou, Food
quality products in the advent of the 21st century: production demand and public policy (pp.
293-306). Chania: CIHEAM (Cahiers Options Méditerranéennes; n. 64).

Strength2Food D4.1 – Determinants of farmers’ engagement in FQS
36 | P a g e
ANNEX A.1 OVERVIEW OF VARIABLES
Variable Description Source Level Expected sign
NUTS2 Name of the NUTS2 region in native language EUROSTAT
(2011)
NUTS2
2007 Dummy variable: 1 if data for 2007, 0 if not
2010 Dummy variable: 1 if data for 2010, 0 if not +
2013 Dummy variable: 1 if data for 2013, 0 if not +
North Dummy variable: 1 if data is collected for a county in Northern Europe, 0
if not. These are Sweden; Finland; Denmark; Estonia; Latvia; Lithuania.
Country _
East Dummy variable: 1 if data is collected for a county in Eastern Europe, 0 if
not. These are the Czech Republic; Poland; Hungary; Slovakia; Slovenia;
Romania; Bulgaria.
Country No effect
South Dummy variable: 1 if data is collected for a county in Southern Europe, 0
if not. These are France; Portugal: Spain; Italy; Malta; Greece; Cyprus.
Country +
West Dummy variable: 1 if data is collected for a county in Western Europe, 0
if not. These are Ireland; UK; Netherlands; Belgium; Luxembourg;
Germany; Austria
Country (used as baseline)
Total_P Total number of PDO and PGI products within a region EC (2017b) NUTS2
Climate Climate zones as nominal variable: Alpine (A); Boreal (B); Continental
(C); Atlantic (D); Mediterranean (M); Macaronesia (Ma); Pannonian (P);
Steppic (S).
EAA (2012) NUTS2 + M; - B (Lee &
Rund, 2003)
Encour Dummy variable for encouragement; assistance of national authorities in
the application process
London
Economics
(2008)
Country + (LE, 2008)
Foodc Dummy variable for Food culture based on food accommodations/1000
inhabitants
EUROSTAT
(2017)
Country + (LE, 2008)
Pop_d Population density in 100 inhabitants/km2 EUROSTAT
(2017)
NUTS2 -
Mw_km2 Kilometres of motorway per 1000 km2 Charron et al.
(2016)
NUTS2 - (EC, 2012)
Rw_km2 Kilometres of railway per 1000km2 Charron et al.
(2016)
NUTS2 - (EC, 2012)
GDP_b Gross Domestic Product in 1000 million Euros PPS EUROSTAT
(2017)
NUTS2 -
GDP_inh Gross Domestic Product in 1000 Euro PPS per inhabitant EUROSTAT
(2017)
NUTS2 -
SO Standard output in Euros (x100.000.000) EUROSTAT
(2017)
NUTS2 + (LE, 2008)
Prod Standard output per hectare of utilized agricultural area in Euros (x10.000) EUROSTAT
(2017)
NUTS2 -
LFA_ha Less Favoured Area in 10.000 hectares EUROSTAT
(2017)
NUTS2 + (EC, 2012)

Strength2Food D4.1 – Determinants of farmers’ engagement in FQS
37 | P a g e
MA_ha Mountain Area in 10.000 hectares EUROSTAT
(2017)
NUTS2 + (Santini et al.,
2015)
Emp_sh Employment in Agriculture, forestry, fishing, mining and quarrying as a
% of tot employment Charron et al.
(2016)
NUTS2 -
Tourism Nights spend at tourist accommodations by non-residents (hotels; holiday
and short-stay accommodations; camping grounds/trailer parks)
(x100.000)
EUROSTAT
(2017)
NUTS2 +
Trust Corruption Pillar of European Quality of Governance Index Charron et al.
(2016)
NUTS2 +
Hold_sh_2 Number of holdings with less than 2 ha of land as a share of total number
of holdings EUROSTAT
(2017)
NUTS2 - (Belletti &
Marescotti 2011)
Hold_sh_5 Number of holdings with 2 - 4.9 ha of land as a share of total number of
holdings EUROSTAT
(2017)
NUTS2 +
Hold_sh_sc Number of holdings that consume more than 50% of their own production
as a share of total number of holdings EUROSTAT
(2017)
NUTS2 - (Vuylsteke et
al., 2005)
Full_time Total family labour full t ime employed as a percentage of total family
labour EUROSTAT
(2017)
NUTS2 + (Vuylsteke et
al., 2005)

Strength2Food D4.1 – Determinants of farmers’ engagement in FQS
38 | P a g e
2. THE DEVELOPMENT OF FOOD QUALITY SCHEMES IN EUROPE – HERMEN LUCHTENBELT ,
JACK PEERLINGS & LIESBETH DRIES
2.1. Introduction
The European food quality schemes consist of two geographical indications and one that targets tradition related products. These schemes are respectively Protected Designations of Origin (PDO), Protected Geographical Indications (PGI) and Traditional Speciality Guaranteed (TSG). The latter one is not restricted to a specific geographical location. These schemes help
to assure consumers that products are legitimate (EC, 2017a). One of the main objectives of the PDO/PGI schemes is to promote rural regions (Becker & Staus, 2008). These schemes have become increasingly popular among producers, politicians and consumers (Becker, 2009).
The uptake of the PDO/PGI schemes varies among different European countries and regions (Ilbery et al., 2000). Research in the previous chapter has already shown what farm-related and regional factors are involved in determining farmers participation in PDOs and PGIs. However,
the econometric analysis consisted of cross-sectional regressions, without investigating the increase in uptake of PDOs/PGIs between years. London Economics (2008) performed research on the uptake of PDOs and PGIs in the years 1992-2006. However, their conclusions were based on studies of individual countries or case studies of specific regions and did not use
information from all the NUTS-2 regions. Moreover the structure and variables of the different NUTS-2 regions might have changed in the period after 2006.
This chapter aims to analyse what variables are causing the increase in uptake of PDOs and PGIs over time in European NUTS-2 regions. For this research, the difference in uptake of PDOs and PGIs between 2007, 2010 and 2013 is analysed. The research is based on a literature review and an econometric analysis. Outcomes will be visualised with ArcGIS software. The database contains panel data about PDOs and PGIs from different NUTS-2 regions in Europe.
The next section contains a literature study that will determine variables to use in the empirical
analysis. The diffusions of innovations theory and the five forces models will be discussed. Afterwards, descriptive statistics of the dependent and explanatory variables will be presented and the empirical model and post-estimation techniques are discussed before the discussion of the results. The chapter ends with general conclusions and a discussion of the research.
2.2. Theoretical framework
2.2.1. Diffusion of innovation
The technology adoption life cycle or diffusion of innovations theory argues that there are five different groups of economic agents that respond differently to a newly introduced innovation such as a new product or technology (Rogers, 2003). These groups can be divided by the time it takes before a group adopts the innovation, these groups are respectively the “innovators”,
“early adopters”, “early majority”, “late majority” and “laggards”. The different groups can be represented in a normal distribution curve and make up for respectively 2.5%, 13.5%, 34%, 34% and 16% of the total.
The innovators want to take the risk to try the innovation, innovators are generally well educated and wealthy. The early adopters consider their choices better compared to the innovators. Also this group consists of relatively wealthy and educated agents. The early majority are adopting
the technology just before an average agent would do. Members of this group have social ties
Strength2Food D4.1 – Determinants of farmers’ engagement in FQS
39 | P a g e
with the adopter leaders. This group has fewer economic means compared to the early adopters. The late majority is also a relatively large group that has fewer economic means compared to the previous groups. This group has little to no ties with innovators or early adopters and are considered to be risk-averse. The laggards do not like change and are considered risk-averse. They have a small social network and are the oldest consumers (Lasseur, 2011).
It takes the first group, the innovators, some time to adopt the new technology. When time
passes, more economic agents will adopt the innovation and the rate of adoption will increase. When the late majority and the laggards start to adopt the innovation, the rate of adoption will decrease until the innovation is fully adopted by all groups.
Lasseur (2011) argues that adoption by consumers is a function of various socio-economic variables. He argues that consumer adoption is positively influenced by personal characteristics such as income and education and negatively by age.
PDO and PGI schemes can be seen as an innovation. Following the theory, the increase in uptake of PDO/PGI schemes can be explained by the differences in adoption stages between
regions. Socio-economic proxies to measure the level of innovation, and therefore, to distinguish between the different regions can therefore be:
- The age of managers of agricultural holdings. According to the diffusion theory, if a
manager of an agricultural holding is relatively young, they tend to be more innovative
and adopt new technologies relatively early compared to managers that are older.
- Education level. The diffusion of innovations theory shows that the innovators, early
adopters and early majority tend to be higher educated compared to the other groups.
- GDP levels. As described by the theory, the level of innovation is related to the level of
income of a group of adopters.
Institutional variables could also be of importance in explaining the increase in uptake of PDOs and PGIs. One of these is the number of years that a region is member of the EU. Earlier research showed that Northern and Central European countries have a lower uptake of PDOs and PGIs compared to other regions (Folkeson, 2005). According to Folkeson a reason for this
might be that some countries are members of the EU for a longer period of time, and have thus better adapted their institutional environment compared to newer member states.
To distinguish between the different stages, it is also important to take the current level of PDOs and PGIs into account. The current level of PDOs/PGIs can show how many firms in a region already adopted the innovation. In combination with the adoption theory, one can roughly see in what adopter group the region is. Regions that have high levels of PDOs/PGIs are likely to
belong to the early majority or onwards. If the region belongs to the early or late majority group, the increase of PDO/PGI schemes tends to be higher. For the increase of PDO/PGI schemes between 2007 and 2010, the current level of PDOs/PGIs of 2007 can be used. For the increase of PDO/PGI schemes between 2010 and 2013, the current level of PDOs/PGIs of 2010 can be used.
2.2.2. The five forces model
According to Porter (1980) there are five forces that can be used to understand the balance of power within industries. Porter defines the different forces as the threat of new entrants, the threat of substitute products, the bargaining power of buyers, the bargaining power of suppliers
and rivalry among existing firms (see Figure 2.1). Together these forces shape the total level of

Strength2Food D4.1 – Determinants of farmers’ engagement in FQS
40 | P a g e
competition within an industry. According to Porter, the level of competition can show how attractive a certain market is, and if there are opportunities for firms to make higher profits.
Figure 2.1 The five forces model (Porter, 2008)
The level of competition described by Porters model of five forces can be of importance when
analysing the agricultural and food markets with PDO and PGI certified products. PDO and PGI certification can be used by individual firms to differentiate their products from firms that do not use the European certification system. If the level of competition is high firms have an incentive to differentiate their products by means of a PDO/PGI scheme. The five forces that
shape the level of competition can therefore help to explain the current situation on the market with PDO/PGI schemes, and explain the level of uptake of these schemes and the differences between regions.
Threat of new entrants
Porter argues that new market entrants will put pressure on market prices and company market shares. The number of market entrants depends on the level of the entry barriers. The higher the entry barriers, the higher the advantage for firms that are already in the market. Seven different sources of entry barriers are identified by Porter (2008): supply-side economies of
scale, network effects, switching costs, capital requirements, incumbency advantages, access to distribution channels and government policy.
Economies of scale cause the costs of a product to decrease with increasing production as technologies can be applied more efficiently for example. Industries with economies of scale make it hard for new market entrants to set up a production line. Network effects imply that if consumers are buying a certain brand or product, it might get more valuable. When established
firms within an industry have these network effects, it is harder for new firms to enter the market and the treat of new entrants is low. Switching costs are the costs for consumers to change to products from other manufacturers. The treat of new entrants decreases when there are high switching costs as it gets harder for new firms to gain consumers from established firms that
produce the same product. The treat of new entrants also decreases when there are high capital requirements as a lot of capital investments are needed to enter the industry. Furthermore Porter (2008) argues that incumbency advantages are important entry barriers. Incumbency

Strength2Food D4.1 – Determinants of farmers’ engagement in FQS
41 | P a g e
advantages are structural advantages that established firms have. An example of this is access to raw materials or a favourable location. Another entry barrier is the access to distribution channels. Established firms generally have a good connection with their distributers whereas new firms need to make new contracts with distributors and promote their products. The more
established firms already have done this and thus have an advantage compared to the new firms that want to enter the industry. The last entry barrier is a restrictive government policy that can make it harder for entrants to join a new industry. Examples of this are licencing requirements or investment restrictions. On the other side, favourable regulation can lower entry barriers.
PDO/PGI schemes create an entry barrier. When looking at the seven sources that create entry barriers, especially incumbency advantages, network effects and government policy are
relevant for PDOs and PGIs. Incumbency advantages can make it hard for some firms to join PDO/PGI, as products that qualify for the PDO/PGI schemes are protected for their authenticity (EC, 2017a). Firms that cannot deliver an authentic product, are not allowed to the PDO/PGI scheme. The number of entrants is therefore limited to the firms that are able to make these
authentic products. Specifically, regulation 510/2006 states that less favoured areas (LFAs) and remote areas need to be developed by using PDO/PGI schemes (EC, 2006). Therefore firms that are not located in such areas, might have a disadvantage. The incumbency advantages are determined by regional variables that can explain the level of remoteness in a region. The total
share of LFAs can explain the differences in uptake of PDO/PGI in the LFA regions. Proxies for remoteness are the hectares of mountainous area and share of employment in the agricultural sector. Another variable that can be used is the income in a region. Regions with a lower income can be seen as less developed compared to the regions with higher income and thus having a
higher uptake of PDO/PGI schemes. Another variable related to the stage of development of a region is the total productivity in the agricultural sector. Regions that are more productive are expected to have a negative effect on the increase in uptake of PDO/PGI schemes as a higher agricultural production indicates that these regions are better developed. Finally, differences
between regions in terms of tourism can lead to more PDOs/PGIs as tourists are likely to try the local foodstuffs. Producers that face a lot of tourism in their region can label their local products with a PDO/PGI scheme to attract these tourists.
Network effects also influence the entry barriers, but in a positive way. PDO and PGI schemes can be used as a marketing tool to extend the network of a certain product at the expense of products without these schemes. Network effects create an incentive for firms to enter the PDOs
and PGIs. On the other hand, the previous chapter has argued that countries with a low level of trust between producers also have a lower level of uptake of PDO and PGI schemes. Even though network effects play a role in determining the level of entry barriers in the PDO/PGI market, there are not a lot of ways to measure these. London Economics (2008) argued that
there are cultural differences in a country’s food system and tried to map these. These cultural differences could explain why the uptake of food quality schemes like the PDO or PGI schemes are doing better in some regions or countries compared to others. If a country has a food culture, this might cause the network effects of food quality certificates to be stronger as the marketing
power of these schemes has more influence. This result was also confirmed in the previous chapter: the food culture has a positive impact on the current levels of PDO/PGI schemes.
Government policy can be important to explain the difference in entry barriers between regions. Some regions or countries might have certain policies that make it harder for firms to apply for a PDO or PGI scheme. Early adopters of the PDO/PGI schemes have complained about the bureaucracy of the application procedures and this could be related to the lower uptake of
PDO/PGI schemes in some regions (Ilbery & Kneafsey, 1999). Also London Economics (2008) argues that government support can play an important role in determining the uptake of
Strength2Food D4.1 – Determinants of farmers’ engagement in FQS
42 | P a g e
PDO/PGI schemes. Producers that are not getting incentives or help from their government in applying for a PDO/PGI scheme might negatively affect the uptake of the quality schemes.
The threat of substitute products
Another force that determines the level of competition between firms, is the threat of substitute
products (Porter, 1980). If there are a lot of substitute products in the market, firms in the industry have a limit on the maximum price they can ask for their products because consumers will buy the substitute products. This will put pressure on the industry, and firms are forced to promote themselves by marketing their products or investing in other techniques of promotion.
There are no direct substitutes for PDO and PGI schemes. However, firms can try to differentiate their products by using another type of certification scheme, but these alternatives
may not offer legal protection for the whole EU. The alternative schemes in a country often include rules with respect to animal welfare, organic farming or environmental friendly production as well (Milieucentraal, 2017).
The bargaining power of buyers
If customers of the industry are able to negotiate about prices or quality of the products, this will put pressure on the firms in an industry. The bargaining power of buyers is determined by the ratio of firms and customers in an industry. If there are relatively more customers compared
to firms, it will be hard for customers to negotiate about prices. However, if there are some large volume purchases by individual buyers, or only a few customers for a certain product, the buyers can negotiate about prices and are able to demand better quality products. If the switching costs are low, buyers can also put pressure on firms by buying substitute products.
Products with a PDO/PGI scheme are seen as unique. However, the switching costs are low as it is not hard for consumers to buy another product. Because of this, there might be some
bargaining power for buyers. But as there are not a lot of substitute products with similar certifications, the bargaining power of buyers might not be very strong.
The bargaining power of suppliers
If there are only a few suppliers for raw materials, they can charge higher prices putting firms
in a certain industry under pressure. Moreover, the suppliers can also deliver lower quality products or shift costs to the buyer. This will also put pressure on the profitability of an industry and increase the competition between firms. Research showed that because firms with PDO and PGI schemes have higher value added, their income increases. This will cause a stronger
position for firms in the negotiations with their suppliers (Galli, 2011). Supplier power might be of interest in explaining the differences in uptake of the PDO/PGI schemes over time. The usage of PDO and PGI schemes will cause the revenues of firms to go up in some countries (Bremmers, 2014). This can enhance bargaining power for the enterprises that use the PDOs and PGIs (Galli, 2011).
Rivalry among existing firms
The last force discussed by Porter is rivalry among existing firms in a market, which can also
limit the profitability of this industry (Porter, 2008). Rivalry between the established firms in an industry can take the forms of price competition, advertising wars, warranties or introducing new products. Research shows that in some cases, firms that have differentiated their products with PDO/PGI schemes, can ask higher prices for their products (Skuras & Vakrou, 2002). So
products with a PDO or PGI status are imperfect substitutes of regular products indicating that PDOs and PGIs reduce competition.

Strength2Food D4.1 – Determinants of farmers’ engagement in FQS
43 | P a g e
2.3. Change in uptake of PDO/PGI schemes in the EU: a regional analysis
2.3.1. Descriptive statistics
The same dataset as was used in the previous chapter will be used for the current analysis. This dataset contains a total of 268 NUTS-2 regions spread over 27 member states (all member states
except Croatia) of the European Union, along with a list of variables that aim to explain the increase of PDOs and PGIs. The dataset consists of panel data with information about 2007, 2010 and 2013. This research aims to analyse what variables are causing the increase of PDOs and PGIs over time in European NUTS-2 regions. The dependent variable in the analysis is
therefore defined as the change in number of PDOs and PGIs between 2007 and 2010 on the one hand and between 2010 and 2013 on the other. Figure 2.2 shows how the changes in PDOs and PGIs are distributed along the different NUTS-2 regions. Countries like Italy, France and Spain that already have a high level of PDOs and PGIs uptake, also have an increase in
PDOs/PGIs between different years. Also countries in central and south-central Europe have a relatively high increase in uptake of PDO and PGI schemes.
Figure 2.2 Change in PDO/PGI uptake between 2007-2010 (left) and 2010-2013 (right)
2.3.2. Independent variables
The independent or explanatory variables can be divided into three different groups: institutional, socio-economic and regional. Table 2.1 shows descriptive statistics of the independent variables, with the expected sign in the last column.

Strength2Food D4.1 – Determinants of farmers’ engagement in FQS
44 | P a g e
Institutional variables
It is expected that the number of years a country is a member of the EU has a positive effect on
the increase of PDO/PGI schemes because the member states that are longer in the EU are better adapted to the institutional environment.
The government support variable is a dummy variable that measures if a region receives governmental support in the process of adopting PDO/PGI schemes. Countries that receive government support are: Austria, Belgium, the Czech Republic, France, Portugal, Slovakia and the United Kingdom. These countries are assigned a 1, where the other countries are assigned
a 0. The data stems from London Economics (2008). Encouragement is expected to have a positive effect on the increase of the PDOs/PGIs.
Food Culture is a dummy variable that measures whether a country has a food culture. A country is said to have a food culture if there are more than 1 food accommodations per 2,500 inhabitants. This data also stems from London Economics (2008). Countries with a food culture are: Cyprus, France, Greece, Italy, Malta, Portugal and Spain. These countries are assigned a 1,
where the other countries are assigned a 0. It is expected that food culture has a positive effect on the increase of the PDOs/PGIs.
There are two different corruption indexes used. A corruption index of the European Quality of Governance (QoG) and a corruption index from transparency international (CPI). Both indexes are proxies for the trustworthiness of government policy. The corruption index from transparency international has data for the years 2007 and 2010, whereas the QoG-index has
information about 2010 and 2013. This is also the reason why two different corruption indexes are used. In both years, the eastern part of the EU scores worse on the corruption indexes, also the south of the EU does worse compared to the northern countries. It is argued that a more trustworthy government policy leads to a better environment for firms to adopt the PDO/PGI
schemes. Hence, It is expected that a high score on both indexes will have a positive effect on the increase in PDO/PGI uptake.
To serve as a proxy for the level of bureaucracy, the government effectiveness index is included in the model. Government effectiveness “captures perceptions of the quality of public services, the quality of the civil service and the degree of its independence from political pressures, the quality of policy formulation and implementation, and the credibility of the government’s
commitment to such policies.” (WorldBank, 2017). Government effectiveness is an index that has values varying between -2.5 to 2.5. It is expected that the government effectiveness index has a positive effect on the increase in PDO/PGI uptake.
Socio-economic variables
The population density in inhabitants per km2 is also used. The data stems from EUROSTAT (2017). For scaling purposes, the number is divided by 100. Population density can be seen as a proxy for remoteness or less-favoured area. It is expected that population density has a negative effect on the increase in PDO/PGI uptake.
The share of farm managers below the age of 35 as a share of the total number of farm managers
in a region is also used (EUROSTAT, 2017). The data is available at NUTS-2 level for 2007, 2010 and 2013. It is expected that the share of young farm managers in a region has a positive effect on the increase in PDO/PGI schemes as they tend to be more innovative.
The employment share in agriculture, forestry, fishing, mining and quarrying as a percentage of total employment can be seen as a proxy for remote or less-favoured regions. Data are available at NUTS-2 level in 2007, 2010 and 2013. The employment in the agricultural sector
Strength2Food D4.1 – Determinants of farmers’ engagement in FQS
45 | P a g e
as percentage of total employment is especially high in the eastern part of the EU, e.g. countries like Greece and Romania have a high share. It is expected that the share of agriculture in total employment will have a positive effect on the increase in PDO/PGI schemes.
Tourism is estimated as the nights spent at tourist accommodations by non-residents. The data stems from EUROSTAT (2017) and are available at NUTS-2 level in 2007, 2010 and 2013. It is expected that tourism has a positive effect on the increase in uptake of PDO/PGI schemes
because tourism can stimulate farmers in labelling their foodstuffs. The difference in nights spent at tourist accommodations by non-residents are calculated between 2007 and 2010, and between 2010 and 2013. It is also expected that an increase of tourism between the different time periods has a positive effect on the increase in PDO/PGI schemes.
The Gross Domestic Product (GDP) per inhabitant is divided by 1000 for scaling purposes. The data are available at NUTS-2 level in 2007, 2010 and 2013. GDP per inhabitant can be seen as
a proxy for remote or less-favoured regions. It is expected that GDP per inhabitant has a negative effect on the increase in uptake of PDO/PGI schemes because regions that have higher economic means are located in urbanised regions which are not the designated areas for PDOs and PGIs. The differences in GDP per inhabitant are also calculated for both of the time periods.
It is also expected that growth in GDP per inhabitant has a negative effect on the increase in uptake of PGO/PGI for the same reason as the current levels.
The level of education is measured by taking the percentage of the population in a region with an educational level of 0, 1 or 2 according to the INCED 2011 classification (UIS, 2011). An INCED classification of 0, 1 or 2 are respectively early childhood education, primary education and lower secondary education. The INCED classification runs from 0 to 8. The data stems
from the(EUROSTAT, 2017). It is expected that the share of low educated persons in the population has a negative effect on the increase in uptake of PDO/PGI schemes as lower educated persons tend to be less innovative in adopting PDO/PGI schemes as described in the theory chapter.
Regional variables
The variables that represent northern, central, southern and western regions are dummy variables. They divide the countries and their regions based on geographical location. The Northern countries consist of Estonia, Lithuania, Latvia, Denmark, Finland and Sweden. The
Eastern countries consist of the Czech Republic, Hungary, Poland, Romania and Slovakia. The Southern countries consist of Cyprus, Greece, Spain, Italy, Malta and Portugal. The Western countries consist of Austria, Belgium, Germany, France, Ireland, Luxembourg, the Netherlands and the United Kingdom.
The total number of hectares of mountainous area in a region (x10,000) stems from EUROSTAT (2017). The number is the same for all the three time periods. The variable serves
as a proxy for remote areas. It is expected that the hectares of mountainous area has a positive effect on the increase of PDO/PGI schemes because the promotion of these regions is one of the aims for the PDO and PGI schemes. Earlier research conducted by Gawron & Theuvsen (2009) shows that the total number of PDOs and PGIs is especially growing in the eastern
European regions. Krystallis et al. (2017) show that also southern regions have better agricultural environment for PDOs and PGIs to thrive. Because of this it is expected that the southern and eastern countries have a positive effect on the increase in uptake of PDO and PGI schemes, and the western and northern countries a negative effect.
Less-favoured areas in a region are measured in hectares (x10,000). The data is on NUTS-2 level and stems from EUROSTAT (2017). Less-favoured areas are areas where “agricultural

Strength2Food D4.1 – Determinants of farmers’ engagement in FQS
46 | P a g e
production activity is more difficult because of natural handicaps” (EC, 2017d). It is expected that the amount of less-favoured area has a positive effect on the increase of PDO and PGI schemes for the same reasons as the mountainous area.
Table 2.1: Descriptive statistics of the independent variables
Variable Name N Mean Std. Dev. Median Min Max Exp. sign
Institutional variables
Number of years in the EU 268 36.108 18.618 40 6 55 + Government support 268 0.459 0.493 0 0 1 +
Food culture 268 0.429 0.496 0 0 1 +
Corruption index 2007 268 6.852 1.667 7.3 3.7 9.4 +
Corruption index 2010 268 0.151 1.064 0.458 -3.130 2.4 +
∆Corruption index between 2007 and 2010 268 -0.359 0.567 -0.5 -1.3 1.1 +
∆Corruption index between 2010 and 2013 268 0.0003 0.420 -0.050 -1.255 1.161 +
Socio-economic variables
Population density in 2007 268 3.528 8.658 1.284 0.026 94.99 -
Population density in 2010 268 3.606 9.036 1.314 0.028 99.721 - Age <35 in 2007 268 0.062 0.030 0.054 0 0.156 +
Age <35 in 2010 268 0.066 0.034 0.060 0 0.249 +
Employment in 2007 268 6.012 7.140 3.6 0 48.4 +
Employment in 2010 268 6.061 7.409 3.6 0 52.3 +
Tourism in 2007 268 3.622 7.823 1.246 0.04 70.652 + Tourism in 2010 268 3.637 7.667 1.150 0.040 64.738 +
∆tourism between 2007 and 2010 268 0.015 0.780 -0.018 -5.914 6.144 +
∆tourism between 2010 and 2013 268 0.541 1.320 0.157 -0.558 13.366 +
GDP per inhabitant in 2007 268 25.608 14.005 24.9 6.7 192.3 -
GDP per inhabitant in 2010 268 24.976 13.265 23.15 6.9 182.1 -
∆GDP per in habitant between 2007 and 2010 268 -0.632 1.846 -0.6 -10.9 5.5 -
∆GDP per in habitant between 2010 and 2013 268 1.265 1.610 1.4 -3.5 12 -
Education in 2007 264 0.290 0.151 0.263 0.034 0.813 -
Education in 2010 264 0.267 0.147 0.246 0 0.783 -
Regional variables
North 268 0.078 0.269 0 0 1 -
East 268 0.190 0.393 0 0 1 + South 268 0.321 0.468 0 0 1 +
West 268 0.410 0.493 0 0 1 -
Hectares of mountainous area 268 9.926 21.091 0 0 160.33 +
Hectares of less favoured area 268 33.043 55.950 18.225 0 525.67 +
Productivity in 2007 268 0.247 0.276 0.165 0.126 2.440 - Productivity in 2010 268 0.261 0.285 0.168 0 2.515 -
∆Productivity between 2007 and 2010 268 0.014 0.077 0.159 -0.497 0.392 -
∆Productivity between 2010 and 2013 268 0.022 0.045 -0.157 0.016 0.403 -
Total number of PDOs/PGIs in 2007 268 3.739 6.169 1 0 44 +
Total number of PDOs/PGIs in 2010 268 4.873 7.316 2 0 49 +
Kilometres of motorway in 2007 268 28.060 29.316 22 0 186 -
Kilometres of motorway in 2010 268 28.787 29.358 23 0 186 -
Kilometres of railway in 2007 268 86.724 97.114 62 0 708 -
Kilometres of railway in 2010 268 87.157 96.150 64 0 676 -
Productivity is measured in standard output per hectare of utilized agricultural area in Euros (x10,000). It is expected that regions that are more productive have a negative effect on the

Strength2Food D4.1 – Determinants of farmers’ engagement in FQS
47 | P a g e
increase in uptake of PDO/PGI schemes as a higher agricultural production in a region is an indication of higher developed areas, while the PDO and PGI schemes are intended for the regions that are less-developed. Again, the differences between the different time periods are also calculated. It is also expected that the difference in productivity also has a negative effect on the increase uptake of PDO/PGI schemes.
Another regional variable is the total number of registered PDO/PGI products within a region
during a period of time. It is expected that the current total level of uptake of PDO/PGI schemes in a region has a positive effect on the increase in PDO/PGI schemes.
Data about kilometres of motorway per 1,000 km2 and kilometres of railways per 1,000 km2 in the years 2007 and 2010 serve as proxies for remote areas and less-favoured areas. It is expected that kilometres of motorway and railways have a negative effect on the increase of PDOs/PGIs because remote regions have fewer kilometres of motorway and railways, and the PDO and PGI schemes are used as a tool to promote these regions.
2.3.3. Empirical model
When observing the data, we see that the dependent variables only consist of positive changes. A vast majority of the observations are 0 in both of the time periods. Figure 2.3 shows that for both time periods the increase in PDOs/PGIs is skewed to the right. To solve for the skewness, a Tobit model is used to estimate the parameters as the Tobit model assumes censored data.
Figure 2.3 The distribution of the change in PDO/PGI uptake between 2007 and 2010 (left) and 2010 and 2013 (right)
The following model can be specified:
∆𝑇𝑜𝑡𝑎𝑙_𝑃𝑡 = 𝛼0 + 𝛼1 𝐼𝑡 + 𝛼2𝑆𝑡 + 𝛼3𝑅𝑡 + 𝜖
Where 𝐼 is a vector that represents the institutional variables, 𝑆 is a vector that represents the
socio-economic variables and 𝑅 is a vector that represents the regional variables. Four different
models can be distinguished. The first two models use data for the time period 2007 to 2010 whereas the latter two are run for the time period of 2010 to 2013. Model 1 and 3 include the variables in levels, whereas model 2 and 4 include variables in differences. Table 2.2 gives an overview of the different variables for each of the four models to be estimated.
147
5136
13 9 4 4 2 1 10
20
40
60
80
100
120
140
160
0 1 2 3 4 5 6 7 9 10
ΔTotal_P2010-2013
145
53
3215
5 7 4 3 1 2 10
20
40
60
80
100
120
140
160
0 1 2 3 4 5 6 7 8 11 12
ΔTotal_P2007-2010

Strength2Food D4.1 – Determinants of farmers’ engagement in FQS
48 | P a g e
Table 2.2: Four different estimation models Dependent variable ∆𝑃𝐷𝑂2007−2010 ∆𝑃𝐷𝑂2010−2013
Model 1 Model 2 Model 3 Model 4
Institutional variables
Number of years in the EU X X X X
Government support X X X X
Food culture X X X X
Corruption index CPI X
Corruption index QoG X
Change Corruption index CPI X
Change Corruption index QoG X
Socio-economic variables
Population density X X X X
Age X X X X
Employment X X X X
Tourism X X
Change Tourism X X
GDP per inhabitant X X
Change in GDP per inhabitant X X
Education X X X X
Regional variables
North X X X X
East X X X X
South X X X X
Hectares of Mountainous area X X X X
Hectares of Less favoured area X X X X
Total number of PDOs/PGIs X X X X
Productivity X X
Change in productivity X X
Kilometres of motorway X X X X
Kilometres of railway X X X X
After the models have been estimated in STATA a Wald test is performed on the significant variables to confirm that the estimated coefficients are different from 0. If the null hypothesis is rejected, this means that the coefficients are not simultaneously equal to zero, and thus including the variables is an improvement for the estimated model (UCLA, 2017a).
Strength2Food D4.1 – Determinants of farmers’ engagement in FQS
49 | P a g e
2.3.4. Results
Annex A2 shows the regression results that were calculated using STATA. The post-estimation
results for the Wald’s test are included. Table 2.3 summarizes the coefficients and their significance for the four different models. It is important to keep in mind that some variables in model 2 and 4 deal with changes whereas these variables in model 1 and 3 deal with levels. This section will discuss the statistical significance of the variables, the magnitude and their
sign. First the most significant variables across the four models are discussed followed by the less significant variables.
Significant in all four models
Table 2.3 shows that the increase in PDOs/PGIs is significantlt influenced by the number of
PDOs/PGIs that were already registered in a region at the start of the period. However, the coefficients of this variable are quite low in the four models as the means of these variables are 3.74 and 4.87 respectively whilst the highest corresponding coefficients are respectively 0.211 and 0.118. Only if the current level of PDOs/PGIs in a certain region are located in the higher
percentiles it seems to have an impact on the increase in PDOs/PGIs. The sign is positive and in line with the prediction.
The eastern regions, hectares of mountainous area and the number of years in the EU are only significant at 1% in the first two models, in the last two models they are only significant at either 5% or 15%. The dummy variable that represents the eastern regions is the most influentia l on the expected increase of PDOs and PGIs when compared with the other geographical dummy
variables. The values of the variable mountainous area run from 0 to around 160. The values of the number of years a region is part of the EU range from 6 to 55. Hence, the older member states have an expected increase in PDOs and PGIs of around 3 while the newer member states around 0.5 in the first two models. In the last two models this effect is less evident. All the signs of these three variables are in line with the predictions.
Significant in three models
Employment seems also to be of importance except for the last model. The employment
variables runs from 0 to around 50 in both 2007 and 2010 with a mean of around 6. The magnitude of the coefficient seems only of importance when employment levels in the agricultural sector are very high. The employment variable is not in line with the expectations. The employment variables all have negative signs so with a high employment in the agricultural sector the increase in PDOs/PGIs is lower.
Significant in two models
Food culture, the level of education, southern and northern regions only have some level of significance in the last two models that are estimating the increase in PDOs/PGIs between 2010
and 2013. It is noteworthy that food culture only has a small effect on the increase of PDOs and PGIs in the first two models and leads to a decrease in the expected increase of PDOs and PGIs of respectively 1.596 and 1.320 for the last two models. The coefficient for education is only high in the last two models that represent the increase in PDOs/PGIs between 2010 and 2013.
The geographical indication for northern and southern regions only have high coefficients for the time period between 2010 and 2013. Of these variables, the food culture variable is the only one not in line with the expectations in the time period between 2010 and 2013. The sign of the coefficients is negative while section 2.3 argued for an expected positive sign.
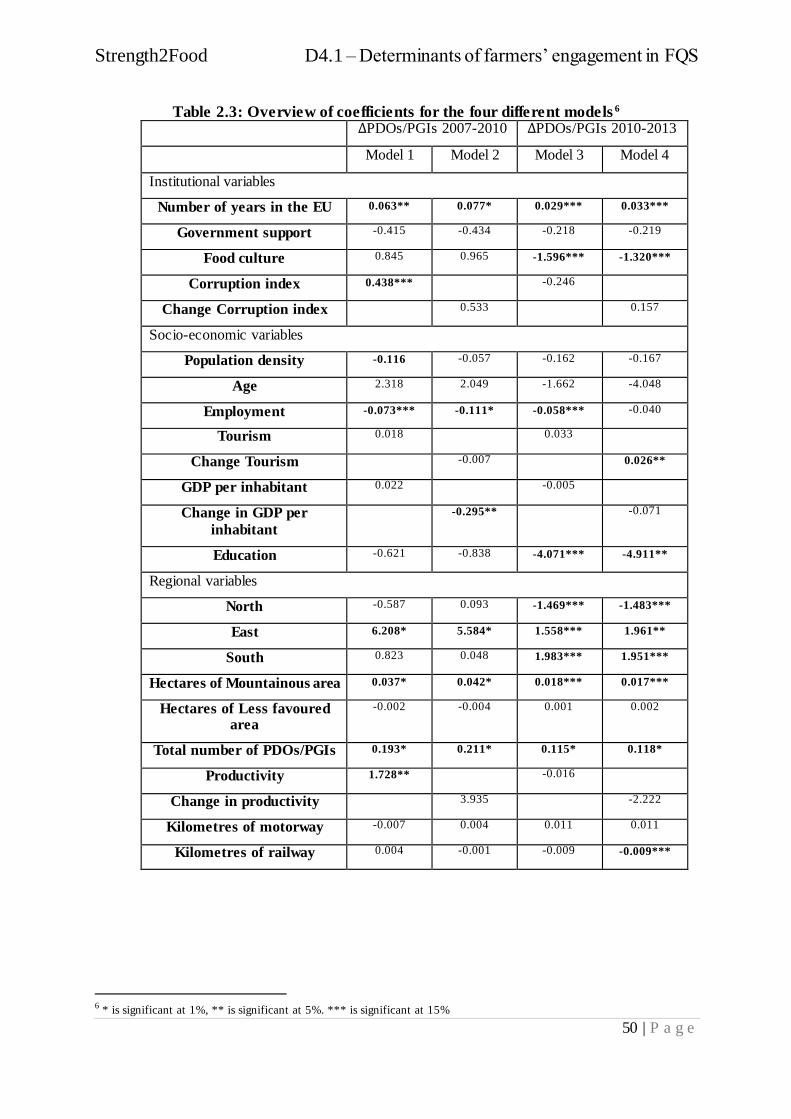
Strength2Food D4.1 – Determinants of farmers’ engagement in FQS
50 | P a g e
Table 2.3: Overview of coefficients for the four different models 6 ∆PDOs/PGIs 2007-2010 ∆PDOs/PGIs 2010-2013
Model 1 Model 2 Model 3 Model 4
Institutional variables
Number of years in the EU 0.063** 0.077* 0.029*** 0.033***
Government support -0.415 -0.434 -0.218 -0.219
Food culture 0.845 0.965 -1.596*** -1.320***
Corruption index 0.438*** -0.246
Change Corruption index 0.533 0.157
Socio-economic variables
Population density -0.116 -0.057 -0.162 -0.167
Age 2.318 2.049 -1.662 -4.048
Employment -0.073*** -0.111* -0.058*** -0.040
Tourism 0.018 0.033
Change Tourism -0.007 0.026**
GDP per inhabitant 0.022 -0.005
Change in GDP per
inhabitant
-0.295** -0.071
Education -0.621 -0.838 -4.071*** -4.911**
Regional variables
North -0.587 0.093 -1.469*** -1.483***
East 6.208* 5.584* 1.558*** 1.961**
South 0.823 0.048 1.983*** 1.951***
Hectares of Mountainous area 0.037* 0.042* 0.018*** 0.017***
Hectares of Less favoured area
-0.002 -0.004 0.001 0.002
Total number of PDOs/PGIs 0.193* 0.211* 0.115* 0.118*
Productivity 1.728** -0.016
Change in productivity 3.935 -2.222
Kilometres of motorway -0.007 0.004 0.011 0.011
Kilometres of railway 0.004 -0.001 -0.009 -0.009***
6 * is significant at 1%, ** is significant at 5%. *** is significant at 15%

Strength2Food D4.1 – Determinants of farmers’ engagement in FQS
51 | P a g e
Significant in only one model
The corruption index, population density, GDP per inhabitant, tourism, productivity and the
kilometres of railway only show some significance in 1 of the four estimated models. The corruption index contributes only little to the first model. If a region scores a 9 on the corruption index the number of PDOs/PGIs increases by 2 more compared to regions that have the low score of 4. The coefficient for population density is only significant in the first model even
though the last two models have higher coefficients, respectively -0.12, -0.16 and 0.17. Given that the variable for population density runs until almost 100, it seems that the population density has a relatively large effect on the increase of PDOs/PGIs. The GDP per inhabitant only has a relatively high coefficient in the second model. The coefficients for tourism do not seem
to influence the increase of PDOs and PGIs despite the significant coefficient of the tourism variable in model 4. The coefficient for productivity only has a noticeable effect in the first model. The productivity coefficients of model 2 and 4 seem high, however, they deal with differences and are not comparable with models 1 and 3. The coefficients of the kilometres of
railway are much higher in the last two estimated models compared to the first two estimated models. The signs of these variables (where significant) are in line with predictions except for the productivity variable where a negative sign was expected in the first model.
No significant effect
The variables with no significant effect in one of the four models are government support, age, hectares of less favoured area and kilometres of motorway.
Summarizing, when comparing the three different groups of variables, the regional variables seem to contribute the most to the model, especially the geographical indicators for east have a big impact on the increase of PDOs and PGIs between 2007 and 2010. All three geographical
indicators are of importance in explaining the increase of PDOs and PGIs between 2010 and 2013. A combination of other variables that vary between the different models help explaining the increase of PDOs and PGIs.
The Tables A.2A to A.2D in the Annex also show the outcome of the Wald test. In all the four estimated models the Wald test is significant, meaning that the coefficients estimated in the models are not simultaneously equal to 0 and thus including the variables is an improvement for the estimated model.
2.4. Discussion & conclusions
The aim of this chapter was to analyse what variables are causing the increase in uptake of PDOs and PGIs over time in European NUTS-2 regions. The Tobit estimations showed that the regional variables were of the most important compared to socio-economic and institutiona l
variables. Especially the dummy variables that represented the eastern regions seemed to have a big effect on the increase on the PDOs and PGIs in both of the time periods. Other regional variables that help to explain the increase of PDOs and PGIs are hectares of mountainous area and the total number of PDOs and PGIs already in a region. For the socio-economic and
institutional variables, the most important variables are the number of years a region is a member of the EU, education levels and to a lesser extent the employment levels in the agricultural sector. High employment shares in the agricultural sector can be linked to the small farm size or with the high consumption of own production, leaving little incentive for product
differentiation. Productivity also has a positive sign whereas a negative sign would be expected. This effect might be caused by the relative low uptake of PDOs and PGIs in some European

Strength2Food D4.1 – Determinants of farmers’ engagement in FQS
52 | P a g e
regions (e.g. Slovenia and Greece) that have low productivity (EC, 2017c). In the second time period these same regions have a higher uptake of PDOs and PGIs, switching the sign.
In 2007 the PDOs and PGIs were mainly located in the south, while there were only few PDOs and PGIs registered in the eastern region. It seems that there is a transition going on from the southern regions towards the eastern regions of the European Union. One of the reasons for this might be the catch up effect caused by the entrance of new member states in the eastern part of
the EU in 2004 and 2007. Earlier research also shows that this increase in PDOs/PGIs in the eastern European regions might be the result from increasing agricultural exports as a consequence of entering the EU (Gawron & Theuvsen, 2009). Further research could include a variable to test for this. Krystallis et al. (2017) also argued that historical differences in
agriculture are of importance in explaining the differences between the different geographical regions. Further research could analyse this.
Some limitations of the research relate to the dataset that was used. Due to data availability, the dataset might have some deficiencies and measurement errors. A number of PDOs and PGIs might overlap with some regions and some of them might not exactly match the NUTS-2 regions as can be seen from the DOOR database (EC, 2017b). Moreover, for some of the
variables, the data are available on country level only and not on the NUTS-2 level. This leads to fewer observations for these variables. Working with institutional variables also causes the problem of multicollinearity. A few variables had to be removed from the model. For instance, Porter (2008) mentioned the importance of government policy as an entry barrier, but this variable was removed due to multicollinearity.
Other limitations relate to the model that were used for the Tobit estimation. This specific model
was chosen due to the dependent variable being skewed and the censored data. Also, the different models used different variables. For instance, model 1 and 3 have absolute values of the independent variables, whilst model 2 and 4 use the changes of these variables. It is not directly clear which of the models are optimal in estimating the increase in uptake of PDOs and PGIs.
Finally, we might have a problem of endogeneity as the causal relation between some of the
explanatory variables and the dependent variable is ambiguous. An example of this is tourism. Belletti et al. (2007) argued that the increase of PDOs and PGIs can lead to the development of tourism. In the first chapter, however, we found that the increase of tourism in a certain region can lead to product differentiation and higher adoption of the PDO and PGI schemes by farmers.
These are two sides of the same coin and tourism might be complementary to the uptake of PDO/PGI schemes as it is not exactly clear what caused what.

Strength2Food D4.1 – Determinants of farmers’ engagement in FQS
53 | P a g e
REFERENCES
Becker, T. (2009). European Food Quality Policy: The importance of Geographical indications ,
Organic Certification and Food Quality Assurance Schemes in European Countries. The Estey Centre Journal of International Law and Trade Policy, 111-130.
Becker, T., & Staus, A. (2008). European food quality policy: the importance of geographical indications, organic certification and food quality insurance schemes in European countries. 12th EAAE Congress. Gent.
Belletti, G., Burgassi, T., Marescotti, A., & Scaramuzzi, S. (2007). The effects of certification costs on the success of a PDO/PGI. Quality management in food chains, 107-121.
Bremmers, H. (2014). Master Thesis on Law and Governance group: DO PDO AND PGI FOODSTUFFS HAVE VALUE ADDED TO STAKEHOLDERS? Wageningen.
EC (2006, maart 20). Publicatieblad van de Europese Unie. Retrieved from VERORDENING (EG) Nr. 510/2006 VAN DE RAAD van 20 maart 2006: http://eur -lex.europa.eu/LexUriServ/LexUriServ.do?uri=OJ:L:2006:093:0012:0025:NL:PDF
EC (2017a, Januari 15). EU agricultural product quality policy. Retrieved from European Commission: https://ec.europa.eu/agriculture/quality_en
EC (2017b, Maart 6). DOOR. Retrieved from Agriculture and Rural Development: http://ec.europa.eu/agriculture/quality/door/list.html?locale=en
EC (2017c, 04 30). Agriculture statistics at regional level. Retrieved from Eurostat: http://ec.europa.eu/eurostat/statistics-
explained/index.php/Agriculture_statistics_at_regional_level#Economic_accounts_for_agriculture
EC (2017d, 30 04). Less favoured areas scheme. Retrieved from Agriculture and rural development development: http://ec.europa.eu/agriculture/rural-development-previous/2007-2013/less-favoured-areas-scheme_en
EUROSTAT (2017). European Commission. Retrieved from http://ec.europa.eu/eurostat/data/database
Folkeson, C. (2005). Geographical Indications and Rural Development in the EU. Lund University Publications.
Galli, F. (2011). A Multi-Criteria Approach to Assessing PDOs/PGIs: An Italian Pilot Study. Int. J. Food System Dynamics 2(3), 219-236.
Gawron, J.-C., & Theuvsen, L. (2009). Certification schemes in the European agri-food sector. Outlook on Agriculture Vol 38, 9-14.
Ilbery, B., & Kneafsey, M. (1999). Registering regional speciality food and drink products in the United Kingdom: the case of PDOs and PGIs. Coventry: Department of Geography, Coventry University.
ILbery, B., Kneafsey, M., & Bamford, M. (2000). Protecting and promoting regional speciality food and drink products in the European Union. Outlook on Agriculture, 31-37.
Krystallis, A., & al, e. (2017, April 24). A Retrospective View on Designation of Origin Labeled Foods in Europe.
Lasseur, B. (2011). The Rate of Diffusion of Innovations, Master thesis. Rotterdam: Erasmus School of Economics.

Strength2Food D4.1 – Determinants of farmers’ engagement in FQS
54 | P a g e
London Economics. (2008). Evaluation of the CAP policy on protected designations of origin (PDO) and protected geographical indications (PGI). London: London Economics. Retrieved from http://londoneconomics.co.uk/wp-content/uploads/2011/09/45-Evaluation-of-the-CAP-policy-on-protected-designations-of-origin-PDO-and-protected-geographical-indications-PGI.pdf
Milieucentraal. (2017, Maart 3). Streekproducten. Retrieved from Keurmerkenwijzer: https://keurmerken.milieucentraal.nl/overzicht/voeding-streekproducten/
Porter, M. E. (1980). Competitive strategy. New York: The free press.
Porter, M. E. (2008). The five competetive forces that shape strategy. Harvard Business Review, 25-40.
QoG. (2017, May 02). QoG EU Regional Data. Retrieved from Data: http://qog.pol.gu.se/data/datadownloads/qogeuregionaldata
Rogers, E. (2003). The Diffusion of Innovations. Fifth Edition. New York: Simon & Schuster.
Skuras, D., & Vakrou, A. (2002). Consumers’ willingness to pay for origin labelled wine: A Greek case study. British Food Journal, Vol. 14 Iss:11, 898-912.
Transparancy International. (2017, May 02). corruption perception index. Retrieved from http://www.transparency.org/research/cpi/overview
UCLA (2017a, 04 29). FAQ:HOW ARE THE LIKELIHOOD RATIO, WALD, AND LAGRANGE MULTIPLIER (SCORE) TESTS DIFFERENT AND/OR SIMILAR? Retrieved from Institute for Digital Research and Education: http://stats.idre.ucla.edu/other/mult -
pkg/faq/general/faqhow-are-the-likelihood-ratio-wald-and-lagrange-multiplier-score-tests-different-andor-similar/
UCLA (2017b, April 15). TOBIT ANALYSIS | STATA DATA ANALYSIS EXAMPLES. Retrieved from Institute for Digital Research and Education: http://stats.idre.ucla.edu/stata/dae/tobit-analysis/
UIS (2011). International Standard Classification of Education. Retrieved from Unesco: http://www.uis.unesco.org/Education/Documents/isced-2011-en.pdf
Vecchio, R., & Annunziata, A. (2011). The role of PDO/PGI labelling in Italian consumers' food choices. Agricultural Economics Review, 80-98.
World Bank (2017). Worldwide Governance Indicators. Retrieved from World Bank: http://info.worldbank.org/governance/wgi/index.aspx#doc

Strength2Food D4.1 – Determinants of farmers’ engagement in FQS
55 | P a g e
ANNEX A.2A: TOBIT OUTPUT AND POST-ESTIMATION STATISTICS FOR MODEL 1
Dependent variable: ∆Total_P between 2007 and 2010. LR chi2(19) = 125.52
Method: Tobit Regression Prob > chi2 = 0.0000
Log-likelihood: -354.02 Pseudo R2: 0.1506
Variable Coefficient Std. error T-Value Prob.
Number of years in the EU 0.063 0.022 2.85 0.005
Government support -0.415 0.533 -0.78 0.437
Food culture 0.845 0.809 1.04 0.298
Corruption index 0.438 0.272 1.61 0.108
Population density -0.116 0.088 -1.32 0.187
Age 2.318 8.144 0.28 0.776
Employment -0.073 0.043 -1.71 0.088
Tourism 0.018 0.025 0.73 0.465
GDP per inhabitant 0.022 0.032 0.68 0.495
Education -0.621 2.588 -0.24 0.811
North -0.587 1.059 -0.55 0.580
East 6.208 1.421 4.37 0.000
South 0.823 1.006 0.82 0.414
Hectares of Mountainous area 0.037 0.012 3.12 0.002
Hectares of Less favoured area -0.002 0.005 -0.51 0.611
Total number of PDOs/PGIs 0.193 0.040 4.84 0.000
productivity 1.728 0.852 2.03 0.044
Kilometres of motorway -0.007 0.011 -0.66 0.512
Kilometres of railway 0.004 0.005 0.78 0.437
Constant -8.421 2.941 -2.86 0.005
Estimate of standard error 2.404 0.166
Left-censored observations: 141 Right-censored observations: 0
Uncensored observations: 123 Total observations: 264
Wald test of all parameters = 0
F(19, 245) = 6.76 Prob. > F = 0.0000
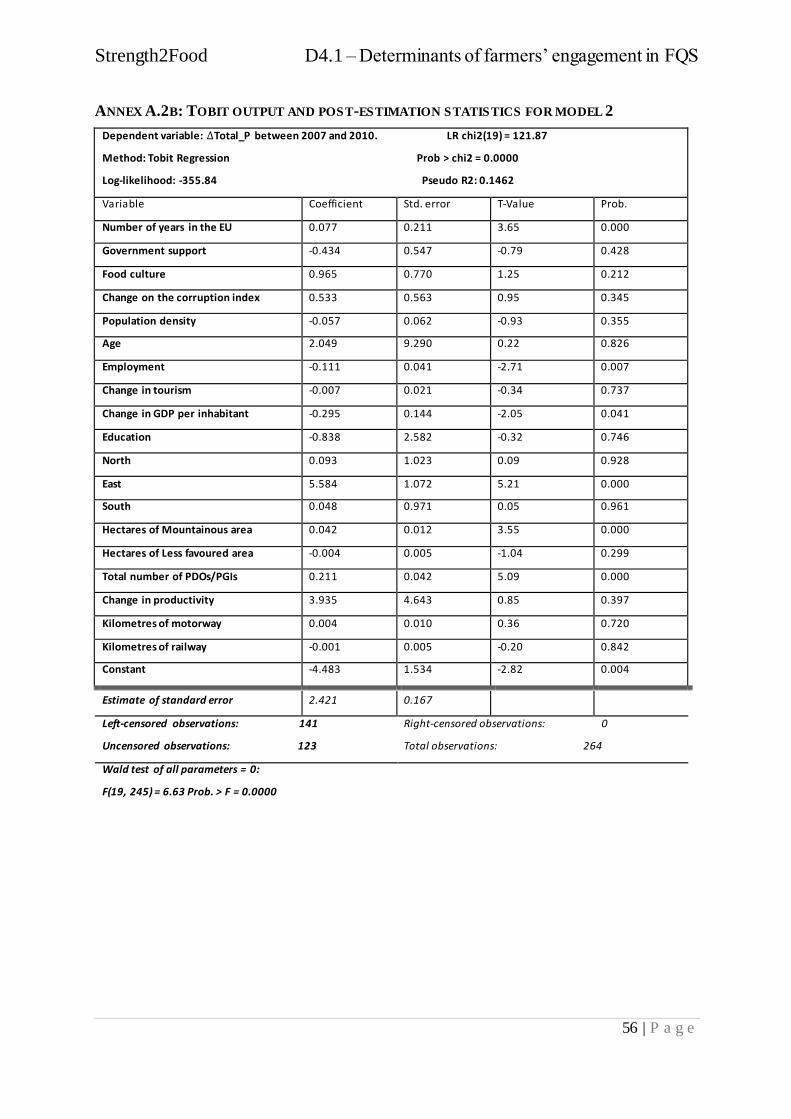
Strength2Food D4.1 – Determinants of farmers’ engagement in FQS
56 | P a g e
ANNEX A.2B: TOBIT OUTPUT AND POST-ESTIMATION STATISTICS FOR MODEL 2
Dependent variable: ∆Total_P between 2007 and 2010. LR chi2(19) = 121.87
Method: Tobit Regression Prob > chi2 = 0.0000
Log-likelihood: -355.84 Pseudo R2: 0.1462
Variable Coefficient Std. error T-Value Prob.
Number of years in the EU 0.077 0.211 3.65 0.000
Government support -0.434 0.547 -0.79 0.428
Food culture 0.965 0.770 1.25 0.212
Change on the corruption index 0.533 0.563 0.95 0.345
Population density -0.057 0.062 -0.93 0.355
Age 2.049 9.290 0.22 0.826
Employment -0.111 0.041 -2.71 0.007
Change in tourism -0.007 0.021 -0.34 0.737
Change in GDP per inhabitant -0.295 0.144 -2.05 0.041
Education -0.838 2.582 -0.32 0.746
North 0.093 1.023 0.09 0.928
East 5.584 1.072 5.21 0.000
South 0.048 0.971 0.05 0.961
Hectares of Mountainous area 0.042 0.012 3.55 0.000
Hectares of Less favoured area -0.004 0.005 -1.04 0.299
Total number of PDOs/PGIs 0.211 0.042 5.09 0.000
Change in productivity 3.935 4.643 0.85 0.397
Kilometres of motorway 0.004 0.010 0.36 0.720
Kilometres of railway -0.001 0.005 -0.20 0.842
Constant -4.483 1.534 -2.82 0.004
Estimate of standard error 2.421 0.167
Left-censored observations: 141 Right-censored observations: 0
Uncensored observations: 123 Total observations: 264
Wald test of all parameters = 0:
F(19, 245) = 6.63 Prob. > F = 0.0000

Strength2Food D4.1 – Determinants of farmers’ engagement in FQS
57 | P a g e
ANNEX A.2C: TOBIT OUTPUT AND POST-ESTIMATION STATISTICS FOR MODEL 3
Dependent variable: ∆Total_P between 2010 and 2013 LR chi2(19) = 98.74
Method: Tobit Regression Prob > chi2 = 0.0000
Log-likelihood: -345.56 Pseudo R2: 0.1250
Variable Coefficient Std. error T-Value Prob.
Number of years in the EU 0.029 0.021 1.37 0.171
Government support -0.218 0.519 -0.42 0.674
Food culture -1.596 0.877 -1.82 0.070
Corruption index -0.246 0.268 -0.92 0.360
Population density -0.162 0.147 -1.10 0.274
Age -1.662 8.543 -0.19 0.846
Employment -0.058 0.035 -1.62 0.107
Tourism 0.033 0.026 1.27 0.206
GDP per inhabitant -0.005 0.034 -0.16 0.873
Education -4.071 2.456 -1.66 0.099
North -1.469 1.010 -1.45 0.147
East 1.558 1.061 1.47 0.143
South 1.983 1.041 1.90 0.058
Hectares of Mountainous area 0.018 0.011 1.64 0.102
Hectares of Less favoured area 0.001 0.004 0.35 0.727
Total number of PDOs/PGIs 0.115 0.032 3.56 0.000
productivity -0.016 0.986 -0.02 0.987
Kilometres of motorway 0.011 0.014 0.76 0.447
Kilometres of railway -0.009 0.007 -1.44 0.153
Constant 0.297 1.637 0.18 0.856
Estimate of standard error 2.326 0.165
Left-censored observations: 144 Right-censored observations: 0
Uncensored observations: 120 Total observations: 264
Wald test of all parameters = 0:
F(19, 245) = 4.39 Prob. > F = 0.0000

Strength2Food D4.1 – Determinants of farmers’ engagement in FQS
58 | P a g e
ANNEX A.2D: TOBIT OUTPUT AND POST-ESTIMATION STATISTICS FOR MODEL 4
Dependent variable: ∆Total_P between 2010 and 2013. LR chi2(19) = 100.62
Method: Tobit Regression Prob > chi2 = 0.0000
Log-likelihood: -344.62 Pseudo R2: 0.1274
Variable Coefficient Std. error T-Value Prob.
Number of years in the EU 0.033 0.021 1.59 0.113
Government support -0.219 0.517 -0.42 0.672
Food culture -1.320 0.880 -1.50 0.135
Change on the corruption index 0.157 0.523 0.30 0.766
Population density -0.167 0.139 -1.20 0.232
Age -4.048 8.275 -0.49 0.625
Employment -0.040 0.033 -1.20 0.232
Change in tourism 0.026 0.013 1.98 0.049
Change in GDP per inhabitant -0.071 0.175 -0.41 0.682
Education -4.911 2.309 -2.13 0.034
North -1.483 1.000 -1.48 0.139
East 1.961 0.967 2.03 0.044
South 1.951 1.026 1.90 0.058
Hectares of Mountainous area 0.017 0.113 1.51 0.132
Hectares of Less favoured area 0.002 0.004 0.37 0.715
Total number of PDOs/PGIs 0.118 0.032 3.69 0.000
Change in productivity -2.222 4.410 -0.50 0.615
Kilometres of motorway 0.011 0.136 0.81 0.417
Kilometres of railway -0.009 0.006 -1.53 0.127
Constant 0.182 1.364 0.13 0.894
Estimate of standard error 2.309 0.164
Left-censored observations: 144 Right-censored observations: 0
Uncensored observations: 120 Total observations: 264
Wald test of all parameters = 0:
F(19, 245) = 4.50 Prob. > F = 0.0000
Strength2Food D4.1 – Determinants of farmers’ engagement in FQS
59 | P a g e
3. DETERMINANTS OF FARMERS’ PARTICIPATION IN FOOD QUALITY SCHEMES IN ITALY: A
FARM-LEVEL ANALYSIS BASED ON FADN DATA – SONIA MARONGIU & LUCA CESARO7
3.1. Introduction
The food quality improvement and the implementation of Food Quality Systems (FQS) in the EU Member States, has been part of the EU agricultural policy since the beginning of the 90s.
Quality is an important topic for every farmer and buyer, whether dealing with commodities produced in accordance to basic standards or with high-end quality products. Competitiveness and profitability depend often on the high quality reputation of production. The standards of European products are guaranteed with a specific legislation and strict specifications of EU quality schemes, mainly the geographical indications and the organic farming systems.
Before 1992, some EU Member States established their own rules to encourage and protect
specific foodstuffs applying different rules in their own national systems (mainly wine quality labelling as, for instance, the French AOC - Appellation d’Origine Contrôlée - or the Italian DOC - Denominazione d’Origine Controllata). In 1992 the EU introduced a system to protect and promote traditional and regional food products, protecting their names and establishing the
conditions under which they could be used so that their specific and traditional character could be preserved. Since then, the EU protects by legislation particular product names which are linked to the territory or to a production method. It has developed three “quality logos” that help producers to market their products better, providing them legal protection from misuse or
falsification of a product name. Two logos have a strong geographical element, referring to a geographical indication closely linked to a specific production areas: the Protected Designation of Origin (PDO) and the Protected Geographical Indication (PGI). One logo relates to traditional production methods: the Traditional Speciality Guaranteed (TSG).
The first regulation for organic farming and the labelling of organic farm produce and foods was adopted in 1991. Organic farming is a way to producing food that respects natural life
cycles, minimizing the human impact on the environment and operating as naturally as possible. The benefits of organic food production are linked to the environmental protection, food quality and animal welfare: all these benefits are guaranteed to consumers thanks to a certification and a specific logo.
The analysis presented in this chapter is based on these EU quality schemes, very important in Italy, leader in the European Union for EU quality-food protection labels. Two geographical
indications (PDO and PGI) and the organic labelling are taken into account to explain the determinants of farmers’ participation in food quality schemes. The analysis is based on the FADN dataset, that collects information concerning the certification schemes of all the holdings included in the sample.
The work is divided in different sections. Section two contains a general overview of the PDO/PGI/TSG label in Italy and the organic farming in terms of number of certified products
and distribution in the whole national territory. The high number of certified products reflects the rich diversity of traditions in every Italian region and the specific characteristics linked to the geographical origin. The main aim of the analysis is to explain the determinants influencing the participation in FQS. Determinants are identified using a Logistic Binary Regression, where
the decision to uptake the specific FQS (geographical denomination or organic farming) depends on a set of selected explanatory variables, some of them belonging to the FADN
7 We are grateful to Coldiretti for useful insights that have contributed to the development of this chapter.

Strength2Food D4.1 – Determinants of farmers’ engagement in FQS
60 | P a g e
dataset, others collected from external sources (Eurostat, Italian Ministry of Agriculture). Section three describes the structure of the FADN dataset and the variables selected as determinants. It is important to note that the sampling method applied to define the FADN sample is based on the economic size and the type of farming and, as a consequence, it is not
representative of all the universe of certified farms. The results of the econometric model are discussed in section four: the same model is applied for PDO/PGI scheme and for organic farming and the different signs of coefficients help us to understand why and what type of farms are likely to engage in FQS.
3.2. Food Quality Systems in Italy: the geographical indication system and organic farming
3.2.1. Geographical Indications in Italy: PDO, PGI, TSG
Italy is the European country with the highest number of geographical certifications granted by the European Union, followed by France (226 certifications in the food sector and 432 certifications in the wine sector). The quality-certified products in Italy at 31 December 2015 included 799 PDO and PGI and 2 TSG, generating a value of production close to 13.4 billion
euros (about 10% of the agro-food industry turnover) and an export value of 7.1 billion euros (about 21% of the whole agro-food export) (ISMEA- Qualivita, 2016).
The FQS based on the geographical indication is divided in two groups: the food sector and the wine sector. Table resumes the importance of the PDO/PGI/TSG system in Italy8.
Table 3.1: Geographical Indication in Italy at 31 December 2015: a global framework
Food Sector Wine Sector
Number of PDO 164 405
Number of PGI 112 118
Number of TSG 2 -
Total PDO/PGI 278 523
Number of Consortiums 124 95
Certified production (quantity) 1.5 million tonnes 2.8 billion bottles
Value of production (€) 6.4 billion 7.0 billion
Export value (€) 2.8 billion 4.3 billion
Source: ISMEA-Qualivita, 2016
The only 2 TSG in Italy are the mozzarella and Neapolitan pizza. TSG does not refer to an
origin, but the objective is the promotion of a traditional composition of the product or a traditional production method.
The Regions with the most PDO/PGI products, including both the food and wine sector, are Veneto, Tuscany and Piedmont (Table 3.1).
8 At July 2017, there were 293 PDO/PGI/TSG registered in the food sector and 523 PDO/PGI in the wine sector
(Italian Ministry of Agriculture and Forestry).

Strength2Food D4.1 – Determinants of farmers’ engagement in FQS
61 | P a g e
Table 3.1: Number of Geographical Indications in Italy at 31 December 2015
Food Sector Wine sector Total PDO/PGI/TSG
PDO PGI Total* PDO PGI Total PDO PGI All
Abruzzo 6 3 11 9 8 17 15 11 28
Basilicata 5 4 11 5 1 6 10 5 17
Calabria 12 5 19 9 10 19 21 15 38
Campania 13 9 24 19 10 29 32 19 53
Emilia Romagna 18 23 43 20 9 29 38 32 72
Friuli Venezia Giulia 5 1 8 14 3 17 19 4 25
Lazio 15 11 28 30 6 36 45 17 64
Liguria 2 2 6 8 4 12 10 6 18
Lombardy 20 12 34 27 15 42 47 27 76
Marche 6 6 14 20 1 21 26 7 35
Molise 5 1 8 4 2 6 9 3 14
Piedmont 13 8 23 58 - 58 71 8 81
Apulia 12 6 20 32 6 38 44 12 58
Sardinia 6 1 9 18 15 33 24 16 42
Sicily 17 12 31 24 7 31 41 19 62
Tuscany 15 13 30 52 6 58 67 19 88
Trentino - South Tyrol 9 5 16 8 4 12 17 9 28
Umbria 4 5 11 15 6 21 19 11 32
Aosta Valley 4 0 6 1 - 1 5 0 7
Veneto 18 18 38 42 10 52 60 28 90
Italy 164 112 278 405 118 523 569 230 801
* Two TSG are registered in Italy (Pizza Napoletana and Mozzarella): they are included in the total of every region. Source: ISMEA-Qualivita, 2016
At the end of 2015, 9 additional GI labels have been registered in Italy: 3 PDO and 6 PGI. The “food” sectors with the highest number of certifications are fruit, vegetable and cereals (106
products; 38% of the total), cheese (51; 18%), extra-virgin olive oils (43; 16%) and meat preparations (40; 14%).
In 2015, there were 80,010 certified operators in Italy (Table 3.3), up by 160 units (+ 0.2%) from 2014: 91.1% were exclusively involved in production activities and 5.7% in product transformation; the remaining 2.2% performed both activities. 6,620 new certified operators have been recorded in 2015 (6,233 producers and 1,169 transformers) while the number of
exiting operators has been lower (6,458 units: 5,341 producers and 864 transformers), determining a positive balance in the number of operators. Even if producers (75,463 units) are present in every Italian Region, more than half (52.2%) is concentrated in three Regions: Sardinia (19.7%), Tuscany (17.0%), Trentino-South Tyrol (15.5%). Livestock farms are
particularly concentrated in those regions traditionally specialized in pig farming and in the dairy sector: Sardinia (38% of the total), Lombardy (14%), Emilia Romagna (10.7%) and Veneto (7.8%). Among producers, the cheese sector is particularly highly represented (26,042 units, equal to 34.5% of the total), followed by olive oil (19,567 or 25.9%) and fruit, vegetables
and cereals (17,061 or 22.6%). Producers use 170,266 hectares of agricultural surface (+4.6%

Strength2Food D4.1 – Determinants of farmers’ engagement in FQS
62 | P a g e
compared to 2014) obtaining 154 PDO/PGI and manage 39,307 livestock farms (-5.1% compared to 2014) obtaining 85 PDO/PGI (ISTAT, 2016).
In the processing system (7,150 units), the most important sector is the production of extra-virgin olive oil (1,811 or 25.3% of the total), followed by cheese (1,529 or 21.4%) and fruit, vegetables and cereals (1,350 or 18.9%). More than half of the processors work in four Regions in Central and Northern Italy: Emilia Romagna (20.8%), Tuscany (16.7%), Veneto (6.9%) and Lombardy (6.8%).

Strength2Food D4.1 – Determinants of farmers’ engagement in FQS
63 | P a g e
Table 3.3: PDO/PGI/TSG certified operators in Italy per Region, macro-area, altitude
and gender (number and hectares)
Production system Processing system Total certified
operators Producers (a) Livestock farms Area Processors Plants
N. % N. % Ha % N. % N. % N. (b) %
Regions
Abruzzo 963 1.3 458 1.2 1,441 0.8 202 2.8 322 3.1 1,074 1.3
Basilicata 112 0.1 38 0.1 175 0.1 41 0.6 54 0.5 135 0.2
Calabria 494 0.7 57 0.1 5,049 3.0 326 4.6 397 3.8 637 0.8
Campania 2,754 3.6 1,514 3.9 1,970 1.2 513 7.2 756 7.2 3,117 3.9
Emilia Romagna 5,037 6.7 4,187 10.7 6,110 3.6 1,490 20.8 2,164 20.7 6,277 7.8
Friuli Venezia Giulia 782 1.0 777 2.0 55 0.0 92 1.3 129 1.2 858 1.1
Lazio 2,607 3.5 2,011 5.1 2,977 1.8 379 5.3 561 5.4 2,836 3.5
Liguria 1,347 1.8 - - 2,681 1.6 158 2.2 213 2.0 1,420 1.8
Lombardy 5,882 7.8 5,486 14.0 1,505 0.9 485 6.8 769 7.4 6,236 7.8
Marche 702 0.9 689 1.8 128 0.1 172 2.4 348 3.3 857 1.1
Molise 172 0.2 87 0.2 378 0.2 29 0.4 57 0.5 196 0.2
Piedmont 2,653 3.5 1,728 4.4 5,116 3.0 227 3.2 327 3.1 2,810 3.5
Apulia 2,714 3.6 84 0.2 26,021 15.3 379 5.3 478 4.6 3,028 3.8
Sardinia 14,894 19.7 14,918 38.0 985 0.6 175 2.4 229 2.2 14,952 18.7
Sicily 2,768 3.7 80 0.2 17,694 10.4 365 5.1 472 4.5 2,999 3.7
Tuscany 12,844 17.0 1,539 3.9 66,497 39.1 1,193 16.7 1,793 17.2 13,334 16.7
Trentino-South Tyrol 11,723 15.5 1,176 3.0 21,866 12.9 88 1.2 125 1.2 11,809 14.8
Umbria 2,051 2.7 702 1.8 7,046 4.1 233 3.3 378 3.6 2,197 2.7
Aosta Valley 693 0.9 710 1.8 - - 112 1.6 222 2.1 729 0.9
Veneto 4,271 5.7 3,066 7.8 2,573 1.5 491 6.9 653 6.3 4,509 5.6
Macro-area
North Italy 32,388 42.9 17,130 43.6 39,905 23.5 3,143 44.0 4,602 44.1 34,648 43.3
Central Italy 18,204 24.1 4,941 12.6 76,469 45.0 1,977 27.7 3,080 29.5 19,224 24.0
South Italy 24,871 33.0 17,236 43.8 53,712 31.6 2,030 28.4 2,765 26.5 26,138 32.7
Altitude (c)
Mountains 20,950 27.6 7,469 19.0 36,643 21.5 1,230 17.1 1,791 17.1 21,627 26.9
Hilly areas 36,683 48.3 17,506 44.5 103,778 61.0 3,773 52.5 5,492 52.6 38,924 48.3
Flat areas 18,250 24.1 14,332 36.5 29,845 17.5 2,185 30.4 3,164 30.3 19,954 24.8
Gender
Men 60,281 79.9 34,262 87.2 128,478 75.5 6,119 85.6 9,098 87.1 64,400 80.5
Women 15,182 20.1 5,045 12.8 41,788 24.6 1,031 14.4 1,349 12.9 15,610 19.5
Italy 75,463 100 39,307 100 170,086 100 7,150 100 10,447 100 80,010 100
(a): a producer can manage one or more livestock farms (b): an operator can be producer and transformer. (c): the operators are distributed in the different altitudinal regions according to the distribution of surfaces,
livestock farms or plants. The total could be different from what calculated in the other variables. Source: ISTAT, 2016

Strength2Food D4.1 – Determinants of farmers’ engagement in FQS
64 | P a g e
Over three quarters of producers (75.9%) are located in mountainous and hilly areas (Table 3.3.3).
The majority of operators are men (79.9% of producers and 85.6% of processors).
3.2.2. Organic farming in Italy
At 31 December 2015 the number of organic farms in Italy amounted to 59,959: 45,222 producers, 7,061 processors, 7,366 being both primary producers and processors, 310 marketing firms. The area under organic cultivation is 1,492,579 hectares. The two-years period
2014-2015 can be considered as a period of growth for the Italian organic sector: compared to 2014, the number or organic operators has increased (+8.2%) as well as the organic surface (+7.5%). During 2015, more than 4,500 farms in about 104,000 hectares have decided to convert their farm toward the organic production (SINAB, 2017). More or less 12% of the
Utilized Agricultural Area (UAA) in Italy is occupied by organic farming systems, accounting for 3.6% of the agricultural farms (ISTAT SPA, 2013).
The Regions with the highest number of organic operators (Table ) are Sicily (11,326; +17.2% compared to 2014), Calabria (8,684; -1.2%), Apulia (6,685; +1.3%). These Regions accounted for about 45% of the total organic operators. In particular the number of processors and importers have increased in the two-years period 2014-2015 (+14.4%) (RRN, 2017). Regarding
producers, 66.5% of these work in Southern Italy while 23.9% is located in the North and 9.6% in the Central part. On the other hand, the number of processors seems to be most important in the North of Italy (6.7%) than in the Southern part (6.5%), highlight ing a kind of duality of organic agriculture in Italy that has always registered the production in the South and food
processing in the North. However, it is interesting to note that there has been an increase in processors in the Southern Regions: +15.1% in 2015, more than the North (+14.4%) and the Italian average (+14.4%) (RRN, 2017).

Strength2Food D4.1 – Determinants of farmers’ engagement in FQS
65 | P a g e
Table 3.4: Number of organic operators in Italy in 2015
Producers Producers/
Processors Processors Importers
Total
2015
Total
2014
2014-15
(%) %
%
farms*
Sicily 9,807 813 694 12 11,326 9,660 17.2 18.9 5.2
Calabria 7,583 833 262 6 8,684 8,787 -1.2 14.5 6.5
Apulia 4,815 1,234 628 8 6,685 6,599 1.3 11.1 2.4
Tuscany 3,087 1,134 528 26 4,775 4,156 14.9 8.0 6.3
Emilia Romagna 2,773 303 812 51 3,939 3,876 1.6 6.6 4.8
Lazio 2,682 375 383 10 3,450 3,247 6.3 5.8 3.7
Sardinia 2,287 133 81 0 2,501 2,407 3.9 4.2 4.7
Marche 1,950 288 210 5 2,453 2,187 12.2 4.1 5.5
Piedmont 1,374 432 458 44 2,308 2,120 8.9 3.8 3.0
Veneto 1,180 312 770 42 2,304 1,880 22.6 3.8 1.3
Campania 1,394 251 375 13 2,033 2,016 0.8 3.4 1.4
Lombardy 839 285 741 56 1,921 1,700 13.0 3.2 2.3
Abruzzo 1,197 215 216 3 1,631 1,461 11.6 2.7 2.2
Umbria 1,124 266 150 6 1,546 1,217 27.0 2.6 4.1
Basilicata 1,055 102 76 0 1,233 1,225 0.7 2.1 2.5
South Tyrol 662 115 236 9 1,022 1,092 -6.4 1.7 4.1
Trentino 658 82 132 1 873 652 33.9 1.5 4.8
Friuli Venezia Giulia 305 92 131 6 534 441 21.1 0.9 2.0
Liguria 221 62 125 12 420 389 8.0 0.7 1.7
Molise 158 28 46 0 232 230 0.9 0.4 0.9
Aosta Valley 71 11 7 0 89 91 -2.2 0.1 2.9
Italy 45,222 7,366 7,061 310 59,959 55,433 8.2 100.0 3.6
North Italy 8,083 1,694 3,412 221 13,410 12,241 9.5 26.6
Central Italy 8,843 2,063 1,271 47 12,224 10,807 13.1 10.2
South Italy 28,296 3,609 2,378 42 34,325 32,385 6.0 63.2
Source: SINAB, 2017; *ISTAT SPA 2013
As far as the agricultural area is concerned (Table 3.5), the results are similar: Sicily, with 345,071 hectares is the most important Region in terms of organic area, followed by Apulia (180,918 hectares) and Calabria (170,290 hectares). These three Regions account for 44.5% of
the total organic area. As a consequence, organic systems are most widespread in the South of Italy where 63.1% of the whole organic surface in Italy is cultivated.
The incidence of organic area on the total cultivated area is particularly high in Calabria (31.5% of the total agricultural area is organic), followed by Sicily (25.1%), Tuscany and Lazio (both with 18.7%). Veneto is the Region with the lowest incidence: only 2.1% of the agricultural area is organic.

Strength2Food D4.1 – Determinants of farmers’ engagement in FQS
66 | P a g e
Table 3.5: Organic area in the Italian Regions
31/12/2014 31/12/2015 2014-15%
Variation %
In Italy
% organic
area*
Sicily 303,066 345,071 13.9 23.1 25.1
Apulia 176,998 180,918 2.2 12.1 14.5
Calabria 160,164 170,290 6.3 11.4 31.5
Sardinia 149,947 146,050 -2.6 9.8 12.8
Tuscany 118,630 131,796 11.1 8.8 18.7
Lazio 110,277 111,245 0.9 7.5 18.7
Emilia Romagna 88,899 100,011 12.5 6.7 9.6
Marche 57,030 63,021 10.5 4.2 14.1
Basilicata 48,255 49,904 3.4 3.3 10.1
Umbria 30,875 34,468 11.6 2.3 11.3
Piedmont 31,656 34,136 7.8 2.3 3.6
Lombardy 23,352 29,511 26.4 2.0 3.2
Abruzzo 25,022 29,032 16.0 1.9 6.6
Campania 20,548 19,139 -6.9 1.3 3.5
Veneto 15,773 17,419 10.4 1.2 2.1
South Tyrol 6,413 6,934 8.1 0.5 3.0
Trentino 6,612 6,173 -6.6 0.4 4.9
Friuli Venezia Giulia 3,701 5,149 39.1 0.3 2.4
Molise 4,611 5,062 9.8 0.3 2.9
Liguria 2,902 3,834 32.1 0.3 9.1
Aosta Valley 3,621 2,977 -17.8 0.2 5.6
Italy 1,387,913 1,492,579 7.5 100 12.0
North Italy 374,181 404,371 8.1 27.1
Central Italy 130,997 145,714 11.2 9.8
South Italy 882,735 942,494 6.8 63.1
Source: SINAB, 2017; *ISTAT SPA 2013
3.3. Characteristics of the FADN dataset
The analysis is implemented using the Italian Farm Accountancy Data Network (FADN) dataset
for the 3-years period 2013-2015. FADN is a European system of sample surveys conducted every year to collect accountancy data from agricultural holdings, with the aim of monitoring the income and business activities of the EU agricultural system. FADN is the only source of microeconomic data based on harmonized bookkeeping principles. In order to reflect the
farming diversity and heterogeneity of FADN’s field of observation, the Liaison Agency (responsible for the FADN survey in each Member State) selects the stratified sample on the basis of three criteria: Region, Type of Farming and Economic Size. The Type of Farming is defined in terms of the relative importance of the different activities on the farm, measured as
a proportion of each activity’s Standard Output on the farm’s total Standard Output9. Not all agricultural holdings are included in the FADN sample but just those which, due to their
9 The Standard Output of an agricultural product (crop or livestock) is the average monetary value of the output at farm-gate price in euros per hectare or head of livestock.
Strength2Food D4.1 – Determinants of farmers’ engagement in FQS
67 | P a g e
economic size, are considered as “commercially viable”. This threshold differs in the Member States: in Italy only holdings with a Standard Output equal to or greater than 8,000 € are taken into account.
Each farm surveyed in FADN is classified in a specific category according to specific certification schemes. There are three certification levels in Italian FADN:
1. Farm level: it includes 19 different codes referred to the farm as a whole (conventional, Good Agricultural Practice, Low environmental impact, organic farming, mixed farming: organic and conventional, Good environmental conditions, UNI EN ISO
codes, audit schemes, etc.); 2. Process level: it includes 15 different codes referred to the process certification (PDO/
PGI, HACCP, organic cultivation, vineyard for quality wine DOC/DOCG, traditional agri-food products, private collective marks, certified integrated production, etc.);
3. Product level: it includes 14 different codes referred to the final product (PDO/PGI/TSG, organic product, quality wine DOC/DOCG, high quality mark, etc.).
In this analysis, only farms with organic certification (farm level) and PDO/PGI-DOC/DOCG certification (process level) have been considered. With regard to geographical indications, the Italian denomination used for wine (DOC – Denominazione di Origine Controllata; DOCG – Denominazione di Origine Controllata e Garantita) have been treated as PDO/PGI marks.
In this analysis, not all the farms surveyed in each year have been selected but duplicate cases have been deleted from the dataset. The analysis included 8,774 farms.
Table 3.2 describes the variables used in the LOGIT model.
The dependent variable is a dummy that takes the value of 1 in case of participation in a FQS: PDO/PGI scheme10 or Organic farming. 17% of surveyed farms are engaged in the PDO or PGI scheme while 11.6% of them are classified as organic farming.
In order to analyse the determinants, the independent variables are classified into 4 groups:
Localization: farms have been classified following different criteria. Two of them are socio-economic (less favoured area and inner areas), other two concern the altitude (mountain and hilly areas) and one is geographical (south of Italy, including the
islands). The inclusion of farms in Inner Areas has been on the basis of the classification used in the Italian Strategy for Inner Areas, that focuses mainly on the distance of the single municipalities from the centres where the main services are available (health, education and transport). This is a specific classification which has been applied in
other analysis based on the Italian FADN (Marongiu and Cesaro, 2016, 2017), where all the holdings are geo-referenced on the basis of the municipality.
Farm features: four Type of Farming (TF) are considered together with two variables concerning the specialization and diversification of activities. The specialization
includes those farm strategies based on the cultivation of different crops or on the combination of crop and livestock (in FADN there are 4 specialized Type of Farming and 3 mixed Type of Farming). The diversification can be defined as the reallocation or recombination of farm resources away from its original farming activity in order to
generate another form of income (agro-tourism, accommodation, on farm processing, etc.). With regard to the farm size, the hectares of UAA represent the structural
10 Also in this chapter TSG have been excluded from the analysis. The reasons for this are: (i) there are only 2 TSG registered in the whole of Italy; (ii) TSGs cannot be attributed to a specific region and can therefore also not be explained by regional indicators.

Strength2Food D4.1 – Determinants of farmers’ engagement in FQS
68 | P a g e
dimension while the Economic Size is represented in terms of Standard Output (SO). Small farms are those farms who has less than 25,000 € of SO.
Farmer features: the age of the entrepreneurs and their level of education are considered as two important characteristics. 40 years of age is considered as the
threshold for being a 'young' farmer. An education level below secondary schooling is considered low education. In the whole sample, 44.2% of the farmers have a high education.
External characteristics: the“food culture” in each Region is represented by the number
of traditional foods as indicated by the Italian Ministry of Agriculture. Foods with PDO, PGI and TSG designations are not included in this list. The number of establishments, bedrooms and bed places are considered as a variable linked to tourism and strictly
linked with the development of the territory. As economic factor, the Gross Domestic Product per inhabitant can be considered correlated with the presence of quality schemes. The population density is reported at municipality level and it is considered as a proxy for the urbanisation degree.

Strength2Food D4.1 – Determinants of farmers’ engagement in FQS
69 | P a g e
Table 3.2: Description of the variables used in the LOGIT model
Variable name Description Unit of measure Mean
Dependent variables: participation in Food Quality Schemes
PDO_PGI Participation in PDO or PGI scheme Dummy yes = 17.0%
ORG Organic farming Dummy yes = 11.6%
Independent variables
Localization
lfa 1 if the farm is located in Less Favoured Areas (totally) Dummy yes = 52.5%
inn_areas3 1 if the farm is located in Inner Areas Dummy yes = 47.7%
inner_flat3 1 if the farm is located in the flat areas of Inner Areas Dummy yes = 8.3%
mount 1 if the farm is located in mountainous areas Dummy yes = 20.0%
hilly 1 if the farm is located in hilly areas Dummy yes = 47.5%
south 1 if the farm is located in south and islands Dummy yes = 35.9%
Farm features
crops 1 if farm is specialized in arable crops Dummy yes = 26.9%
hort 1 if farm is specialized in horticulture Dummy yes = 6.2%
perm 1 if farm is specialized in permanent crops Dummy yes = 27.4%
liv 1 if farm is specialized in livestock Dummy yes = 22.0%
spec 1 if farm is specialized or mixed Dummy yes = 87.5%
diver 1 if the farm diversificates the activities Dummy yes = 10.5%
farm_size Utilized Agricultural Area (UAA) Standardized 0.0
econ_size 1 if farm is more than 25,000 € SO Dummy yes = 73.3%
Farmer features
less_40 1 if the farmer has less than 40 years Dummy yes = 15.8%
edu 1 if the farmer has a medium-high education Dummy yes = 44.2%
External characteristics
dens_m1 Population density inhabitants/kmq 240.0
tr_food2 Traditional food in the Region n. 265
tour_est1 Establishment, bedrooms, bed-places n./kmq 0.4
GDP_in GDP per inhabitant in the Province Standardized 0.0 Source: Italian FADN database, Eurostat1, Italian Ministry of Agriculture2, Strategy for Inner Areas 3
3.4. Results of the econometric model
Estimations are carried out in SPSS, using the LOGIT regression function. The model’s goodness of fit is assessed with the Hosmer-Lemeshow test based on the chi-square test. The results show that model performs well.
3.4.1. Determinants of farmers participation in PDO and PGI scheme
Table 3.3 shows the results of the application of LOGIT model to all the variables considered in the analysis.

Strength2Food D4.1 – Determinants of farmers’ engagement in FQS
70 | P a g e
Table 3.3: Estimates for the PDO and PGI participation scheme
B E.S. Wald Sig. Exp(B) p
Localization
lfa -0.4145 0.0818 25.6558 0.0000 0.6607 ***
inn_areas -0.1431 0.0837 2.9251 0.0872 0.8666 *
inn_flat 0.5268 0.1654 10.1442 0.0014 1.6936 ***
mount 0.5937 0.1462 16.4947 0.0000 1.8108 ***
hilly 1.0279 0.1043 97.1968 0.0000 2.7953 ***
south -0.4267 0.1113 14.6864 0.0001 0.6527 ***
Farm features
crops 0.0265 0.2386 0.0123 0.9117 1.0268
hort 0.0899 0.2909 0.0954 0.7574 1.0940
perm 3.1204 0.2183 204.2896 0.0000 22.6545 ***
liv 0.4157 0.2341 3.1540 0.0757 1.5154 *
spec -1.8612 0.2274 67.0115 0.0000 0.1555 ***
diver 0.1285 0.1039 1.5295 0.2162 1.1371
Zfarm_size 0.0798 0.0336 5.6357 0.0176 1.0831 **
econ_size 0.8567 0.0854 100.7068 0.0000 2.3553 ***
Farmer features
less_40 -0.0426 0.0962 0.1964 0.6576 0.9583
qualif 0.1484 0.0717 4.2906 0.0383 1.1600 **
External characteristics
dens_m -0.0003 0.0001 7.1983 0.0073 0.9997 ***
tour_est 0.5074 0.0766 43.8976 0.0000 1.6609 ***
GDP_in(z) 0.3236 0.0532 36.9588 0.0000 1.3821 ***
Intercept -2.6147 0.1449 325.7833 0.0000 0.0732 ***
Hosmer-Lemeshow Chi-squared 43.234 0.0000 ***
Source: elaboration on Italian FADN database and Eurostat; Level of significance: *** p<0.01; ** p<0.05; * p<0.1
Since the beginning, the EU Regulation 2081/92 on geographical indications mentions as one of the main objectives the generation of higher incomes and more employment to remote and/or
less favoured regions. The subsequent version, EU Regulation 510/2006 confirms this objective by stressing the benefits for the rural economy and local development, promoting the diversification of products having certain characteristics and mentioning also the need to retain population in remote and less favoured regions. The impact of geographical indications on rural
development will be proportional to their uptake by local economic actors and when agriculture and food are important sectors of the local economy. Some authors acknowledged that their impact can be limited (Callois, 2004) or that this impact on the condition for economic development range from being insignificant (when producers are well organized or if there is
little competition) to significant (when, for instance, the development of geographical indication is coordinated with other economic activity such as tourism) (Gay et al., 2007, London Economics, 2008).
According to the model results and in line with other analyses based on Italian FADN (Scardera and Viganò, 2008), the location in less favoured areas influences negatively the farm participation to PDO/PGI quality schemes. This means that in areas with the worst agricultural
conditions, local economic actors are not encouraged to uptake the PDO/PGI label quality. Considering the classification of municipalities in Inner Areas on the basis of the distance from

Strength2Food D4.1 – Determinants of farmers’ engagement in FQS
71 | P a g e
hubs and of socio-economic criteria, the coefficient shows a negative influence on the decision to participate to PDO/PGI quality schemes. Certified operators are present in most of the municipalities classified as Inner Areas (52.6%; ISTAT, 2016) and this is an important signal that confirms the contribution of geographical indications in maintaining and strengthening the
presence of agricultural activities in Inner Areas. The positive sign of population density, used to measure the remoteness, supports even more this hypothesis.
With regard to altitude, hilly and mountainous areas are the most suitable places to develop PDO/PGI quality schemes. According to other studies (Santini et al., 2015; Van de Pol, 2017) it is not proven that there is more uptake of the quality scheme in mountain areas but in case of Italy the model results reflect the typology of products under PDO/PGI labelling in Italy. This
is an important result, especially considering the contents of Regulation EU 1151/2012 on quality schemes for agricultural products and foodstuffs. One of the most important new features introduced by this regulation concerns the strengthening of the role and responsibility of the producers in the monitoring, promotion and communication process. In particular, in
addition to regulating PDOs, PGIs and TSGs, the new Regulation provides support for the creation of optional quality terms relating to the characteristics of one or more categories of products. The first optional quality term established by the Regulation is “mountain product”, which could be an additional driver in the development of the traditional products in mountain areas.
As previously stated, 523 different wines have been produced under the PDO/PGI quality
scheme and 278 food productions in 2015. The production of quality wine, despite the high number of labels distributed in all the Italian territory, is concentrated in few regions: Veneto, Piedmont and Tuscany, which produced 60% of the Italian PDO wine. In this regions, vineyards grown in hilly areas are particularly suited for producing Prosecco DOP, Asti DOP, Conegliano
Valdobbiadene DOP, Chianti DOP, Amarone della Valpolicella DOP (37.2% of the total production value in bulk in 2015; ISMEA, 2015). Concerning food products, the most represented category is the grouping of fruits, vegetables and cereals (38.1% of PDO/PGI labels in 2015; ISMEA, 2015) followed by cheese (18.3%), oil and fats (15.5%) and meat products
(14.4%). In the grouping of fruit and vegetables, the most important PDO/PGI production is represented by apples: the apple Alto Adige (PGI) and the apple Val di Non (PDO) represents 87.1% of the total certificated production in terms of quantity and 80% in terms of production value. Apple is cultivated from hills until more than 1,000 m above sea level in mountains. The
characteristics of the FADN sample reflects this distribution: in the 3-year period, 57.1% of farms participating in PDO/PGI quality scheme are located in hilly areas (25.0% in flat areas, 17.8% in mountains) while permanent cultivations (mainly grapes and apples) are cultivated in the 65.7% of farms. Cereals, oilseed and protein crops are cultivated in the 6.5% of farms while dairy farming concerns 9.5% of the surveyed farms.
With regard to localization, southern farmers (including the islands) are less likely to engage in
PDO/PGI policies, as compared to Central and Northern Italy. In the FADN sample, 53.1% of farms engaged in PDO/PGI policies are located in the Northern Italy and 21.5% in the Central Italy.
The variables concerning farm characteristics confirm that PDO/PGI involvement is more suited in the Type of Farming of permanent cultivation and livestock sector. The negative coefficient sign concerning the specialization is very interesting: it seems that farms which are
more specialized are less incentived to participate in food quality schemes as compared to the mixed ones. This result is interesting because another objective included in the promotion of rural economies is the diversification of agricultural production.

Strength2Food D4.1 – Determinants of farmers’ engagement in FQS
72 | P a g e
With regard to the farm size, it seems that in the Italian case, bigger farms are more likely to engage in geographical indications: the positive coefficient signs related to the farm size (in terms of hectares) and the economic size (in terms of value of Standard Output) indicate that the participation to quality schemes requires a certain dimension. As far as the economic size
is concerned, it is necessary to specify that FADN collect information from the “professional“ farms: this means that smallest farms are not included in the survey. In all the considered Types of Farming, the average size (in terms of hectares) exhibits the highest values for those farms involved in PDO/PGI schemes. There could be a probable explanation considering the small
dimensions of Italian farms: following the results of last Agricultural Census of ISTAT (2010), the average surface of Italian farms is 7.9 ha, lower than the European average (EU-27) equal to 12.6 ha. As pointed out in the analysis in chapter 1, in regions where small scale farming is frequent and farmers are not very market oriented, the use of the quality label is low. In the
Italian case, this positive correlation is reasonable. As a matter of fact, most of the farms working in the traditional systems related to the typical production labelled as PDO/PGI are represented by small-medium size units that implement their marketing policies mainly in the local market, where the PDO/PGI label have not a specific informative role or a specific
credence attribute. In these cases, other aspects seem to be important, as the reputation of the producer or the direct sale to the consumers. On the other hand, those farms involved in longer sale channels consider the labelling as an efficient information source for the quality and origin of traditional products and as an instrument to avoid as much as possible, misuse and unfair
competition. In any case, the uptake of a PDO/PGI label is the result of a complex evaluation of the costs to receive the certification and the benefits obtained by PDO/PGI status. In particular, with regard to the costs, beside those concerning the application for the certification, there is another important aspect related to the drafting of the product specification that often
specifies low relevant characteristics of the quality, resulting in an increase of the costs, not compensated by the revenues. As a consequence, it can happen that the producer’s efforts are not incorporated in the final price, reducing the meaning of high quality of traditional production for the consumers. The success of the PDO/PGI scheme in the promotion and
maintenance of the added value within the territory is strictly linked to the capacity to transmit such high quality to the final price. For this purpose, specific marketing actions are necessary.
The farmer characteristics highlight the importance of higher education for farmers. The variable concerning age is not significant (even if it is remarkable to note that 20.4% of farmers involved in PDO/PGI scheme are below the age of 40) while education seems to influence in a positive way the participation in quality schemes.
Looking at the external characteristics, the number of establishments, bed and bed-places, used as a proxy to the touristic infrastructures, seem to have a positive influence on the uptake of
PDO/PGI. This confirms the idea that producers are more likely to use the geographical denomination labels in order to promote the products in touristic areas. Differently from other analyses, in the Italian sample there is a positive correlation between the GDP per inhabitants and the participation to FQS. With this respect, the richness of the territory seems to be an important determinant.
3.4.2. Determinants of farmers participation in an organic farming scheme
The estimation of the determinants of farmers’ participation in an organic farming scheme is carried out by applying the same LOGIT model for the PDO/PGI. Table 3.4 shows the results of the estimations. All the variables are significant, except the variables related to the localization of farms in inner areas, in the South of Italy and the population density.

Strength2Food D4.1 – Determinants of farmers’ engagement in FQS
73 | P a g e
Table 3.4: Estimates of the determinants of participation in the organic farming scheme
B E.S. Wald Sig. Exp(B) Localization
lfa 0.4102 0.0876 21.9328 0.0000 1.5071 ***
inn_areas 0.0507 0.0885 0.3278 0.5669 1.0520
inn_flat 0.3560 0.1860 3.6628 0.0556 1.4276 *
mount 0.5869 0.1626 13.0302 0.0003 1.7984 ***
hilly 0.6277 0.1314 22.8070 0.0000 1.8733 ***
south 0.1747 0.1125 2.4120 0.1204 1.1908
Farm features
crops 0.4627 0.2756 2.8190 0.0932 1.5883 *
hort -0.7809 0.4292 3.3099 0.0689 0.4580 *
perm 1.6702 0.2669 39.1541 0.0000 5.3134 ***
liv 0.9078 0.2727 11.0787 0.0009 2.4787 ***
spec -1.1607 0.2781 17.4267 0.0000 0.3133 ***
diver 0.7792 0.1053 54.7838 0.0000 2.1797 ****
farm_size 0.1711 0.0300 32.5521 0.0000 1.1866 ***
econ_size 0.2593 0.0890 8.4955 0.0036 1.2960 ***
Farmer features
less_40 0.2252 0.0881 6.5298 0.0106 1.2526 **
qualif 0.7694 0.0778 97.7681 0.0000 2.1584 ***
External characteristics
dens_m 0.0001 0.0001 0.5211 0.4704 1.0001
tour_est -0.6306 0.1547 16.6188 0.0000 0.5323 ***
GDP_in(z) -0.3627 0.0617 34.5505 0.0000 0.6958 ***
Intercept -3.4100 0.1812 354.1856 0.0000 0.0330 ***
Hosmer-Lemeshow
Chi-squared 13.514 0.0950 *
Source: elaboration on Italian FADN database and Eurostat; Level of significance: *** p<0.01; ** p<0.05; * p<0.10
In contrast to the case of PDO/PGI designations, the localization of farms in the most
disadvantaged areas (less favoured areas) affects in a positive way the adoption of organic production techniques while the variable related to the inner areas is not significant. As noted in determinant estimates for the PDO/PGI, the proximity to the main roads and urban hubs affects positively the adoption of organic agriculture. The variable inn_flat includes those
territories classified as inner areas but located in flat areas so, probably, not far from road and communication infrastructures.
The positive and significant coefficient of the altitude variables (mount and hilly) reveal a higher probability to uptake organic practices in these two areas as opposed to the flat ones, where a more intensive agriculture is typically carried out. This result is confirmed by the 2013 Farm Structure Survey (FFS) carried out by ISTAT (Italian National Institute of Statistics): 63.2% of
the whole organic surface is cultivated in hilly areas, 20.5% in mountains and 16.3% in flat areas.
Although the variable related to the localization of farms in the South of Italy is positive, it is not statistically significant at 0.10. This result does not reflect the situation in Italy because the largest extension of organic area is cultivated in three Southern regions (Sicily, Calabria and Apulia), where 46.6% of the whole organic surface is concentrated (refer to Table 3.5). In
Strength2Food D4.1 – Determinants of farmers’ engagement in FQS
74 | P a g e
addition it is important to note that the group of organic farms belonging to the FADN sample include producers of organic products, involved in other gainful activities (as agro-tourism), delivered to Cooperatives or sold through direct channels. Only few of them process the raw materials in the farm. Even if the p-value is not significant, the positive sign reflects in a certain
way a duality between the South of Italy, where the majority of organic farmers are producers (62.6% of producers and 40.9% of processors in 2015; Rete Rurale Nazionale, 2017) and the North and Central Italy, more specialised on the processing. Only in the last years, there has been a change in this trend, with an increase in the number of processors in the Southern Italy (+15.1% during the period 2014-2015).
Looking at the farm features, and specifically farm type, it seems that in the FADN sample it is
more likely to apply organic techniques in those farm specialized in arable crops, permanent crops and livestock. These results are aligned with the productive framework of the organic sector in Italy, pointed out in the SINAB database (National Informative System on Organic Agriculture): 41.5% of organic surface is cultivated with arable crops, 28.6% with permanent
pastures and grasslands, 24.4% with permanent crops (olive: 180,000 hectares; fruit: 88,000 hectares; vineyards: 84,000 hectares).
Compared to mixed farming systems, the specialization seems to have a negative effect on the probability to adopt organic techniques but this result is not supported by clear evidences. On the other hand, the diversification shows a positive influence on the decision to uptake organic methods. This is confirmed by the FSS survey: compared to the agricultural farms as a whole,
organic farms have a higher level of diversification. 28.1% of them has at least another one gainful activity (agro-tourism, recreational activity, renewable energy production, etc.) against the 7.7% of agriculture as a whole. In other analysis based on the FADN data (Rete Rurale Nazionale, 2017), the incidence of the other gainful activities on the total gross saleable
production in conventional farms is 4.2% while in organic farms raises until 8.2%. According to Coldiretti, the organic farms have on average an annual income one third higher than conventional farms.
A further information about the characteristics of organic farms can be provided by the variables linked to the farm size, that seems to be an important determinant: both of them (economic dimension and hectares) are positive and significant, underlying the importance of the farm
dimension in the adoption of organic techniques. In the FADN sample, conventional farms have an average UAA equal to 32.8 hectares while for the organic farms the comparable Figure is 44.7 hectares. This finding is supported by the 2013 FSS which shows that the average surface in the organic sector is higher compared the whole Italian agriculture: organic farms have an
UAA equal to 28.4 hectares (21.1 ha in the North; 31.2 ha in the Centre; 29.6 ha in the South) while the Italian average is more or less equal to 8 hectares. Other analyses based on the FADN data suggest similar results (Rete Rurale Nazionale, 2017).
The probability to adopt organic practices at the farm level is most likely if the farmer is young and if he has a high education level. This aspect has been already pointed out in previous studies. About 22% of organic farms are managed by farmers aged between 20 and 39 years while the
percentage is equal to 9% in the Italian farm population. According to Coldiretti, organic farmers have a high level of education (generally they have a university degree), they make use of computers and other electronic utilities, their farms have a great diversification of crops and they sell organic products through different market channels (e-commerce included).
The coefficient related to the population density is not significant and does not explain the decision to apply or not for organic methods. The number of accomodations (considered as a

Strength2Food D4.1 – Determinants of farmers’ engagement in FQS
75 | P a g e
proxy of the tourist numbers in the area) and the wealth of the population in terms of GDP per inhabitant are negatively correlated. This could be explained considering that the adoption of organic techniques do not depend directly by the local market but it is sometimes a consequence of an ethical choice and that in Italy, the high demand of organic products is not concentrated
in the Regions where production is the highest. The total turnover in 2015 for organic products has been equal to 2,660 million euros, (+15.0% if compared to 2014). About one third of this turnover comes from the large retailers: 35.8% of this turnover is realized in the North-Western Italy, 29.4% in the North-East, 24.0% in Central Italy and Sardinia and 9.4% in the South of
Italy. Another one third comes from specialized shops. Only 13% is commercialized through HoReCa (Hotel/Restaurant/Café) sector while 8% in traditional shops. 14% of turnovers comes from other channels (small local markets, direct sales, e-commerce, etc.) (RRN, 2017).
3.5. Summary of results
Using the FADN data for Italy, this chapter has investigated the determinants of farmers’ engagement in PDO/PGI and organic quality schemes. The findings show that PDO/PGI uptake is lower in less favoured areas. These results are confirmed by using other measures of ‘remoteness’, such as population density. On the other hand, PDO/PGI uptake is higher in
Italian mountainous areas. Moreover, the majority of farms participating in PDO/PGI quality schemes are located in hilly areas and in farms with permanent cultivations (mainly grapes and apples). With regard to localization, farmers in the South of Italy (including the Islands) are less likely to engage in PDO/PGI policies, when compared to Central and Northern Italy. Moreover,
larger farms are more likely to engage in geographical indications. By the same token, regions with a high share of small scale farming and low market orientation exhibit a low likelihood to engage in the quality label. Farmer characteristics also highlight the importance of higher education of farmers. Looking to the external characteristics, the touristic infrastructures have a positive influence on the uptake of PDO/PGI.
Differently from the engagement in PDO/PGI, the localization of the farm in the most
disadvantaged areas (less favoured areas) is positively related to the adoption of organic production techniques. There is also a higher probability to take up organic practices in hilly and mountainous areas. Oragnic farming is more present in farms specialized in arable crops, permanent crops and livestock. Organic farms on average also seem to have larger dimensions
(both in economic size and in hectares). Younger and well-educated farmers are more likely to engage in organic farming. Finally, the extent of the tourist sector and GDP per capita in the region are both negatively correlated to organic farming.

Strength2Food D4.1 – Determinants of farmers’ engagement in FQS
76 | P a g e
REFERENCES
ISMEA-Qualivita (2016). Rapporto 2015 sulle produzioni agroalimentari e vitivinicole DOP, IGP, STG, ISMEA Qualivita ISBN 978-88-96530-43-6
ISTAT (2016). I prodotti agroalimentari di qualità DOP, IGP, STG, Report Statistiche, CDD Istat, Roma.
Marongiu S., Cesaro L. (2017), Economic performance and profitability of agricultural holdings in Inner Areas, Italian Journal of Planning Practices, 2017
Marongiu S., Cesaro L., (2016), L’agricoltura nelle aree interne: un’analisi dei principali
indicatori di produttività e redditività delle aziende agricole tramite la RICA, Agriregionieuropa, n.45, giugno 2016
Rete Rurale Nazionale – RRN (2017). Bioreport 2016. L’agricoltura biologica in Italia , Rete Rurale Nazionale 2017, Roma
Santini, F., Guri, F., Aubard, A., Gomez y Paloma, S. (2015). Geographical Indications and territories with specific geographical features in the EU: the cases of mountain and island areas, paper prepared for the 145th Seminar “Intellectual Property Rights for geographical indications: What is at Stake in the TTIP”? April 14-15, 2015, Parma, Italy
Scardera, A., Viganò L. (2008). DOP e IGP, i numeri della qualità, in Il funzionamento delle aziende agricole con prodotti di qualità e le politiche a loro favore, Bologna, 12 Settembre 2008.
Data References
http://bancadatirica.crea.gov.it
http://sinab.it

Strength2Food D4.1 – Determinants of farmers’ engagement in FQS
77 | P a g e
The Strength2Food project in a nutshell
Strength2Food is a five-year, €6.9 million project to improve the effectiveness of EU food quality schemes (FQS), public sector food procurement (PSFP) and to stimulate Short Food Supply Chains (SFSC) through research, innovation and demonstration activities. The 30-partner consortium representing 11 EU and four non-EU countries combines academic, communication, SMEs and stakeholder organisations to ensure a multi-actor approach. It will undertake case study-based quantitative research to measure economic, environmental and social impacts of FQS, PSFP and SFSC. The impact of PSFP policies on nutrition in school meals will also be assessed. Primary research will be complemented by econometric analysis of existing datasets to determine impacts of FQS and SFSC participation on farm performance, as well as understand price transmission and trade patterns. Consumer knowledge, confidence in, valuation and use of FQS labels and products will be assessed via survey, ethnographic and virtual supermarket-based research. Lessons from the research will be applied and verified in 6 pilot initiatives which bring together academic and non-academic partners. Impact will be maximised through a knowledge exchange platform, hybrid forums, educational resources and a Massive Open Online Course.
www.strength2food.eu