Strengthening and Evaluating the Preventing Malnutrition ... · PDF fileFor the follow-up...
138
Strengthening and Evaluating the Preventing Malnutrition in Children under 2 Years of Age Approach Burundi Follow-Up Report: Children 0–23 Months Jef Leroy, IFPRI Jessica Heckert, IFPRI Kenda Cunningham, IFPRI Deanna Olney, IFPRI November 2014 FANTA FHI 360 1825 Connecticut Ave., NW Washington, DC 20009-5721 Tel: 202-884-8000 Fax: 202-884-8432 [email protected] www.fantaproject.org
Transcript of Strengthening and Evaluating the Preventing Malnutrition ... · PDF fileFor the follow-up...

Strengthening and Evaluating the Preventing Malnutrition in Children under 2 Years of Age Approach
Burundi Follow-Up Report: Children 0–23 Months
Jef Leroy, IFPRI Jessica Heckert, IFPRI Kenda Cunningham, IFPRI Deanna Olney, IFPRI
November 2014
FANTAFHI 3601825 Connecticut Ave., NW Washington, DC 20009-5721Tel: 202-884-8000 Fax: 202-884-8432 [email protected] www.fantaproject.org

This report is made possible by the generous support
of the American people through the support of the
Office of Health, Infectious Diseases, and Nutrition,
Bureau for Global Health, and the Office of Food for
Peace, Bureau for Democracy, Conflict and
Humanitarian Assistance, U.S. Agency for
International Development (USAID), under terms of
Cooperative Agreements GHN-A-00-08-00001-00,
AID-OAA-A-11-00014, and AID-OAA-A-12-00005
through the Food and Nutrition Technical Assistance
III Project (FANTA), managed by FHI 360.
The contents are the responsibility of FHI 360 and do
not necessarily reflect the views of USAID or the
United States Government.
November 2014
Recommended Citation
Leroy, Jef; Heckert, Jessica; Cunningham, Kenda; and
Olney, Deanna. 2014. Strengthening and Evaluating
the Preventing Malnutrition in Children under 2 Years
of Age Approach – Burundi Follow-up Report: Children
0–23 Months. Washington, DC: FHI 360/FANTA.
Contact Information
Food and Nutrition Technical Assistance III Project
(FANTA)
FHI 360
1825 Connecticut Avenue, NW
Washington, DC 20009-5721
T 202-884-8000
F 202-884-8432
www.fantaproject.org

Strengthening and Evaluating the PM2A Approach – Burundi Follow-Up Report: Children 0–23 Months
i
Acknowledgments
This publication would not have been possible without the collaborative work between Institut de Statistiques et d’Etudes Economiques du Burundi (ISTEEBU) and the International Food Policy Research Institute (IFPRI). In particular, the authors would like to thank Nicolas Ndayishimiye, Noé Nduwabike, Vénérand Nizigiyimana, and Jean-Claude Sibomana of ISTEEBU. We’d also like to thank Megan Parker, who oversaw the baseline data collection in Burundi, and Elyse Iruhiriye, who trained, coordinated, and supervised fieldworkers and assisted in translations to facilitate data analysis.
Also instrumental in the training process for the baseline survey were the efforts of Leonidas Barihuta and Fortunat Ntafatiro of PRONIANUT, Yvette Mpungenge, and the many families at Ragasore medical clinic who allowed us to weigh and measure their children during the anthropometric standardization process. For the follow-up survey, we’d like to thank Dr. Georgette Noumsi Simo and the many families at the health centers of Panda and Ruziba and the Centre Medicale Communautaire who allowed us to weigh and measure their children during training and the anthropometric standardization process.
We’d like to thank the study supervisors, controllers, household enumerators, anthropometrists, and drivers for their hard work in field conditions that were often difficult.
The surveys were successful in large part because of Elisabeth Metellus’s tireless efforts in many activities, including questionnaire development, training, and fieldwork supervision. Koen Depaepe was instrumental in writing the Visual Basic for Applications code to create the sous-colline specific households listings used by the field teams.
We also express our gratitude to the families who graciously gave their time to answer our survey questions, without whom this report would not have been possible.
Last, we’d like to thank José Luis Figueroa Oropeza, Yisehac Yohannes, and Wahid Quabili for their data cleaning services in preparation of data analysis.

Strengthening and Evaluating the PM2A Approach – Burundi Follow-Up Report: Children 0–23 Months
ii
Contents
Acknowledgments ........................................................................................................................................ i
Abbreviations and Acronyms ................................................................................................................... vi
Executive Summary .................................................................................................................................... 1
1. Introduction .......................................................................................................................................... 3
2. Methods ................................................................................................................................................. 5 2.1 Study Setting ............................................................................................................................... 5 2.2 The Tubaramure Program ........................................................................................................... 5 2.3 Tubaramure Evaluation Design ................................................................................................... 7 2.4 Study Methods ............................................................................................................................. 7
2.4.1 Sample Size ..................................................................................................................... 8 2.4.2 Sampling .......................................................................................................................... 8 2.4.3 Selection of Index Child .................................................................................................. 9 2.4.4 Selection of Colline Leaders and Health Centers ............................................................ 9 2.4.5 Data Collection .............................................................................................................. 10 2.4.6 Field Work ..................................................................................................................... 14 2.4.7 Data Entry and Cleaning ................................................................................................ 16 2.4.8 Data Analysis and Impact Estimation ............................................................................ 22
3. Results: Colline and Health Center Characteristics ........................................................................ 25 3.1 Colline Characteristics ............................................................................................................... 25
3.1.1 Utilities, Infrastructure, and Access to Services ............................................................ 25 3.1.2 Transportation ................................................................................................................ 26 3.1.3 Access to Schools and Health Services ......................................................................... 28 3.1.4 Agriculture ..................................................................................................................... 31 3.1.5 Social Groups, Development Programs, and Recent Events ......................................... 32
3.2 Health Center Characteristics .................................................................................................... 34 3.2.1 Infrastructure, Personnel, and Services ......................................................................... 34 3.2.2 Components of Services ................................................................................................ 36 3.2.3 Availability of Equipment, Medication, and Supplies ................................................... 38
4. Results: Household Characteristics .................................................................................................. 44 4.1 Household Demography and Housing ....................................................................................... 44 4.2 Household Assets ...................................................................................................................... 44
5. Results: Maternal Characteristics .................................................................................................... 49
6. Results: Child Characteristics ........................................................................................................... 51
7. Results: Tubaramure Participation ................................................................................................... 52 7.1 Enrollment and Participation in Tubaramure ............................................................................ 52 7.2 Participation in Tubaramure Program Activities ...................................................................... 52
8. Results: Household Impact ................................................................................................................ 60 8.1 Household Hygiene and Sanitation ........................................................................................... 60 8.2 Household Food Security, Hunger, and Dietary Diversity ........................................................ 60
9. Results: Maternal Impact .................................................................................................................. 69 9.1 Feeding, Care, and Health Knowledge of Mothers ................................................................... 69 9.2 Pre-, Peri-, and Postnatal Health Care Practices ........................................................................ 87 9.3 Maternal Diet and Nutritional Status ......................................................................................... 91
Strengthening and Evaluating the PM2A Approach – Burundi Follow-Up Report: Children 0–23 Months
iii
10. Results: Child Impact ...................................................................................................................... 101 10.1 IYCF Practices ......................................................................................................................... 101 10.2 Child Health ............................................................................................................................. 106 10.3 Child Development .................................................................................................................. 111 10.4 Child Hemoglobin Levels and Anemia Status......................................................................... 115
11. Summary of Findings along the Program Impact Pathways ....................................................... 118 11.1 The Tubaramure Food Component ......................................................................................... 118 11.2 The Tubaramure BCC Component ......................................................................................... 118
11.2.1 Health and Nutrition Knowledge ................................................................................. 119 11.2.2 Hygiene and Sanitation Practices ................................................................................ 119 11.2.3 Impact on IYCF ........................................................................................................... 120 11.2.4 Impact on Preventive and Curative Care Seeking and Child Health ........................... 120
11.3 The Tubaramure Health Component ....................................................................................... 120 11.3.1 Health Services ............................................................................................................ 120 11.3.2 Impact on the Use of Pre-, Peri- and Postnatal Health Care Practices ......................... 121
11.4 Impact on Maternal Nutrition and Child Nutrition and Development ..................................... 121 11.4.1 Hemoglobin Level and Anemia ................................................................................... 122 11.4.2 Impact on Child Development ..................................................................................... 122
12. References ......................................................................................................................................... 123
Appendix 1. Monthly Ration Size for the Tubaramure Beneficiary Population ................................ 126
Appendix 2. List of Collines according to Study Treatment Arm ...................................................... 127
LIST OF TABLES
Table 1. Required sample size to measure impact on child and household outcomes .................................. 8
Table 2. List of modules included in colline questionnaire ........................................................................ 10
Table 3. List of modules included in health center questionnaire ............................................................... 11
Table 4. List of modules included in household questionnaire ................................................................... 12
Table 5. List of modules included in anthropometry questionnaire ............................................................ 14
Table 6. National vaccination schedule for Burundi ................................................................................... 19
Table 7. Utilities and infrastructure in each colline .................................................................................... 25
Table 8. Distance to services ...................................................................................................................... 26
Table 9. Local forms of transportation ........................................................................................................ 27
Table 10. School characteristics.................................................................................................................. 29
Table 11. Access to health services by colline residents ............................................................................ 30
Table 12. Most common crops and vegetables ........................................................................................... 31
Table 13. Ten most common fruit trees ...................................................................................................... 32
Table 14. Presence of associations, cooperatives, and other groups ........................................................... 32
Table 15. Recent historical events experienced by the collines .................................................................. 33
Table 16. Most common negative events experienced by collines during preceding 2 years .................... 34

Strengthening and Evaluating the PM2A Approach – Burundi Follow-Up Report: Children 0–23 Months
iv
Table 17. Health center infrastructure and personnel ................................................................................. 35
Table 18. Availability and frequency of services........................................................................................ 36
Table 19. Components of services for sick children ................................................................................... 37
Table 20. Components of services for pregnant and lactating women ....................................................... 37
Table 21. Laboratory services ..................................................................................................................... 38
Table 22. Malaria-related services .............................................................................................................. 38
Table 23. Availability of equipment ........................................................................................................... 39
Table 24. Availability of medications and supplies .................................................................................... 42
Table 25. Characteristics of households ..................................................................................................... 45
Table 26. Housing characteristics ............................................................................................................... 46
Table 27. Water and energy access ............................................................................................................. 47
Table 28. Asset ownership .......................................................................................................................... 48
Table 29. Maternal characteristics and activities ........................................................................................ 50
Table 30. Child characteristics .................................................................................................................... 51
Table 31. Tubaramure program awareness and participation ..................................................................... 54
Table 32. Reasons for non-participation in Tubaramure (among current non-beneficiaries) ..................... 55
Table 33. Tubaramure food distribution experiences (most recent, among current beneficiaries) ............ 56
Table 34. Tubaramure food distributions (last 4 months, among current beneficiaries) ............................ 57
Table 35. Tubaramure care group participation (among current beneficiaries) ......................................... 58
Table 36. Tubaramure home visits by leader mothers (among current beneficiaries)................................ 59
Table 37. Hygiene and sanitation ................................................................................................................ 62
Table 38. Hygiene and sanitation: impact ................................................................................................... 63
Table 39. Soap use ...................................................................................................................................... 64
Table 40. Soap use: impact ......................................................................................................................... 65
Table 41. Spot-check observations ............................................................................................................. 66
Table 42. Spot-check observations: impact ................................................................................................ 66
Table 43. Household hunger and dietary diversity ..................................................................................... 67
Table 44. Household hunger and dietary diversity: impact ........................................................................ 68
Table 45. Knowledge of pregnancy and childhood illness danger signs among mother ............................ 70
Table 46. Knowledge of pregnancy and childhood danger signs among mothers: impact ......................... 71
Table 47. Knowledge of feeding practices for sick children among mothers ............................................. 72
Table 48. Knowledge of feeding practices for sick children among mothers: impact ................................ 73
Table 49. Breastfeeding knowledge among mothers .................................................................................. 74
Table 50. Breastfeeding knowledge among mothers: impact ..................................................................... 75
Table 51. Malnutrition knowledge among mothers .................................................................................... 77

Strengthening and Evaluating the PM2A Approach – Burundi Follow-Up Report: Children 0–23 Months
v
Table 52. Malnutrition knowledge among mothers: impact ....................................................................... 79
Table 53. Complementary feeding knowledge among mothers .................................................................. 82
Table 54. Complementary feeding knowledge among mothers: impact ..................................................... 83
Table 55. Hygiene knowledge among mothers ........................................................................................... 85
Table 56. Hygiene knowledge among mothers: impact .............................................................................. 86
Table 57. Use of prenatal care services among mothers ............................................................................. 89
Table 58. Use of prenatal care services among mothers: impact ................................................................ 90
Table 59. Delivery services used by mothers ............................................................................................. 92
Table 60. Delivery services used by mothers: impact................................................................................. 93
Table 61. Postnatal care .............................................................................................................................. 94
Table 62. Postnatal care: impact ................................................................................................................. 95
Table 63. Maternal consumption and dietary diversity ............................................................................... 96
Table 64. Maternal consumption and dietary diversity: impact .................................................................. 97
Table 65. Anthropometric status of mothers ............................................................................................... 99
Table 66. Anthropometric status of mothers: impact ................................................................................ 100
Table 67. IYCF practices .......................................................................................................................... 103
Table 68. IYCF practices: impact ............................................................................................................. 105
Table 69. Preventive health care practices ................................................................................................ 107
Table 70. Preventive health care practices: impact ................................................................................... 108
Table 71. Child health and prevalence of morbidity symptoms ............................................................... 109
Table 72. Child health and prevalence of morbidity symptoms: impact .................................................. 110
Table 73. Treatment of illness and malnutrition ....................................................................................... 112
Table 74. Treatment of illness and malnutrition: impact .......................................................................... 113
Table 75. Motor and language milestones attained ................................................................................... 114
Table 76. Motor and language milestones attained: impact ...................................................................... 114
Table 77. Child hemoglobin levels and anemia status .............................................................................. 116
Table 78. Child hemoglobin levels and anemia status: impact ................................................................. 117

Strengthening and Evaluating the PM2A Approach – Burundi Follow-Up Report: Children 0–23 Months
vi
Abbreviations and Acronyms
A4NH Research Program on Agriculture for Nutrition and Health BCC behavior change communication BCG Bacille Calmette-Guérin (tuberculosis vaccine) BIF Burundian Franc(s) BMI body mass index CARITAS CARITAS Burundi CGIAR Consultative Group on International Agricultural Research cm centimeter(s) CRS Catholic Relief Services CSB corn-soy blend DHS Demographic and Health Survey dL deciliter(s) DPT diphtheria, pertussis, tetanus (vaccine) DRC Democratic Republic of the Congo EICV Enquête Intégrale sur les Conditions de Vie des Ménages FANTA Food and Nutrition Technical Assistance Project FH Food for the Hungry FFP Office of Food for Peace g gram(s) HAZ height-for-age z-score Hb hemoglobin HDDS Household Dietary Diversity Scale HFIAS Household Food Insecurity Access Scale HepB hepatitis B virus (vaccine) HH household HHS Household Hunger Scale HiB haemophilus influenza B (vaccine) HIV human immunodeficiency virus IFAD International Fund for Agricultural Development IFPRI International Food Policy Research Institute IMC International Medical Corps IMCI integrated management of childhood illness INSP Institut National de Santé Publique ISTEEBU Institut de Statistiques et d’Etudes Economiques du Burundi IU international unit(s) IYCF infant and young child feeding kg kilogram(s) km kilometer(s) m meter(s)

Strengthening and Evaluating the PM2A Approach – Burundi Follow-Up Report: Children 0–23 Months
vii
μg microgram(s) mg milligram(s) mm millimeter(s) MUAC mid-upper arm circumference NGO nongovernmental organization ORS oral rehydration salts PCV Pneumococcal Conjugate Vaccine PM2A Preventing Malnutrition in Children under 2 Approach SD standard deviation(s) SE standard error(s) SRQ-20 Self-Report Questionnaire T18 Tubaramure 18 T24 Tubaramure 24 THP Tubaramure health promoter TNFP Tubaramure no food during pregnancy U.S. United States UNDP United Nations Development Programme USAID U.S. Agency for International Development WHO World Health Organization

Strengthening and Evaluating the PM2A Approach – Burundi Follow-Up Report: Children 0–23 Months
1
Executive Summary
Tubaramure is a “Preventing Malnutrition in Children under 2 Approach” (PM2A) program implemented in eastern Burundi. The program’s aim is to improve the health and nutritional status of pregnant and lactating women and children under 2 years of age through three core components: distribution of food rations, participation in behavior change communication (BCC) sessions delivered via care groups, and attendance at preventive health services.
The impact of Tubaramure is being evaluated via a community randomized control trial with three different treatment arms. Beneficiaries in the three treatment arms receive food rations for varying durations: from 4 months gestational age until the child is 24 months old, from 4 months gestational age until the child is 18 months old, and from birth until the child is 24 months old. The objective of varying the duration of implementation is to test optimal program duration.
The program’s impact is being assessed using three cross-sectional surveys (conducted in 2010, 2012, and 2014). The first cross-sectional study provided a baseline reference. This report presents the findings from the 2012 follow-up survey. This report assesses the impact of Tubaramure following about 2 years of program implementation on children between 0 and 23 months of age. The focus of the report is on outcomes, such as maternal knowledge regarding health and nutrition-related practices, including infant and young child feeding (IYCF) practices. The impact on child linear growth (the main measure of nutritional status) will be assessed in children who have been exposed to Tubaramure consistently from early pregnancy to 24 months of age. The first group of children to meet this condition will be between 24 and 42 months of age in the October–December 2014 time period.
The three Tubaramure components discussed below (food, BCC, and health) were expected to have an impact on maternal nutrition and on child nutrition and development.
The food component of the Tubaramure consisted of corn-soy blend (CSB) and cooking oil rations and was expected to increase household availability of micronutrient-rich food and, in turn, consumption of such foods and improved diet diversity. Participation in food distribution was high among those eligible. Tubaramure had a large positive effect on household access to food and reduced the percentage of severely food insecure households substantially. Tubaramure had a minimal impact on the low level of household and mothers’ dietary diversity. The program improved complementary feeding practices. The largest impact was seen in the proportion of children consuming iron-rich foods, which appeared to be directly related to the increased intake of CSB. A more modest positive impact was found for the proportion of children receiving the minimum recommended number of meals, the proportion of children receiving the minimum dietary diversity, and the percentage of children consuming a minimally acceptable diet.
Tubaramure’s BCC strategy was designed specifically to increase knowledge and adoption of best practices in health, hygiene, and nutrition. The BCC component was implemented through participation in care groups that were directed by leader mothers who were also program beneficiaries. Care group participation was low. As a result, impacts on mothers’ knowledge was mixed, and mothers’ knowledge did not improve in many of the areas where it was expected to improve. However, mothers’ knowledge did improve in the area of optimal child feeding practices. Tubaramure had only a modest positive impact on a limited number of household hygiene and sanitation practices. The program did not increase reported attendance at growth monitoring services or any of the other types of preventive health care utilization. Tubaramure did protect children from the overall increase in child morbidity observed from baseline to

Strengthening and Evaluating the PM2A Approach – Burundi Follow-Up Report: Children 0–23 Months
2
follow-up in the control group. The only effect on curative care-seeking behaviors was found for the proportion of children receiving medication to fight a fever.
The health component was designed to improve the provision of preventive and curative health services by health staff (by providing training for health staff, as well as by providing some key supplies) and to increase utilization of these services by pregnant and lactating women and children under 24 months of age. At follow-up, health centers were better equipped and better staffed to care for expecting mothers and young children. However, shortages of key immunizations and medications were common.1 The program increased the total number of prenatal visits and the proportion of women delivering in health centers. An alarming finding is the dramatic drop in the proportion of women taking iron supplements during pregnancy. The prevalence of anemia in mothers increased by about 15 percentage points between surveys. The program’s protective effect on the prevalence of anemia (4.2–7.5 percentage points) was modest. A similar result was found in children 6–23 months of age, with an overall increase over time in the prevalence of anemia (to around 73%). The intervention had a protective effect on children’s hemoglobin (Hb) levels, i.e., the general decline in Hb levels observed in all study groups between surveys was less steep (0.24–0.56 g/dL) in the three Tubaramure groups than in the control group. Finally, we observed a general decline between surveys in the highest attained language and motor milestones among children 4–23 months of age. The program was found to have a protective effect on the highest attained motor milestone and on the highest attained language milestone in some of the intervention groups.
1 Note that Tubaramure, under U.S. Agency for International Development (USAID) Office of Food for Peace (FFP) guidelines, was not able to purchase immunizations or medications.
Strengthening and Evaluating the PM2A Approach – Burundi Follow-Up Report: Children 0–23 Months
3
1. Introduction
This report presents the findings from the first follow-up survey for the impact evaluation of the PM2A Tubaramure program, which is being implemented in eastern Burundi. Building on the baseline survey, this report assesses the impact of PM2A interventions on children between 0 and 23 months of age following about 2 years of program implementation.
Tubaramure is a USAID multi-year development assistance program (formerly called multi-year assistance program) funded by the Office of Food for Peace (FFP) with Title II resources.2 The objectives are to improve the health and nutritional status of pregnant and lactating women and children under 2 years of age and to strengthen the quality and delivery of health care services. The program has three core components: distribution of family and individual food rations; required participation of beneficiaries in BCC sessions focused on improving health and nutrition-related behaviors; and required use of preventive health services for pregnant and lactating women and children under 2 years of age. A consortium of nongovernmental organizations (NGOs) implement this program, with Catholic Relief Services (CRS) as the lead and International Medical Corps (IMC), Food for the Hungry (FH), and CARITAS Burundi (CARITAS) as implementing partners.
Integrated into the Tubaramure program is a research program being conducted by the International Food Policy Research Institute (IFPRI) in collaboration with the consortium of NGOs and with funding from USAID through the Food and Nutrition Technical Assistance Project (FANTA). The overall objectives of the research are to assess the impact and cost-effectiveness of Tubaramure on child nutritional status, as well as to evaluate the differential and absolute impact of varying the duration of receiving food rations. In addition, the study will evaluate the impact of the program on a number of other household, maternal, and child outcomes, such as household hunger, IYCF practices, health-seeking practices, maternal Hb and anemia, children’s morbidity symptoms, children’s Hb and anemia, and children’s language and motor development. In addition to the impact and cost-effectiveness studies, process evaluation research is being conducted to understand program delivery and utilization.
In total, three cross-sectional surveys conducted from October to December in 2010, 2012, and 2014 will assess the program’s impact. The first cross-sectional study provided a baseline reference and is summarized in a prior report (Parker et al. 2012). The second cross-sectional study evaluates the programmatic impact on children 0–23 months of age (the current report). The third cross-sectional study will evaluate the impact on children 24–41 months of age.
The remainder of the current report is structured as follows. Section 2 presents the study methods. Health center and colline3 characteristics are presented in Section 3. The household, maternal, and child
2 A study conducted in Haiti and funded by USAID through the Food and Nutrition Technical Assistance Project (FANTA) was the first rigorous evaluation conducted under real programmatic conditions that showed that the blanket targeting of a food-assisted maternal and child health and nutrition program to all children 6–24 months of age (preventive approach) was more effective at reducing the community prevalence of stunting, wasting, and underweight than the traditional approach based on targeting underweight children (weight-for-age z-score < −2) (recuperative approach). Based on the evidence from Haiti, FFP invited proposals to replicate the preventive approach (PM2A) in two other countries: Guatemala and Burundi. The two countries were selected because of their excessively high levels of child stunting. FANTA considered that it would be important to incorporate a strong action-oriented research and development program linked to the implementation of PM2A in the two countries, to allow learning and refinement of the approach and to generate lessons learned for future PM2A programming. 3 Colline is the smallest administrative subdivision in Burundi.

Strengthening and Evaluating the PM2A Approach – Burundi Follow-Up Report: Children 0–23 Months
4
characteristics are presented in Sections 4, 5, and 6, respectively. Section 7 presents information on Tubaramure participation. Sections 8, 9, and 10 follow with results on programmatic impact at the household, mother, and child levels, respectively. Section 11 concludes with a discussion of the results.

Strengthening and Evaluating the PM2A Approach – Burundi Follow-Up Report: Children 0–23 Months
5
2. Methods
2.1 Study Setting Burundi is one of the 10 poorest countries in the world (United Nations Development Programme [UNDP] 2013). The country is located in the Great Lakes region of East Africa, bordered by the Democratic Republic of Congo (DRC), Rwanda, and Tanzania. With approximately 9.85 million people living on 25,680 km2 of land, Burundi is one of the most densely populated African countries (Food Security and Nutrition Working Group 2010; International Fund for Agricultural Development [IFAD] 2012; World Bank 2012).
Ninety percent of the population lives in rural areas and depends on agriculture for a living, most of which is small-scale subsistence farming. A typical family farm is 0.8 hectares and grows maize, beans, sorghum, cassava, and millet (IFAD 2012; UN Stats 2009). Since 1993, agricultural production has declined by 24%. Approximately 81% of the population lives below the international poverty line of US$1.25 per day (World Bank 2011).
The Tubaramure program is being implemented in the eastern provinces of Cankuzo and Ruyigi, located along the border with Tanzania. These provinces are among the poorest of Burundi’s 17 provinces and are predominantly rural. According to the 2010 Demographic and Health Survey (DHS), the central-eastern provinces have the greatest prevalence of stunting (62%) and underweight (33%) (ISTEEBU and l’Institut National de Santé Publique [INSP] 2011). Micronutrient deficiencies are common: Anemia prevalence in these provinces is approximately 44% among children 6–59 months of age and 18% among pregnant women; vitamin A deficiency has remained widespread despite large-scale distributions of vitamin A supplements by the Expanded Program of Vaccination (ISTEEBU and INSP 2011). The NGO consortium implementing the Tubaramure program chose to work in Cankuzo and Ruyigi after evaluating several health and nutrition indicators (e.g., malnutrition, access to prenatal and postnatal services, IMC growth monitoring results, and food insecurity), which indicated that these two provinces were among those most in need of this type of program.
2.2 The Tubaramure Program The core package of the PM2A includes three components4: distribution of food rations, attendance at preventive health services, and participation in a BCC strategy. Women are invited to enroll in the Tubaramure program when they are pregnant (at or after the fourth month of gestation).
Food component.5 The food component of the Tubaramure program is expected to increase household availability of micronutrient-rich food and, in turn, consumption of such foods and improved diet diversity. To achieve these goals, all Tubaramure beneficiaries enrolled in the Tubaramure program receive a monthly household food ration composed of 12 kg of CSB and 1,200 g of oil (see Appendix 1). This ration is distributed to the beneficiary, but intended for household consumption. In addition to the household ration, an individual ration is distributed for the beneficiary: a pregnant or lactating woman (0–5 months postpartum) receives 6 kg of CSB and 600 g of oil, while a child 6–23 months receives 3 kg of CSB and 300 g of oil. From the time of enrollment, a beneficiary mother will continue to receive the monthly individual ration until her child is 6 months of age. At 6 months, it is recommended that 4 FFP limited the focus of the project to the three main areas and did not fund inclusion of such interventions as home gardens or savings/lending groups. 5 Using private funds, CRS later added a home gardening and animal raising component. Since these activities were not part of the Tubaramure program at the time of the baseline, data on these outcomes were not collected.

Strengthening and Evaluating the PM2A Approach – Burundi Follow-Up Report: Children 0–23 Months
6
complementary foods be introduced to the infant. At this time, the mother’s individual ration is discontinued and the child begins receiving a monthly individual ration until she or he graduates from the program (at 24 months of age).
Health component. The health component is designed to improve the provision of preventive health services by health staff and to increase utilization of these services by pregnant and lactating women and children from 0 to 23 months of age. The improved provision and increased utilization of these services are expected to contribute to improvements in maternal and child health outcomes. The Tubaramure program designed this component to strengthen existing health services through the provision of training for health staff, as well as by providing some key supplies for implementing health services. Health supplies include equipment for prenatal care (e.g., vaginal speculum, Pinard obstetric stethoscope), labor and delivery (e.g., delivery table), growth monitoring (e.g., salter scale, infant scale), and curative care (e.g., thermometer, sterile equipment). In addition, utilization of preventive health services by pregnant and lactating women (pre- and postnatal services, respectively) and children 0–23 months (growth monitoring and promotion) is strongly encouraged by the Tubaramure program through the BCC strategy. Beneficiary mothers and children are expected to attend and use recommended preventive health services at the local health center, including pre- and postnatal check-ups for women and growth monitoring and vaccinations for children.
BCC component. Tubaramure’s BCC strategy was designed specifically to address many of the underlying causes of undernutrition in Burundi and to encourage the adoption of best practices in health, hygiene, and nutrition. The BCC strategy was designed to be implemented by CRS and FH staff members, locally hired Tubaramure health promoters (THPs), and leader mothers who are program beneficiaries selected by their fellow beneficiary mothers to teach them. Groups of leader mothers are first trained by the THP during leader mother care groups in health, hygiene, and nutrition topics. The curriculum contains five BCC modules, each with between 6 and 12 lessons.
The first module, “Care Group Orientation,” contains six lessons on the program’s objectives, teaching techniques, leader mother responsibilities, watching for change and monitoring groups, the value of children, and the ability to change.
The second module, “Essential Nutrition, Hygiene, and Care Practices during Pregnancy,” has nine lessons on antenatal care services and developing a birthing plan, maternal nutrition, micronutrients (iron and iodine), handwashing with soap (or ash), creation of household handwashing stations, malaria prevention, preparing for delivery and birth, immediate breastfeeding and the use of colostrum, and newborn care practices.
The third module, “Essential Nutrition, Hygiene, and Care Practices during Infancy,” contains 12 lessons on the importance of postpartum care, various aspects of exclusive breastfeeding, childhood illness danger signs, overcoming breastfeeding problems, growth monitoring and promotion, men’s involvement in breastfeeding and child care, child spacing, point-of-use water treatment and safe water sources, proper disposal of feces, malaria transmission and prevention, malarial danger signs and treatment, and home care.
The fourth module, also titled “Essential Nutrition, Hygiene, and Care Practices during Infancy,” has seven lessons largely focused on nutrition, including complementary feeding for children between 6 and 8 months of age, 9 and 11 months of age, and 12 and 23 months age; preparing CSB with local foods; the importance of vitamin A and good food sources of vitamin A; worms and deworming medication; and preparing, cooking, and storing foods.
The fifth and final module, “Management of Childhood Infections,” contains six lessons related to the signs and dangers of child dehydration, dehydration prevention using oral rehydration salts (ORS), proper feeding of sick children, dysentery and persistent diarrhea, pneumonia prevention, and developing a kitchen garden.

Strengthening and Evaluating the PM2A Approach – Burundi Follow-Up Report: Children 0–23 Months
7
The leader mother care groups should be held every 2 weeks. These leader mothers in turn train the beneficiary mothers in beneficiary mother care groups (which also meet every 2 weeks) on the topics that they have most recently learned from the THP. All beneficiaries (including leader mothers) are encouraged to adopt optimal health, hygiene, and nutrition practices as part of their participation in the Tubaramure program.
In addition to the collines participating in the evaluation study (see next section), the Tubaramure program is implemented across all collines in Cankuzo and Ruyigi.
2.3 Tubaramure Evaluation Design For the purposes of the IFPRI-led research on Tubaramure, and more specifically to answer questions related to the optimal timing and duration of exposure to PM2A programs, this study compares households located in the collines that have been randomly assigned to one of four study groups:
Tubaramure 24 (T24): the full Tubaramure program, including BCC, preventive health services, and food rations (individual and family) during pregnancy and lactation for the mother and up to the age of 24 months for the child
Tubaramure 18 (T18): the full Tubaramure program, including BCC, preventive health services, and food rations (individual and family) during pregnancy and lactation for the mother and up to the age of 18 months for the child
Tubaramure NFP (TNFP): the full Tubaramure program, including BCC, preventive health services, and food rations (individual and family) starting after birth of the child for the mother and up to the age of 24 months for the child; and the BCC and preventive health services, but no food rations, during pregnancy
Control: the Tubaramure program not provided to these households, but they may still access general health services
The Tubaramure health strengthening activities (training for health staff and the provision of key supplies for preventive health services) were implemented in all health centers throughout Cankuzo and Ruyigi, regardless of whether they were located in one of the treatment or control collines.6 These activities may thus have had a positive impact on health-related outcomes in all study arms, including the control group.
All research procedures involving human subjects were approved by IFPRI’s Institutional Review Board, and the study was approved by Ministry of Health in Burundi. Verbal informed consent was obtained from the primary household respondent before the start of each interview.
2.4 Study Methods The main outcome of the study is child nutritional status. The largest program impact on child linear growth (the main measure of nutritional status) is expected to be observed in children who have been exposed to Tubaramure consistently from early pregnancy to 24 months of age. The first group of
6 Not every colline has a health center (of the 60 collines in the study sample, only 13 have a health center). As a consequence, the health strengthening activities could not be randomized.

Strengthening and Evaluating the PM2A Approach – Burundi Follow-Up Report: Children 0–23 Months
8
children to meet this condition will be between 24 and 42 months of age in October to December 2014 (i.e., 4 years after the baseline survey).
The impacts on other outcomes, such as maternal knowledge regarding health and nutrition-related practices, including IYCF,7 are preferentially measured among mothers of children 0–23 months of age8 to reduce recall bias. The follow-up cross-sectional survey presented in this report was conducted from October to December 2012 and measures the program’s impact on these outcomes among children 0–23 months of age and their mothers.
2.4.1 Sample Size
Sample size calculations were based on the estimated program impact using the differences expected to be found at follow-up among study groups. One-sided test assumptions were used when clear a priori assumptions about the direction of the effect were justified. The required sample size in each study arm is shown below (Table 1). The sample size was calculated with the following parameters: 0.05 probability of a type I error, power of 0.90, and an intra-cluster correlation of 0.006 for stunting and 0.009 for height-for-age z-score (HAZ).
Table 1. Required sample size to measure impact on child and household outcomes
Study group
T24 T18 TNFP Control
Age (months) 0–23 24–41 0–23 24–41 0–23 24–41 0–23 24–41
Minimum sample size required (by age) 431 1,000 869 1,000 431 1,000 869 584
Minimum sample size required (per arm) 1,431 1,869 1,431 1,453
2.4.2 Sampling
To systematically select the research collines, the 210 collines meeting certain population and primary health care provision criteria were ranked according to population size and divided into 5 strata (based on population size) in Cankuzo (13 or 14 collines per stratum) and 10 strata in Ruyigi (14 or 15 collines per stratum). The number of strata per province was based on the relative population size. Within each stratum, four collines were selected using random numbers with a fixed random number seed in Stata version 11 (StataCorp 2009). The four collines in each stratum were then each assigned randomly to one of the four study arms in a public event organized in the administrative center of Ruyigi on January 25, 2010. The list of selected collines and the assigned study arms is shown in Appendix 2.
At the start of both the baseline and follow-up surveys (October of 2010 and 2012, respectively), a household census was conducted in the 60 research collines to generate a complete list of households with
7 Note that specific IYCF guidelines are available only for children under 2 years of age. 8 For ease of reference, we use “0–23 months” for children 0–23.9 months of age and “24–41 months” for children 24–41.9 months of age in the remainder of the text.

Strengthening and Evaluating the PM2A Approach – Burundi Follow-Up Report: Children 0–23 Months
9
children under 5 five years of age at baseline and under 3 years of age at follow-up.9 An enumerator visited each household in the 60 research collines to inquire if there was a child meeting the age requirements in the household. If the household met the requirement, the following information was recorded on a pre-numbered census sheet: the sous-colline10 where the household lived, the first and last names of the head of household, and the household size. The head of the household was given a pre-printed slip with a unique number corresponding to the number on the census sheet. After all households were identified and recorded, the data were entered and transferred to IFPRI.
Using the household census data, the target sample sizes for children 0–23 (baseline and follow-up) and 24–41 months of age (baseline) were calculated for each sous-colline. At baseline, the target sample size for each sous-colline was calculated by first dividing the total number of households with a child under 5 years in each sous-colline by the total number of households with a child under 5 years in the 15 collines of each study arm. The target sample size was then calculated for each age group (0–23 and 24–41 months) in each sous-colline by multiplying the sous-colline-specific proportion by the arm- and age group-specific sample size needed. The same approach was used at follow-up to calculate the number of children 0–23 months to be sampled.
A list of the potential households to be surveyed was generated for the field team in each of the 265 sous-collines. Each sous-colline-specific list showed the sous-colline identifiers and the total number of households to be visited with a child 0–23 months of age (baseline and follow-up) and 24–41 months of age (baseline). Each list further showed all (randomly ordered) households with a child 0–5 years (baseline) or 0–3 years of age (follow-up) living in the sous-colline. The supervisor of each field team was instructed to visit households in the order that they were listed until the required sample size for each age group was reached. Households were revisited when the respondent was not available. Once the quota for one age group was reached, only children from the remaining age group were sampled.
2.4.3 Selection of Index Child
At baseline, if there was only one child under 42 months of age in the household, that child was designated as the “index child.” If there was more than one child under 42 months of age, the children’s first names were alphabetized from A to Z, and the first child on the list was selected as the index child.11 The same procedure was followed for children under 24 months of age at follow-up.
2.4.4 Selection of Colline Leaders and Health Centers
To better understand the health service and community context, data were collected from a group of leaders in each colline and from all public health centers located in a research colline. To complete the colline-level questionnaire, several community leaders in each colline were invited to meet. A trained
9 No detailed age verification could be conducted at the time of the preliminary census. Therefore, a higher age cutoff for the census was used than in the survey. This strategy ensured that no households with children in the age group of interest would be missed. The exact age of the child was verified during the survey, and households not meeting the age requirement were excluded. 10 Each colline is divided into a number of sous-collines. The 60 study collines consist of a total of 265 sous-collines. 11 At baseline, it was determined that mothers with two children 0–41 months of age would be interviewed only about one child for two reasons. First, we wanted to reduce the respondent burden to the extent possible. Second, lengthy surveys can lead to poorer data quality (United Nations Department of Economic and Social Affairs Statistics Division 2005).

Strengthening and Evaluating the PM2A Approach – Burundi Follow-Up Report: Children 0–23 Months
10
member of the survey team helped the group collaboratively complete the colline-level questionnaire. The colline-level interviews were conducted at both baseline and follow-up.
To describe how health care services differed at baseline and follow-up, all public health centers located within one of the 60 research collines were invited to be interviewed. At baseline, the study team identified 13 public health centers in the research collines. All centers were visited, and a member of the anthropometry team interviewed a member (or multiple members) of the staff capable of completing the survey. It was later determined that one of the putative health centers was actually a hospital, and it was therefore not revisited at follow-up. Additionally, personnel from one center did not agree to an interview at follow-up. Thus, the description of health centers is based on the 11 health centers for which we have both baseline and follow-up data.
The sample sizes for the PM2A evaluation were calculated to detect meaningful changes in child health outcomes measured at the individual level. The study is not powered to detect meaningful changes at the health center or colline level. Therefore, these data are mainly intended to be descriptive.
2.4.5 Data Collection
Data were collected at the colline, health center, and household levels, using pretested questionnaires. The list of modules included within each of the questionnaires and brief module descriptions are presented in Tables 2, 3, 4, and 5.
Colline Questionnaire
The colline questionnaire collected information on the local schools and health services, food crops, fruit trees, presence of associations or cooperatives, forms of transportation, infrastructure, recent immigration/emigration patterns, weather conditions, development projects, and positive and negative events that affected the colline residents.
Table 2. List of modules included in colline questionnaire
Module Topic Description Respondent
1 Schools Identified schools attended by children living in the colline, including location, type, costs, and perceived quality
Group of community members
2 Health services Identified health services used by families living in the colline, including location, travel time, vaccination campaigns, and epidemics
Group of community members
3 Food crops Identified the main crops in the colline and timing of harvest Group of community members
4 Fruit trees Identified the main fruit trees in the colline and timing of harvest Group of community members
5 Community organizations
Identified existing organizations, objectives, and membership Group of community members
6 Transportation Investigated the distance from and the availability and cost of public transportation to various public services
Group of community members
7 Infrastructure Investigated the availability of electricity, water, and telephone services
Group of community members
8 History Investigated migration, climatic conditions, and living conditions over the past 5 years
Group of community members
9 Development programs
Identified presence and outcomes of local development programs over the past 5 years
Group of community members
10 Events Investigated local events (positive, negative) that affected the colline over the past 5 years
Group of community members
Strengthening and Evaluating the PM2A Approach – Burundi Follow-Up Report: Children 0–23 Months
11
Health Center Questionnaire
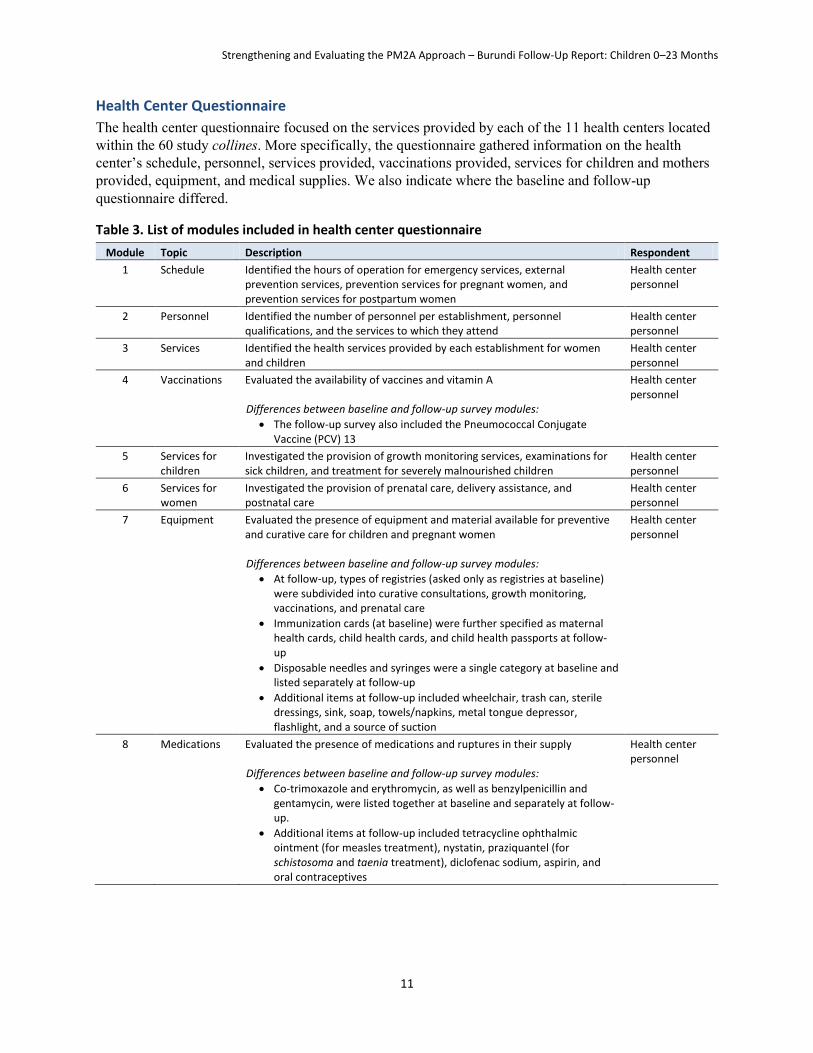
The health center questionnaire focused on the services provided by each of the 11 health centers located within the 60 study collines. More specifically, the questionnaire gathered information on the health center’s schedule, personnel, services provided, vaccinations provided, services for children and mothers provided, equipment, and medical supplies. We also indicate where the baseline and follow-up questionnaire differed.
Table 3. List of modules included in health center questionnaire
Module Topic Description Respondent
1 Schedule Identified the hours of operation for emergency services, external prevention services, prevention services for pregnant women, and prevention services for postpartum women
Health center personnel
2 Personnel Identified the number of personnel per establishment, personnel qualifications, and the services to which they attend
Health center personnel
3 Services Identified the health services provided by each establishment for women and children
Health center personnel
4 Vaccinations Evaluated the availability of vaccines and vitamin A Differences between baseline and follow-up survey modules:
The follow-up survey also included the Pneumococcal Conjugate Vaccine (PCV) 13
Health center personnel
5 Services for children
Investigated the provision of growth monitoring services, examinations for sick children, and treatment for severely malnourished children
Health center personnel
6 Services for women
Investigated the provision of prenatal care, delivery assistance, and postnatal care
Health center personnel
7 Equipment Evaluated the presence of equipment and material available for preventive and curative care for children and pregnant women Differences between baseline and follow-up survey modules:
At follow-up, types of registries (asked only as registries at baseline) were subdivided into curative consultations, growth monitoring, vaccinations, and prenatal care
Immunization cards (at baseline) were further specified as maternal health cards, child health cards, and child health passports at follow-up
Disposable needles and syringes were a single category at baseline and listed separately at follow-up
Additional items at follow-up included wheelchair, trash can, sterile dressings, sink, soap, towels/napkins, metal tongue depressor, flashlight, and a source of suction
Health center personnel
8 Medications Evaluated the presence of medications and ruptures in their supply Differences between baseline and follow-up survey modules:
Co-trimoxazole and erythromycin, as well as benzylpenicillin and gentamycin, were listed together at baseline and separately at follow-up.
Additional items at follow-up included tetracycline ophthalmic ointment (for measles treatment), nystatin, praziquantel (for schistosoma and taenia treatment), diclofenac sodium, aspirin, and oral contraceptives
Health center personnel

Strengthening and Evaluating the PM2A Approach – Burundi Follow-Up Report: Children 0–23 Months
12
Household and Anthropometry Questionnaire
The household questionnaire gathered information on household demographics and socioeconomic indicators, food security, participation in social assistance programs, shocks, and maternal12 and child characteristics. The household questionnaire was based on the questions used in the Rwanda DHS (www.measuredhs.com); the Rwanda Enquête Intégrale sur les Conditions de Vie des Ménages (EICV 1998); and other instruments from a variety of sources, including the FANTA Household Hunger Scale (HHS), the FANTA Household Dietary Diversity Scale (HDDS) (Deitchler et al. 2010; Swindale and Bilinsky 2006), and the 20 question Self-Report Questionnaire (SRQ-20) (World Health Organization [WHO] 1994) to evaluate maternal health and stress. The WHO IYCF instrument was used to construct breastfeeding and complementary feeding indicators for children 0–23 months of age (WHO 2008; WHO 2010). All modules were adapted to the specific needs of this study. Table 4 presents the modules included in the questionnaire, the questionnaire or instrument the module was based on, and a short description of each module. We also indicate where the baseline and follow-up questionnaire differed.
Table 4. List of modules included in household questionnaire
Module Topic Source Description Respondent
1 Household roster and education
IFPRI Collected information on the composition of the household, including designation of the head of household, a list of all household members, their age* and sex, and their relationship to the head of household, (biological) parents of the children under 5 years of age, and the highest educational level attained and activity/employment in the past month of all household members at least 3 years of age
* The child’s birth date was obtained from the birth certificate, the child’s vaccination card, or from recall if neither document was available
Head of household (HH), spouse, or HH member over 18 years of age
2 Eligible child IFPRI Identified all children 0–23 months (baseline and follow-up) and 24–41 months of age (baseline only) and randomly selects the index child (baseline and follow-up)
Head of HH, spouse, or HH member over 18 years of age
3 Dwelling EICV Identified construction materials used for floor, walls, and roof; availability of water and electricity; fuel/energy used for cooking, lighting, etc.
Mother or HH member over 18 years of age
4 Assets EICV, IFPRI Identified ownership of durable household goods (in working condition), including tools for agricultural production
Mother or HH member over 18 years of age
5 Household dietary diversity
FANTA HDDS
Evaluated the diversity of the household diet in the last 24 hours Individual in charge of food preparation, or HH member over 18 years of age
6 Participation in social programs
IFPRI Identified all social programs that household members participate in and the benefits received from those programs Differences between baseline and follow-up survey modules:
A section on participation in Tubaramure was added at follow-up
Head of HH, spouse, or HH member over 18 years of age
12 Data were collected on the mother or caretaker of the index child. Where the index child did not live with his/her biological mother, data were collected from the caretaker of that index child.
Strengthening and Evaluating the PM2A Approach – Burundi Follow-Up Report: Children 0–23 Months
13
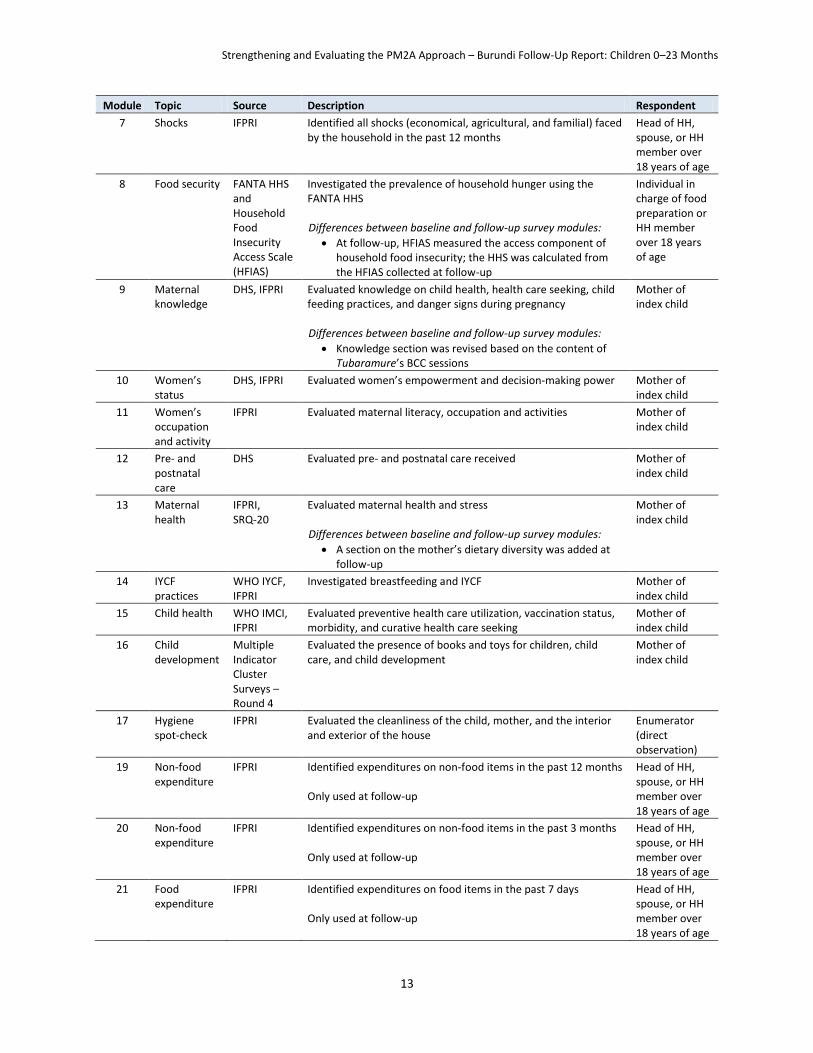
Module Topic Source Description Respondent
7 Shocks IFPRI Identified all shocks (economical, agricultural, and familial) faced by the household in the past 12 months
Head of HH, spouse, or HH member over 18 years of age
8 Food security FANTA HHS and Household Food Insecurity Access Scale (HFIAS)
Investigated the prevalence of household hunger using the FANTA HHS Differences between baseline and follow-up survey modules:
At follow-up, HFIAS measured the access component of household food insecurity; the HHS was calculated from the HFIAS collected at follow-up
Individual in charge of food preparation or HH member over 18 years of age
9 Maternal knowledge
DHS, IFPRI Evaluated knowledge on child health, health care seeking, child feeding practices, and danger signs during pregnancy Differences between baseline and follow-up survey modules:
Knowledge section was revised based on the content of Tubaramure’s BCC sessions
Mother of index child
10 Women’s status
DHS, IFPRI Evaluated women’s empowerment and decision-making power Mother of index child
11 Women’s occupation and activity
IFPRI Evaluated maternal literacy, occupation and activities Mother of index child
12 Pre- and postnatal care
DHS Evaluated pre- and postnatal care received Mother of index child
13 Maternal health
IFPRI, SRQ-20
Evaluated maternal health and stress Differences between baseline and follow-up survey modules:
A section on the mother’s dietary diversity was added at follow-up
Mother of index child
14 IYCF practices
WHO IYCF, IFPRI
Investigated breastfeeding and IYCF Mother of index child
15 Child health WHO IMCI, IFPRI
Evaluated preventive health care utilization, vaccination status, morbidity, and curative health care seeking
Mother of index child
16 Child development
Multiple Indicator Cluster Surveys – Round 4
Evaluated the presence of books and toys for children, child care, and child development
Mother of index child
17 Hygiene spot-check
IFPRI Evaluated the cleanliness of the child, mother, and the interior and exterior of the house
Enumerator (direct observation)
19 Non-food expenditure
IFPRI Identified expenditures on non-food items in the past 12 months Only used at follow-up
Head of HH, spouse, or HH member over 18 years of age
20 Non-food expenditure
IFPRI Identified expenditures on non-food items in the past 3 months Only used at follow-up
Head of HH, spouse, or HH member over 18 years of age
21 Food expenditure
IFPRI Identified expenditures on food items in the past 7 days Only used at follow-up
Head of HH, spouse, or HH member over 18 years of age

Strengthening and Evaluating the PM2A Approach – Burundi Follow-Up Report: Children 0–23 Months
14
The anthropometry questionnaire was used to record height (or length), weigh, and Hb concentration of the index children and their mothers (Table 5).
Table 5. List of modules included in anthropometry questionnaire
Module Topic Description Respondent
18 Child anthropometry
Child weight and length/height were measured; length or height was measured twice and a third time if the difference between the first two measurements exceeded 6 mm; weight was measured once
Index child
Maternal anthropometry
Mother’s height and weight were measured and pregnancy status recorded; maternal height was measured twice and a third time if the difference between the first two measurements exceeded 1 cm; weight was measured once
Mother and index child
Mother and child Hb concentration
Hb concentrations of the index child and his/her mother were measured Mother and index child
2.4.6 Field Work
Census
ISTEEBU hired and trained data collectors with previous experience conducting censuses. During this training, census workers were oriented to Cankuzo and Ruyigi provinces, organized into field teams, and instructed to visit each house within the 60 collines to identify all households with children under 5 (baseline) or 3 years of age (follow-up). IFPRI provided preprinted census sheets for each sous-colline to record the name of the head of the household and the number of household members for each household with a child meeting the age criterion.
Colline, Health Center, and Household Surveys
Survey firm. The firm ISTEEBU was selected to conduct the baseline survey and the follow-up survey.
Survey teams. In each survey team (22 at baseline, 8 at follow-up), there were four enumerators, two anthropometrists, and one team controller. The enumerators conducted the household survey and the anthropometrists collected and recorded the anthropometric and Hb data. The controllers were responsible for checking the quality of the data and for conducting the colline surveys. Two supervisors oversaw the eight controllers. The anthropometry team was responsible for conducting the health center survey. The supervisors (four at baseline, two at follow-up) reported to the coordinating team based in Bujumbura. Survey teams were assigned to specific collines and were monitored closely and continuously by the survey firm and IFPRI staff and consultants throughout the fieldwork. Continuous monitoring ensured that a high level of data quality was maintained and that challenges encountered during fieldwork were addressed in an efficient and timely manner.
Training of supervisors. The supervisors helped pretest the French version of the questionnaire and verified and revised the Kirundi version as needed. Therefore, they were well oriented to the project prior to the training of controllers, enumerators, and anthropometrists. The supervisors attended both the 1-week training for controllers and the 4-week training for enumerators. They were trained to manage a large team of enumerators, organize the questionnaires, and monitor and report progress and problems to ISTEEBU.
Training of controllers. Twenty-two controllers completed 1 week of specialized training using lectures, role-plays, discussions of potential responses, and discussions of how to code responses. Following this training course, all controllers participated in the enumerator training. Controllers assisted the enumerator training process by leading small group role-plays.

Strengthening and Evaluating the PM2A Approach – Burundi Follow-Up Report: Children 0–23 Months
15
Training of enumerators. A variety of methods were used to train the enumerators in the use of the survey questionnaire over the course of 4 weeks. These included lectures, role-plays, discussions of potential responses, and discussions of how to code responses. The controllers and enumerators were continuously evaluated during the training. Each week, a short written test was used to evaluate their understanding of the questionnaire. The final selection of controllers and enumerators was based on a short field-based evaluation at the end of the training.
Standardization of the anthropometry team. The fieldworkers who conducted the anthropometric measurements were carefully trained for 2 weeks in the use of the equipment and the recording of anthropometric data. Their training included lectures, videos, and equipment demonstrations and was followed by practical exercises in the measurement of height and weight of infants, children, and mothers. The fieldworkers were then standardized (Cogill 2003) in the measurement of height and weight. First, the trainer and all fieldworkers measured the height and weight of five children 0–41 (baseline) or 0–23 (follow-up) months of age and their mothers with each fieldworker measuring each child twice. A spreadsheet was created to compute the precision and accuracy of all trainees. A second round of standardization was organized for those needing more practice. Based on the results of the standardization, the most accomplished anthropometrists were selected.
Training on the collection of capillary blood. The members of the anthropometry team were trained to collect capillary blood from mothers and children using a sterile spring-loaded lancet. This method standardized the depth of the puncture and minimized the need to puncture more than once. Enumerators were trained on the proper procedure for taking the sample and measuring the Hb concentration using portable Hemocue machines. Training covered proper techniques for sterile sample collection, including how to use a sterile lancet and making sure a new set of sterile gloves was used for each sample. The enumerator used an alcohol swab to clean the area to be pricked both before and after the procedure and also applied a small bandage when finished. Each enumerator was supplied with a small plastic container to collect the waste from the procedure. The enumerators were also trained in the correct techniques to collect the blood sample in the micro-cuvette to minimize the need to repeat the procedure.
Administration of the health center questionnaire. The anthropometrists administered the health center questionnaire to at least one health professional per health center facility.
Administration of the colline questionnaire. Each colline questionnaire was conducted using a group interview methodology. The questionnaire was completed by at least two controllers who ensured that a consensus was reached on all responses.
Administration of the household and anthropometry questionnaires. Information sessions were organized in each colline before the survey work began. The information sessions explained the purpose of the survey to the community members; provided reasons for measuring children’s and mothers’ height, weight, and Hb; and requested the cooperation of community members. The enumerators reviewed each questionnaire before leaving the household where it was administered. At the end of each day, the controllers reviewed each questionnaire for accuracy, logical patterns, and legible writing. Enumerators and anthropometrists were asked to return to households when missing data or other problems were observed.
Handling of questionnaires. Upon completion of each household interview, the enumerators submitted their questionnaires to their respective controller. The controller recorded the number of questionnaires completed per age group and sous-colline to monitor whether the quotas were reached. Once all the questionnaires in the sous-collines in a single colline were completed, the controller gave the completed package to her or his respective supervisor. The supervisors then checked the questionnaires that they received from controllers for quality. The supervisors recorded

Strengthening and Evaluating the PM2A Approach – Burundi Follow-Up Report: Children 0–23 Months
16
and reported the total number of questionnaires completed by colline and age group to the coordinators. Questionnaires were grouped according to colline, commune, and province, and then transported back to ISTEEBU in Bujumbura for data entry.
2.4.7 Data Entry and Cleaning
Data Entry
ISTEEBU developed a data entry program using CSPro and provided 10 data entry clerks with an interface resembling the paper questionnaire. Two different data entry clerks entered each of the health center, colline, household, and anthropometry questionnaires into the CSPro program. At the end of the data entry period, lists of inconsistencies between the first and second entry of the same questionnaire were generated and mistakes corrected.
Data Cleaning
The data were transferred to Stata (StataCorp Stata Statistical Software: Release 13) and standard data cleaning checks were performed. All observations with problems were listed and verified using the paper questionnaires.
Variable Creation
From the data collected, new variables were also created to summarize health center, household, and individual characteristics more concisely. Many of these variables were based on norms and standards provided by international organizations and the government of Burundi. The variables created in this study are summarized below.
Health center variables. We compared the information obtained from the health center questionnaires to the national guidelines for health centers (Ministère de la Santé Publique et de la Lutte contre le SIDA 2012a and 2012b). These guidelines describe the qualifications of essential personnel; the recommended characteristics of the facilities; and the essential equipment, medications, and supplies that each health center should stock.
Personnel. An A2-level nurse has completed 4 years of nurse training after 10th grade. An A3-level nurse has completed 2 years of training after 10th grade. A nutritionist is an A3-level nurse with specialized nutrition training. An A2-level laboratory technician has completed 4 years of specialized training after 10th grade. (Training requirements for other personnel are not described.)
Total number of services for sick children. This value sums the availability of eight essential services for sick children: measure body temperature, measure weight, chart weight, offer antibiotics, offer acetaminophen for fever, provide health education, evaluate immunization status, and evaluate vitamin A status (range of the created variable 0 to 8, with 0 indicating that none of the 8 services was available and 8 indicating that all of them were available).
Total number of services for children with diarrhea. This value sums the availability of four essential services for children with diarrhea: ORS, oral serum, zinc supplementation, and onsite intravenous solution in the case of severe diarrhea (range 0 to 4).
Total number of prenatal care components. This value sums the availability of eight essential service components offered during prenatal visits: measure weight, measure abdomen, measure blood pressure, offer tetanus vaccine, distribute iron folate or iron and folate, offer education sessions, administer albendazole or mebendazole for deworming, and administer niclosamide for taenia deworming (range 0 to 8).
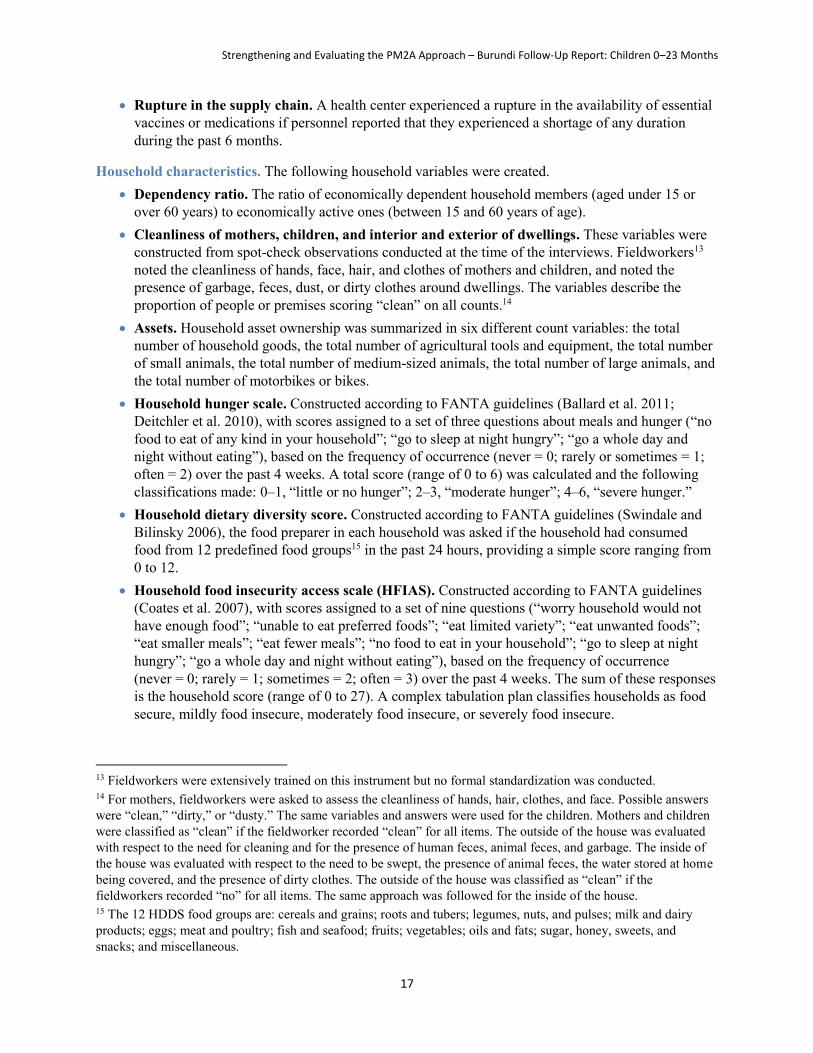
Strengthening and Evaluating the PM2A Approach – Burundi Follow-Up Report: Children 0–23 Months
17
Rupture in the supply chain. A health center experienced a rupture in the availability of essential vaccines or medications if personnel reported that they experienced a shortage of any duration during the past 6 months.
Household characteristics. The following household variables were created. Dependency ratio. The ratio of economically dependent household members (aged under 15 or
over 60 years) to economically active ones (between 15 and 60 years of age). Cleanliness of mothers, children, and interior and exterior of dwellings. These variables were
constructed from spot-check observations conducted at the time of the interviews. Fieldworkers13 noted the cleanliness of hands, face, hair, and clothes of mothers and children, and noted the presence of garbage, feces, dust, or dirty clothes around dwellings. The variables describe the proportion of people or premises scoring “clean” on all counts.14
Assets. Household asset ownership was summarized in six different count variables: the total number of household goods, the total number of agricultural tools and equipment, the total number of small animals, the total number of medium-sized animals, the total number of large animals, and the total number of motorbikes or bikes.
Household hunger scale. Constructed according to FANTA guidelines (Ballard et al. 2011; Deitchler et al. 2010), with scores assigned to a set of three questions about meals and hunger (“no food to eat of any kind in your household”; “go to sleep at night hungry”; “go a whole day and night without eating”), based on the frequency of occurrence (never = 0; rarely or sometimes = 1; often = 2) over the past 4 weeks. A total score (range of 0 to 6) was calculated and the following classifications made: 0–1, “little or no hunger”; 2–3, “moderate hunger”; 4–6, “severe hunger.”
Household dietary diversity score. Constructed according to FANTA guidelines (Swindale and Bilinsky 2006), the food preparer in each household was asked if the household had consumed food from 12 predefined food groups15 in the past 24 hours, providing a simple score ranging from 0 to 12.
Household food insecurity access scale (HFIAS). Constructed according to FANTA guidelines (Coates et al. 2007), with scores assigned to a set of nine questions (“worry household would not have enough food”; “unable to eat preferred foods”; “eat limited variety”; “eat unwanted foods”; “eat smaller meals”; “eat fewer meals”; “no food to eat in your household”; “go to sleep at night hungry”; “go a whole day and night without eating”), based on the frequency of occurrence (never = 0; rarely = 1; sometimes = 2; often = 3) over the past 4 weeks. The sum of these responses is the household score (range of 0 to 27). A complex tabulation plan classifies households as food secure, mildly food insecure, moderately food insecure, or severely food insecure.
13 Fieldworkers were extensively trained on this instrument but no formal standardization was conducted. 14 For mothers, fieldworkers were asked to assess the cleanliness of hands, hair, clothes, and face. Possible answers were “clean,” “dirty,” or “dusty.” The same variables and answers were used for the children. Mothers and children were classified as “clean” if the fieldworker recorded “clean” for all items. The outside of the house was evaluated with respect to the need for cleaning and for the presence of human feces, animal feces, and garbage. The inside of the house was evaluated with respect to the need to be swept, the presence of animal feces, the water stored at home being covered, and the presence of dirty clothes. The outside of the house was classified as “clean” if the fieldworkers recorded “no” for all items. The same approach was followed for the inside of the house. 15 The 12 HDDS food groups are: cereals and grains; roots and tubers; legumes, nuts, and pulses; milk and dairy products; eggs; meat and poultry; fish and seafood; fruits; vegetables; oils and fats; sugar, honey, sweets, and snacks; and miscellaneous.

Strengthening and Evaluating the PM2A Approach – Burundi Follow-Up Report: Children 0–23 Months
18
Maternal characteristics. The following variables were created to describe maternal characteristics. Maternal literacy. Literacy was evaluated by asking mothers to read one of two sentences. The
women were classified as literate if they could read the entire sentence, partially literate if they could read a little, and illiterate if they could not read the sentence at all.
Maternal knowledge. Mothers were asked a series of questions to assess their knowledge of danger signs during pregnancy and for childhood illnesses, how to care for a sick child or a child recovering from an illness, appropriate IYCF practices regarding breastfeeding and complementary feeding, and optimal hygiene practices for the prevention of diarrhea. Separate variables were created to describe the proportion of mothers responding correctly to each knowledge question within these four categories.
Maternal dietary diversity. Maternal diet was calculated based on international standards and using a nine-food-group dietary diversity score (Kennedy et al. 2011). Based on the mother’s 24-hour dietary recall, all foods and liquids consumed were classified into one of nine food groups (starchy staples, dark green leafy vegetables, vitamin A-rich fruits and vegetables, other fruits and vegetables, organ meat, flesh foods, eggs, legumes/nuts/seeds, and milk and milk products). Data to create these variables were collected only at follow-up. Dietary diversity included CSB consumption (contributed to the starchy staples and legumes/nuts/seeds groups).
Preventive health care practices. Preventive health care practices reported by mothers were evaluated in relation to national recommendations, detailed in the text below.
Prenatal care. The total number of prenatal care visits was compared to the national recommendation of four visits per pregnancy (Ministère de la Santé Publique 2010). Receipt of specific prenatal care services were examined in relation to the national protocol to be followed by medical staff (Ministère de la Santé Publique/WHO 2007; Ministère de la Santé Publique 2010). Burundi’s Ministry of Health recommends that all pregnant women take daily iron-folate prenatal vitamins with the dosage of 60 mg iron and 400 μg folic acid.
Postnatal care. Mothers are advised to see a medical professional with their newborns within 4 days of the birth of their child. In settings where the prevalence of anemia among pregnant women is greater than 40%, all women should continue receiving the same iron-folate dosage listed above for 3 months postpartum (Ministère de la Santé Publique 2010).
Preventive child care practices. The standards for growth monitoring, vitamin and mineral supplement use, and vaccination coverage were based on national (or, if not available, international) standards. Information about child weight, supplements, and vaccinations were provided by the child’s vaccination card. Information about these preventive care visits was recorded directly from the vaccination card if the primary caregiver presented the card at the time of the interview. If the primary caregiver could not present the vaccination card, she was asked to recall the preventive care that the child had received. The following variables were created.

Strengthening and Evaluating the PM2A Approach – Burundi Follow-Up Report: Children 0–23 Months
19
o Growth monitoring visits. According to UNICEF (2002) guidelines, children aged 0–23 months should be taken to a clinic monthly for growth monitoring and children aged 24–42 months should be taken to a clinic every 3 months for growth monitoring.16
o Vitamin and mineral supplements. According to national recommendations,17 children should begin receiving vitamin A supplements at 9 months and continue receiving vitamin A every 6 months until 5 years of age.
o Vaccination. The national vaccination schedule (Table 6) was used to calculate the percentage of children fully immunized according to their age. To construct this variable, a 1-month grace period was added to each recommended vaccination age. Children older than this calculated age (and younger than the next recommended age plus a 1-month grace period) with all recommended vaccinations for that age were considered fully immunized. Only information recorded from vaccination cards was used to construct these variables, and vaccination information collected from maternal reports was considered missing.
Table 6. National vaccination schedule for Burundi
Age Vaccination
Birth (0 weeks) BCG,* Polio-0
6 weeks DPT1-HiB1-HepB1,** Polio-1
10 weeks DPT2-HiB2-HepB2, Polio-2
14 weeks DPT3-HiB3-HepB3, Polio-3
9 months Measles
* Bacille Calmette-Guérin (tuberculosis vaccine)
** Vaccines for diphtheria, pertussis, and tetanus (DPT), haemophilus influenza B (HiB), and hepatitis B
IYCF practices. The WHO IYCF practices instrument (WHO 2010) was used to construct the WHO-recommended indicators for breastfeeding and complementary feeding of children 0–23 months of age.
Child ever breastfed. Proportion of children 0–23 months of age ever given breast milk (based on historical recall of the primary caregiver).18
Early initiation of breastfeeding (within 1 hour of birth): Proportion of children 0–23 months of age that were put to the breast within 1 hour of birth (the indicator relies on the historical recall of the primary caregiver).19
16 The Tubaramure process evaluation conducted in 2011 found that activities were limited to growth monitoring (not growth monitoring and promotion). In most cases, only the weight was recorded, and even when moderately malnourished children were identified, they were not counseled or referred for treatment (Olney et al. 2013). 17 WHO’s current recommendation is to start supplementation at 6 months. The Burundi recommendation is thus different from WHO’s. 18 The actual WHO indicator is the proportion of mothers who have given birth in the last 2 years who ever gave breast milk to the last child born. 19 The actual WHO indicator is the proportion of mothers who have given birth in the last 2 years who were put to the breast within 1 hour of birth.

Strengthening and Evaluating the PM2A Approach – Burundi Follow-Up Report: Children 0–23 Months
20
Exclusive breastfeeding of children among children under 6 months of age. Proportion of children 0–5 months of age who were given nothing but breast milk (no other liquids or solids) in the past 24 hours. The indicator does not report the percentage of children under the age of 6 months who were exclusively breastfed; it only defines the percentage of children under 6 months of age who were exclusively breastfed in the last 24 hours. The indicator likely overestimates the children who were exclusively breastfed.
Predominant breastfeeding among children under 6 months of age. Proportion of children 0–5 months of age given breast milk and specific other liquids,20 but no solids, in the past 24 hours. Those children classified as exclusively breastfed by the previous indicator are also classified as predominantly breastfed.
Continued breastfeeding at 1 year of age (12–15 months). Proportion of children 12–15 months of age who were breastfed in the past 24 hours.
Continued breastfeeding to 2 years of age (20–23 months). Proportion of children 20–23 months of age who were breastfed in the past 24 hours.
Age-appropriate breastfeeding. Proportion of children from birth to 6 months of age given only breast milk in the past 24 hours, and proportion of children 6–23 months of age who received breast milk, as well as solid, semi-solid, or soft foods, during the past 24 hours.
Bottle feeding. Proportion of children 0–23 months of age fed using a bottle in the past 24 hours. Milk feeding frequency for non-breastfed children (≥ 2 milk feedings/day). Proportion of non-
breastfed children 6–23 months of age given at least two milk feeds in the past 24 hours. Introduction of solid, semi-solid, or soft foods (6–8 months). Proportion of children 6–8 months
of age given solid, semi-solid, or soft foods in the past 24 hours. Consumption of iron-rich or iron-fortified foods. Proportion of children 6–23 months of age
who were fed iron-rich food (or food that was fortified with iron and made especially for children) in the previous 24 hours. In Burundi, food fortified with iron can include CSB and other cereal-based fortified food products.
Minimum dietary diversity (≥ 4 food groups). Proportion of children 6–23 months of age who consumed food from at least four food groups (out of seven nutrient-rich food groups21) in the past 24 hours. Dietary diversity included CSB consumption (contributed to the grains, roots, and tubers and legumes, nuts, and pulses groups).
Minimum meal frequency. Proportion of children, both breastfed and non-breastfed, given a minimum number of meals in the past 24 hours. For breastfed children aged 6–8 months, the minimum number of meals was set at two, for breastfed children aged 9–23 months, the minimum number of meals was set at three, and for non-breastfed children the number of meals was set at four.
20 This includes certain liquids, such as water or water-based drinks, fruit juice, ritual fluids and ORS, drops, or syrups (vitamins, minerals, medicines), but excludes non-human milk and food-based fluids. 21 The seven food groups were: grains, roots, and tubers; legumes, nuts, and pulses; milk and dairy products; eggs; flesh foods; vitamin A-rich foods; and other fruits and vegetables.

Strengthening and Evaluating the PM2A Approach – Burundi Follow-Up Report: Children 0–23 Months
21
Minimum acceptable diet. Proportion of children 6–23 months of age who received the minimum acceptable diet. This indicator was calculated for both breastfed and non-breastfed children. For breastfed children, it was defined as meeting both the minimum dietary diversity and the minimum meal frequency requirements; for non-breastfed children, it was defined as having received at least two milk feedings, having consumed food from at least four food groups (out of six nutrient-rich food groups22), and the minimum meal frequency in the past 24 hours.
Anthropometric measures. Mothers’ anthropometric data were used to construct the following indicators.
Maternal body mass index (BMI). Calculated for non-pregnant women as weight (kg)/height2 (m). Three BMI categories were created: underweight (BMI < 18.5), normal weight (BMI ≥18.5 and < 25), and overweight/obese (BMI ≥ 25) (WHO Expert Committee on Physical Status 1995).
Maternal and child Hb and anemia. Hb concentrations vary with altitude. The Hb concentration values were thus adjusted according to international guidelines (International Nutritional Anemia Consultative Group 2002; Stevens et al. 2013; WHO 2011a) and using the following formula:
𝑚𝑒𝑎𝑠𝑢𝑟𝑒𝑑 𝐻𝑏 +(0.32 ∗ (altitude ∗ 0.0033)) − (0.22 ∗ (altitude ∗ 0.0033)2)
10 if altitude > 1,000 m
Anemia was defined for non-pregnant women as having an Hb concentration less than 12 g/dL and for pregnant women and children as having an Hb concentration less than 11 g/dL. Severe anemia was defined for non-pregnant women as having an Hb concentration less than 8 g/dL and for pregnant women and children as having an Hb concentration less than 7 g/dL (WHO 2011a; WHO 2011b).
Child development indicators. Children’s motor and language development were assessed by parental report using a predefined list of motor and language milestones ranked in order to reflect a generally accepted sequence of achievement. The motor milestone scale consists of 30 motor milestones ranging from the first milestone of a child being able to hold his or her head straight to the 30th milestone of skipping using alternate legs. The language milestone scale consists of 21 milestones and ranges from the first—making sounds while playing alone—to the 21st—talking about things that took place in the past. The scales are adapted from ones previously used in Tanzania (Olney et al. 2009; Stoltzfus et al. 2001). Items are ordered to reflect the sequence of motor and language development and are derived from the Griffiths and McCarthy scales (Griffiths 1970; McCarthy 1972).
Milestone achievement was assessed for children older than 3.9 months. Parents were asked if their child had achieved each of the motor and language milestones. Once three milestones were recorded as not being achieved, the interviewer stopped asking about the remaining milestones. In addition to the parental report, children were asked to demonstrate key motor milestones, such as crawling, walking with and without assistance, and standing alone (WHO Multicentre Growth Reference Study Group 2006).
The impact of the Tubaramure program on child development (motor and language development) was examined by looking at differences between groups from baseline to follow-up on the highest language and motor milestones attained. Highest attained milestone was defined as the highest milestone reported
22 The six food groups were: grains, roots, and tubers; legumes, nuts, and pulses; eggs; flesh foods; vitamin A-rich foods; and other fruits and vegetables.

Strengthening and Evaluating the PM2A Approach – Burundi Follow-Up Report: Children 0–23 Months
22
by the parent. Impacts were assessed for the full sample of children between 4 and 23 months of age and then within two age ranges (4–11 months and 12–23 months).
2.4.8 Data Analysis and Impact Estimation
Descriptive analyses were conducted for the colline, health center, and household data. In the case of the colline and household data, the analyses serve to provide information on the context of the study area and to ascertain differences among the four study arms at baseline (balance among study arms). Double difference estimates were used to determine the impact of Tubaramure on key outcomes at the household level. Tubaramure did not specifically aim to improve colline and health center characteristics; therefore, no impact of the program is assessed. In the case of the health centers, which all benefited from Tubaramure services (no control group), only baseline and follow-up indicators were compared. All data were analyzed using Stata Release 13.
Colline: Descriptive Analyses
Colline-level results are presented as percentages or means and standard deviations (SD) as appropriate. Results are presented by study group, and final sample sizes are reported in the results tables in Section 3. To compare results among the four study arms at baseline and follow-up, we used the following linear model for continuous and dichotomous variables:
yi = 0 + 1Si1 + 2Si2 + 3Si3 + εi
where yi is the variable or indicator of interest for observation i and three dummy variables (Si) indicate assignment to one of the three treatment arms. A joint F-test was used to determine whether there were statistically significant differences among the study arms. For categorical variables, the Pearson chi-square statistic was converted into an F statistic.
Results were considered significantly different among the four study arms if p < 0.05. Variables that have significant differences between the study arms are marked with an asterisk (*) in the results tables. For categorical variables, the asterisk is placed in the row of the last category.
Health Center: Descriptive Analyses
Results for the 11 health centers are presented as counts or as means and SDs as appropriate. Tubaramure health service interventions were implemented in all health centers regardless of whether they were located in a control or treatment arm; therefore, results are not differentiated by study arm. Because of the small sample size, statistical tests were not used to compare differences between baseline and follow-up.
Household: Descriptive Analyses and Impact Estimation
Descriptive analyses. Similar to the colline analyses, the variables or indicators of interest are presented as percentages or means and SDs as appropriate in the household, maternal, and child results sections. All tables present the variables and indicators by study group, and, when appropriate, results are presented according to child age. The final sample sizes for each table are reported in the tables.
To compare results among the four study arms at baseline and follow-up, we used the following linear model for continuous and dichotomous variables:
yi = 0 + 1Si1 + 2Si2 + 3Si3 + εi
where yi is the variable or indicator of interest for observation i. We included three dummy variables (Si.) for the study arms. For data collected at the household level, the standard errors of the parameters were

Strengthening and Evaluating the PM2A Approach – Burundi Follow-Up Report: Children 0–23 Months
23
adjusted for the (potential) lack of independence between observations in the same colline by using a clustered sandwich estimator. A joint F-test was used to determine whether there were statistically significant differences among the study arms.
For categorical variables, the Pearson chi-square statistic was adjusted for the lack of independence between clusters with the second-order correction of Rao and Scott (1984) and converted into an F statistic.
Results were considered significantly different among the study arms if p < 0.05. Variables that have significant differences among the study arms are marked with an asterisk (*) in the results tables. For categorical variables, the asterisk is placed in the row of the last category.
Impact estimation. Program impact was estimated using the following double difference colline-fixed effect model. This model compares the change in the outcomes from baseline to follow-up among study groups.
𝑦𝑡=0,1 = 𝛽0 + 𝛽1𝑇𝑗 + 𝛽2𝑆𝑖 + 𝛽3𝑇𝑗𝑆𝑖 + 𝛽4𝐶 + 𝛽𝑖𝑋𝑖,𝑡=0 + 𝜀
where Tj is time (baseline or follow-up), Si is the assigned study arm, and C is a vector representing colline-level fixed effect. The coefficient 𝛽3 represents the estimated treatment effect of the program. By using colline-level fixed effects, the model controls for unobserved colline characteristics that did not change between baseline and follow-up. To reduce residual noise and maximize power, baseline covariates (𝑋𝑖,𝑡=0) were added to the model for some outcomes. The covariates included in the model are indicated in the footnotes of each table.
As indicated above, data on some outcomes are only available at follow-up (e.g., maternal dietary diversity). The simple difference model was used to estimate impact on these outcomes.
𝑦𝑡=1 = 𝛽0 + 𝛽1𝑆𝑖 + 𝛽𝑖𝑋𝑖,𝑡=0 + 𝜀
The coefficient 𝛽1 represents the estimated treatment effect of the program in this model.
The standard errors (SE) of all estimated parameters were adjusted for the (potential) lack of independence between observations in the same colline by using a clustered sandwich estimator. We conducted intent-to-treat analyses. One-sided tests were used when there was a clear a priori hypothesis of the direction of the effect and are indicated in the footnotes of each table.
Impact estimation on health care utilization. With respect to the program’s effect on health care utilization, it is important to point out that the program could have improved health care utilization through two distinct pathways: increasing the supply of services in the health centers and increasing the demand for these services. We refer to the first type of impact as the “supply” effect and the second type of impact as the “demand” effect.
Supply effect. The program’s health strengthening activities could have improved utilization through an increase in the supply of services. As previously mentioned, the health strengthening activities were implemented in all health centers throughout Cankuzo and Ruyigi, regardless of whether they were located in one of the treatment or control collines. If these activities had a positive impact on health care utilization, changes over time would be observed in all study arms (i.e., including the control group). Unfortunately, the evaluation design does not allow us to attribute these changes to the Tubaramure program, as they might be due to other programs active in the area. However, because the Tubaramure program is the only program regularly active in all

Strengthening and Evaluating the PM2A Approach – Burundi Follow-Up Report: Children 0–23 Months
24
health centers in both provinces, it is likely that changes are due to the program’s health strengthening activities.
Demand effect. The second pathway of impact is through the program’s BCC activities, which could have increased the demand for services. Impacts through this pathway would be observed in the Tubaramure treatment groups only and can thus be attributed to the program.

Strengthening and Evaluating the PM2A Approach – Burundi Follow-Up Report: Children 0–23 Months
25
3. Results: Colline and Health Center Characteristics
3.1 Colline Characteristics
3.1.1 Utilities, Infrastructure, and Access to Services
Very few collines had access to any form of electricity (Table 7). One colline had access to electricity via the water company at both baseline and follow-up. Between the two waves of data collection, privately generated electricity (i.e., generators, solar panels, batteries) became more common in all four of the study arms. Access to landlines and mobile phones also improved between baseline and follow-up. More collines reported that the closest landline was within 5 km. In all but one colline, residents could access a mobile phone network from within the colline, but only 43.3% of the collines had a place to charge a mobile phone at follow-up, although that is considerably more than the 23.3% that could do so at baseline. During both the dry and rainy seasons, public spigots were the most common source of drinking water. Importantly, the four study arms did not differ in their access to utilities.
Table 7. Utilities and infrastructure in each collinea
Baselineb Follow-upc
N
Full sample
Study arm Full sample
Study arm
T24 T18 TNFP Ctrl T24 T18 TNFP Ctrl
60 15 15 15 15 60 15 15 15 15
Electricity source
None 96.7 93.3 93.3 100.0 100.0 76.7 80.0 73.3 80.0 73.3
Water company 1.7 0.0 6.7 0.0 0.0 1.7 0.0 6.7 0.0 0.0
Individual generator 0.0 0.0 0.0 0.0 0.0 1.7 6.7 0.0 0.0 0.0
Solar panels 1.7 6.7 0.0 0.0 0.0 18.3 13.3 20.0 13.3 26.7
Batteries 0.0 0.0 0.0 0.0 0.0 1.7 0.0 0.0 6.7 0.0
Distance to a landline telephone
0 km (in colline) 10.0 26.7 6.7 6.7 0.0 30.9 28.6 28.6 33.3 33.3
1–5 km 11.7 6.7 6.7 20.0 13.3 16.4 28.6 14.3 13.3 8.3
6–10 km 5.0 6.7 13.3 0.0 0.0 1.8 0.0 0.0 6.7 0.0
> 10 km 73.3 60.0 73.3 73.3 86.7 50.9 42.9 57.1 46.7 58.3
Distance to a mobile phone network
0 km (in colline) 88.3 93.3 93.3 86.7 80.0 98.3 100.0 100.0 100.0 93.3
1–5 km 6.7 6.7 0.0 13.3 6.7 1.7 0.0 0.0 0.0 6.7
6–10 km 3.3 0.0 6.7 0.0 6.7 0.0 0.0 0.0 0.0 0.0
> 10 km 1.7 0.0 0.0 0.0 6.7 0.0 0.0 0.0 0.0 0.0
Possible to charge mobile in the colline
23.3 20.0 40.0 6.7 26.7 43.3 40.0 46.7 33.3 53.3
Most common drinking water source: dry season
Tap water 8.3 13.3 6.7 0.0 13.3 26.7 13.3 40.0 26.7 26.7
Public spigot 68.3 73.3 60.0 86.7 53.3 60.0 80.0 40.0 66.7 53.3
Uncovered well 3.3 6.7 0.0 0.0 6.7 1.7 0.0 0.0 6.7 0.0
River or lake 20.0 6.7 33.3 13.3 26.7 11.7 6.7 20.0 0.0 20.0
Most common drinking water source: wet season
Tap water 15.0 20.0 20.0 0.0 20.0 36.7 26.7 53.3 33.3 33.3
Public spigot 66.7 66.7 66.7 86.7 46.7 53.3 73.3 33.3 60.0 46.7
Uncovered well 3.3 6.7 0.0 0.0 6.7 1.7 0.0 0.0 6.7 0.0
Rainwater 6.7 0.0 6.7 0.0 20.0 1.7 0.0 6.7 0.0 0.0
River or lake 8.3 6.7 6.7 13.3 6.7 6.7 0.0 6.7 0.0 20.0
a Values are %. b Sample size at baseline did not vary. c Sample size at follow-up ranged from N = 55 to 60 in the full sample; N = 14 to 15 in the T24 arm; N = 14 to 15 in the T18 arm; and N = 12 to 15 in the control arm. * There were no statistical differences among study arms, p < 0.05.

Strengthening and Evaluating the PM2A Approach – Burundi Follow-Up Report: Children 0–23 Months
26
At baseline, colline leaders reported that 61.6% of the collines were within 5 km of a regular (i.e., more than weekly) market, 67.3% of a weekly market, 94.9% of a church, 60.0% of a bus stop, and 48.0% of an administrative office (Table 8). Access was similar at follow-up, with 61.8% of the collines within 5 km of a regular market, 56.0% of a weekly market, 100.0% of a church, 59.0% of a bus stop, and 59.6% of an administrative office. The proximity of these services did not differ across the four study arms.
Table 8. Distance to servicesa
Baselineb Follow-upc
Full sample
Study arm Full sample
Study arm
N
T24 T18 TNFP Ctrl T24 T18 TNFP Ctrl
59 15 15 14 15 58 15 15 15 15
Distance to closest regular market
0 km (in colline) 13.5 21.4 9.1 14.3 7.7 18.2 15.4 20.0 21.4 15.4
1–5 km 48.1 42.9 45.5 42.9 61.5 43.6 53.8 26.7 57.1 38.5
6–10 km 13.5 21.4 9.1 14.3 7.7 20.0 7.7 26.7 14.3 30.8
> 10 km 25.0 14.3 36.4 28.6 23.1 18.2 23.1 26.7 7.1 15.4
Distance to closest weekly market
0 km (in colline) 34.5 20.0 42.9 14.3 60.0 22.0 36.4 14.3 15.4 25.0
1–5 km 32.8 33.3 28.6 50.0 20.0 34.0 45.5 42.9 38.5 8.3
6–10 km 8.6 13.3 0.0 14.3 6.7 36.0 9.1 35.7 30.8 66.7
> 10 km 24.1 33.3 28.6 21.4 13.3 8.0 9.1 7.1 15.4 0.0
Distance to closest church
0 km (in colline) 86.4 93.3 93.3 71.4 86.7 84.5 86.7 92.9 66.7 92.9
1–5 km 8.5 0.0 6.7 14.3 13.3 15.5 13.3 7.1 33.3 7.1
6–10 km 0.0 0.0 0.0 0.0 0.0 0.0 0.0 0.0 0.0 0.0
> 10 km 5.1 6.7 0.0 14.3 0.0 0.0 0.0 0.0 0.0 0.0
Distance to closest bus stop
0 km (in colline) 23.6 28.6 35.7 7.1 23.1 17.9 21.4 40.0 7.1 0.0
1–5 km 36.4 35.7 21.4 64.3 23.1 41.1 35.7 26.7 64.3 38.5
6–10 km 14.5 14.3 14.3 7.1 23.1 19.6 21.4 13.3 14.3 30.8
> 10 km 25.5 21.4 28.6 21.4 30.8 21.4 21.4 20.0 14.3 30.8
Distance to closest administrative center
0 km (in colline) 16.0 28.6 21.4 7.7 0.0 14.0 21.4 21.4 7.1 6.7
1–5 km 42.0 21.4 42.9 53.8 55.6 45.6 42.9 42.9 64.3 33.3
6–10 km 18.0 28.6 14.3 15.4 11.1 28.1 28.6 28.6 14.3 40.0
> 10 km 24.0 21.4 21.4 23.1 33.3 12.3 7.1 7.1 14.3 20.0
a Values are %. b Sample size at baseline ranged from N = 51 to 58 in the full sample; N = 12 to 14 in the T24 arm; N = 13 to 15 in the T18 arm; and N = 14 in the TNFP arm; and N = 12 to 15 in the control arm. c Sample size at follow-up ranged from N = 50–58 in the full sample; N = 11 to 15 in the T24 arm; N = 14 to 15 in the T18 arm; N = 13 to 15 in the TNFP arm; and N = 13 to 15 in the control arm. * There were no statistical differences among study arms, p < 0.05.
3.1.2 Transportation
The primary form of transportation within the collines and to neighboring collines was walking, at both baseline and follow-up (Table 9). To travel to other cities and provinces, walking and bicycling were still the most common means. At baseline and follow-up, approximately 70% of colline respondents could access a road within the colline, and respondents in all but one remaining colline could access a road within 5 km. The vast majority of the closest roads were dirt or laterite. At follow-up, these closest roads were, on average, usable only a little more than half the year, which is 1–2 months less than reported at baseline. For more than half of the collines, the reported distance to the closest asphalt road in both surveys was more than 10 km. None of these transportation characteristics differed significantly among the four study arms.

Strengthening and Evaluating the PM2A Approach – Burundi Follow-Up Report: Children 0–23 Months
27
Table 9. Local forms of transportationa
N
Baselineb Follow-upc
Full sample
Study arm
Full sample
Study arm
T24 T18 TNFP Control T24 T18 TNFP Control
60 15 15 15 15 60 15 15 15 15
Primary form of transportation within the colline
Bus or minibus 0.0 0.0 0.0 0.0 0.0 1.8 0.0 0.0 0.0 7.1
Motorcycle 0.0 0.0 0.0 0.0 0.0 1.8 0.0 6.7 0.0 0.0
Bicycle 3.3 13.3 0.0 0.0 0.0 5.3 6.7 13.3 0.0 0.0
Walk 96.7 86.7 100.0 100.0 100.0 91.2 93.3 80.0 100.0 92.9
Primary form of transportation to nearby collines
Bus or minibus 0.0 0.0 0.0 0.0 0.0 3.5 6.7 6.7 0.0 0.0
Private car 0.0 0.0 0.0 0.0 0.0 1.8 6.7 0.0 0.0 0.0
Motorcycle 0.0 0.0 0.0 0.0 0.0 1.8 0.0 6.7 0.0 0.0
Bicycle 3.3 6.7 0.0 6.7 0.0 15.8 6.7 13.3 28.6 15.4
Walk 96.7 93.3 100.0 93.3 100.0 77.2 80.0 73.3 71.4 84.6
Primary form of transportation to other cities and provinces
Bus or minibus 15.0 33.3 6.7 6.7 13.3 15.8 13.3 13.3 15.4 21.4
Taxi 1.7 0.0 0.0 0.0 6.7 1.8 0.0 6.7 0.0 0.0
Private car 10.0 0.0 13.3 6.7 20.0 22.8 26.7 33.3 23.1 7.1
Motorcycle 5.0 0.0 6.7 13.3 0.0 3.5 0.0 0.0 0.0 14.3
Bicycle 21.7 20.0 20.0 26.7 20.0 15.8 20.0 13.3 15.4 14.3
Walk 46.7 46.7 53.3 46.7 40.0 40.4 40.0 33.3 46.2 42.9
Distance to closest road
0 km (in colline) 70.0 73.3 73.3 60.0 73.3 69.5 60.0 66.7 60.0 92.9
1–5 km 28.3 26.7 26.7 33.3 26.7 27.1 33.3 26.7 40.0 7.1
6–10 km 0.0 0.0 0.0 0.0 0.0 1.7 6.7 0.0 0.0 0.0
> 10 km 1.7 0.0 0.0 6.7 0.0 1.7 0.0 6.7 0.0 0.0
Material of closest road
Asphalt 5.0 0.0 13.3 6.7 0.0 6.8 0.0 13.3 7.1 6.7
Soil 86.7 93.3 80.0 86.7 86.7 83.1 100.0 66.7 78.6 86.7
Laterite 8.3 6.7 6.7 6.7 13.3 10.2 0.0 20.0 14.3 6.7
Number of months vehicles could be used on closest road last year
Simple car 8.3 ± 4.7 9.7 ± 3.5 9.5 ± 4.3 7.0 ± 5.2 7.1 ± 5.2 6.6 ± 5.3 6.5 ± 5.0 8.7 ± 4.5 6.9 ± 5.6 4.4 ± 5.7
Four-wheel drive vehicle 9.9 ± 3.8 10.9 ± 2.3 10.7 ± 3.0 8.7 ± 5.0 9.2 ± 4.5 7.6 ± 4.8 5.5 ± 4.5 10.1 ± 4.0 7.8 ± 5.0 7.0 ± 5.0
Bus 6.8 ± 5.3 6.8 ± 5.2 8.5 ± 4.9 6.4 ± 5.7 5.5 ± 5.6 5.9 ± 5.6 4.2 ± 5.1 7.7 ± 5.4 6.1 ± 5.6 5.5 ± 6.3
Truck 8.0 ± 4.7 8.7 ± 4.8 8.5 ± 4.3 6.8 ± 5.1 8.1 ± 4.8 5.9 ± 5.3 4.2 ± 5.2 8.1 ± 5.1 5.9 ± 5.6 5.4 ± 5.3
Distance to closest asphalt road
0 km (in colline) 6.9 6.7 13.3 0.0 6.7 14.5 13.3 26.7 0.0 16.7
1–5 km 20.7 26.7 20.0 7.7 26.7 20.0 13.3 6.7 30.8 33.3
6–10 km 3.4 0.0 0.0 15.4 0.0 9.1 6.7 6.7 23.1 0.0
> 10 km 69.0 66.7 66.7 76.9 66.7 56.4 66.7 60.0 46.2 50.0
a Values are mean ± SD or %. b Sample size at baseline ranged from N = 58 to 60 in the full sample; and N = 13 to 15 in the TNFP arm. c Sample size at follow-up ranged from N = 54 to 60 in the full sample; N = 14 to 15 in the T24 arm; N = 14 to 15 in the T18 arm; N = 12 to 15 in the TNFP arm; and N = 11 to 15 in the control arm. * There were no statistical differences among study arms, p < 0.05

Strengthening and Evaluating the PM2A Approach – Burundi Follow-Up Report: Children 0–23 Months
28
3.1.3 Access to Schools and Health Services
At both baseline and follow-up, at least three-quarters of the collines had at least one primary school (Table 10). In contrast, secondary schools were available in only one-third of the collines. For collines without a secondary school, the closest one was approximately 5 km away. At follow-up, the average annual cost to attend primary school was 22,596 Burundian Francs (BIF) (US$14.9123), considerably lower than at baseline (35,577 BIF [US$23.48]). Similarly, the cost of attending secondary school dropped from an average of 132,780 BIF (US$87.61) to 84,600 BIF (US$55.84). Most primary and secondary schools had access to latrines (90.1% and 82.2% at baseline, and 95.3% and 93.7% at follow-up, respectively). Fewer schools had access to drinking water—25.3% of primary and 50.0% of secondary schools at baseline and 40.4% of primary and 57.5% of secondary schools at follow-up. School characteristics were similar across the four study arms, with the exception that at follow-up access to drinking water at secondary schools differed among the four study arms.
23 The exchange rate from www.oanda.com on November 1, 2012 was used (US$1 = 1,515 BIF) here and in the remainder of the document.

Strengthening and Evaluating the PM2A Approach – Burundi Follow-Up Report: Children 0–23 Months
29
Table 10. School characteristicsa
N
Baselineb Follow-upc
Full sample
Study arm
Full sample
Study arm
T24 T18 TNFP Control T24 T18 TNFP Control
60 15 15 15 15 60 15 15 15 15
% of collines with … primary schools
None 25.0 33.3 6.7 40.0 20.0 18.3 26.7 13.3 33.3 0.0
One 51.7 60.0 46.7 33.3 66.7 60.0 73.3 46.7 40.0 80.0
Two or more 23.3 6.7 46.7 26.7 13.3 21.7 0.0 40.0 26.7 20.0
Primary school characteristics
Cost (in 1,000 BIF) 35.6 ± 15.1 31.5 ± 12.7 37.8 ± 17.6 35.9 ± 16.1 37.2 ± 14.5 22.2 ± 18.2 26.4 ± 24.6 21.0 ± 15.0 23.4 ± 18.4 18.1 ± 13.1
Has a latrine 90.1 94.4 93.3 83.3 88.9 95.5 98.9 96.4 93.3 93.3
Has drinking water 25.3 36.0 17.9 22.0 25.0 40.8 58.3 23.3 50.0 31.3
% of collines with … secondary schools
None 65.0 53.3 60.0 66.7 80.0 66.7 66.7 60.0 66.7 73.3
One 28.3 40.0 26.7 26.7 20.0 33.3 33.3 40.0 33.3 26.7
Two or more 6.7 6.7 13.3 6.7 0.0 0.0 0.0 0.0 0.0 0.0
Distance to secondary school if none in the colline (km)
4.8 ± 2.3 3.9 ± 1.9 5.4 ± 2.5 5.4 ± 3.0 4.4 ± 1.7 4.6 ± 3.1 3.8 ± 1.5 4.0 ± 2.6 4.8 ± 3.7 5.5 ± 3.8
Secondary school characteristics
Cost (in 1,000 BIF) 132.8 ± 107.3 107.0 ± 59.8 141.6 ± 75.6 111.1 ± 56.6 168.9 ± 178.4 84.6 ± 69.8 84.5 ± 48.6 89.1 ± 60.8 85.2 ± 88.7 80.0 ± 80.3
Has a latrine 82.2 86.1 73.8 92.4 76.7 93.7 93.9 95.8 94.4 90.7
Has drinking water 50.0 66.7 50.9 49.1 34.4 57.5* 82.7 41.7 60.6 44.1
a Values are mean ± SD or %. b Sample size at baseline ranged from N = 37 to 60 in the full sample; N = 8 to 15 in the T24 arm; N = 8 to 15 in the T18 arm; N = 9 to 15 in the TNFP arm; and N = 12 to 15 in the control arm. c Sample size at follow-up ranged from N = 39 to 60 in the full sample; N = 10 to 15 in the T24 arm; N = 8 to 15 in the T18 arm; N = 10 to 15 in the TNFP arm; and N = 11 to 15 in the control arm. * Study arms differ, p < 0.05.

Strengthening and Evaluating the PM2A Approach – Burundi Follow-Up Report: Children 0–23 Months
30
At follow-up, only a quarter of the collines had any health center (public or private), which was only slightly higher than at baseline, when one-fifth of the collines had a health center. Only a few (two at baseline and one at follow-up) collines had a hospital within their borders (Table 11). At both baseline and follow-up, around three-quarters of the collines were located within 5 km of a health center. Access to a hospital was much more limited but improved over time: The percentage of collines located more than 10 km from a hospital dropped from 61.5% to 40.0%. Most health services were reached on foot at both baseline and follow-up.
Community members were also served by health services that were not specific to a health center or hospital (Table 12). At both surveys, most collines reported having at least one midwife and around half of the collines were served by three or more midwives. Community health workers served all but one colline at baseline and follow-up. Access to health services was similar across the four study arms with the exception of the types of transportation used to reach hospitals.
Table 11. Access to health services by colline residentsa
N
Baselineb Follow-upc
Full sample
Study arm Full sample
Study arm
T24 T18 TNFP Ctrl T24 T18 TNFP Ctrl
60 15 15 15 15 60 15 15 15 15
Facilities available in the colline Public health center 16.7 13.3 20.0 20.0 13.3 21.7 13.3 26.7 20.0 26.7 Any health center (public or private)
20.0 13.3 26.7 26.7 13.3 26.7 13.3 40.0 26.7 26.7
Hospital (all public) 3.3 0.0 0.0 6.7 6.7 1.7 0.0 0.0 6.7 0.0
Distance to closest health center 0 km (in colline) 20.7 14.3 26.7 28.6 13.3 26.7 13.3 40.0 26.7 26.7 1–5 km 48.3 64.3 40.0 35.7 53.3 50.0 66.7 40.0 53.3 40.0 6–10 km 20.7 14.3 20.0 28.6 20.0 16.7 6.7 13.3 13.3 33.3 > 10 km 10.3 7.1 13.3 7.1 13.3 6.7 13.3 6.7 6.7 0.0
Distance to closest hospital 0 km (in colline) 3.8 0.0 0.0 7.7 9.1 2.9 0.0 0.0 10.0 0.0 1–5 km 19.2 30.8 6.7 23.1 18.2 34.3 30.0 28.6 40.0 37.5 6–10 km 15.4 7.7 13.3 15.4 27.3 22.9 20.0 0.0 30.0 37.5 > 10 km 61.5 61.5 80.0 53.8 45.5 40.0 50.0 71.4 20.0 25.0
Transportation to health centers Walking 97.5 92.9 100.0 100.0 97.8 88.5 92.1 74.6 92.3 94.4 Bicycle 2.5 7.1 0.0 0.0 2.2 8.7 5.1 16.8 7.7 5.6
Transportation to hospitals Walking 69.3 67.9 64.4 61.1 86.4 73.0* 80.0 30.0 87.5 87.5 Bicycle 16.9 26.7 11.1 16.7 13.6 14.4* 15.0 46.4 0.0 0.0 Private car 12.8 1.5 24.4 22.2 0.0 7.3 5.0 17.9 0.0 8.3
% of collines with … midwives None 10.3 6.7 0.0 14.3 20.0 15.8 0.0 26.7 14.3 23.1 One 15.5 20.0 14.3 14.3 13.3 10.5 13.3 6.7 7.1 15.4 Two 24.1 13.3 28.6 28.6 26.7 21.1 26.7 26.7 14.3 15.4 Three or more 50.0 60.0 57.1 42.9 40.0 52.6 60.0 40.0 64.3 46.2
% of collines with … community health workers None 1.7 0.0 0.0 6.7 0.0 1.7 0.0 6.7 0.0 0.0 One 1.7 0.0 0.0 6.7 0.0 1.7 0.0 6.7 0.0 0.0 Two 70.0 60.0 60.0 73.3 86.7 70.7 78.6 53.3 80.0 71.4 Three or more 26.7 40.0 40.0 13.3 13.3 25.9 21.4 33.3 20.0 28.6
a Values are %. b Sample size at baseline ranged from N = 51 to 60 in the full sample; N = 13 to 15 in the T24 arm; N = 12 to 15 in the T18 arm; N = 12 to 15 in the TNFP arm; and N = 8 to 15 in the control arm. c Sample size at follow-up ranged from N = 33 to 60 in the full sample; N = 10 to 15 in the T24 arm; N = 7 to 15 in the T18 arm; N = 8 to 15 in the TNFP arm; and N = 8 to 15 in the control arm. * Study arms differ, p < 0.05.

Strengthening and Evaluating the PM2A Approach – Burundi Follow-Up Report: Children 0–23 Months
31
3.1.4 Agriculture
The types of crops, vegetables, and fruit trees grown in the study collines did not change fundamentally from baseline to follow-up. Among the 10 most common crops, manioc, maize, sweet potatoes, and beans were grown in nearly all collines (Table 12). Groundnuts and sorghum were grown in roughly 75% to 85% of the collines, and rice, pigeon peas, finger millet, and potatoes in fewer than 65% of the collines. Six key vegetables were also common. Amaranth and cabbage were grown in approximately half of the collines. Eggplant, peas, and tomatoes were grown in approximately a third of the collines, and around one-fifth of the collines grew squash. The types of crops were relatively similar across study arms, with the exception of bean production, which differed among the four study arms at follow-up.
Table 12. Most common crops and vegetablesa
Baselineb Follow-upc
Full sample
Study arm Full sample
Study arm
T24 T18 TNFP Control T24 T18 TNFP Control
N 60 15 15 15 15 60 15 15 15 15
Most common crops
Manioc 100.0 100.0 100.0 100.0 100.0 96.7 93.3 93.3 100.0 100.0
Maize 95.0 93.3 86.7 100.0 100.0 96.7 100.0 100.0 93.3 93.3
Sweet potato 91.7 93.3 86.7 93.3 93.3 95.0 100.0 93.3 93.3 93.3
Beans 90.0 86.7 93.3 86.7 93.3 95.0* 100.0 80.0 100.0 100.0
Peanuts 83.3 73.3 80.0 86.7 93.3 73.3 53.3 93.3 66.7 80.0
Sorghum 78.3 60.0 80.0 93.3 80.0 75.0 66.7 93.3 66.7 73.3
Rice 61.7 53.3 60.0 53.3 80.0 63.3 46.7 73.3 53.3 80.0
Pigeon peas 58.3 60.0 60.0 60.0 53.3 50.0 26.7 53.3 73.3 46.7
Eleusine 56.7 60.0 60.0 53.3 53.3 40.0 40.0 46.7 33.3 40.0
Potatoes 55.0 73.3 53.3 53.3 40.0 58.3 73.3 73.3 53.3 33.3
Most common vegetables
Amaranth (lengalenga)
53.3 60.0 33.3 60.0 60.0 53.3 66.7 53.3 53.3 40.0
Cabbage 45.0 66.7 33.3 53.3 26.7 51.7 73.3 53.3 53.3 26.7
Eggplant 38.3 46.7 33.3 40.0 33.3 43.3 53.3 46.7 40.0 33.3
Peas 38.3 60.0 33.3 26.7 33.3 26.7 33.3 33.3 40.0 0.0
Tomato 35.0 46.7 20.0 40.0 33.3 36.7 40.0 53.3 33.3 20.0
Squash 21.7 26.7 6.7 20.0 33.3 20.0 20.0 20.0 33.3 6.7
a Values are %. b Sample size at baseline did not vary. c Sample size at follow-up did not vary. * Study arms differ, p < 0.05.
Avocados, mangos, bananas, and pineapples were grown in over half of the collines (Table 13). Japanese plums, oranges, papayas, guavas, lemons, and coffee were also grown in a number of collines. The presence of fruit trees did not differ significantly among the four study arms.
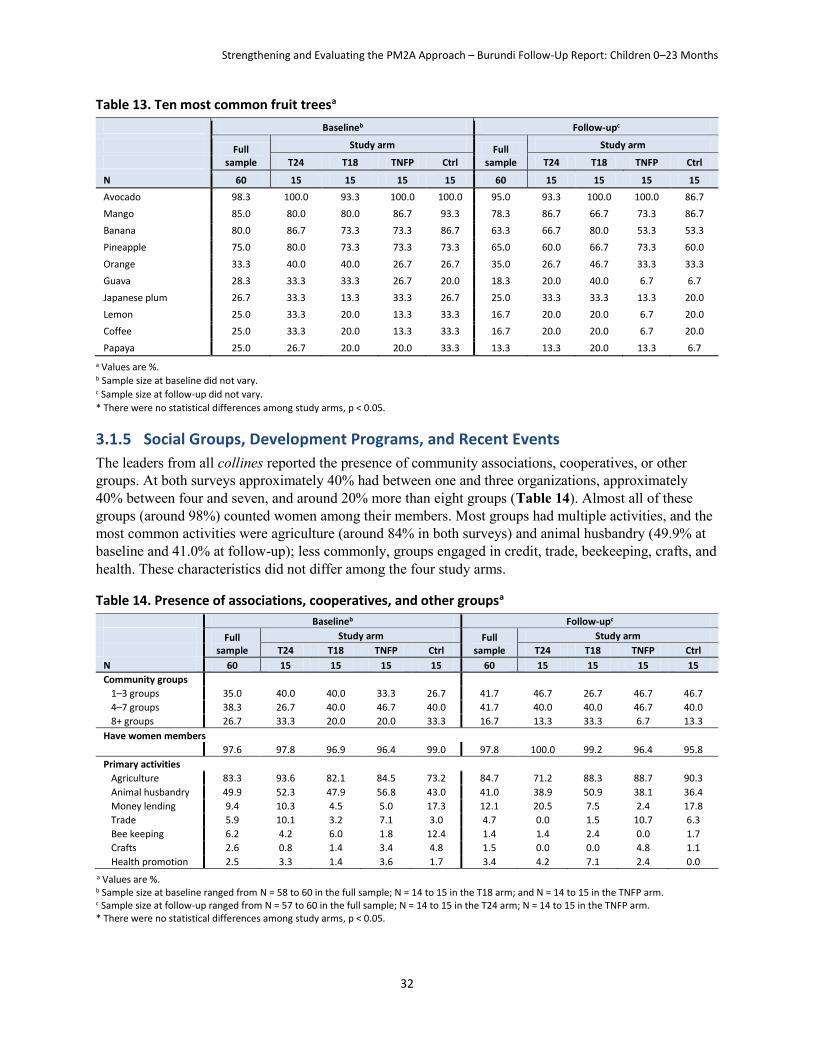
Strengthening and Evaluating the PM2A Approach – Burundi Follow-Up Report: Children 0–23 Months
32
Table 13. Ten most common fruit treesa
Baselineb Follow-upc
Full sample
Study arm Full sample
Study arm
T24 T18 TNFP Ctrl T24 T18 TNFP Ctrl
N 60 15 15 15 15 60 15 15 15 15
Avocado 98.3 100.0 93.3 100.0 100.0 95.0 93.3 100.0 100.0 86.7
Mango 85.0 80.0 80.0 86.7 93.3 78.3 86.7 66.7 73.3 86.7
Banana 80.0 86.7 73.3 73.3 86.7 63.3 66.7 80.0 53.3 53.3
Pineapple 75.0 80.0 73.3 73.3 73.3 65.0 60.0 66.7 73.3 60.0
Orange 33.3 40.0 40.0 26.7 26.7 35.0 26.7 46.7 33.3 33.3
Guava 28.3 33.3 33.3 26.7 20.0 18.3 20.0 40.0 6.7 6.7
Japanese plum 26.7 33.3 13.3 33.3 26.7 25.0 33.3 33.3 13.3 20.0
Lemon 25.0 33.3 20.0 13.3 33.3 16.7 20.0 20.0 6.7 20.0
Coffee 25.0 33.3 20.0 13.3 33.3 16.7 20.0 20.0 6.7 20.0
Papaya 25.0 26.7 20.0 20.0 33.3 13.3 13.3 20.0 13.3 6.7
a Values are %. b Sample size at baseline did not vary. c Sample size at follow-up did not vary.
* There were no statistical differences among study arms, p < 0.05.
3.1.5 Social Groups, Development Programs, and Recent Events
The leaders from all collines reported the presence of community associations, cooperatives, or other groups. At both surveys approximately 40% had between one and three organizations, approximately 40% between four and seven, and around 20% more than eight groups (Table 14). Almost all of these groups (around 98%) counted women among their members. Most groups had multiple activities, and the most common activities were agriculture (around 84% in both surveys) and animal husbandry (49.9% at baseline and 41.0% at follow-up); less commonly, groups engaged in credit, trade, beekeeping, crafts, and health. These characteristics did not differ among the four study arms.
Table 14. Presence of associations, cooperatives, and other groupsa
Baselineb Follow-upc
Full sample
Study arm Full sample
Study arm
T24 T18 TNFP Ctrl T24 T18 TNFP Ctrl
N 60 15 15 15 15 60 15 15 15 15
Community groups
1–3 groups 35.0 40.0 40.0 33.3 26.7 41.7 46.7 26.7 46.7 46.7
4–7 groups 38.3 26.7 40.0 46.7 40.0 41.7 40.0 40.0 46.7 40.0
8+ groups 26.7 33.3 20.0 20.0 33.3 16.7 13.3 33.3 6.7 13.3
Have women members
97.6 97.8 96.9 96.4 99.0 97.8 100.0 99.2 96.4 95.8
Primary activities
Agriculture 83.3 93.6 82.1 84.5 73.2 84.7 71.2 88.3 88.7 90.3
Animal husbandry 49.9 52.3 47.9 56.8 43.0 41.0 38.9 50.9 38.1 36.4
Money lending 9.4 10.3 4.5 5.0 17.3 12.1 20.5 7.5 2.4 17.8
Trade 5.9 10.1 3.2 7.1 3.0 4.7 0.0 1.5 10.7 6.3
Bee keeping 6.2 4.2 6.0 1.8 12.4 1.4 1.4 2.4 0.0 1.7
Crafts 2.6 0.8 1.4 3.4 4.8 1.5 0.0 0.0 4.8 1.1
Health promotion 2.5 3.3 1.4 3.6 1.7 3.4 4.2 7.1 2.4 0.0
a Values are %. b Sample size at baseline ranged from N = 58 to 60 in the full sample; N = 14 to 15 in the T18 arm; and N = 14 to 15 in the TNFP arm. c Sample size at follow-up ranged from N = 57 to 60 in the full sample; N = 14 to 15 in the T24 arm; N = 14 to 15 in the TNFP arm. * There were no statistical differences among study arms, p < 0.05.

Strengthening and Evaluating the PM2A Approach – Burundi Follow-Up Report: Children 0–23 Months
33
At follow-up, the majority of respondents in the collines (61.7%) reported that more new residents had arrived than residents had left over the past 5 years; this is somewhat less than the 76.7% who reported that there were more arrivals at baseline (Table 15). This may reflect the gradual decline of returning refugees. Regarding climate conditions during the past 12 months, respondents from more than half the collines (51.6% at baseline and 71.7% at follow-up) reported more rainfall than usual, and around half (both surveys) reported that it was hotter during the previous 12 months. At follow-up, notably fewer respondents from the collines reported that there was less rain or that is was cooler compared to baseline. The percentage reporting that living conditions had become worse during the past 3 years dropped from 83.3% to 71.2%.
Table 15. Recent historical events experienced by the collinesa
Baselineb Follow-upc
Full sample
Study arm Full sample
Study arm
T24 T18 TNFP Ctrl T24 T18 TNFP Ctrl
N 60 15 15 15 15 60 15 15 15 15
Migration during past 5 years
More arrivals 76.7 73.3 73.3 80.0 80.0 61.7 60.0 66.7 53.3 66.7
More departures 11.7 13.3 13.3 6.7 13.3 15.0 13.3 13.3 20.0 13.3
Similar arrivals and departures
3.3 6.7 6.7 0.0 0.0 8.3 0.0 13.3 6.7 13.3
Neither arrivals nor departures
8.3 6.7 6.7 13.3 6.7 15.0 26.7 6.7 20.0 6.7
Rainfall during last 12 months
A lot more than usual 48.3 73.3 46.7 46.7 26.7 46.7 40.0 46.7 66.7 33.3
A little more than usual 3.3 0.0 6.7 0.0 6.7 25.0 46.7 13.3 13.3 26.7
Same as usual 5.0 0.0 6.7 13.3 0.0 10.0 6.7 13.3 6.7 13.3
A little less than usual 15.0 13.3 0.0 13.3 33.3 13.3 6.7 20.0 13.3 13.3
A lot less than usual 28.3 13.3 40.0 26.7 33.3 5.0 0.0 6.7 0.0 13.3
Temperature during last 12 months
A lot hotter than usual 48.3 73.3 46.7 46.7 26.7 30.0 20.0 40.0 26.7 33.3
A little hotter than usual
3.3 0.0 6.7 0.0 6.7 23.3 20.0 20.0 20.0 33.3
Same as usual 5.0 0.0 6.7 13.3 0.0 31.7 26.7 33.3 46.7 20.0
A little cooler than usual
15.0 13.3 0.0 13.3 33.3 10.0 20.0 0.0 6.7 13.3
A lot cooler than usual 28.3 13.3 40.0 26.7 33.3 5.0 13.3 6.7 0.0 0.0
Living conditions during last 5 years
Improved 13.3 13.3 13.3 26.7 0.0 20.3 26.7 7.1 13.3 33.3
Worse 83.3 80.0 86.7 73.3 93.3 71.2 66.7 78.6 73.3 66.7
Similar 3.3 6.7 0.0 0.0 6.7 8.5 6.7 14.3 13.3 0.0
a Values are %. b Sample size at baseline did not vary. c Sample size at follow-up ranged from N = 59 to 60 in the full sample; and N = 14 to 15 in the T18 arm. * There were no statistical differences among study arms, p < 0.05.
The five most common negative events experienced by collines in the 2 years preceding each survey were drought, flood, hail, fire, and famine (Table 16). There was a slight increase in the occurrence of droughts, floods, and hail storms between the baseline and follow-up surveys, and the experience of negative events did not differ significantly among the four study arms.

Strengthening and Evaluating the PM2A Approach – Burundi Follow-Up Report: Children 0–23 Months
34
Table 16. Most common negative events experienced by collines during preceding 2 yearsa
Baselineb Follow-upc
Full sample
Study arm Full sample
Study arm
T24 T18 TNFP Ctrl T24 T18 TNFP Ctrl
N 60 15 15 15 15 60 15 15 15 15
Drought 33.3 46.7 26.7 40.0 20.0 43.3 33.3 46.7 46.7 46.7
Flood 30.0 26.7 33.3 46.7 13.3 43.3 40.0 53.3 53.3 26.7
Hail 21.7 40.0 26.7 13.3 6.7 36.7 20.0 26.7 60.0 40.0
Fire 21.7 33.3 20.0 6.7 26.7 6.7 13.3 0.0 13.3 0.0
Famine 15.0 20.0 13.3 6.7 20.0 15.0 20.0 0.0 20.0 20.0
a Values are %. b Sample size at baseline did not vary. c Sample size at follow-up did not vary. * There were no statistical differences among study arms, p < 0.05
3.2 Health Center Characteristics
3.2.1 Infrastructure, Personnel, and Services
Changes from baseline to follow-up in the basic infrastructure of the 11 health centers—which provide services related to health promotion, preventative services, and lower-level curative care—were mostly small. Ten centers had a covered waiting area at baseline. By follow-up, covered waiting areas were available at all centers (Table 17). The number of health centers able to keep patients overnight for observation declined from eight to seven between baseline and follow-up, and the number with consultation rooms specifically for children under 5 years increased from one to six. At follow-up, only two health centers had no electricity; the nine with electricity relied on solar panels alone (five), an electric grid (one), or both (three).
The availability of trained staff improved from baseline to follow-up. At baseline, only five health centers staffed an A2-level nurse (4 years of nurse training after 10th grade), but nine had reached this standard at follow-up. All health centers staffed an A3-level nurse (2 years of nurse training after 10th grade) at both surveys; however, none of these A3-level nurses were specifically trained in nutrition. Along with the increased number of health centers with an A2-level nurse, there were fewer health centers with nurse’s aides (nine at baseline, six at follow-up). At baseline, no A2-level laboratory technicians (4 years of training after 10th grade) were available, but seven centers employed assistant laboratory technicians. A2 laboratory technicians were available at two health centers at follow-up, and five employed assistant lab technicians. The availability of health promoters and community health workers was similar at both baseline and follow-up. There were eight health centers with health promoters. Moreover, eight centers worked with at least one community health worker, and the majority (six at baseline and seven at follow-up) had at least six community health workers.

Strengthening and Evaluating the PM2A Approach – Burundi Follow-Up Report: Children 0–23 Months
35
Table 17. Health center infrastructure and personnela
Baselineb Follow-upc
N 11 11
Infrastructure
Covered waiting area 10 11
Will keep patients overnight for observations 8 7
Consultation room for children under 5 years 1 6
Electricityd
Only solar panels 5
Only electricity from a grid 1
Both solar panels and grid 3
No source of power 2
Health care personnel (≥ 1)
A2-level nurse (4 years of nurse training) 5 9
A3-level nurse (2 years of nurse training) 11 11
Nutritionist (specialized A3 nurse) 0 0
Nurse’s aide 9 6
A2 laboratory technician (4 years of training) 0 2
Assistant laboratory technician 7 5
Health promoter 8 8
Number of community health workers
0 3 3
1–5 2 1
6 or more 6 7 a Values are counts (i.e., number of health centers). No statistical tests were conducted. b Sample size at baseline did not vary. c Sample size at follow-up did not vary. d Information not collected at baseline.
All 11 health centers offered growth monitoring, immunizations, and vitamin A supplementation at both baseline and follow-up (Table 18). These three services were all offered on average 2 days a week. Routine deworming24 was available at 10 health centers at baseline and 8 at follow-up, on average about twice a week. All 11 health centers offered curative services to sick children 7 days a week at both surveys.
Pregnant women could access prenatal services at all 11 health centers approximately 3 days a week. At both baseline and follow-up, nine health centers provided delivery assistance in the health center around 7 days a week. The number of health centers offering postpartum care increased from 10 to 11, but there was a decline in the average frequency of these services (from 5.4 to 3.6 days a week).
24 Deworming is recommended starting at 1 year of age.

Strengthening and Evaluating the PM2A Approach – Burundi Follow-Up Report: Children 0–23 Months
36
Table 18. Availability and frequency of servicesa
Baselineb Follow-upc
N 11 11
Preventative services for children under 5 years
Growth monitoring available 11 11
Growth monitoring (days per week) 2.4 ± 2.4 1.9 ± 2.2
Immunizations available 11 11
Immunizations (days per week) 2.3 ± 0.8 2.2 ± 0.6
Vitamin A supplementation available 11 11
Vitamin A supplementation (days per week) 2.2 ± 0.8 2.0 ± 0.7
Routine deworming available 10 8
Routine deworming (days per week) 1.5 ± 1.1 1.8 ± 2.3
Curative services for children under 5 years
Treatment of sick children 11 11
Treatment of sick children (days per week) 6.5 ± 1.8 7.0 ± 0.0
Maternal health services
Prenatal care available 11 11
Prenatal care (days per week) 3.1 ± 1.3 3.0 ± 1.7
Delivery assistance available 9 9
Delivery assistance (days per week) 6.3 ± 2.0 7.0 ± 0.0
Postpartum care available 10 11
Postpartum care (days per week) 5.4 ± 2.3 3.6 ± 2.8 a Values are counts (i.e. number of health centers) or mean ± SD. No statistical tests were conducted. b Sample size at baseline ranged from N = 9 to 11; mean days per week is calculated only for health centers providing that service. c Sample size at follow-up ranged from N = 8 to 11; mean days per week is calculated only for health centers providing that service.
3.2.2 Components of Services
For sick children who visit a health center (Table 19), the number of centers offering each specific service improved considerably between baseline and follow-up for all of the services that were not already universally available at baseline. The mean number of services offered improved from 4.7 at baseline to 7.4 at follow-up. The availability of four specific services for children with diarrhea also improved, but the availability of zinc supplementation remained low. The mean number of services for children with diarrhea increased from 1.1 at baseline to 2.8 at follow-up.

Strengthening and Evaluating the PM2A Approach – Burundi Follow-Up Report: Children 0–23 Months
37
Table 19. Components of services for sick childrena
Baselineb Follow-upc
N 11 11
Services available to sick children
Measure body temperature 11 11
Measure weight 10 11
Offer antibiotics 9 11
Offer acetaminophen or wet sponge for fever 6 11
Chart weight 5 8
Provide health education 4 11
Evaluate immunization status 4 10
Evaluate vitamin A status 3 8
Total number of services for sick children (range 0 to 8) 4.7 7.4
Services available to children with diarrhea
ORS 8 10
Oral serum 2 10
Onsite intravenous solution if severe 1 8
Zinc supplementation 1 3
Total number of services for diarrhea (range 0 to 4) 1.1 2.8 a Values are counts (i.e., number of health centers) or mean. No statistical tests were conducted. b Sample size at baseline did not vary. c Sample size at follow-up did not vary.
For women seeking prenatal care there were small improvements in the availability of services (Table 20). The mean number of the eight services offered improved from 5.9 at baseline to 6.7 at follow-up. This improvement is primarily attributable to the delivery of health education sessions and the administration of deworming treatment.
Table 20. Components of services for pregnant and lactating womena
Baselineb Follow-upc
N 11 11
Prenatal care components
Measure weight 11 11
Measure abdomen 10 11
Measure blood pressure 10 10
Offer tetanus vaccine 10 11
Distribute iron folate or iron and folate 10 9
Offer education sessions 8 11
Administer albendazole or mebendazole for deworming 6 11
Administer niclosamide for taenia deworming 0 0
Total number of prenatal care components (range 0 to 8) 5.9 6.7 a Values are counts (i.e. number of health centers) or mean. No statistical tests were conducted. b Sample size at baseline was N = 11 for prenatal care components. c Sample size at follow-up was N = 11 for prenatal care components.

Strengthening and Evaluating the PM2A Approach – Burundi Follow-Up Report: Children 0–23 Months
38
With regard to laboratory services (Table 21), the number of health centers offering HIV tests to pregnant mothers increased from 5 to 11 between baseline and follow-up. However, fewer offered urine and anemia tests, such that at follow-up these tests were each offered at only one clinic. The number of health centers offering blood tests and stool tests to children under 5 increased between baseline and follow-up—from 8 to 10 for blood tests and 4 to 9 for stool tests. Only one health center offered urine tests at each survey wave.
Table 21. Laboratory servicesa
Baselineb Follow-upc
N 11 11
Prenatal laboratory services
HIV test 5 11
Urine test 4 1
Anemia test 2 1
Laboratory services for children under 5 years
Blood test 8 10
Stool test 4 9
Urine test 1 1 a Values are counts (i.e., number of health centers). No statistical tests were conducted. b Sample size at baseline did not vary. c Sample size at follow-up did not vary.
The number of health centers offering blood tests to confirm malaria increased from 7 to 11 between baseline and follow-up (Table 22). Bednets were distributed to children under 9 months at all health centers at both survey waves. Bednets were also provided to women at prenatal visits at 10 health centers at baseline and all 11 at follow-up. Bednets were not distributed to children 9 months and older at either baseline or follow-up.
Table 22. Malaria-related servicesa
Baselineb Follow-upc
N 11 11
Blood test for malaria 7 11
Bednet distribution
Infants (under 9 months) 11 11
Pregnant women at prenatal visits 10 11
Children 9 months and older 0 0 a Values are counts (i.e. number of health centers). No statistical tests were conducted. b Sample size at baseline did not vary. c Sample size at follow-up did not vary.
3.2.3 Availability of Equipment, Medication, and Supplies
At baseline, all 11 health centers reported maintaining registries and having immunization cards available (Table 23). When further specified at follow-up, all 11 health centers maintained registries of curative consultations, growth monitoring, vaccinations, and prenatal care. All 11 had blank maternal health cards available, and 10 had child health cards and child health passports available.
A salter scale and measuring board were available at all health centers at both surveys. Infant scales and mid-upper arm circumference (MUAC) tapes were available at 9 centers at baseline and all 11 at follow-

Strengthening and Evaluating the PM2A Approach – Burundi Follow-Up Report: Children 0–23 Months
39
up. A weight-for-height growth chart was present at only one health center at baseline and four at follow-up.
To maintain vaccinations at safe temperatures, at baseline, all health centers had icepacks, thermos carriers, and temperature charts for the refrigerator, but two lacked a working refrigerator. At follow-up, all had working refrigerators, and only one health center lacked a thermos carrier.
For maternal health care a Pinard obstetric stethoscope, adult blood pressure cuff, and measuring tape were universally available. At baseline, an adult scale was present at 10 health centers; by follow-up, all centers had an adult scale. At both waves, vaginal speculums were available in 10 of the 11 centers. The number of health centers with a delivery table decreased from nine to eight between the two survey waves, but the number with a gynecological table increased from 7 to 10. The number of health centers with pelvimeters and gynecological lamps (seven and two, respectively) did not change between the two waves. A hemoglobin tester, which was previously not available at any clinic, was present in three clinics at follow-up. Also at follow-up, three health centers had wheelchairs.
The health centers were well equipped with sterile equipment and materials. Gloves, disinfectant, sutures, disposable needles and syringes, and containers for disposing of medical waste were universally available at both survey waves. Trash cans, sterile dressings, a sink, and soap (assessed only at follow-up) were available in all health centers. The availability of wash drums and wash bottles improved between the surveys waves (from 10 to 11 and from 7 to 8 health centers, respectively). Cold decontamination containers were available at five health centers at baseline and four at follow-up. At follow-up, only five health centers had sterile towels/napkins available.
For the diagnostic and curative care of children, stethoscopes and thermometers were universally available at both survey waves. Also at both waves, an otoscope was available at 10 health centers. The number with an examination table increased from 10 to 11. A child blood pressure cuff was available at only three health centers at baseline and two at follow-up, and though a laryngeal mirror was available at one health center at baseline, it was no longer present at follow-up. At follow-up, eight health centers had a metal tongue depressor, eight had a flashlight, and six had a suction bulb or electric suction device.
Table 23. Availability of equipmenta
Baselineb Follow-upc
N 11 11
Waiting room and office furniture
Bench 11 11
Stool 3 10
Chairs 11
Office table 10
Record keeping
Registriesd 11
Registry of curative consultatione 11
Registry of growth monitoringe 11
Registry of vaccinationse 11
Registry of prenatal caree 11
Immunization cardd 11
Maternal health carde 11
Child health carde 10
Child health passporte 10

Strengthening and Evaluating the PM2A Approach – Burundi Follow-Up Report: Children 0–23 Months
40
N
bBaseline Follow-upc
11 11
Growth monitoring equipment
Salter scale 11 11
Measuring board
Infant scale
11
9
11
11
MUAC tape
Weight-for-height growth chart
9
1
11
4
Immunization equipment
Ice pack
Thermos carrier
11
11
11
10
Temperature chart for refrigerator
Refrigerator
11
9
11
11
Maternal health equipment
Pinard obstetric stethoscope
Adult blood pressure cuff
Measuring tape
Adult scale
11
11
11
10
11
11
11
11
Vaginal speculum
Delivery table
Gynecological table
Pelvimeter
10
9
7
7
10
8
10
7
Gynecological lamp
Hemoglobin tester
Wheelchaire
2
0
2
3
3
Sterile equipment and materials
Sterile gloves
Disinfectant
11
11
11
11
Suture 11 11 dDisposable needles and syringes
eDisposable needles
Disposable syringese
Container for needles and medical waste
11
11
11
11
11
Wash drums 10 11
Wash bottles 7 8
Cold decontamination container 5 4
Trash cane 11
Sterile dressingse
Sinke
11
11
Soape
Sterile towels/napkinse
11
5
Diagnostic and curative care equipment for children
Stethoscope
Thermometer
11
11
11
11
Otoscope
Examination table
10
10
10
11
Child blood pressure cuff
Laryngeal mirror
Metal tongue depressore
Flashlighte
Suction bulb or electric suction devicee
3
1
2
0
8
8
6
a Values are counts (i.e., number of health centers). No statistical tests were conducted. b Sample size at baseline did not vary. c Sample size at follow-up did not vary. d Information not collected at follow-up. e Information not collected at baseline.

Strengthening and Evaluating the PM2A Approach – Burundi Follow-Up Report: Children 0–23 Months
41
All health centers generally stocked key vaccines at both baseline and follow-up, but, at follow-up, more health centers had experienced stock ruptures25,26 (Table 24). At baseline, there had only been a rupture in the polio supply chain (to two health centers), but, at follow-up, at least one health center reported ruptures in the supply chain of every key vaccine except tetanus.
Between baseline and follow-up, the number of health centers that stocked both 100,000 IU and 200,000 IU doses of vitamin A declined from 11 to 9. Moreover, there were more stock ruptures in both the 100,000 IU and 200,000 IU supplies. Between the two surveys, there was a decline (from 10 to 7) in the number of clinics that stocked folic acid. The number that stocked iron folate (10 health centers) remained the same; the number stocking iron sulfate pills slightly increased (from eight to nine), and fewer (from eight to five) stocked iron syrup. Generally, one or two health centers had experienced supply ruptures in their iron and folic acid supply (defined as the availability of iron folate pills or the availability of both an iron supplement and folic acid), with the exceptions of iron sulfate pills, which had not suffered a rupture at follow-up, and iron syrup, which experienced shortages in all health centers that stocked it during the 6 months preceding both surveys. ORS were stocked in all 11 health centers; one center had experienced a supply rupture at baseline and two had experienced one at follow-up. Plumpy’Nut was stocked by 10 health centers at baseline, but only 8 at follow-up, and supply ruptures were common (at six and five health centers, respectively). Only half of health centers stocked zinc at each survey.
For the treatment of infections, amoxicillin was stocked at all health centers, but, at follow-up, two had experienced recent supply ruptures. Chloramphenicol was stocked in 11 and 10 health centers at baseline and follow-up, respectively, with three and two supply ruptures, respectively. At baseline, all health centers stocked co-trimoxazole or erythromycin (often substitutable for one another) without a recent rupture. At follow-up, co-trimoxazole was stocked universally, but one health center lacked erythromycin, and four had experienced ruptures. At baseline, benzylpenicillin and gentamycin (often used in combination) were available at nine health centers (three supply ruptures). At follow-up, nine health centers stocked benzylpenicillin (two ruptures) and seven health centers stocked gentamycin (three ruptures). Moreover, at follow-up, all health centers generally stocked tetracycline ophthalmic ointment (for measles treatment) and nystatin for fungal infections, though four centers experienced tetracycline ruptures.
For the treatment of malaria, amodiaquine and artesunate were stocked in all health centers, but at both surveys three health centers had experienced recent supply ruptures. Quinine was universally available at all centers at both time points. For deworming, either albendazole or mebendazole was available at all health centers, and one had experienced a shortage proceeding each survey. For the treatment of schistosoma and taenia, only two health centers stocked praziquantel at follow-up, and one of them had experienced a shortage.
With regard to analgesics, acetaminophen was available at all health centers, with only one experiencing a recent shortage at baseline. Diazepam was stocked at 10 health centers at both surveys, and two health centers had experienced recent shortages at follow-up. Also at follow-up, diclofenac sodium was available at only seven health centers (four experiencing shortages), and aspirin was stocked at six health centers (two shortages). Oral contraceptives were stocked by 10 of the 11 health centers at follow-up, and none had experienced stock ruptures.
25 A stock rupture is defined as not having the product available sometime during the preceding 6 months. 26 Note that Tubaramure, under FFP guidelines, was not able to purchase immunizations or medications.

Strengthening and Evaluating the PM2A Approach – Burundi Follow-Up Report: Children 0–23 Months
42
Table 24. Availability of medications and suppliesa
Baselineb Follow-upc
N 11 11
Immunizations and distilled water Polio generally stocked 11 11 Polio stock rupture 2 3 DPT-HiB-HepB generally stocked 11 11 DPT-HiB-HepB stock rupture 0 2 BCG generally stocked 11 11 BCG stock rupture 0 1 Measles generally stocked 11 11 Measles stock rupture 0 1 Tetanus generally stocked 11 11 Tetanus stock rupture 0 0 PCV 13 generally stockedd 11 PCV 13 stock ruptured 2 Distilled water generally stocked 11 11 Distilled water stock rupture 0 1
Micronutrients and supplements 100,000 IU vitamin A generally stocked 11 9 100,000 IU vitamin A stock rupture 4 6 200,000 IU vitamin A generally stocked 11 9 200,000 IU vitamin A stock rupture 2 5 Folic acid pills generally stocked 10 7 Folic acid pills stock rupture 2 2 Iron folate pills generally stocked 10 10 Iron folate pills stock rupture 1 1 Iron sulfate pills generally stocked 8 9 Iron sulfate pills stock rupture 2 0 Iron syrup generally stocked 8 5 Iron syrup stock rupture 8 5 ORS generally stocked 11 11 ORS stock rupture 1 2 Plumpy‘Nut generally stocked 10 8 Plumpy’Nut stock rupture 6 5 Zinc generally stocked 6 5 Zinc stock rupture 4 2
Antibiotics Amoxicillin generally stocked 11 11 Amoxicillin stock rupture 0 2 Chloramphenicol generally stocked 11 10 Chloramphenicol stock rupture 3 2 Co-trimoxazole or erythromycin generally stockede 11 Co-trimoxazole or erythromycin stock rupturee 0 Co-trimoxazole generally stockedd 11 Co-trimoxazole stock ruptured 0 Erythromycin generally stockedd 10 Erythromycin stock ruptured 4 Benzylpenicillin and gentamycin generally stockede 9 Benzylpenicillin and gentamycin stock rupturee 3 Benzylpenicillin generally stockedd 9 Benzylpenicillin stock ruptured 2 Gentamycin generally stockedd 7 Gentamycin stock ruptured 3 Tetracycline ointment generally stockedd 11 Tetracycline ointment stock ruptured 4
Antifungal Nystatin generally stockedd 11 Nystatin stock ruptured 0
Antimalarial Amodiaquine and artesunate generally stocked 11 11 Amodiaquine and artesunate stock rupture 3 3 Quinine generally stocked 11 11 Quinine stock rupture 0 0

Strengthening and Evaluating the PM2A Approach – Burundi Follow-Up Report: Children 0–23 Months
43
b Baseline Follow-upc
N 11 11
Anthelminthic Albendazole or mebendazole generally stocked 11 11 Albendazole or mebendazole stock rupture 1 1 Praziquantel generally stockedd 2
dPraziquantel stock rupture 1
Analgesic Acetaminophen generally stocked 11 11 Acetaminophen stock rupture 1 0 Diazepam generally stocked 10 10 Diazepam stock rupture 0 2 Diclofenac sodium generally stockedd 7
dDiclofenac sodium stock rupture 4 Aspirin generally stocked 6 Aspirin stock rupture 2
Oral contraceptives Oral contraceptives generally stockedd 10
dOral contraceptives stock rupture 0
a Values are counts (i.e., number of health centers). No statistical tests were conducted. b Sample size at baseline did not vary for “generally stocked.” Sample size for “stock rupture” is the number of health centers that generally stocked the particular item. c Sample size at follow-up did not vary for “generally stocked.” Sample size for “stock rupture” is the number of health centers that generally stocked the particular item. d Information not collected at baseline. e Information not collected at follow-up.

Strengthening and Evaluating the PM2A Approach – Burundi Follow-Up Report: Children 0–23 Months
44
4. Results: Household Characteristics
4.1 Household Demography and Housing Mean household size was 5.8 members at follow-up and 5.6 at baseline, with an average of 2.1 adults and 3.5 children under 18 years of age per household (Table 25). The characteristics of the head of household did not fundamentally change between baseline and follow-up. They were on average 35 years old, and more than 90% were male. The vast majority of these household heads had very low levels of education: approximately two-fifths had no schooling, and only a fraction completed primary school. Farming was the primary occupation of the household heads; more than 75% of them farmed their own land or land owned by their family.
Housing conditions were very similar at baseline and follow-up. Nearly all households owned the house they lived in. The average household had three rooms (Table 26). Fewer than 1% of households shared the dwelling with another household. Housing conditions were poor: Almost all dwellings had dirt floors, and around half of the households lived under a roof made out of thatch/straw. Most of the households had walls made of adobe bricks (73.1% at baseline and 70.4% at follow-up) or rammed earth27 (21.0% at baseline and 18.3% at follow-up).
Almost 80% of households had access to clean water (tap) at follow-up, which is higher than at baseline (72%). The time to reach the water source (36–37 minutes) remained the same (Table 27). The time to reach water was shorter for households in the T24 group. Only a very small percentage (0.5% at baseline and 0.7% at follow-up) of households had electricity. Almost all households (98.2% at baseline and 96.6% at follow-up) used firewood or straw for cooking. Household light sources changed between baseline and follow-up. Battery-operated equipment increased from 47.6% at baseline to 71.5% at follow-up, whereas households reporting natural combustible material or oil products dropped by half (from 30.2% to 15.4% and from 18.7% to 9.6%, respectively).
4.2 Household Assets Nearly all households owned a house and land at both baseline and follow-up (Table 28). At follow-up, households owned an average of 29 household goods (around four more than at baseline) and 5 pieces of agricultural equipment (a 0.5 unit increase), two small animals (remained constant), and two medium-sized animals (a 0.3 unit increase). At both baseline and follow-up, the number of household goods and pieces of equipment was different among study groups. Very few households owned large animals, a motorbike, or a bicycle at either baseline or follow-up.
27 Rammed earth (pisé in French) is a technique for building walls using raw materials, such as earth, chalk, lime, and gravel. The damp material is poured and then compacted to construct the wall.

Strengthening and Evaluating the PM2A Approach – Burundi Follow-Up Report: Children 0–23 Months
45
Table 25. Characteristics of householdsa
Baselineb Follow-upc
Full sample
Study arm
Full sample
Study arm
T24 T18 TNFP Control T24 T18 TNFP Control
N 2623 432 870 433 888 2614 432 880 431 871
Household
Size 5.6 ± 2.0 5.5 ± 2.0 5.7 ± 2.0 5.6 ± 2.1 5.5 ± 2.0 5.8 ± 2.0 5.8 ± 1.9 5.7 ± 2.0 5.8 ± 2.1 5.8 ± 2.0
Members under 18 years 3.4 ± 1.9 3.3 ± 1.8 3.5 ± 1.8 3.5 ± 1.9 3.4 ± 1.9 3.6 ± 1.8 3.6 ± 1.8 3.6 ± 1.8 3.6 ± 1.9 3.7 ± 1.9
Members 18 years and older 2.1 ± 0.6* 2.2 ± 0.6 2.2 ± 0.6 2.2 ± 0.6 2.1 ± 0.5 2.1 ± 0.6 2.2 ± 0.6 2.1 ± 0.5 2.2 ± 0.6 2.1 ± 0.5
Members under 60 months 1.7 ± 0.6 1.7 ± 0.6 1.7 ± 0.6 1.7 ± 0.6 1.7 ± 0.6 1.8 ± 0.6 1.8 ± 0.6 1.8 ± 0.6 1.8 ± 0.6 1.8 ± 0.6
Adults (%) 42.6 43.6 42.1 42.8 42.4 40.6 41.2 40.7 41.0 40.1
Dependency ratio 1.5 ± 0.9 1.4 ± 0.9 1.5 ± 0.9 1.5 ± 0.8 1.5 ± 0.9 1.6 ± 0.8 1.5 ± 0.8 1.6 ± 0.8 1.5 ± 0.8 1.6 ± 0.9
Household head
Age 34.7 ± 10.6 35.4 ± 11.1 35.3 ± 10.9 34.3 ± 10.2 34.1 ± 10.3 34.6 ± 10.2 34.9 ± 9.9 34.7 ± 10.3 35.2 ± 10.6 34.0 ± 10.1
Male (%) 92.2 93.0 93.4 93.5 90.0 93.4 94.9 93.5 92.8 92.8
Household head education
None/preschool 40.2 38.3 40.5 38.1 42.0 37.9 35.0 34.8 38.5 42.2
Primary incomplete 53.8 55.9 52.9 54.3 53.5 55.9 58.8 58.0 53.8 53.5
Primary complete 1.9 2.3 2.3 1.2 1.8 1.5 2.3 1.3 1.4 1.5
Secondary incomplete 3.6 3.2 3.6 5.8 2.6 4.4 3.9 5.5 6.1 2.6
Higher education 0.2 0.0 0.5 0.5 0.0 0.3 0.0 0.6 0.2 0.1
Household head occupation
Unemployed 1.0 1.4 0.8 1.4 0.9 1.1 1.4 0.9 1.9 0.7
Farms own or family land 76.2 77.3 75.3 73.4 78.0 76.0 75.1 74.5 74.2 78.9
Farms someone else’s land 3.0 1.6 2.9 1.8 4.4 5.2 3.3 6.0 2.3 6.8
Agricultural laborer 6.3 4.6 6.0 6.2 7.3 2.8 2.8 1.8 2.3 4.1
Retailer (e.g., has a store)d 0.5 0.0 0.1 1.4 0.8 0.5 1.2 0.3 1.2 0.0
Market/trade 2.2 1.6 2.5 1.8 2.4 3.0 1.9 3.6 3.9 2.3
Office/institution 3.7 4.6 4.2 5.1 2.3 3.9 3.7 4.7 5.8 2.4
Manual labor 5.5 6.7 7.4 6.2 2.8 6.0 7.9 6.8 6.0 4.1
Other 1.4 2.1 0.8 2.5 1.1 1.5* 2.8 1.3 2.3 0.7
a Values are mean ± SD or %. All estimates account for clustering. b Sample size at baseline ranged from N = 2614 to 2623 in the full sample; N = 430 to 432 in the T24 arm; N = 865 to 870 in the T18 arm; N = 432 to 433 in the TNFP arm; and N = 885 to 888 in the control arm. c Sample size at follow-up ranged from N = 2606 to 2614 in the full sample; N = 429 to 432 in the T24 arm; N = 879 to 880 in the T18 arm; N = 429 to 431 in the TNFP arm; and N = 868 to 871 in the control arm. d Retail is a more formal form of trade, involving keeping a premise or shop that is owned or rented. Market/trade is informal or petty trade, such as a market stall or street vending.
* Study arms differ, p < 0.05.

Strengthening and Evaluating the PM2A Approach – Burundi Follow-Up Report: Children 0–23 Months
46
Table 26. Housing characteristicsa
Baselineb Follow-upc
Full sample
Study arm Full sample
Study arm
T24 T18 TNFP Control T24 T18 TNFP Control
N 2623 432 870 433 888 2612 432 880 430 871
Owns home 97.4 97.5 96.8 97.7 97.7 97.5 97.7 96.2 97.4 98.9
Dwelling type and characteristics
Number of rooms 3.2 ± 1.2 3.4 ± 1.3 3.3 ± 1.2 3.2 ± 1.3 3.1 ± 1.2 3.3 ± 1.2 3.5 ± 1.2 3.3 ± 1.2 3.4 ± 1.2 3.2 ± 1.2
Shared dwelling 0.6 0.5 0.6 0.7 0.7 0.7 0.9 0.8 1.2 0.3
Housing quality
Type of floor
Dirt 96.1 96.3 96.2 93.1 97.4 95.2* 94.4 94.1 93.2 97.6
Type of walls
Rammed earth 21.0 7.6 19.1 18.9 30.3 18.3 7.2 16.5 17.0 26.2
Adobe bricks 73.1 87.5 77.1 70.0 63.6 70.4 83.1 73.2 64.7 64.2
Clay bricks 3.7 2.5 2.0 8.8 3.6 10.0 7.9 9.0 16.7 8.6
Cement bricks/stone 0.8 1.9 0.2 0.7 0.8 0.7 1.9 0.3 0.9 0.2
Other 1.4* 0.5 1.6 1.6 1.7 0.7 0.0 1.0 0.7 0.8
Type of roof
Thatch/straw 50.4 44.7 49.7 48.7 54.7 46.5 40.7 46.1 40.0 53.0
Corrugated aluminum 36.8 38.9 37.2 36.7 35.4 38.7 42.8 39.1 40.0 35.6
Concrete/tile 12.8 16.4 13.1 14.5 9.9 14.8 16.4 14.8 20.0 11.4
a Values are mean ± SD or %. All estimates account for clustering. b Sample size at baseline ranged from N = 2608 to 2623 in the full sample; N = 430 to 432 in the T24 arm; N = 863 to 870 in the T18 arm; N = 429 to 433 in the TNFP arm; and N = 884 to 888 in the control arm. c Sample size at follow-up ranged from N = 2597 to 2612 in the full sample; N = 426 to 432 in the T24 arm; N = 874 to 880 in the T18 arm; N = 427 to 430 in the TNFP arm; and N = 869 to 871 in the control arm. * Study arms differ, p < 0.05.

Strengthening and Evaluating the PM2A Approach – Burundi Follow-Up Report: Children 0–23 Months
47
Table 27. Water and energy accessa
Baselineb Follow-upc
Full sample
Study arm
Full sample
Study arm
T24 T18 TNFP Control T24 T18 TNFP Control
N 2623 432 870 433 888 2612 432 880 430 870
Drinking water source
Tap water 72.4 82.8 68.5 75.3 69.8 78.9 91.7 75.3 82.6 74.4
Open well 2.4 0.5 3.1 2.8 2.4 3.5 0.0 3.5 4.9 4.5
Covered well 1.6 0.7 0.5 1.8 3.0 1.8 1.9 1.1 2.1 2.2
Surface water 23.6 16.0 27.9 20.1 24.8 15.8 6.5 20.0 10.5 19.0
Time to get drinking water (minutes) 37.2 ± 38.0* 30.6 ± 26.9 39.6 ± 39.7 37.5 ± 33.3 37.9 ± 42.5 35.9 ± 40.3* 25.1 ± 26.1 36.7 ± 33.5 42.6 ± 46.4 37.2 ± 47.5
Household has electricity 0.5 0.0 0.7 0.2 0.6 0.7 0.2 1.4 0.7 0.2
Energy for cooking
Charcoal 1.5 0.7 1.6 3.5 0.8 3.3 2.6 4.6 5.7 1.2
Firewood/straw 98.2 99.3 98.0 96.1 99.0 96.6 97.2 95.3 94.1 98.7
Other 0.3 0.0 0.3 0.5 0.2 0.2 0.2 0.1 0.2 0.1
Energy for light
Electricity 0.5 0.0 0.7 0.2 0.7 0.7 0.2 1.3 1.2 0.2
Kerosene/oil 18.7 31.7 18.3 21.6 11.5 9.6 16.9 10.5 11.6 4.0
Candle 3.0 3.5 3.7 4.2 1.6 2.8 4.2 3.5 4.0 0.7
Battery-operated equipment 47.6 38.2 48.9 40.4 54.3 71.5 67.5 71.6 68.8 74.7
Firewood/straw/coal/dung 30.2* 26.6 28.4 33.6 32.0 15.4* 11.1 13.2 14.4 20.3
a Values are mean ± SD or %. All estimates account for clustering. b Sample size at baseline ranged from N = 2604 to 2623 in the full sample; N = 427 to 432 in the T24 arm; N = 863 to 870 in the T18 arm; N = 428 to 433 in the TNFP arm; and N = 884 to 888 in the control arm. c Sample size at follow-up ranged from N = 2575 to 2609 in the full sample; N = 425 to 432 in the T24 arm; N = 864 to 880 in the T18 arm; N = 423 to 430 in the TNFP arm; and N = 858 to 870 in the control arm. * Study arms differ, p < 0.05.

Strengthening and Evaluating the PM2A Approach – Burundi Follow-Up Report: Children 0–23 Months
48
Table 28. Asset ownershipa
Baselineb Follow-upc
Full sample
Study arm
Full sample
Study arm
T24 T18 TNFP Control T24 T18 TNFP Control
N 2623 432 870 433 888 2614 432 880 431 871
% of households that own
House(s)/apartment(s) 97.1 98.4 97.2 96.3 96.6 96.4 95.6 95.3 96.8 97.7
Plot(s) of land 97.1 97.5 97.7 97.5 96.1 98.0* 98.1 97.0 99.5 98.0
Number owned
Household goods 24.3 ± 14.1* 27.3 ± 13.7 24.2 ± 12.8 25.4 ± 18.7 22.4 ± 12.6 28.6 ± 14.0* 30.9 ± 13.2 30.3 ± 15.3 30.7 ± 15.6 24.6 ± 11.2
Agricultural equipment 4.3 ± 2.2* 4.8 ± 2.5 4.3 ± 2.1 4.4 ± 2.4 4.0 ± 2.1 4.8 ± 2.4* 5.3 ± 2.5 4.9 ± 2.4 4.9 ± 2.6 4.5 ± 2.0
Small animals (chicken, rabbit) 1.9 ± 3.7 1.7 ± 3.0 1.8 ± 3.0 1.8 ± 3.4 2.0 ± 4.5 2.0 ± 3.4 2.0 ± 3.6 2.2 ± 3.4 1.8 ± 3.0 1.9 ± 3.3
Medium animals (goat, sheep) 1.4 ± 1.9 1.6 ± 2.2 1.3 ± 1.9 1.5 ± 1.9 1.3 ± 1.9 1.7 ± 2.3 2.0 ± 2.5 1.7 ± 2.1 2.0 ± 2.4 1.5 ± 2.2
Large animals (cow, pig) 0.3 ± 0.9 0.3 ± 0.9 0.3 ± 0.8 0.4 ± 1.1 0.2 ± 0.9 0.5 ± 1.2 0.5 ± 1.2 0.4 ± 1.1 0.5 ± 1.3 0.5 ± 1.4
Motorbike/bike 0.4 ± 0.5 0.3 ± 0.5 0.4 ± 0.5 0.4 ± 0.5 0.4 ± 0.5 0.5 ± 0.5 0.4 ± 0.5 0.5 ± 0.6 0.5 ± 0.6 0.4 ± 0.5
a Values are mean ± SD or %. All estimates account for clustering. b Sample size at baseline did not vary.
c Sample size at follow-up ranged from N = 2613 to 2614 in the full sample; and N = 879 to 880 in the T18 arm.
* Study arms differ, p < 0.05.

Strengthening and Evaluating the PM2A Approach – Burundi Follow-Up Report: Children 0–23 Months
49
5. Results: Maternal Characteristics
Mothers were on average 28 years old at baseline and follow-up, and nearly all were the biological mother of the index child (Table 29). The percentage with a spouse or partner decreased from the baseline to the follow-up from around 88% to 83%. Overall, maternal education was very low: Only half had ever attended school, and of those that did, very few completed primary school. Maternal education increased somewhat between baseline and follow-up: The percentage of mothers who never attended school decreased from 52% to 46%. The percentage of illiterate mothers (almost 40%) did not change between baseline and follow-up.
At both baseline and follow-up, more than 90% of mothers reported having worked in the past 12 months. Similar to household heads, almost all reported working in farming and agriculture. The percentage not remunerated for their work was much higher at follow-up (62.6%) than at to baseline (37.7%). The mothers’ perceived contribution to household expenses was quite small in both surveys.

Strengthening and Evaluating the PM2A Approach – Burundi Follow-Up Report: Children 0–23 Months
50
Table 29. Maternal characteristics and activitiesa
Baselineb Follow-upc
Full sample
Study arm
Full sample
Study arm
T24 T18 TNFP Control T24 T18 TNFP Control
N 2623 432 870 433 888 2614 432 880 431 871
Age 28.6 ± 7.0 28.3 ± 6.8 29.0 ± 7.1 28.6 ± 6.7 28.3 ± 7.0 28.5 ± 6.6 28.6 ± 6.3 28.5 ± 6.5 29.1 ± 7.0 28.2 ± 6.5 Married 87.8* 88.7 89.8 91.2 83.9 83.3 87.5 82.5 85.8 80.7 Biological mother 99.5* 99.5 99.3 100.0 99.4 99.6 99.8 99.4 100.0 99.5
Education None/preschool 51.8 51.0 49.4 54.4 54.0 46.3 43.3 41.0 47.3 52.7 Primary incomplete 44.2 44.7 46.9 39.8 43.5 49.5 52.1 54.0 47.8 44.6 Primary complete 1.0 1.2 1.1 0.7 0.9 0.8 0.9 0.6 1.2 0.9 Secondary incomplete 2.7 3.2 2.5 5.1 1.6 3.3 3.7 4.4 3.7 1.7 Higher education 0.0 0.0 0.0 0.0 0.0 0.0 0.0 0.0 0.2 0.0
Literacy Literate 52.0 56.0 52.6 50.3 50.2 55.9 62.7 60.2 56.1 48.1 Partially literate 9.2 9.7 9.8 11.1 7.4 4.7 4.2 3.4 4.6 6.3 Illiterate 38.8 34.3 37.6 38.6 42.4 39.4 33.1 36.4 39.2 45.6
Work during the past 12 months None 8.3 5.1 7.1 10.0 10.1 7.4 9.3 7.7 9.3 5.1 Year-long 70.6 71.8 69.3 67.3 73.0 73.2 69.2 75.8 71.9 73.2 Seasonal 9.4 10.4 12.7 12.4 4.2 7.8 8.4 6.9 8.1 8.2 Sometimes 11.7 12.7 10.9 10.3 12.6 11.6 13.1 9.5 10.7 13.5
Main occupation Unemployed 8.2 5.1 7.0 10.0 10.1 7.4 9.3 7.7 9.3 5.1 Farms own or family land 79.2 85.4 79.4 76.8 77.1 80.0 80.3 78.6 77.3 82.5 Farms someone else’s land 4.6 3.9 5.0 3.0 5.2 7.6 7.6 7.2 6.5 8.5 Agricultural labor 6.3 3.2 6.8 7.2 6.8 2.1 0.5 2.0 1.4 3.2 Retail 0.0 0.0 0.0 0.0 0.0 0.2 0.2 0.1 0.5 0.1 Market/trade 0.5 0.7 0.2 0.7 0.5 1.0 0.7 1.1 2.3 0.2 Office/institution 1.0 0.9 1.4 1.9 0.2 1.5 0.9 2.7 1.6 0.3 Manual labor 0.2 0.5 0.2 0.5 0.0 0.3 0.0 0.3 0.9 0.0 Other 0.1 0.2 0.0 0.0 0.1 0.2 0.5 0.1 0.2 0.0
Earnings Cash 7.8 4.6 8.8 9.2 7.7 6.7 3.6 7.4 7.2 7.4 In-kind 31.0 34.9 31.1 36.4 26.1 15.9 23.8 13.9 15.3 14.3 Cash and in-kind 23.5 27.8 25.0 21.8 20.6 4.8 4.9 4.2 2.3 6.5 Other compensation 0.0 0.0 0.1 0.0 0.0 10.0 4.6 14.7 8.4 8.8 Nothing 37.7 32.7 35.0 32.6 45.7 62.6 63.2 59.9 66.8 63.0
Mother’s perceived contribution to household expenses Nothing 23.6 27.3 22.4 21.7 23.8 30.1 35.0 30.0 28.8 28.5 Almost nothing 17.0 15.7 20.0 14.8 15.7 14.6 13.7 14.3 15.6 14.8 A little 46.7 42.6 44.6 54.7 46.8 40.3 40.5 40.6 39.3 40.5 All/almost all 12.8 14.4 13.0 8.8 13.7 15.0 10.9 15.1 16.3 16.2
a Values are mean ± SD or %. All estimates account for clustering. b Sample size at baseline ranged from N = 2406 to 2623 in the full sample; N = 410 to 432 in the T24 arm; N = 809 to 870 in the T18 arm; N = 390 to 433 in the TNFP arm; and N = 797 to 888 in the control arm. c Sample size at follow-up ranged from N = 2421 to 2614 in the full sample; N = 391 to 432 in the T24 arm; N = 812 to 880 in the T18 arm; N = 391 to 431 in the TNFP arm; and N = 827 to 871 in the control arm. * Study arms differ, p < 0.05.
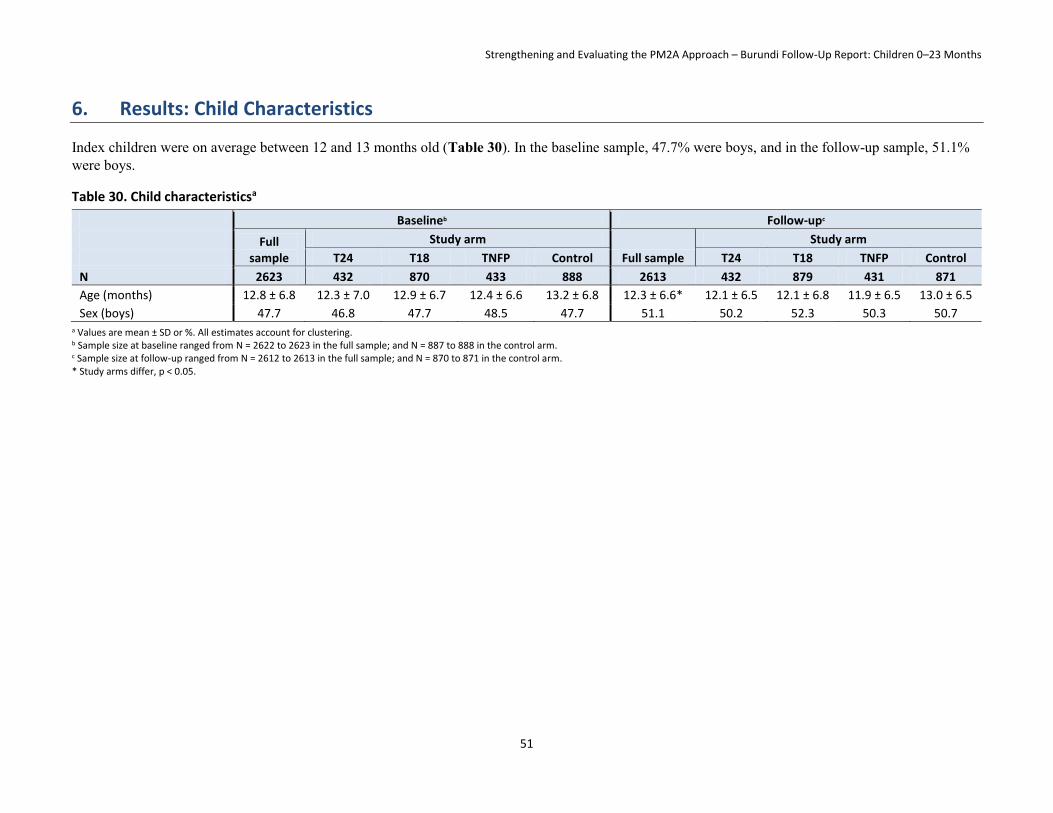
Strengthening and Evaluating the PM2A Approach – Burundi Follow-Up Report: Children 0–23 Months
51
6. Results: Child Characteristics
Index children were on average between 12 and 13 months old (Table 30). In the baseline sample, 47.7% were boys, and in the follow-up sample, 51.1% were boys.
Table 30. Child characteristicsa
Baselineb Follow-upc
Full sample
Study arm
Full sample
Study arm
T24 T18 TNFP Control T24 T18 TNFP Control
N 2623 432 870 433 888 2613 432 879 431 871
Age (months) 12.8 ± 6.8 12.3 ± 7.0 12.9 ± 6.7 12.4 ± 6.6 13.2 ± 6.8 12.3 ± 6.6* 12.1 ± 6.5 12.1 ± 6.8 11.9 ± 6.5 13.0 ± 6.5
Sex (boys) 47.7 46.8 47.7 48.5 47.7 51.1 50.2 52.3 50.3 50.7 a Values are mean ± SD or %. All estimates account for clustering. b Sample size at baseline ranged from N = 2622 to 2623 in the full sample; and N = 887 to 888 in the control arm. c Sample size at follow-up ranged from N = 2612 to 2613 in the full sample; and N = 870 to 871 in the control arm. * Study arms differ, p < 0.05.

Strengthening and Evaluating the PM2A Approach – Burundi Follow-Up Report: Children 0–23 Months
52
7. Results: Tubaramure Participation
7.1 Enrollment and Participation in Tubaramure At follow-up, approximately 95% of respondents in treatment collines were aware of Tubaramure, and between 75% and 85% claimed that they either had participated previously or were participating currently (Table 31). Both the program awareness and beneficiary status differed significantly among the four groups: The control group was less often aware of the program and less often had been a beneficiary. In the T18 group, those who were not current beneficiaries were almost equally split into past beneficiaries or households never having participated in the program. Approximately three-quarters of the control group respondents were also aware of Tubaramure, and a few (4.1%) claimed that they were either current or past program beneficiaries. Among those who reported that they were beneficiaries and lived in treatment collines, 11.8% were Tubaramure leader mothers, and approximately half could produce a beneficiary card. Among current beneficiaries, nearly all were aware that Tubaramure provided rations, 80.1% mentioned BCC as a program activity, and only 26.4% brought up the cooking demonstrations. The percentage who were leader mothers, who could produce a beneficiary card, and who were aware of the various program components did not differ significantly among the three treatment arms.
Among those who never participated in Tubaramure, approximately one-third of respondents in each of the three treatment arms reported that they had not met program requirements (Table 32). Compared to the control group, those in the treatment groups more often reported that they did not meet program requirements or that they were refused registration. Program requirement included being able to show their ration card and Tubaramure beneficiary card at the distributions. Those in the control arm did not participate because the program was not available to them.
7.2 Participation in Tubaramure Program Activities Almost 80% of current beneficiary mothers attended a food distribution in the last month (Table 33). In the case that the beneficiary could not attend, 64.9% reported to have an alternate available to pick up rations. Among those with an alternate, 92.2% had sent the alternate at some point. Nearly all participants reported that they received the types of food expected (i.e., CSB and oil) at the last distribution, but slightly fewer (93.7%) claimed to have received the entire expected ration. When the complete ration was not received, more than half did not know why they did not receive the entire quantity, and almost 20% reported that there was insufficient food available28; the perceived reasons differed significantly among the three treatment arms. On average, Tubaramure participants traveled more than 1.5 hours to the distribution site; 86.6% walked and 13.4% took bicycles. The majority (80.4%) did not receive help carrying home food from the last distribution. Overall, respondents’ food distribution experiences at the most recent distribution event did not differ significantly among the three treatment arms.
During the previous 4 months, beneficiary mothers (mothers of the children 0–23 months) had attended 3.1 distributions, whereas the alternate had attended 1.1 (Table 34). Among program participants, missing a food distribution was rare (did not differ significantly from 0), but absences were caused by illnesses, lack of a beneficiary card, and lack of information about the distribution. The total number attended differed among the three treatment arms; beneficiaries of the TNFP arm had attended slightly fewer distributions. During the previous 4 months, respondents received the complete ration on an average of 4.0 occasions, and lacked part of the ration on an average of 0.2 occasions. Having received
28 Note that this information was obtained through self-report. Beneficiaries may not be fully aware that the quantity of food received changes when the beneficiary child reaches 6 months of age.

Strengthening and Evaluating the PM2A Approach – Burundi Follow-Up Report: Children 0–23 Months
53
the complete ration in the last four distributions differed significantly among the three treatment arms, and was least common in the TNFP group.
Among beneficiaries, 84.3% reported ever participating in a Tubaramure care group,29 but only 46.0% had attended a care group during the last month (Table 35). Most (98.5%) reached care group meetings on foot. During the previous 4 months, beneficiary respondents had attended, on average, 4.3 meetings and missed 1.1. As care groups should meet every 2 weeks, the expected number of care groups attended over a 4-month period is eight. The results thus indicate that attendance is considerably lower than intended by the program design. In addition, the low reported number of care groups missed (1.1 instead of the expected 3.7) appears to indicate either that care groups are not regularly organized or that women are not always aware that they are being held. Reasons for missing a care group meeting were primarily attributable to an illness of the beneficiary or a family member. Among those who had participated in a care group, 46.2% reported that a cooking demonstration had ever been offered, and it had been 3.6 months since the last demonstration.30 Overall, care group experiences did not differ significantly among the three treatment arms.
Only 31.1% of beneficiary respondents had ever received a visit by a Tubaramure leader mother, and, on average, the last visit was approximately 3 months ago (Table 36). The duration since the most recent visit differed significantly among the three treatment groups and was shortest in the TNFP arm. These respondents reported that during these visits leader mothers discussed if previous lessons are being applied (51.3%), reviewed previous lessons (22.5%), discussed the index child’s health (21.6%), discussed the mother’s health (16.1%), addressed any difficulties applying the lessons (14.8%), discussed the health of others (14.0%), and reviewed material missed during absences (7.6%). Characteristics of leader mother visits differed significantly only in that TNFP mothers were more likely to report that their leader mother discussed identifying difficulties in applying the lessons.
29 We refer to beneficiary care groups. Participation in leader mother care groups was not assessed. 30 Cooking demonstrations had not been fully launched at the time of the 2012 survey.

Strengthening and Evaluating the PM2A Approach – Burundi Follow-Up Report: Children 0–23 Months
54
Table 31. Tubaramure program awareness and participationa
Follow-upb
Full sample
Study arm
T24 T18 TNFP Control
N 2611 432 879 431 869
Aware of Tubaramure 88.2* 94.4 95.4 97.0 73.5
Beneficiary status
Current beneficiary 45.1 73.5 55.4 79.3 2.4
Past beneficiary 9.3 6.3 20.3 5.2 1.7
Never a beneficiary 45.6* 20.2 24.4 15.5 95.9
Leader motherc 11.8 9.7 12.8 12.5 –
Beneficiary cardc
Yes, presented 51.4 41.1 57.2 52.6 –
Yes, not presented 30.9 35.0 29.6 28.9 –
No 17.8 23.9 13.2 18.5 –
Program awareness; % who mentionedc
Rations 99.2 99.7 99.6 98.2 –
BCC 80.1 75.9 81.2 82.5 –
Cooking demonstrations 26.4 27.2 25.2 27.5 – a Values are mean ± SD or %. All estimates account for clustering. b Sample size ranged from N = 1107 to 2611 in the full sample; N = 308 to 432 in the T24 arm; N = 477 to 879 in the T18 arm; N = 321 to 431 in the TNFP arm; and N = 839 to 869 in the control arm. c Sample limited to current Tubaramure participants. * Study arms differ, p < 0.05.

Strengthening and Evaluating the PM2A Approach – Burundi Follow-Up Report: Children 0–23 Months
55
Table 32. Reasons for non-participation in Tubaramure (among current non-beneficiaries)a
a Values are %. All estimates account for clustering. b Sample size at follow-up ranged from N = 1165 to 2614 in the full sample; N = 86 to 432 in the T24 arm; N = 210 to 880 in the T18 arm; and N = 803 to 871 in the control arm. c Sample limited to current non-participants. * Study arms differ, p < 0.05.
Follow-upb
Full sample
Study arm
T24 T18 TNFP Control
Nc 2614 432 880 431 871
Why never participated in Tubaramure
Help not available 0.1 0.0 0.5 0.0 0.0
Husband did not want to 0.1 0.0 0.0 1.5 0.0
Site too far 0.1 0.0 0.5 0.0 0.0
Transportation 0.1 0.0 0.5 0.0 0.0
Did not meet program requirements 12.1* 37.2 36.0 27.3 1.9
Dislike program requirements 0.3 0.0 1.0 3.0 0.0
Inconvenient dates/times 0.1 0.0 0.5 0.0 0.0
Not enough time 0.1 0.0 0.5 0.0 0.0
Wait at distribution site 0.1 0.0 0.5 0.0 0.0
Dislike course 0.3 0.0 0.5 1.5 0.1
Program unavailable 64.7* 0.0 3.8 3.0 92.5
Does not know 0.9 1.2 1.4 3.0 0.5
Registration refused 2.3* 3.5 2.6 3.7 0.8
Other 6.0* 8.3 9.3 4.6 2.3

Strengthening and Evaluating the PM2A Approach – Burundi Follow-Up Report: Children 0–23 Months
56
Table 33. Tubaramure food distribution experiences (most recent, among current beneficiaries)a
Follow-upb
Full sample
Study arm
T24 T18 TNFP Control
Nc 1138 317 484 337 –
Attendance Attended last month’s food distribution 79.3 80.7 80.8 75.7 – Months since last food distribution attended 1.6 ± 3.2 1.4 ± 3.0 1.5 ± 3.2 1.8 ± 3.3 –
Alternate support Available to pick up rations 64.9 70.7 67.4 56.1 – Has ever attended food distributiond 92.2 94.6 93.6 86.8 –
Who attended last food distribution Respondent 70.5 66.5 70.5 74.3 – Alternate 29.5 33.5 29.5 25.7 –
Food received at last distribution CSB 99.9 100.0 99.8 100.0 – Oil 99.5 99.4 99.6 99.4 – All foods expected 99.6 100.0 100.0 98.8 – All quantities expected 93.7 93.0 94.1 93.6 –
Why not all food(s) expected Did not bring food ration bucket 1.4 0.0 3.7 0.0 – Insufficient food 19.4 32.0 14.8 10.0 – Does not know 58.3* 32.0 66.7 80.0 – Other 20.8* 40.0 14.8 5.0 –
Time (minutes) to reach food distribution 99.1 ± 81.5 104.8 ± 74.7 103.5 ± 88.4 88.7 ± 78.2 –
Transport to last food distribution Walking 86.6 79.7 87.7 91.5 – Bicycle 13.4 20.3 12.3 8.5 – Car 0.1 0.0 0.2 0.0 –
Help to carry food from last distribution None 80.4 83.2 77.2 82.5 – Household member 8.4* 7.0 11.3 5.7 – Other family member 4.6 4.1 4.4 5.4 – Other person 6.4 5.4 6.9 6.6 –
a Values are mean ± SD or %. All estimates account for clustering. b Sample size at follow-up ranged from N = 72 to 1138 in the full sample; N = 25 to 317 in the T24 arm; N = 27 to 484 in the T18 arm; and N = 20 to 337 in the TNFP arm. c Sample limited to current Tubaramure participants. d Sample limited to those reporting an alternate available to pick up food rations. * Study arms differ, p < 0.05
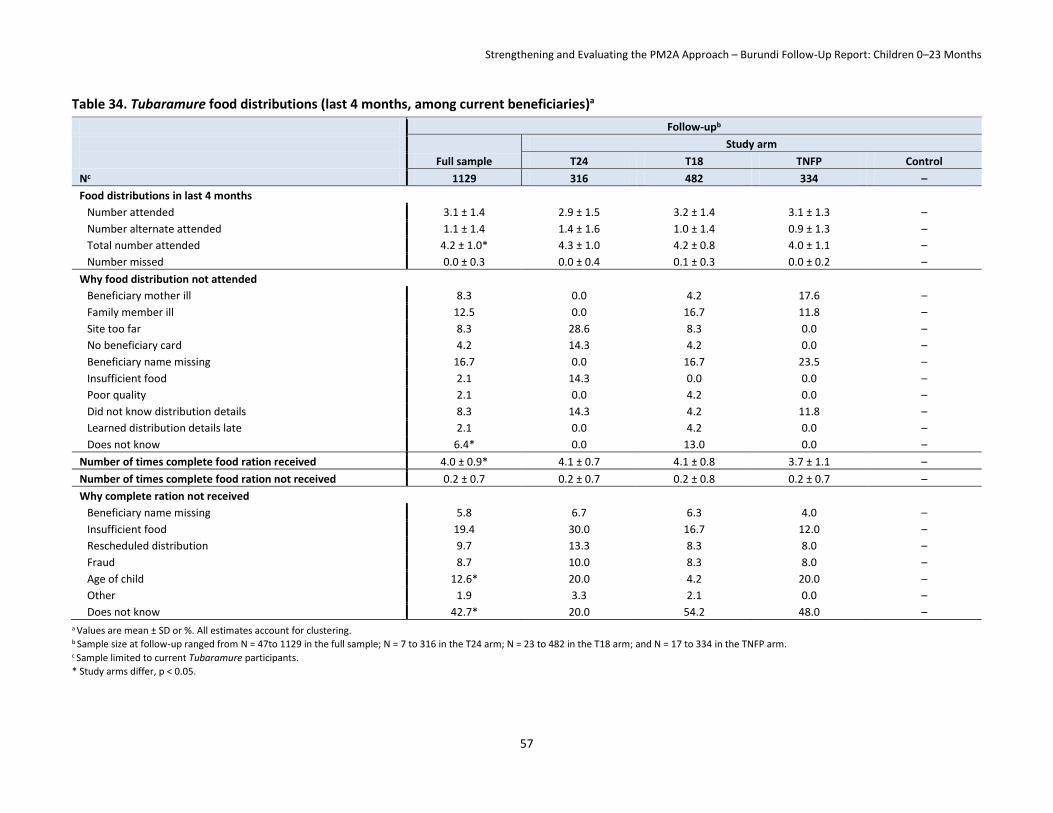
Strengthening and Evaluating the PM2A Approach – Burundi Follow-Up Report: Children 0–23 Months
57
Table 34. Tubaramure food distributions (last 4 months, among current beneficiaries)a
Follow-upb
Full sample
Study arm
T24 T18 TNFP Control
Nc 1129 316 482 334 –
Food distributions in last 4 months
Number attended 3.1 ± 1.4 2.9 ± 1.5 3.2 ± 1.4 3.1 ± 1.3 –
Number alternate attended 1.1 ± 1.4 1.4 ± 1.6 1.0 ± 1.4 0.9 ± 1.3 –
Total number attended 4.2 ± 1.0* 4.3 ± 1.0 4.2 ± 0.8 4.0 ± 1.1 –
Number missed 0.0 ± 0.3 0.0 ± 0.4 0.1 ± 0.3 0.0 ± 0.2 –
Why food distribution not attended
Beneficiary mother ill 8.3 0.0 4.2 17.6 –
Family member ill 12.5 0.0 16.7 11.8 –
Site too far 8.3 28.6 8.3 0.0 –
No beneficiary card 4.2 14.3 4.2 0.0 –
Beneficiary name missing 16.7 0.0 16.7 23.5 –
Insufficient food 2.1 14.3 0.0 0.0 –
Poor quality 2.1 0.0 4.2 0.0 –
Did not know distribution details 8.3 14.3 4.2 11.8 –
Learned distribution details late 2.1 0.0 4.2 0.0 –
Does not know 6.4* 0.0 13.0 0.0 –
Number of times complete food ration received 4.0 ± 0.9* 4.1 ± 0.7 4.1 ± 0.8 3.7 ± 1.1 –
Number of times complete food ration not received 0.2 ± 0.7 0.2 ± 0.7 0.2 ± 0.8 0.2 ± 0.7 –
Why complete ration not received
Beneficiary name missing 5.8 6.7 6.3 4.0 –
Insufficient food 19.4 30.0 16.7 12.0 –
Rescheduled distribution 9.7 13.3 8.3 8.0 –
Fraud 8.7 10.0 8.3 8.0 –
Age of child 12.6* 20.0 4.2 20.0 –
Other 1.9 3.3 2.1 0.0 –
Does not know 42.7* 20.0 54.2 48.0 – a Values are mean ± SD or %. All estimates account for clustering. b Sample size at follow-up ranged from N = 47to 1129 in the full sample; N = 7 to 316 in the T24 arm; N = 23 to 482 in the T18 arm; and N = 17 to 334 in the TNFP arm. c Sample limited to current Tubaramure participants.
* Study arms differ, p < 0.05.

Strengthening and Evaluating the PM2A Approach – Burundi Follow-Up Report: Children 0–23 Months
58
Table 35. Tubaramure care group participation (among current beneficiaries)a
Follow-upb
Full sample
Study arm
T24 T18 TNFP Control
Nc 1137 317 483 337 –
Ever participated 84.3 82.0 84.7 86.1 –
Attended last month 46.0 40.5 45.4 51.8 –
Transportation to last care group meeting
Walking 98.5 98.7 98.4 98.5 –
Bicycle 0.5 0.9 0.5 0.0 –
Other 1.0 0.4 1.1 1.5 –
Number attended in last four months 4.3 ± 4.2 3.6 ± 3.2 4.6 ± 4.6 4.6 ± 4.4 –
Number missed in last four months 1.1 ± 1.5 0.8 ± 1.0 1.3 ± 1.6 1.1 ± 1.7 –
Why missed care group
Beneficiary mother ill 24.3 31.1 23.4 20.1 –
Family member ill 42.7 37.7 48.1 38.3 –
Husband did not want to 0.2 0.0 0.4 0.0 –
Weather 4.5 3.3 5.5 3.9 –
Site too far 5.3 4.9 5.5 5.2 –
Transportation 0.6 1.6 0.4 0.0 –
Inconvenient date and time 12.5 9.8 12.8 14.3 –
Rescheduled 3.7 1.6 3.8 5.2 –
Time/long wait 3.9 4.1 3.4 4.5 –
Did not know meeting details 16.2 17.2 17.4 13.6 –
Learned meeting details late 2.5 3.3 2.1 2.6 –
Arrived late 1.4 0.8 0.9 2.6 –
Dislike other beneficiary moms 0.2 0.0 0.0 0.6 –
Does not like to go 0.2 0.0 0.0 0.6 –
Other 0.6 0.0 0.4 1.3 –
Cooking demonstrations
Months since last time 3.6 ± 4.7 3.1 ± 3.6 3.9 ± 5.2 3.7 ± 4.9 –
Offered at care group 46.2 45.5 46.6 46.2 –
a Values are mean ± SD or %. All estimates account for clustering. b Sample size at follow-up ranged from N = 511 to 1137 in the full sample; N = 122 to 317 in the T24 arm; N = 235 to 483 in the T18 arm; and N = 154 to 337 in the TNFP arm. c Sample limited to current Tubaramure participants. * There were no statistical differences among study arms, p < 0.05.
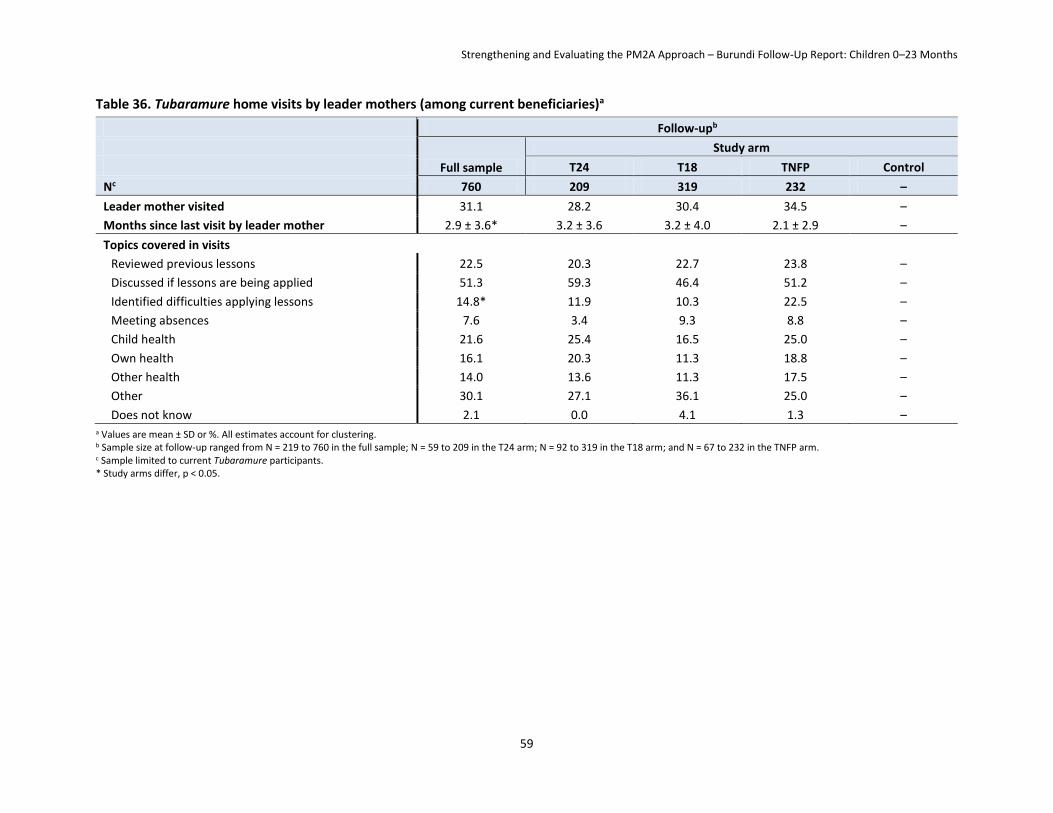
Strengthening and Evaluating the PM2A Approach – Burundi Follow-Up Report: Children 0–23 Months
59
Table 36. Tubaramure home visits by leader mothers (among current beneficiaries)a
a Values are mean ± SD or %. All estimates account for clustering. b Sample size at follow-up ranged from N = 219 to 760 in the full sample; N = 59 to 209 in the T24 arm; N = 92 to 319 in the T18 arm; and N = 67 to 232 in the TNFP arm. c Sample limited to current Tubaramure participants. * Study arms differ, p < 0.05.
Follow-upb
Full sample
Study arm
T24 T18 TNFP Control
Nc 760 209 319 232 –
Leader mother visited 31.1 28.2 30.4 34.5 –
Months since last visit by leader mother 2.9 ± 3.6* 3.2 ± 3.6 3.2 ± 4.0 2.1 ± 2.9 –
Topics covered in visits
Reviewed previous lessons 22.5 20.3 22.7 23.8 –
Discussed if lessons are being applied 51.3 59.3 46.4 51.2 –
Identified difficulties applying lessons 14.8* 11.9 10.3 22.5 –
Meeting absences 7.6 3.4 9.3 8.8 –
Child health 21.6 25.4 16.5 25.0 –
Own health 16.1 20.3 11.3 18.8 –
Other health 14.0 13.6 11.3 17.5 –
Other 30.1 27.1 36.1 25.0 –
Does not know 2.1 0.0 4.1 1.3 –

Strengthening and Evaluating the PM2A Approach – Burundi Follow-Up Report: Children 0–23 Months
60
8. Results: Household Impact
8.1 Household Hygiene and Sanitation Though one-quarter of households used unsafe drinking water (as discussed in Section 4), the vast majority (96.7% at baseline and 94.0% at follow-up) did not treat their drinking water (Table 37). Tubaramure modestly decreased the percentage of households that did not treat their water by 3–5 percentage points (significant in the T18 and TNFP groups), but, overall, very few households treated their drinking water (Table 38). The percentage of households that covered their drinking water increased in all study groups, from 75.8% at baseline to 90.7% at follow-up. However, households in all study arms (including the control) made similar changes, and the differences between each treatment arm and the control arm were not significant. At baseline, most households discarded (48.7%), composted (46.2%), or buried (12.1%) their trash. Tubaramure increased the percentage of households that composted their trash by 13 to 17 percentage points (significant in all three treatment groups).
The percentage of households that reported having a bednet (57.4% at baseline and 54.1% at follow-up) and the mean number of bednets owned by these households (2.0 at baseline and 1.5 at follow-up) both decreased slightly between baseline and follow-up. Households owning bednets did not consistently use them31: At baseline 43.4% of households reported that at least one member slept under a bednet and 36.2% reported that all members slept under bednets. There was little change at follow-up when these values were 46.4% and 36.7%, respectively. No significant impact by Tubaramure on bednet ownership or use was observed.
The majority of households (73.2% at baseline and 83.9% at follow-up) had soap available and the majority of mothers reported using it on the day of the interview or the previous day (Table 39). Despite owning soap, it was rarely used at key handwashing times. At both baseline and follow-up, no more than 10% of mothers reported using soap to wash a child’s hands or their own hands after defecation, after cleaning a child, before feeding a child, or before preparing food. Using soaps to wash one’s own hands before eating was slightly more common (20.4% at baseline and 27.2% at follow-up). The percentage of mothers that had used soap on the current or previous day increased between 3 and 9 percentage points (statistically significant for the T18 group) (Table 40). Tubaramure had a modest positive impact of 4–6 percentage points on whether mothers used soap after defecating, but it did not significantly affect soap use in any other circumstances.
At both baseline and follow-up, fewer than one-fourth of mothers and fewer than one-third of children were considered “clean” in a spot-check of hands, hair, clothes, and face (Table 41). Of homesteads, 32.2% of exteriors and 4.7% of interiors were considered clean at baseline, and 37.0% and 4.5%, respectively, were considered clean at follow-up. Tubaramure improved cleanliness on all four domains (Table 42). The percentage of clean mothers increased between 5 and 8 percentage points, and the percentage of clean children increased between 2 and 10 percentage points (both of these were statistically significant in T18 and TNFP groups). The percentage of households with clean exteriors and interiors improved between 2 and 7 percentage points (only significant for interiors in the T18 arm).
8.2 Household Food Security, Hunger, and Dietary Diversity Food insecurity (i.e., the ability of a household to access food, as measured by the HFIAS) was prevalent at follow-up: Nearly half of households were severely food insecure and another third moderately food 31 Peak malaria season in Burundi is from November to March. Thus, reported bednet use in this survey (conducted from October to December) is most likely at its highest.

Strengthening and Evaluating the PM2A Approach – Burundi Follow-Up Report: Children 0–23 Months
61
insecure (Table 43). Only around 10% were considered food secure. Household hunger (measured by HHS, which uses the last three items of the HFIAS and reflects the most severe food insecurity experience) confirmed the severity of food insecurity: About 10% were experiencing severe hunger and 37% moderate hunger at baseline. The percentage of hungry households dropped to approximately 8% (severe) and 20% (moderate) at follow-up. Household dietary diversity was also low: Households consumed on average food from 4 food groups (out of a possible 12) during the previous day at both the baseline and follow-up. Nearly 70% of households reported having consumed food from fewer than four food groups.
Tubaramure reduced food insecurity (as measured by the HFIAS) by an average of 2 to 3 units (on a scale from 0 to 27) (statistically significant in all three treatment groups) (Table 44). The percentage of severely food insecure households decreased by 9–18 percentage points (statistically significant in all three treatment groups). Likewise, the percentage of food secure households increased by 5–8 percentage points (statistically significant in all three treatment groups). The decline in household hunger appears to confirm the improvement in food security, but the changes were statistically significant only in the TNFP group. Tubaramure also led to a modest decline in the percentage of households with a dietary diversity score below four in the T18 (significant) and TNFP (not significant) groups.
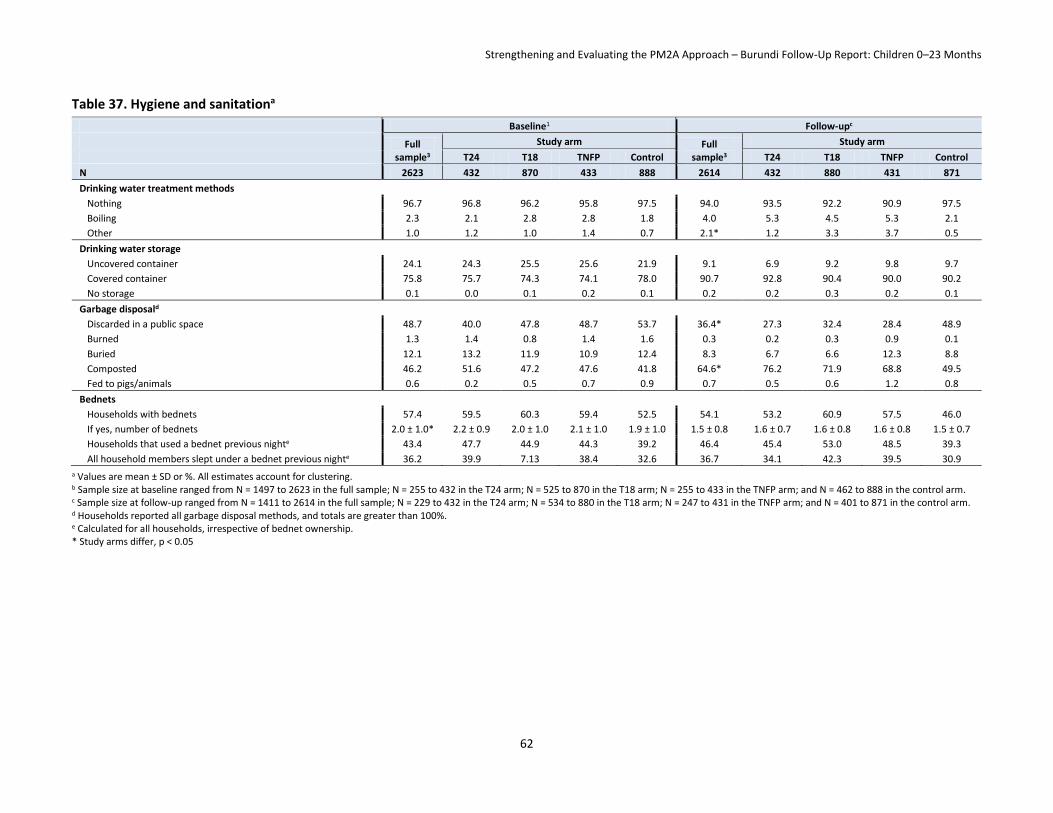
Strengthening and Evaluating the PM2A Approach – Burundi Follow-Up Report: Children 0–23 Months
62
Table 37. Hygiene and sanitationa
Baseline1 Follow-upc
Full sample3
Study arm Full sample3
Study arm
T24 T18 TNFP Control T24 T18 TNFP Control
N 2623 432 870 433 888 2614 432 880 431 871
Drinking water treatment methods
Nothing 96.7 96.8 96.2 95.8 97.5 94.0 93.5 92.2 90.9 97.5
Boiling 2.3 2.1 2.8 2.8 1.8 4.0 5.3 4.5 5.3 2.1
Other 1.0 1.2 1.0 1.4 0.7 2.1* 1.2 3.3 3.7 0.5
Drinking water storage
Uncovered container 24.1 24.3 25.5 25.6 21.9 9.1 6.9 9.2 9.8 9.7
Covered container 75.8 75.7 74.3 74.1 78.0 90.7 92.8 90.4 90.0 90.2
No storage 0.1 0.0 0.1 0.2 0.1 0.2 0.2 0.3 0.2 0.1
Garbage disposald
Discarded in a public space 48.7 40.0 47.8 48.7 53.7 36.4* 27.3 32.4 28.4 48.9
Burned 1.3 1.4 0.8 1.4 1.6 0.3 0.2 0.3 0.9 0.1
Buried 12.1 13.2 11.9 10.9 12.4 8.3 6.7 6.6 12.3 8.8
Composted 46.2 51.6 47.2 47.6 41.8 64.6* 76.2 71.9 68.8 49.5
Fed to pigs/animals 0.6 0.2 0.5 0.7 0.9 0.7 0.5 0.6 1.2 0.8
Bednets
Households with bednets 57.4 59.5 60.3 59.4 52.5 54.1 53.2 60.9 57.5 46.0
If yes, number of bednets 2.0 ± 1.0* 2.2 ± 0.9 2.0 ± 1.0 2.1 ± 1.0 1.9 ± 1.0 1.5 ± 0.8 1.6 ± 0.7 1.6 ± 0.8 1.6 ± 0.8 1.5 ± 0.7
Households that used a bednet previous nighte 43.4 47.7 44.9 44.3 39.2 46.4 45.4 53.0 48.5 39.3
All household members slept under a bednet previous nighte 36.2 39.9 7.13 38.4 32.6 36.7 34.1 42.3 39.5 30.9
a Values are mean ± SD or %. All estimates account for clustering. b Sample size at baseline ranged from N = 1497 to 2623 in the full sample; N = 255 to 432 in the T24 arm; N = 525 to 870 in the T18 arm; N = 255 to 433 in the TNFP arm; and N = 462 to 888 in the control arm. c Sample size at follow-up ranged from N = 1411 to 2614 in the full sample; N = 229 to 432 in the T24 arm; N = 534 to 880 in the T18 arm; N = 247 to 431 in the TNFP arm; and N = 401 to 871 in the control arm. d Households reported all garbage disposal methods, and totals are greater than 100%. e Calculated for all households, irrespective of bednet ownership.
* Study arms differ, p < 0.05

Strengthening and Evaluating the PM2A Approach – Burundi Follow-Up Report: Children 0–23 Months
63
Table 38. Hygiene and sanitation: impacta
Impactb
T24 vs. control T18 vs. control TNFP vs. control
Drinking water treatment methods
Nothing −3.17 ± 2.01 −3.84 ± 1.68* −4.64 ± 2.12*
Drinking water storage
Uncovered container −5.33 ± 4.08 −4.43 ± 3.52 −3.94 ± 4.13
Garbage disposalc
Discarded in a public space −6.88 ± 7.94 −9.57 ± 7.39 −14.53 ± 6.26*
Burned 0.24 ± 1.03 0.96 ± 0.75 0.97 ± 0.81
Buried −3.49 ± 4.57 −2.35 ± 4.42 4.59 ± 4.66
Composted 16.47 ± 4.32* 16.70 ± 4.45* 13.01 ± 3.82*
Fed to pigs/animals 0.30 ± 0.58 0.18 ± 0.66 0.55 ± 0.94
Bednets
Households with bednets 0.10 ± 4.76 6.54 ± 4.14 4.11 ± 7.45
If yes, number of bednets −0.13 ± 0.08 −0.02 ± 0.10 −0.06 ± 0.14
Households that used a bednet last nightd −2.68 ± 5.20 7.33 ± 4.96 3.34 ± 5.86
Household members who slept under a bednet last nightd −4.55 ± 4.835 6.20 ± 4.75 1.97 ± 5.66 a Values are double difference impact estimates ± SE in percentage points. All estimates account for clustering. b Sample size ranged from N = 2908 to 5237. c Households reported all methods of garbage disposal used, hence totals sum up to more than 100%. d These percentages were calculated for all households, irrespective of having a bednet.
* Impact estimate significantly different from 0, p < 0.05.

Strengthening and Evaluating the PM2A Approach – Burundi Follow-Up Report: Children 0–23 Months
64
Table 39. Soap usea
Baselineb Follow-upc
Full sample
Study arm Full sample
Study arm
T24 T18 TNFP Control T24 T18 TNFP Control
N 2617 432 869 432 884 2613 432 880 431 870
Soap; % of mothers who
Have available in household 72.5 76.9 73.1 71.8 70.2 82.5 86.6 84.9 83.3 77.6
Used it today or yesterday 73.2 78.9 72.2 73.6 71.2 83.9* 88.2 87.4 84.9 77.8
When used soap today or yesterday; % of mothers who washed
Child’s hands 9.4 12.1 9.9 7.9 8.3 6.0 6.0 7.7 6.3 4.3
Own hands after defecation 4.4 5.3 3.8 5.3 4.1 9.6* 13.2 10.1 12.1 6.1
Own hands after cleaning child’s defecation 5.1 6.5 4.4 6.3 4.4 4.8 6.3 3.6 8.1 3.6
Own hands before feeding child 8.8 9.5 8.2 8.6 9.0 10.4 10.2 10.9 11.8 9.3
Own hands before preparing food 7.2 7.0 6.3 7.4 7.9 8.6 8.6 7.7 9.5 9.0
Own hands before eating 20.4 19.8 19.5 23.5 20.2 27.2 26.9 28.9 26.7 25.9 a Values are mean ± SD or %. All estimates account for clustering. b Sample size at baseline ranged from N = 2612 to 2617 in the full sample; N = 430 to 432 in the T24 arm; N = 868 to 869 in the T18 arm; and N = 430 to 432 in the TNFP arm. c Sample size at follow-up ranged from N = 2612 to 2613 in the full sample; and N = 879 to 880 in the T18 arm. * Study arms differ, p < 0.05.

Strengthening and Evaluating the PM2A Approach – Burundi Follow-Up Report: Children 0–23 Months
65
Table 40. Soap use: impacta
Impactb,c
T24 vs. control T18 vs. control TNFP vs. control
Soap; % of mothers who
Have available in household 2.89 ± 4.43 4.76 ± 4.31 4.94 ± 4.81
Used it today or yesterday 3.18 ± 3.49 8.90 ± 4.19* 4.99 ± 4.17
When used soap today or yesterday; % who of mothers washed
Child’s hands −1.64 ± 2.94 1.95 ± 2.61 2.50 ± 2.57
Own hands after defecation 5.87 ± 2.77* 4.24 ± 1.79* 4.69 ± 2.35*
Own hands after cleaning child’s defecation 0.57 ± 1.74 0.07 ± 1.30 2.48 ± 2.52
Own hands before feeding child 0.73 ± 3.40 2.67 ± 2.51 3.50 ± 3.07
Own hands before preparing food 0.66 ± 3.19 0.24 ± 2.19 1.00 ± 2.94
Own hands before eating 1.91 ± 5.15 4.26 ± 3.54 −1.96 ± 4.08 a Values are double difference impact estimates ± SE in percentage points. All estimates account for clustering. b Sample size ranged from N = 5224 to 5230. One-sided tests are reported for all indicators. c One-sided tests were conducted. The a priori hypothesis was a positive effect for all indicators.
* Impact estimate significantly different from 0, p < 0.05.

Strengthening and Evaluating the PM2A Approach – Burundi Follow-Up Report: Children 0–23 Months
66
Table 41. Spot-check observationsa
Baselineb Follow-upc
Full sample
Study arm Full sample
Study arm
T24 T18 TNFP Control T24 T18 TNFP Control
N 2615 432 869 431 886 2611 432 879 431 871
Mothers all clean 23.9 20.1 23.9 22.8 26.2 23.9 23.0 24.9 26.7 22.0
Children all clean 29.6 30.7 26.6 28.8 32.3 27.3 25.3 30.0 28.3 25.0
Exteriors all clean 32.2 30.9 32.8 31.3 32.7 37.0 40.0 38.2 35.7 34.8
Interiors all cleand 4.7 6.8 4.1 2.9 5.5 4.5 4.2 5.9 3.7 3.6 a Values are mean ± SD or %. All estimates account for clustering. b Sample size at baseline ranged from N = 1198 to 2615 in the full sample; N = 147 to 432 in the T24 arm; N = 439 to 869 in the T18 arm; N = 210 to 431 in the TNFP arm; and N = 402 to 886 in the
control arm. c Sample size at follow-up ranged from N = 780 to 2611 in the full sample; N = 142 to 432 in the T24 arm; N = 256 to 879 in the T18 arm; N = 107 to 431 in the TNFP arm; and N = 275 to 871 in the
control arm. d It was often not possible to observe the interior of the house, which led to a large number of missing values.
* Study arms differ, p < 0.05.
Table 42. Spot-check observations: impacta
Impactb,c
T24 vs. control T18 vs. control TNFP vs. control
Mothers all clean 7.03 ± 5.01 4.97 ± 2.62* 7.78 ± 3.54*
Children all clean 1.93 ± 4.43 10.47 ± 2.87* 6.61 ± 3.85*
Exteriors all clean 6.62 ± 6.85 3.00 ± 4.18 1.89 ± 4.73
Interiors all cleand 1.61 ± 3.10 4.46 ± 2.21* 3.70 ± 2.43 a Values are double difference impact estimates ± SE in percentage points. All estimates account for clustering. b Sample size ranged from N = 1978 to 5226. One-sided tests were used for all indicators. c One-sided tests were conducted. The a priori hypothesis was a positive effect for all indicators. d It was often not possible to observe the interior of the house, which led to a large number of missing values.
* Impact estimate significantly different from 0, p < 0.05.

Strengthening and Evaluating the PM2A Approach – Burundi Follow-Up Report: Children 0–23 Months
67
Table 43. Household hunger and dietary diversitya
Baselineb Follow-upc
Full sample
Study arm Full sample
Study arm
T24 T18 TNFP Control T24 T18 TNFP Control
N 2623 432 870 433 888 2614 432 880 431 871
Household food insecurity access scale (HFIAS)
Score (range 0 to 27) 11.7 ± 7.3* 10.2 ± 7.0 11.2 ± 7.4 10.8 ± 7.2 13.3 ± 7.0
Categories
Food secure 10.2 11.1 11.7 14.4 6.1
Mildly insecure 6.9 9.3 8.4 5.6 4.8
Moderately insecure 33.4 39.9 31.5 34.3 31.6
Severely insecure 49.5* 39.7 48.4 45.7 57.5
Household hunger scale (HHS)
Score (range 0 to 6) 1.5 ± 1.6 1.3 ± 1.5 1.5 ± 1.5 1.5 ± 1.6 1.6 ± 1.6 1.0 ± 1.4* 0.7 ± 1.3 0.9 ± 1.4 0.8 ± 1.3 1.2 ± 1.6
Categories
Little-to-no hunger 52.6 59.7 50.9 51.5 51.2 72.1 82.1 72.6 77.0 64.3
Moderate hunger 37.3 33.3 38.1 38.1 38.0 20.0 10.9 20.2 16.7 25.9
Severe hunger 10.1 6.9 10.9 10.4 10.7 7.9* 7.0 7.2 6.3 9.8
Household dietary diversity score (HDDS)
Score (range of 0–9) 4.0 ± 1.6 4.2 ± 1.6 4.0 ± 1.6 4.0 ± 1.8 3.8 ± 1.5 3.9 ± 1.6* 3.9 ± 1.5 4.2 ± 1.7 4.1 ± 1.6 3.6 ± 1.4
HDDS < 4 65.5 63.7 63.6 62.1 70.0 68.1* 69.0 61.5 61.9 77.3 a Values are mean ± SD or %. All estimates account for clustering. b Sample size at baseline ranged from N = 2617 to 2623 in the full sample; N = 868 to 870 in the T18 arm; N = 431 to 433 in the TNFP arm; and N = 886 to 888 in the control arm. c Sample size at follow-up ranged from N = 2595 to 2614 in the full sample; N = 428 to 432 in the T24 arm; N = 871 to 880 in the T18 arm; and N = 865 to 871 in the control arm.
* Study arms differ, p < 0.05.

Strengthening and Evaluating the PM2A Approach – Burundi Follow-Up Report: Children 0–23 Months
68
Table 44. Household hunger and dietary diversity: impacta
Impactb,c
T24 vs. control T18 vs. control TNFP vs. control
Household food insecurity access scale (HFIAS)
Score (range 0 to 27) −3.10 ± 0.75* −2.13 ± 0.65* −2.56 ± 0.83*
Categories
Food secure 5.05 ± 2.17* 5.63 ± 1.87* 8.30 ± 2.83*
Mildly insecure 4.46 ± 1.63* 3.60 ± 1.45* 0.75 ± 1.66
Moderately insecure 8.33 ± 3.86* −0.06 ± 2.60 2.77 ± 3.89
Severely insecure −17.84 ± 4.41* −9.17 ± 3.23* −11.81 ± 3.43*
Household hunger scale (HHS)
Score (range 0 to 6) −0.23 ± 0.25 −0.27 ± 0.17 −0.38 ± 0.19*
Categories
Little-to-no hunger 8.94 ± 7.15 8.19 ± 4.73 12.78 ± 5.64*
Moderate hunger −10.18 ± 5.30 −5.68 ± 3.48 −9.27 ± 3.81*
Severe hunger 1.25 ± 3.60 −2.50 ± 2.61 −3.51 ± 2.87
Household dietary diversity score (HDDS)
Score (range 0 to 9) 0.01 ± 0.22 0.43 ± 0.15* 0.31 ± 0.21
Low diversity (HDDS <4) −1.75 ± 6.34 −9.20 ± 4.41* −7.17 ± 5.21 a Values are double difference impact estimates ± SE in percentage points. All estimates account for clustering. b Sample size ranged from N = 2595 to 5237. c One-sided tests were conducted. The a priori hypothesis was a positive effect for HDDS score and negative effects for HFIAS score, HHS score and % HDDS<4.
* Impact estimate significantly different from 0, p < 0.05.

Strengthening and Evaluating the PM2A Approach – Burundi Follow-Up Report: Children 0–23 Months
69
9. Results: Maternal Impact
9.1 Feeding, Care, and Health Knowledge of Mothers Only around half of the respondent mothers knew that abdominal pain may signal pregnancy complications at baseline; this dropped to 39.0% at follow-up (Table 45). Fewer than 30% mentioned vaginal bleeding at baseline, but this increased to 38.7% at follow-up. The percentage of mothers mentioning lack of fetal movement increased dramatically from 2.0% to 48.7% between surveys. Other danger signs requiring immediate medical attention were mentioned by fewer than 15% of the respondents at both baseline and follow-up. The percentage of mothers who could name at least two danger signs in pregnancy dropped by more than 10 percentage points, to 48.3%, at follow-up. A similar picture of limited and declining knowledge was observed for danger signs during childhood illnesses. Except for fever (mentioned by about 95% in both surveys), none of the danger signs was mentioned by more than 45% of the mothers. The percentage of mothers who mentioned at least two dangers signs dropped from 64.7% to 59.3%. The Tubaramure program had no significant effect on mothers’ knowledge of danger signs during pregnancy or for childhood illnesses (Table 46).
Only around 10% of mothers reported—incorrectly—that sick children should be breastfed less (Table 47, data collected only at follow-up). Around one-fifth wrongly believed that sick children should be provided with less liquid, and around 30% thought that they should be given less food. The percentage of mothers who erroneously believed that breast milk, liquid, and food intake should be reduced during convalescence was considerably smaller (approximately 2.0%, 7.2%, and 6.5%, respectively).
Tubaramure had a large positive effect on mother’s knowledge of appropriate feeding for sick children. The intervention increased the percentage of mothers aware of the need to increase breastfeeding for sick children under 6 months by 13–16 percentage points and for children 6–24 months by 13–15 percentage points (statistically significant in the T24, T18, and TNFP groups), resulting in fewer mothers reporting that a sick child should be fed less or the same (Table 48). Similarly, the intervention increased the percentage of mothers aware that a sick child 6–24 months of age should be provided more liquid by 7–13 percentage points (statistically significant in the T24 and T18 groups) and more solid food by 7–9 percentage points (statistically significant in the T18 group). The positive impact of the intervention on maternal knowledge of how to feed a child recovering from illness was smaller and generally did not reach statistical significance.
More than 95% of mothers knew that a baby should be breastfed immediately or very soon after birth and that a baby should be fed colostrum, both at baseline and follow-up (Table 49). Very few, however, knew that a malnourished mother is capable of producing enough milk to adequately feed her child (2.4% at baseline and 4.1% at follow-up). When asked about the benefits of exclusive breastfeeding, more than three-quarters of the mothers mentioned benefits related to child health and nutrition, and this increased from 77.1% to 82.4% from baseline to follow-up. Only around 2% mentioned lactational amenorrhea as a benefit of exclusive breastfeeding at both baseline and follow-up. Mothers stated that it was appropriate to stop breastfeeding at around 32 months of age at baseline and 34 months of age at follow-up, which meets the WHO recommendation for continued breastfeeding for the first 2 years of life or beyond. Only around 10% of the mothers knew that they could continue breastfeeding when pregnant again. Most mothers (62.1%) wrongly believed that if they are unable to breastfeed a child under 6 months of age that the child should be fed cow’s or goat’s milk; this belief differed among treatment arms and was more common in the T24 arm. Fewer than one-fifth suggested breast milk be fed to a child in the mother’s absence (data collected only at follow-up)
The program did not have a consistent significant impact on maternal breastfeeding knowledge (Table 50).

Strengthening and Evaluating the PM2A Approach – Burundi Follow-Up Report: Children 0–23 Months
70
Table 45. Knowledge of pregnancy and childhood illness danger signs among mothera
Baselineb Follow-upc
Full sample
Study arm Full sample
Study arm
T24 T18 TNFP Control T24 T18 TNFP Control
N 2622 432 870 433 887 2614 432 880 431 871
Danger signs of pregnancy; % who mentioned
Vaginal bleeding 27.2 25.8 28.1 24.9 28.2 38.7 41.2 39.4 35.5 38.3
Abdominal pain 48.2 45.7 49.4 52.1 46.3 39.0 44.7 36.3 41.1 38.0
Persistent back pain 13.6 16.1 15.3 14.6 10.3 6.7 8.4 4.8 8.8 6.7
Vaginal discharge 7.1* 3.8 7.3 9.6 7.1 5.2 4.2 5.8 6.0 4.6
Swollen hands/face 3.8 2.6 2.9 4.7 4.7 1.6 3.0 1.1 1.4 1.5
Severe headache/vision trouble 3.4 3.3 3.7 4.7 2.6 3.2 3.5 3.3 4.4 2.4
Regular contractions before 37 weeks 4.3 3.6 3.6 5.2 4.9 2.4 1.6 3.1 1.9 2.3
No fetal movement 2.0 2.2 1.5 2.7 2.0 48.7 51.5 50.2 51.0 44.5
At least two signs 58.7 53.1 60.6 65.0 56.4 48.3 51.5 47.8 50.8 46.0
Danger signs of childhood illness; % who mentioned
Cannot drink/breastfeed 25.6 29.6 24.9 27.9 23.1 30.7 28.9 30.8 29.7 31.9
Symptoms intensify 40.9 40.7 39.4 39.3 43.3 24.9 25.0 23.0 32.0 23.4
Fever 94.5 93.3 94.9 94.2 94.7 95.6 94.7 96.0 95.6 95.8
Rapid breathing 8.2 8.6 7.0 8.1 9.2 5.2 5.1 4.7 5.3 5.6
Difficulty breathing 9.5 10.9 9.2 11.8 8.1 6.4 7.9 5.7 6.5 6.4
Bloody stools 12.0 10.6 11.7 14.5 11.6 11.6 13.2 10.9 13.9 10.3
Difficulty swallowing 2.9 3.9 3.2 1.8 2.5 1.6 1.2 2.2 1.4 1.4
At least two signs 64.7 66.4 63.6 67.7 63.5 59.3 58.6 58.2 64.5 58.3 a Values are mean ± SD or %. All estimates account for clustering.
b Sample size at baseline ranged from N = 2518 to 2622 in the full sample; N = 416 to 432 in the T24 arm; N = 843 to 870 in the T18 arm; N = 415 to 433 in the TNFP arm; and N = 844 to 887 in the control arm. c Sample size at follow-up ranged from N = 2597 to 2614 in the full sample; N = 427 to 432 in the T24 arm; N = 874 to 880 in the T18 arm; and N = 865 to 871 in the control arm.
* Study arms differ, p < 0.05.

Strengthening and Evaluating the PM2A Approach – Burundi Follow-Up Report: Children 0–23 Months
71
Table 46. Knowledge of pregnancy and childhood danger signs among mothers: impacta
Impactb,c
T24 vs. control T18 vs. control TNFP vs. control
Danger signs of pregnancy; % who mentioned
Vaginal bleeding 6.33 ± 8.07 1.69 ± 8.99 0.91 ± 8.02
Abdominal pain 7.90 ± 6.01 −4.63 ± 6.32 −2.47 ± 6.83
Persistent back pain −3.98 ± 4.81 −6.92 ± 3.97 −2.29 ± 4.04
Vaginal discharge 2.93 ± 2.85 1.00 ± 2.45 −1.07 ± 2.80
Swollen hands/face 3.64 ± 1.52* 1.41 ± 1.26 −0.10 ± 1.43
Severe headache/vision trouble 0.30 ± 1.29 −0.23 ± 1.53 −0.11 ± 1.36
Regular contractions before 37 weeks 0.61 ± 1.90 1.92 ± 1.82 −0.94 ± 2.16
No fetal movement 7.01 ± 4.57 6.13 ± 4.08 5.72 ± 4.64
At least two signs 9.61 ± 8.67 −2.24 ± 8.46 −3.98 ± 10.27
Danger signs of childhood illness; % who mentioned
Cannot drink/breastfeed −9.27 ± 5.45 −2.88 ± 4.29 −6.39 ± 5.33
Symptoms intensify 4.52 ± 4.96 3.50 ± 4.81 12.23 ± 5.09*
Fever 0.44 ± 1.95 0.08 ± 1.11 0.50 ± 1.35
Rapid breathing 0.21 ± 2.02 1.30 ± 2.43 1.00 ± 2.74
Difficulty breathing −1.43 ± 2.53 −1.92 ± 2.13 −3.81 ± 2.97
Bloody stools 3.73 ± 4.26 0.35 ± 3.45 0.70 ± 4.84
Difficulty swallowing −1.72 ± 1.47 0.01 ± 1.40 0.61 ± 1.22
At least two signs −2.36 ± 5.53 −0.17 ± 6.09 2.32 ± 4.71
a Values are double difference impact estimates ± SE in percentage points. All estimates account for clustering.
b Sample size ranged from N = 5115 to 5236. c One-sided tests were conducted. The a priori hypothesis was a positive effect for all indicators.
* Impact estimate significantly different from 0, p < 0.05.

Strengthening and Evaluating the PM2A Approach – Burundi Follow-Up Report: Children 0–23 Months
72
Table 47. Knowledge of feeding practices for sick children among mothersa
Follow-upb
Full sample
Study arm
T24 T18 TNFP Control
N 2614 432 880 431 871
Feeding a sick child
Breastfeeding (< 6m)
Less 9.1 6.3 7.2 7.1 13.5
Same 21.4 17.3 19.2 19.8 26.4
More 69.0 75.9 73.3 72.4 59.7
Breastfeeding (6–23 m)
Less 10.1 7.9 7.7 10.0 13.7
Same 23.3 19.5 21.8 19.0 28.8
More 66.0 71.9 70.1 70.1 56.8
Providing liquids (6–23 m)
Less 21.1 17.6 21.7 20.4 22.6
Same 18.4 15.3 16.7 16.5 22.5
More 60.1 66.8 61.6 62.2 54.2
Providing solid foods (6–23 m)
Less 27.9 25.2 26.5 24.4 32.3
Same 24.3 25.5 21.7 26.2 25.4
More 47.4 48.8 51.4 49.0 41.9
Feeding a child recovering from illness
Breastfeeding (< 6m)
Less 1.5 1.4 1.8 1.2 1.5
Same 17.6 17.6 15.9 15.3 20.4
More 80.7 81.0 82.2 83.3 77.8
Breastfeeding (6–23 m)
Less 2.0 2.3 1.7 2.6 1.8
Same 17.3 16.7 15.9 15.8 19.6
More 80.6 80.8 82.3 81.7 78.2
Providing liquids (6–23 m)
Less 7.2 7.4 7.2 7.4 7.1
Same 18.6 19.2 18.2 14.8 20.4
More 74.0 73.4 74.7 76.8 72.2
Providing solid foods (6–23 m)
Less 6.5 5.6 6.5 6.5 7.0
Same 20.6 22.0 19.9 17.4 22.2
More 72.8 72.0 73.6 75.9 70.7 a Values are %. All estimates account for clustering. b Sample size ranged from N = 2591 to 2614 in the full sample; N = 428 to 432 in the T24 arm; N = 873 to 880 in the T18 arm; N = 424 to 431 in the TNFP arm; and N = 866 to 871 in the control arm.
* Study arms differ, p < 0.05.

Strengthening and Evaluating the PM2A Approach – Burundi Follow-Up Report: Children 0–23 Months
73
Table 48. Knowledge of feeding practices for sick children among mothers: impacta
Impactb
T24 vs. control T18 vs. control TNFP vs. control
Feeding a sick child Breastfeeding (< 6m)
Less −7.20 ± 2.93* −6.29 ± 2.73* −6.43 ± 2.92* Same −9.15 ± 2.85* −7.20 ± 2.13* −6.63 ± 3.15* More 16.23 ± 4.38* 13.61 ± 3.63* 12.71 ± 4.49*
Breastfeeding (6–23 m) Less −5.77 ± 2.95 −5.94 ± 2.87* −3.69 ± 2.90 Same −9.33 ± 3.59* −7.00 ± 2.30* −9.79 ± 2.83* More 15.09 ± 4.41* 13.28 ± 3.56* 13.24 ± 4.32*
Providing liquids (6–23 m) Less −4.98 ± 2.66 −0.91 ± 2.81 −2.20 ± 3.04 Same −7.19 ± 1.98* −5.80 ± 1.95* −6.03 ± 2.80* More 12.63 ± 3.87* 7.40 ± 3.24* 7.99 ± 4.00
Providing solid foods (6–23 m) Less −7.03 ± 3.13* −5.78 ± 2.61* −7.90 ± 3.79* Same 0.09 ± 2.88 −3.67 ± 1.87 0.84 ± 3.42 More 6.94 ± 4.30 9.46 ± 2.78* 7.05 ± 4.01
Feeding a child recovering from illness Breastfeeding (< 6m)
Less −0.11 ± 0.64 0.33 ± 0.77 −0.34 ± 0.92 Same −2.78 ± 2.59 −4.42 ± 2.20* −5.06 ± 2.41* More 3.23 ± 2.84 4.44 ± 2.19* 5.50 ± 3.02
Breastfeeding (6–23 m) Less 0.48 ± 0.85 −0.13 ± 0.87 0.72 ± 1.11 Same −2.97 ± 2.72 −3.71 ± 2.43 −3.86 ± 2.72 More 2.60 ± 2.99 4.07 ± 2.47 3.48 ± 2.66
Providing liquids (6–23 m) Less 0.29 ± 1.77 0.04 ± 1.65 0.31 ± 1.58 Same −1.22 ± 3.08 −2.25 ± 2.04 −5.59 ± 2.49* More 1.16 ± 3.39 2.44 ± 2.57 4.58 ± 3.12
Providing solid foods (6–23 m) Less −1.45 ± 1.75 −0.53 ± 1.83 −0.51 ± 1.61 Same −0.17 ± 3.31 −2.27 ± 2.48 −4.76 ± 3.01 More 1.27 ± 4.08 2.91 ± 3.24 5.15 ± 3.86
a Values are simple difference impact estimates ± SE in percentage points. All estimates account for clustering. b Sample size ranged from N = 2591 to 2614.
* Impact estimate significantly different from 0, p < 0.05.

Strengthening and Evaluating the PM2A Approach – Burundi Follow-Up Report: Children 0–23 Months
74
Table 49. Breastfeeding knowledge among mothersa
Baselineb Follow-upc
Full sample
Study arm Full sample
Study arm
T24 T18 TNFP Control T24 T18 TNFP Control
N 2620 432 869 433 887 2614 432 880 431 871
% who knew that
Baby should be breastfed immediately or during first hours after birth
95.2 95.1 94.6 97.0 94.9 95.5 95.4 96.5 97.0 93.8
Baby should be fed colostrum 97.8 98.8 98.0 97.0 97.6
Malnourished mother can produce enough good milk
2.4 2.3 2.2 3.0 2.5 4.1 7.0 3.9 1.9 4.1
% who mentioned relation of exclusive breastfeeding to:
Child health and nutrition 77.1 79.9 74.9 80.1 76.6 82.4* 85.6 83.9 83.5 78.8
Lactational amenorrhea 2.2 3.2 2.5 2.1 1.5 2.3* 1.6 2.8 4.2 1.0
Appropriate age to stop breastfeeding (months)
32.1 ± 7.5 31.0 ± 7.9 32.4 ± 7.1 31.7 ± 7.4 32.5 ± 7.5 33.7 ± 9.6* 33.4 ± 9.3 33.6 ± 9.4 31.9 ± 10.0 34.8 ± 9.5
Believe mother can continue breastfeeding when pregnant
10.5 12.0 9.9 10.3 10.6
If not with child < 6 months, what to feed; % mentioned:
Breast milk 18.4 20.6 17.7 22.5 15.8
Powdered milk 11.4 13.2 10.6 14.2 10.0
Baby formula 7.4 8.4 7.4 6.7 7.1
Cow’s or goat’s milk 62.1* 70.4 62.7 60.8 57.9
Nothing or does not know 16.1* 10.9 16.3 13.2 20.0 a Values are mean ± SD or %. All estimates account for clustering. b Sample size at baseline ranged from N = 2572 to 2622 in the full sample; N = 425 to 432 in the T24 arm; N = 849 to 870 in the T18 arm; N = 428 to 433 in the TNFP arm; and N = 870 to 887 in the control arm. c Sample size at follow-up ranged from N = 2582 to 2614 in the full sample; N = 425 to 432 in the T24 arm; N = 871 to 880 in the T18 arm; N = 426 to 431 in the TNFP arm; and N = 857 to 871 in the control arm.
* Study arms differ, p < 0.05.

Strengthening and Evaluating the PM2A Approach – Burundi Follow-Up Report: Children 0–23 Months
75
Table 50. Breastfeeding knowledge among mothers: impacta
Impactb,c
T24 vs. control T18 vs. control TNFP vs. control
% who knew that:
Baby should be breastfed immediately or during first hours after birth 1.46 ± 2.07 3.13 ± 2.45 1.18 ± 1.89
Baby should be fed colostrum 1.25 ± 0.78 0.37 ± 0.92 −0.61 ± 1.11
Malnourished mother can produce enough good milk 2.91 ± 2.09 −0.08 ± 1.19 −2.85 ± 1.61
% who mentioned relation of exclusive breastfeeding to:
Child health and nutrition 3.42 ± 5.11 6.63 ± 5.06 0.98 ± 5.04
Lactational amenorrhea −1.15 ± 1.60 0.75 ± 1.37 2.54 ± 1.35*
Appropriate age to stop breastfeeding (months) 0.18 ± 0.94 −1.10 ± 0.76 −2.09 ± 1.01*
Believe mother can continue breastfeeding when pregnant 1.38 ± 2.32 −0.74 ± 1.91 −0.36 ± 1.63
If not with child < 6 months, what to feed; % mentioned:
Breast milk 4.76 ± 4.89 1.88 ± 2.24 6.66 ± 2.80*
Powdered milk 3.19 ± 3.69 0.60 ± 3.28 4.15 ± 3.72
Baby formula 1.23 ± 2.14 0.29 ± 1.73 −0.40 ± 1.98
Cow’s or goat’s milk 12.44 ± 4.51* 4.78 ± 4.34 2.86 ± 5.97 a Values are double difference impact estimates ± SE in percentage points when data from both surveys were available and simple difference impact estimates ± SE when only follow-up data were
available. All estimates account for clustering. b Sample size ranged from N = 2582 to 5233. c One-sided tests were conducted. The a priori hypothesis was a positive effect for all indicators.
* Impact estimate significantly different from 0, p < 0.05.
Strengthening and Evaluating the PM2A Approach – Burundi Follow-Up Report: Children 0–23 Months
76
The majority of mothers were aware of the importance of a sufficient quantity of food to prevent malnutrition among children (75.1% at baseline and 69.9% at follow-up) (Table 51). Fewer mothers were familiar with the importance of dietary quality (around 39% in both surveys) or the contribution of illness (approximately one-third and one-fourth at baseline and at follow-up, respectively). When asked about foods essential for child growth, no more than 60% of mothers at baseline or follow-up mentioned any animal-source foods (such as meat, dairy, and eggs). The most commonly mentioned foods essential for children’s growth were vegetables (77.8% at baseline and 85.5% at follow-up), cereals (50.9 % and 40.2%), beans (49.3% and 59.8%), and fruits (44.7% and 48.5%). Micronutrient knowledge was limited in both surveys, with fewer than 40% of women identifying yellow- or orange-colored fruits or vegetables as vitamin A-rich foods and fewer than 15% mentioning animal-source foods in both surveys. Only green leafy vegetables were mentioned by more than half of mothers (57.3% at baseline and 59.9% at follow-up). A little more than half of the mothers were aware that vitamin A deficiency could cause poor immunity in children, whereas only 5.2% were aware that vitamin A deficiency could have vision-related consequences (data collected only in the follow-up survey). For iron-rich foods, mothers primarily identified green leafy vegetables (93.8%); fewer than half mentioned animal-source foods (45.9%), and fewer than 1 in 10 mentioned special baby foods or CSB (data collected only at follow-up). Knowledge of the iron-rich characteristics of special baby foods and CSB differed among groups and was more common in treatment arms. At baseline, around 60% of mothers thought that iron deficiency could cause poor immunity, and a similar percentage knew that it could delay development. These percentages did not fundamentally change at follow-up. Other key consequences of iron deficiency (such as weakness and fatigue) were mentioned by fewer than 30% of mothers in both surveys.
The intervention had no clear impact on the percentage of mothers who knew the reasons for child malnutrition or the foods essential for child growth (Table 52). The program had a significant impact (11–15 percentage points) on the percentage of mothers identifying yellow- and orange-colored fruits and vegetables as rich in vitamin A (statistically significant in all groups). A similar significant program effect (14–20 percentage points) was found for the percentage mentioning green leafy vegetables. The intervention did not, however, change the percentage of mothers who knew the consequences of vitamin A deficiency. A similar picture was found for iron deficiency. The program clearly increased awareness of iron-rich foods, with estimated program impacts of 2–8 percentage points on the percentage of mothers mentioning special baby foods, CSB, and green leafy vegetables as rich in iron (statistically significant in all cases, with the exception of green leafy vegetables among the T18 group). Tubaramure had a modest (1–2 percentage points) impact on the percentage of mothers mentioning delayed education/schooling as a consequence of iron deficiency (significant in the T24 and T18 groups). No observable impact was found on knowledge of other key consequences, such as child development, fatigue, or weakness. Interestingly, positive impact estimates (3–12 percentage points, statistically significant for the TNFP group) were found for the percentage of mothers mentioning poor immunity, even though this is not a well-established consequence of iron deficiency.
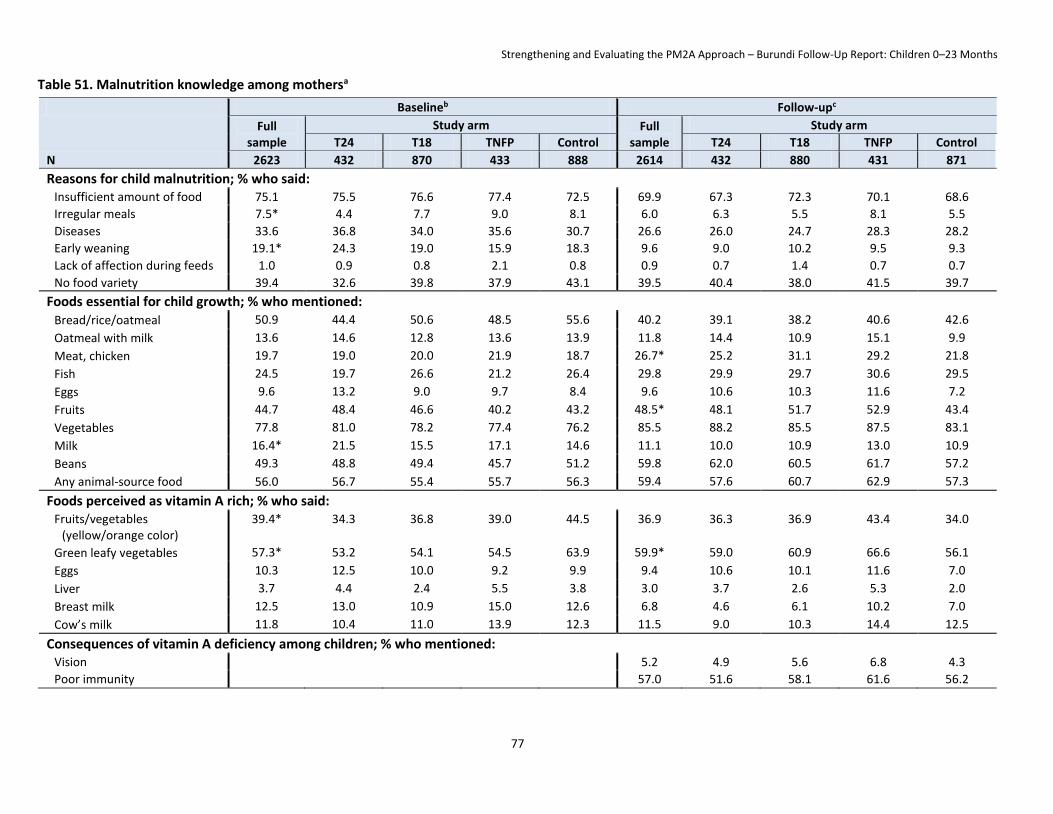
Strengthening and Evaluating the PM2A Approach – Burundi Follow-Up Report: Children 0–23 Months
77
Table 51. Malnutrition knowledge among mothersa
Baselineb Follow-upc
Full sample
Study arm Full sample
Study arm
T24 T18 TNFP Control T24 T18 TNFP Control
N 2623 432 870 433 888 2614 432 880 431 871
Reasons for child malnutrition; % who said: Insufficient amount of food 75.1 75.5 76.6 77.4 72.5 69.9 67.3 72.3 70.1 68.6
Irregular meals 7.5* 4.4 7.7 9.0 8.1 6.0 6.3 5.5 8.1 5.5
Diseases 33.6 36.8 34.0 35.6 30.7 26.6 26.0 24.7 28.3 28.2
Early weaning 19.1* 24.3 19.0 15.9 18.3 9.6 9.0 10.2 9.5 9.3
Lack of affection during feeds 1.0 0.9 0.8 2.1 0.8 0.9 0.7 1.4 0.7 0.7
No food variety 39.4 32.6 39.8 37.9 43.1 39.5 40.4 38.0 41.5 39.7
Foods essential for child growth; % who mentioned: Bread/rice/oatmeal 50.9 44.4 50.6 48.5 55.6 40.2 39.1 38.2 40.6 42.6
Oatmeal with milk 13.6 14.6 12.8 13.6 13.9 11.8 14.4 10.9 15.1 9.9
Meat, chicken 19.7 19.0 20.0 21.9 18.7 26.7* 25.2 31.1 29.2 21.8
Fish 24.5 19.7 26.6 21.2 26.4 29.8 29.9 29.7 30.6 29.5
Eggs 9.6 13.2 9.0 9.7 8.4 9.6 10.6 10.3 11.6 7.2
Fruits 44.7 48.4 46.6 40.2 43.2 48.5* 48.1 51.7 52.9 43.4
Vegetables 77.8 81.0 78.2 77.4 76.2 85.5 88.2 85.5 87.5 83.1
Milk 16.4* 21.5 15.5 17.1 14.6 11.1 10.0 10.9 13.0 10.9
Beans 49.3 48.8 49.4 45.7 51.2 59.8 62.0 60.5 61.7 57.2
Any animal-source food 56.0 56.7 55.4 55.7 56.3 59.4 57.6 60.7 62.9 57.3
Foods perceived as vitamin A rich; % who said: Fruits/vegetables
(yellow/orange color) 39.4* 34.3 36.8 39.0 44.5 36.9 36.3 36.9 43.4 34.0
Green leafy vegetables 57.3* 53.2 54.1 54.5 63.9 59.9* 59.0 60.9 66.6 56.1
Eggs 10.3 12.5 10.0 9.2 9.9 9.4 10.6 10.1 11.6 7.0
Liver 3.7 4.4 2.4 5.5 3.8 3.0 3.7 2.6 5.3 2.0
Breast milk 12.5 13.0 10.9 15.0 12.6 6.8 4.6 6.1 10.2 7.0
Cow’s milk 11.8 10.4 11.0 13.9 12.3 11.5 9.0 10.3 14.4 12.5
Consequences of vitamin A deficiency among children; % who mentioned: Vision 5.2 4.9 5.6 6.8 4.3
Poor immunity 57.0 51.6 58.1 61.6 56.2

Strengthening and Evaluating the PM2A Approach – Burundi Follow-Up Report: Children 0–23 Months
78
N
bBaseline cFollow-up
Full sample
Study arm Full sample
Study arm
T24 T18 TNFP Control T24 T18 TNFP Control
2623 432 870 433 888 2614 432 880 431 871
Foods perceived as iron rich; % who said: Meat 45.9 50.9 46.0 46.2 43.1
Special baby food 2.7* 3.7 3.1 3.7 1.3
CSB 8.3* 10.6 8.5 12.8 4.7
Green leafy vegetables 93.8 96.5 94.1 94.9 91.6
Consequences of iron-deficiency among children; % who said Difficulty in school 1.5 0.7 1.3 2.1 1.9 1.0* 1.2 1.3 1.6 0.3
Altered development 57.6* 63.9 51.7 62.4 57.9 53.1 51.6 51.2 59.6 52.4
Slow growth 17.9 19.0 17.1 17.3 18.4 16.4 18.8 15.2 17.9 15.6
Poor immunity 58.9 62.3 58.8 54.0 59.7 65.3 70.6 64.5 68.0 62.2
Fatigue 11.6 9.0 11.3 12.9 12.6 3.6 4.6 2.8 4.4 3.4
Weakness 27.5 25.5 27.0 30.0 27.7 13.8 17.1 12.7 14.2 13.1 a Values are %. All estimates account for clustering. b Sample size at baseline ranged from N = 2620 to 2622 in the full sample; N = 869 to 870 in the T18 arm; and N = 886 to 888 in the control arm. c Sample size at follow-up ranged from N = 2589 to 2614 in the full sample; N = 426 to 432 in the T24 arm; N = 875 to 880 in the T18 arm; N = 425 to 431 in the TNFP arm; and N = 863 to 871 in the control arm.
* Study arms differ, p < 0.05.

Strengthening and Evaluating the PM2A Approach – Burundi Follow-Up Report: Children 0–23 Months
79
Table 52. Malnutrition knowledge among mothers: impacta
Impactb,c
T24 vs. control T18 vs. control TNFP vs. control
Reasons for child malnutrition; % who said:
Insufficient amount of food −4.24 ± 5.20 −0.40 ± 4.60 −3.13 ± 4.26
Irregular meals 4.47 ± 2.58* 0.31 ± 3.43 1.36 ± 3.47
Diseases −8.29 ± 4.49 −7.23 ± 4.09 −5.36 ± 4.79
Early weaning −6.40 ± 3.54 0.08 ± 3.13 2.53 ± 3.65
Lack of affection during feeds −0.17 ± 0.82 0.66 ± 0.68 −1.33 ± 0.89
No food variety 11.25 ± 5.74* 1.54 ± 4.69 6.64 ± 5.28
Foods essential for child growth; % who said:
Bread, rice, oatmeal 7.64 ± 4.96 0.55 ± 4.39 4.42 ± 6.26
Oatmeal with milk 3.62 ± 3.62 2.07 ± 4.11 5.64 ± 3.61
Meat, chicken 3.02 ± 2.87 7.75 ± 3.37* 3.51 ± 4.58
Fish 7.86 ± 3.72* 0.50 ± 4.15 6.89 ± 4.00*
Eggs −1.31 ± 2.46 2.65 ± 1.89 3.19 ± 3.66
Fruits −0.34 ± 5.21 5.25 ± 4.82 12.18 ± 3.99*
Vegetables 0.24 ± 3.50 0.32 ± 3.81 2.76 ± 3.57
Milk −8.10 ± 2.69 −1.22 ± 3.28 −0.70 ± 3.89
Beans 7.87 ± 4.72 5.16 ± 4.13 10.06 ± 4.92*
Any animal-source food 0.28 ± 4.29 4.33 ± 5.14 6.64 ± 5.70
Foods perceived as vitamin A rich; % who said:
Fruits/vegetables (yellow/orange color) 12.64 ± 5.74* 10.85 ± 5.34* 14.53 ± 5.74*
Green leafy vegetables 13.71 ± 5.53* 14.71 ± 4.40* 19.78 ± 4.63*
Eggs 1.16 ± 3.55 2.91 ± 3.01 5.21 ± 4.35
Liver 0.97 ± 1.91 1.80 ± 1.45 1.27 ± 2.42
Breast milk −2.81 ± 3.66 0.80 ± 3.65 0.70 ± 4.07
Cow’s milk −1.78 ± 3.85 −1.10 ± 3.52 0.10 ± 4.58
Consequences of vitamin A deficiency among children; % who said:
Vision 0.65 ± 1.58 1.31 ± 1.11 2.54 ± 2.11
Poor immunity −4.56 ± 5.39 1.86 ± 3.53 5.45 ± 4.57

Strengthening and Evaluating the PM2A Approach – Burundi Follow-Up Report: Children 0–23 Months
80
Impactb,c
T24 vs. control T18 vs. control TNFP vs. control
Foods perceived as iron-rich; % who said:
Meat 5.25 ± 4.00 4.35 ± 2.87 3.19 ± 3.45
Special baby food 2.44 ± 0.86* 1.80 ± 0.80* 2.45 ± 1.43*
CSB 5.94 ± 2.44* 3.81 ± 1.28* 8.05 ± 1.66*
Green leafy vegetables 4.92 ± 1.79* 2.48 ± 2.09 3.29 ± 1.85*
Consequences of iron-deficiency among children; % who said:
Delays studies 2.03 ± 0.92* 1.54 ± 0.79* 1.13 ± 1.15
Delays development −6.57 ± 5.83 5.10 ± 4.52 2.49 ± 5.37
Slow growth 2.91 ± 4.18 0.82 ± 4.17 3.47 ± 3.15
Poor immunity 6.47 ± 5.66 3.26 ± 4.87 11.56 ± 3.68*
Fatigue 4.67 ± 2.35* 0.65 ± 2.09 0.49 ± 3.32
Weakness 5.94 ± 4.47 −0.07 ± 5.45 −1.87 ± 4.16 a Values are double difference impact estimates ± SE in percentage points when data from both surveys were available and simple difference impact estimates ± SE when only follow-up data were
available. All estimates account for clustering. b Sample size ranged from N = 2589 to 5235. c One-sided tests were conducted. The a priori hypothesis was a positive effect for all indicators.
* Impact estimate significantly different from 0, p < 0.05.
Strengthening and Evaluating the PM2A Approach – Burundi Follow-Up Report: Children 0–23 Months
81
Knowledge related to adequate complementary feeding practices was limited. At baseline, around 63% of mothers knew that 6 months is the correct age to introduce foods and liquids other than breast milk. At follow-up (when questions were asked separately for liquids and foods), around 60% mentioned 6 months as the appropriate age for liquids and around 30% believed it was later. The percentage knowing the correct age was considerably lower for the introduction of foods (44.9%), and more than half of the mothers wrongly responded that foods should be introduced after 6 months of age.
At follow-up, around 30% of the mothers erroneously believed that the appropriate food consistency for children 6–8 months of age should be liquid like water (question not asked at baseline) (Table 53). For children 12–23 months, nearly all mothers (99.1%) reported that the food should be either thick like a paste or semi-solid like a puree.
When asked about the number of times a child 6–8 months of age should be fed solid (i.e., complementary) foods, the average reported minimum frequency was 2.6 times per day at baseline and 2.9 times per day at follow-up. When compared to the WHO guidelines of at least twice daily for this age group, the majority of mothers (92.9% at baseline and 96.2% at follow-up) knew the minimum frequency; however, when compared to the Tubaramure guidelines of thrice daily, 52.7% of mothers at baseline and 71.5% at follow-up stated the minimum frequency. Knowledge of the correct feeding frequency for children 12–23 months of age was considerably lower. Mothers reported an average minimum of 2.9 meals daily at baseline and 3.0 at follow-up. Compared to the WHO guidelines of at least 3 meals per day for this age group, 70.5% of mothers at baseline and 79.5% at follow-up stated at least the minimum frequency. However, the percentage who knew the Tubaramure recommended frequency of at least four meals per day was considerably lower, with 13.8% and 20.6% at baseline and follow-up, respectively. At follow-up, almost all (98.3%) knew that a child 6–8 months of age cannot always eat without help (question not asked at baseline), whereas only 70.1% knew this for children 12–23 months of age.
Tubaramure significantly reduced the percentage of mothers who thought that liquids other than breast milk can be introduced before 6 months of age (6–9 percentage points, statistically significant in all groups) (Table 54). The program had a similar but smaller effect on the percentage who thought that foods can be introduced before 6 months of age (2–3 percentage points, statistically significant in all groups). Tubaramure significantly increased the percentage of mothers who thought that liquids should be introduced after 6 months of age in the T24 and TNFP groups (no effect in the T18 group). Importantly, the program did not reduce the percentage of mothers who wrongly believed that complementary foods should be introduced after 6 months of age.
Tubaramure consistently decreased the percentage of mothers who believed that foods for children 6–8 months of age should be liquid, like water (2–5 percentage points), but it did not reach statistical significance for any group. Tubaramure increased the percentage of mothers who knew the Tubaramure-recommended feeding frequency for children 6–8 months by 4–19 percentage points (significant in the T18 and TNFP groups). It also increased the percentage of mothers who knew the WHO-recommended frequency for children 12–23 months (4–9 percentage points, significant in the T18 and TNFP groups) and the Tubaramure-recommended frequency for this age group (5–7 percentage points, significant in the T18 group).

Strengthening and Evaluating the PM2A Approach – Burundi Follow-Up Report: Children 0–23 Months
82
Table 53. Complementary feeding knowledge among mothersa
Baselineb Follow-upc
Full sample
Study arm Full sample
Study arm
T24 T18 TNFP Control T24 T18 TNFP Control
N 2621 432 869 433 887 2613 432 880 431 871
Age of introduction of food/liquids other than breast milk; % who said Before 6 months 16.5 16.4 18.6 13.2 16.0 At 6 months 63.1 60.9 61.8 65.6 64.3 After 6 months 19.9 22.5 19.1 20.8 18.9 Does not know 0.5 0.2 0.5 0.5 0.8
Age of introduction of liquids other than breast milk; % who said Before 6 months 13.3 9.0 11.7 11.8 17.8 At 6 months 57.6 52.2 62.7 55.7 56.1 After 6 months 28.3 38.1 25.0 32.0 24.9 Does not know 0.8* 0.7 0.6 0.5 1.1
Age of introduction of foods other than breast milk; % who said Before 6 months 2.1 1.4 1.6 0.9 3.6 At 6 months 44.9 37.5 49.8 45.3 43.4 After 6 months 52.9 61.1 48.6 53.5 52.7 Does not know 0.2 0.0 0.0 0.2 0.3
Food consistency for child 6–8 months Thick like a paste 2.1 1.6 1.8 2.3 2.4 Liquid like water 29.3 27.1 27.8 29.6 31.8 Semi-solid like puree 68.6 71.3 70.4 68.1 65.8
Food consistency for child 12–23 months Thick like a paste 50.9 48.6 48.0 49.0 55.9 Liquid like water 0.9 1.6 0.7 0.2 1.2 Semi-solid like puree 48.2 49.8 51.3 50.8 43.0
Feeding frequency for child 6–8 months Number of meals per day 2.6 ± 0.8* 2.8 ± 0.8 2.6 ± 0.7 2.5 ± 0.8 2.5 ± 0.8 2.9 ± 0.8* 3.0 ± 0.8 2.9 ± 0.8 3.0 ± 0.8 2.7 ± 0.7 Correct feeding frequency (WHO ≥ 2 meals/day) 92.9 95.6 93.8 93.1 90.6 96.2 98.1 96.8 97.0 94.2 Correct feeding frequency (Tubaramure ≥ 3 meals/day)
52.7 62.4 52.6 49.5 49.6 71.5* 77.7 74.1 80.0 61.5
Feeding frequency for child 12–23 months Number of meals per day 2.9 ± 1.0 2.9 ± 0.7 2.9 ± 0.8 2.8 ± 0.8 2.8 ± 1.3 3.0 ± 0.8 3.1 ± 0.8 3.1 ± 0.8 3.1 ± 0.9 2.9 ± 1.0 Correct feeding frequency (WHO ≥ 3 meals/day) 70.5 75.0 70.5 68.0 69.5 79.5 82.4 82.5 81.6 74.1 Correct feeding frequency (Tubaramure ≥ 4 meals/day)
13.8 16.2 14.6 13.5 11.9 20.6* 23.6 23.8 23.5 14.6
Knows that child cannot always eat without help 6–8 months 98.3 98.4 98.3 97.9 98.4 12–23 months 70.1 71.8 72.0 72.9 66.1
a Values are mean ± SD or %. All estimates account for clustering. b Sample size at baseline ranged from N = 2582 to 2621 in the full sample; N = 425 to 432 in the T24 arm; N = 855 to 869 in the T18 arm; N = 430 to 433 in the TNFP arm; and N = 871 to 887 in the control arm. c Sample size at follow-up ranged from N = 2592 to 2613 in the full sample; N = 430 to 432 in the T24 arm; N = 876 to 880 in the T18 arm; N = 426 to 431 in the TNFP arm; and N = 860 to 871 in the control arm.
* Study arms differ, p < 0.05.

Strengthening and Evaluating the PM2A Approach – Burundi Follow-Up Report: Children 0–23 Months
83
Table 54. Complementary feeding knowledge among mothers: impacta
Impactb,c
T24 vs. control T18 vs. control TNFP vs. control
Age of introduction of liquids other than breast milk; % who said
Before 6 months −8.75 ± 2.14* −6.09 ± 1.99* −5.96 ± 2.69*
At 6 months −3.94 ± 4.50 6.58 ± 2.93* −0.46 ± 4.21
After 6 months 13.14 ± 4.89* 0.09 ± 3.30 7.10 ± 3.50*
Does not know −0.45 ± 0.52 −0.58 ± 0.45 −0.68 ± 0.46
Age of introduction of foods other than breast milk; % who said
Before 6 months −2.17 ± 0.85* −1.97 ± 0.72* −2.63 ± 0.75*
At 6 months −5.90 ± 5.77 6.37 ± 5.32 1.95 ± 5.14
After 6 months 8.41 ± 5.76 −4.06 ± 5.37 0.79 ± 5.33
Does not know −0.34 ± 0.20 −0.34 ± 0.20 −0.11 ± 0.31
Food consistency for child 6–8 months
Thick like a paste −0.79 ± 0.90 −0.60 ± 0.70 −0.11 ± 0.86
Liquid like water −4.73 ± 2.90 −4.03 ± 3.18 −2.18 ± 3.56
Semi-solid like puree 5.52 ± 3.07 4.64 ± 3.24 2.29 ± 3.87
Food consistency for child 12–23 months
Thick like a paste −7.26 ± 5.73 −7.87 ± 4.58 −6.92 ± 4.48
Liquid like water 0.47 ± 0.70 −0.47 ± 0.51 −0.92 ± 0.45*
Semi-solid like puree 6.80 ± 5.80 8.34 ± 4.65 7.84 ± 4.58
Feeding frequency for child 6–8 months
Number of meals per day 0.05 ± 0.07 0.19 ± 0.07* 0.32 ± 0.06*
Correct feeding frequency (WHO ≥ 2 meals/day) −0.56 ± 1.93 −0.30 ± 1.57 0.42 ± 1.88
Correct feeding frequency (Tubaramure ≥ 3 meals/day) 4.06 ± 4.48 9.80 ± 4.45* 18.74 ± 5.29*
Feeding frequency for child 12–23 months
Number of meals per day 0.11 ± 0.10 0.16 ± 0.10 0.25 ± 0.12*
Correct feeding frequency (WHO ≥ 3 meals/day) 3.58 ± 3.71 7.78 ± 3.79* 8.72 ± 4.43*
Correct feeding frequency (Tubaramure ≥ 4 meals/day) 4.84 ± 3.88 6.38 ± 3.67* 7.20 ± 5.07
Knows that child cannot always eat without help
6 to 8 months −0.01 ± 0.70 −0.10 ± 0.62 −0.48 ± 0.81
12 to 23 months 5.67 ± 4.88 5.89 ± 3.43* 6.76 ± 4.16
a Values are double difference impact estimates ± SE in percentage points when data from both surveys were available and simple difference impact estimates ± SE when only follow-up data were
available. All estimates account for clustering. b Sample size ranged from N = 2588 to 5228. c One-sided tests were conducted. The a priori hypothesis was a positive effect for “knows correct feeding frequency according to WHO,” “knows correct feeding frequency according to Tubaramure,”
and “knows that child cannot always eat without help.”
* Impact estimate significantly different from 0, p < 0.05.

Strengthening and Evaluating the PM2A Approach – Burundi Follow-Up Report: Children 0–23 Months
84
Even though nearly all mothers knew that soap is needed for handwashing, the importance of washing hands in relation to different activities was not well understood (Table 55). The majority of mothers correctly stated that it was important to wash one’s hands before eating (95.4% at baseline and 90.7% at follow-up). At baseline, fewer than half (42.1%) mentioned that hands should be washed before feeding a child; this percent increased slightly at follow-up (47.9%). The percentage who mentioned washing hands after using the toilet increased from 45.7% at baseline to 62.4% at follow-up, but only around 20% in both surveys mentioned washing hands after cleaning a child who had defecated. The average number of specific activities mentioned as key times for handwashing was 2.0 at baseline and 2.2 at follow-up, and, at follow-up, the number of practices mentioned differed significantly among treatment arms.
Nearly all mothers in both surveys mentioned using soap to wash their hands. Very few (2.4%) mentioned using ash to wash their hands at baseline, and 10.8% mentioned using ash at follow-up. The use of ash when soap was not available was included in the BCC lessons. The most commonly known strategies to prevent worms were washing the child’s hands (around 65% in both surveys) and careful food preparation (around 30% in both surveys). When asked about how to purify drinking water, the majority of mothers (67.8% at baseline and 77.0% at follow-up) mentioned at least one correct method of water purification.
The Tubaramure intervention had a large positive effect on maternal knowledge of appropriate times for handwashing (Table 56). The percentage of mothers who mentioned several of the specific activities increased: after toilet use by 16–21 percentage points (statistically significant in the T24, T18, and TNFP groups), before feeding a child by 5–14 percentage points (statistically significant in the T18 and TNFP groups), and after cleaning a child who defecated by 1–10 percentage points (statistically significant in the TNFP group). Tubaramure also led to a small (0.23–0.37) but significant increase in the number of practices mentioned (statistically significant in the T24, T18, and TNFP groups). The program increased the percentage of mothers naming ash as an appropriate handwashing product from baseline to follow-up by 7–13 percentage points (statistically significant in the T24, T18, and TNFP groups). The program had no clear effect on maternal awareness of appropriate worm-protection methods, and no significant effect was observed on knowledge of appropriate methods for purifying drinking water.
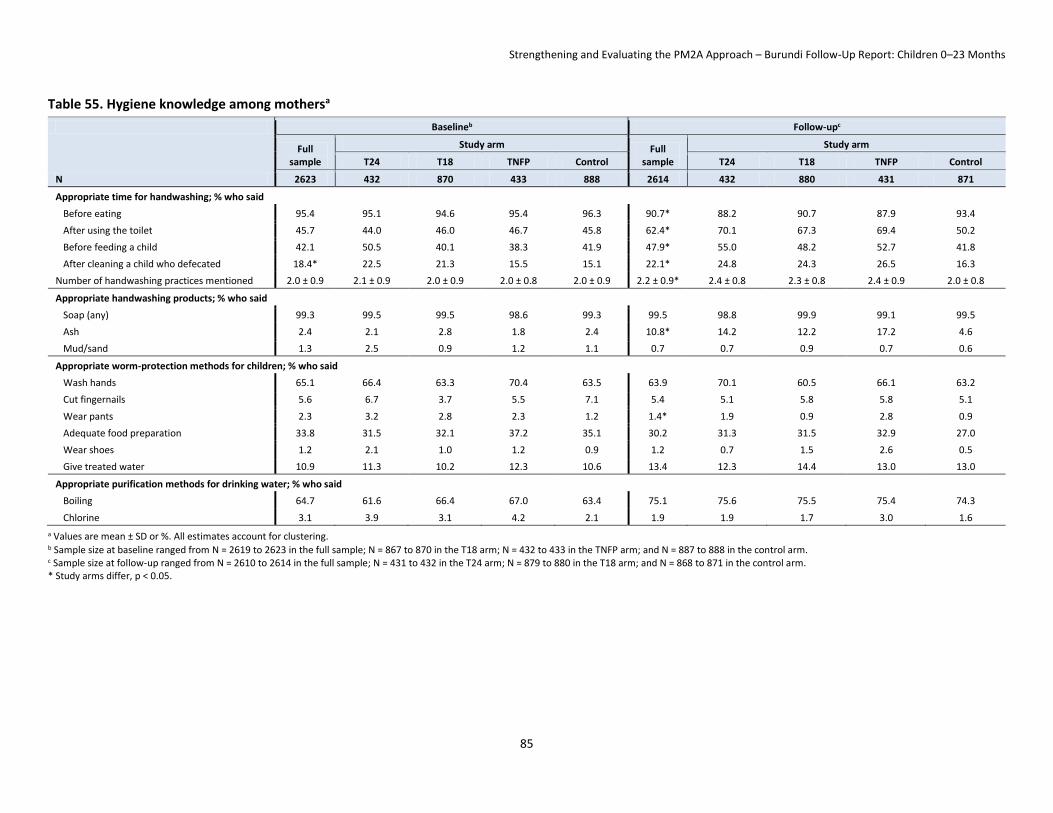
Strengthening and Evaluating the PM2A Approach – Burundi Follow-Up Report: Children 0–23 Months
85
Table 55. Hygiene knowledge among mothersa
a Values are mean ± SD or %. All estimates account for clustering. b Sample size at baseline ranged from N = 2619 to 2623 in the full sample; N = 867 to 870 in the T18 arm; N = 432 to 433 in the TNFP arm; and N = 887 to 888 in the control arm. c Sample size at follow-up ranged from N = 2610 to 2614 in the full sample; N = 431 to 432 in the T24 arm; N = 879 to 880 in the T18 arm; and N = 868 to 871 in the control arm. * Study arms differ, p < 0.05.
Baselineb Follow-upc
Full sample
Study arm Full sample
Study arm
T24 T18 TNFP Control T24 T18 TNFP Control
N 2623 432 870 433 888 2614 432 880 431 871
Appropriate time for handwashing; % who said
Before eating 95.4 95.1 94.6 95.4 96.3 90.7* 88.2 90.7 87.9 93.4
After using the toilet 45.7 44.0 46.0 46.7 45.8 62.4* 70.1 67.3 69.4 50.2
Before feeding a child 42.1 50.5 40.1 38.3 41.9 47.9* 55.0 48.2 52.7 41.8
After cleaning a child who defecated 18.4* 22.5 21.3 15.5 15.1 22.1* 24.8 24.3 26.5 16.3
Number of handwashing practices mentioned 2.0 ± 0.9 2.1 ± 0.9 2.0 ± 0.9 2.0 ± 0.8 2.0 ± 0.9 2.2 ± 0.9* 2.4 ± 0.8 2.3 ± 0.8 2.4 ± 0.9 2.0 ± 0.8
Appropriate handwashing products; % who said
Soap (any) 99.3 99.5 99.5 98.6 99.3 99.5 98.8 99.9 99.1 99.5
Ash 2.4 2.1 2.8 1.8 2.4 10.8* 14.2 12.2 17.2 4.6
Mud/sand 1.3 2.5 0.9 1.2 1.1 0.7 0.7 0.9 0.7 0.6
Appropriate worm-protection methods for children; % who said
Wash hands 65.1 66.4 63.3 70.4 63.5 63.9 70.1 60.5 66.1 63.2
Cut fingernails 5.6 6.7 3.7 5.5 7.1 5.4 5.1 5.8 5.8 5.1
Wear pants 2.3 3.2 2.8 2.3 1.2 1.4* 1.9 0.9 2.8 0.9
Adequate food preparation 33.8 31.5 32.1 37.2 35.1 30.2 31.3 31.5 32.9 27.0
Wear shoes 1.2 2.1 1.0 1.2 0.9 1.2 0.7 1.5 2.6 0.5
Give treated water 10.9 11.3 10.2 12.3 10.6 13.4 12.3 14.4 13.0 13.0
Appropriate purification methods for drinking water; % who said
Boiling 64.7 61.6 66.4 67.0 63.4 75.1 75.6 75.5 75.4 74.3
Chlorine 3.1 3.9 3.1 4.2 2.1 1.9 1.9 1.7 3.0 1.6
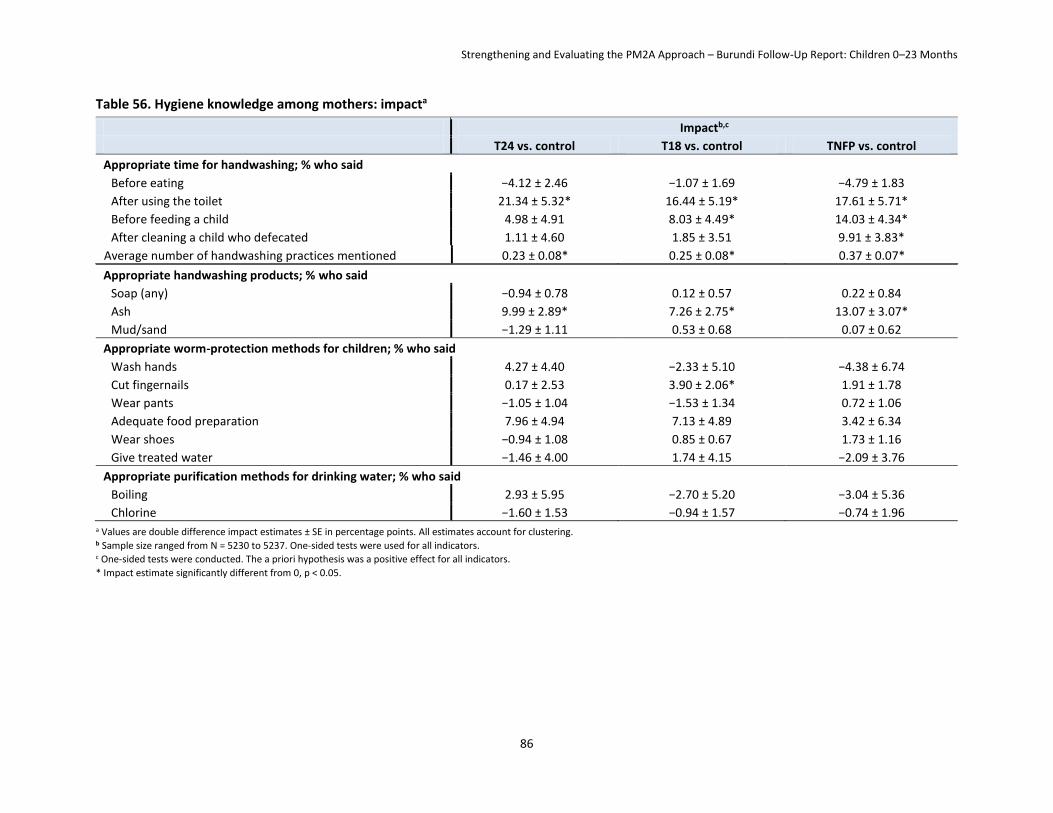
Strengthening and Evaluating the PM2A Approach – Burundi Follow-Up Report: Children 0–23 Months
86
Table 56. Hygiene knowledge among mothers: impacta
Impactb,c
T24 vs. control T18 vs. control TNFP vs. control
Appropriate time for handwashing; % who said
Before eating −4.12 ± 2.46 −1.07 ± 1.69 −4.79 ± 1.83
After using the toilet 21.34 ± 5.32* 16.44 ± 5.19* 17.61 ± 5.71*
Before feeding a child 4.98 ± 4.91 8.03 ± 4.49* 14.03 ± 4.34*
After cleaning a child who defecated 1.11 ± 4.60 1.85 ± 3.51 9.91 ± 3.83*
Average number of handwashing practices mentioned 0.23 ± 0.08* 0.25 ± 0.08* 0.37 ± 0.07*
Appropriate handwashing products; % who said
Soap (any) −0.94 ± 0.78 0.12 ± 0.57 0.22 ± 0.84
Ash 9.99 ± 2.89* 7.26 ± 2.75* 13.07 ± 3.07*
Mud/sand −1.29 ± 1.11 0.53 ± 0.68 0.07 ± 0.62
Appropriate worm-protection methods for children; % who said
Wash hands 4.27 ± 4.40 −2.33 ± 5.10 −4.38 ± 6.74
Cut fingernails 0.17 ± 2.53 3.90 ± 2.06* 1.91 ± 1.78
Wear pants −1.05 ± 1.04 −1.53 ± 1.34 0.72 ± 1.06
Adequate food preparation 7.96 ± 4.94 7.13 ± 4.89 3.42 ± 6.34
Wear shoes −0.94 ± 1.08 0.85 ± 0.67 1.73 ± 1.16
Give treated water −1.46 ± 4.00 1.74 ± 4.15 −2.09 ± 3.76
Appropriate purification methods for drinking water; % who said
Boiling 2.93 ± 5.95 −2.70 ± 5.20 −3.04 ± 5.36
Chlorine −1.60 ± 1.53 −0.94 ± 1.57 −0.74 ± 1.96 a Values are double difference impact estimates ± SE in percentage points. All estimates account for clustering. b Sample size ranged from N = 5230 to 5237. One-sided tests were used for all indicators. c One-sided tests were conducted. The a priori hypothesis was a positive effect for all indicators.
* Impact estimate significantly different from 0, p < 0.05.

Strengthening and Evaluating the PM2A Approach – Burundi Follow-Up Report: Children 0–23 Months
87
9.2 Pre-, Peri-, and Postnatal Health Care Practices The use of at least some prenatal services with a trained medical provider was nearly universal, but the quality of the care received could be improved (Table 57). The average number of prenatal visits increased from 3.2 at baseline (with 35.4% having received at least four recommended visits) to 3.7 at follow-up (56.3 % with at least four visits). On average, mothers at follow-up reported that their first prenatal visit when pregnant with the index child occurred earlier (4.3 months of pregnancy) than at baseline (5.1 months). Whereas regular weighing of pregnant women (around 95% in both surveys) and the provision of tetanus vaccines (almost two-thirds) were common, the provision of other prenatal services was not. Only about 40% had their blood pressure taken at both surveys. At baseline, fewer than 40% received a blood test; this percentage increased to two-thirds at follow-up. Very few (13.1% at baseline and 15.4% at follow-up) provided a urine sample. About one-third of women at baseline and one-fourth at follow-up were told where to seek help in case of pregnancy complications, but no more than one-fifth were told how to identify pregnancy danger signs.
At baseline, the use of a few key preventive measures during pregnancy, including sleeping under bednets (58.1%) and consuming iron supplements (72.1%), were reportedly practiced by the majority of mothers. The percentage of women who reported having taken iron supplements during pregnancy dropped dramatically to 56.0% at follow-up. At both time points, women began taking the supplements only toward the end of the second trimester (at 5.2–5.6 months, near the average time of the first prenatal visit) and continued taking the supplements for only about 2 months. The drop in the use of iron supplements does not appear to be a consequence of changes in the availability of these supplements at the health center, as the availability of iron sulfate and iron folate tablets was fairly stable between baseline and follow-up in the surveyed health centers (Table 24, page 42). Steps to prevent malaria increased over time: About 58% of the mothers at baseline and 70% at follow-up reported that they had slept under a bednet during most of their pregnancy. The percentage who received anti-malarial drugs also increased, from 17.3% to 22.2%.
At baseline, the prevalence of night-blindness (a sign of vitamin A deficiency) was high. Nearly 6% of the women interviewed had experienced night blindness during pregnancy, which exceeded the 5% mark established by the WHO and reinforces a WHO (2009) report underscoring the extent of vitamin A deficiency in Burundi among pregnant women and preschool children. At follow-up, the percentage experiencing night blindness was 3.2%, below the WHO 5% cutoff.
Tubaramure had no significant impact on the already high percentage of mothers who received prenatal care or on which health professionals mothers consulted for prenatal care (Table 58). The program did, however, increase the demand32 for prenatal services: It increased the total number of prenatal visits (0.14–0.31 additional visits, statistically significant for the T24 and T18 groups), increased the percentage of mothers who had at least four prenatal visits by 12–19 percentage points (statistically significant for all groups), and resulted in women having their first prenatal visit a week to 10 days earlier in pregnancy (significant in all groups). The only possible supply effect on the types of services received during prenatal visits was observed for providing a blood sample, which increased in all study groups from baseline to follow-up. The intervention did not have a clear consistent effect on the demand for these services. It increased the percentage of mothers who had their weight taken by 1–6 percentage points (statistically significant for the T24 group), had their blood pressure taken by 3–14 percentage points 32 As pointed out previously, the program could have improved health care utilization through two distinct pathways: increasing the supply of services in the health centers (through the Tubaramure health strengthening activities) and increasing the demand for these services (through the Tubaramure BCC strategy). We refer to these types of impact as the “supply” and “demand” effects.

Strengthening and Evaluating the PM2A Approach – Burundi Follow-Up Report: Children 0–23 Months
88
(statistically significant for the T24 group), and gave a urine sample by 3–11 percentage points (statistically significant for the T24 and TNFP groups). However, no effect was found on the percentage who received a tetanus vaccination, had their height measured, or gave a blood sample.
As shown in Table 57, there was a dramatic drop in the proportion of women taking iron during pregnancy between baseline and follow-up, the opposite of what would be expected if Tubaramure had had a positive supply effect. Tubaramure had no consistent demand effect either. Note that the decline in the use of iron supplements over time was not as large in the TNFP group as it was in the control group and that the difference in the declines between the two groups was statistically significant (see Table 57). No demand impact was found on when mothers began supplementation or the number of iron pills taken per month. There was a very small positive effect on the duration of supplementation (7 days or less, statistically significant for the T18 and TNFP groups). The changes over time in the use of malaria prevention were seen in all groups, which suggests a possible Tubaramure supply effect.

Strengthening and Evaluating the PM2A Approach – Burundi Follow-Up Report: Children 0–23 Months
89
Table 57. Use of prenatal care services among mothersa
Baselineb Follow-upc
Full sample
Study arm Full sample
Study arm
T24 T18 TNFP Control T24 T18 TNFP Control
N 2580 422 862 426 870 2601 429 876 431 865
Received any prenatal care; % yes 99.0 98.1 98.7 99.3 99.4 99.8 99.8 99.7 100.0 99.9
Had prenatal care; % who consulted:
Doctor 5.7 10.6 4.6 4.3 5.2 5.2 3.5 4.8 9.8 4.3
Nurse/midwife/medical assistant 95.8 92.8 96.8 97.4 95.4 96.5 97.7 97.4 94.2 96.2
Trained traditional midwife 0.3* 0.0 0.4 0.2 0.5 0.1 0.2 0.0 0.0 0.1
Untrained traditional midwife 0.0 0.0 0.0 0.2 0.0 0.0 0.0 0.0 0.0 0.1
Prenatal care visits
Total number of visits 3.2 ± 1.0 3.2 ± 1.0 3.2 ± 1.1 3.2 ± 1.0 3.2 ± 0.9 3.7 ± 1.0* 3.7 ± 1.0 3.8 ± 1.0 3.7 ± 1.0 3.5 ± 0.9
% who had four visits 35.4 33.6 35.3 35.9 36.0 56.3* 58.5 64.8 57.9 46.0
Month of pregnancy at first visit 5.1 ± 1.4 5.0 ± 1.4 5.1 ± 1.4 5.0 ± 1.4 5.0 ± 1.4 4.3 ± 1.3 4.3 ± 1.3 4.2 ± 1.3 4.2 ± 1.3 4.6 ± 1.4
Month of pregnancy at last visit 8.3 ± 0.9 8.3 ± 0.7 8.3 ± 0.9 8.3 ± 0.8 8.2 ± 1.1 8.4 ± 0.8 8.4 ± 0.9 8.4 ± 0.8 8.4 ± 0.9 8.4 ± 0.8
Prenatal care; % who went to
Public facility 97.9 98.8 98.0 95.2 98.7 97.6 98.6 97.0 95.1 99.1
Private facility 2.1 1.2 2.0 4.8 1.3 2.4 1.4 3.0 4.9 0.9
Prenatal services provided; % who
Received tetanus vaccination 65.6 69.8 66.2 63.7 63.9 63.6 69.6 64.9 63.8 59.0
Had weight taken 94.3 93.6 94.5 94.6 94.3 95.7* 99.1 95.2 97.0 94.0
Had height taken 51.4 53.2 46.4 63.4 49.7 55.4 60.9 49.8 68.2 52.1
Had blood pressure taken 37.3 37.2 33.1 46.0 37.4 40.5 50.1 35.6 48.7 36.5
Gave a urine sample 13.1 12.9 12.1 17.6 12.1 15.4* 22.8 14.2 20.9 10.4
Gave a blood sample 38.7 50.0 30.9 46.5 37.2 65.1* 74.9 58.1 76.9 61.6
Pregnancy complications; % told
How to detect signs 19.7 17.5 18.3 22.4 20.9 16.7 22.4 15.5 16.0 15.3
Where to seek help if complications arose 31.7 32.8 28.4 33.6 33.6 25.9 29.1 28.6 23.0 23.0
Supplementation
% who took iron 72.1 73.7 74.9 68.9 70.0 56.0 58.2 56.3 61.0 52.1
Months pregnant when supplementation began 5.6 ± 1.4 5.5 ± 1.4 5.5 ± 1.4 5.7 ± 1.4 5.6 ± 1.4 5.2 ± 1.5 5.1 ± 1.4 5.2 ± 1.4 5.2 ± 1.5 5.2 ± 1.5
Duration of supplementation 1.9 ± 1.3 2.0 ± 1.4 1.9 ± 1.3 1.8 ± 1.3 1.9 ± 1.3 1.7 ± 1.3* 1.8 ± 1.4 1.9 ± 1.4 1.7 ± 1.4 1.5 ± 1.2
Number of pills per month 25.2 ± 10.4 24.5 ± 11.9 26.5 ± 8.8 23.6 ± 11.6 25.1 ± 10.3 27.6 ± 8.7 27.3 ± 9.2 27.4 ± 9.1 27.1 ± 9.6 28.1 ± 7.2
During pregnancy; %
Experienced night blindness 5.8 5.1 5.6 7.0 5.6 3.2 5.5 2.7 4.1 2.2
Received anti-malarial medication 17.3 17.3 16.9 15.3 18.6 22.2 22.2 24.1 20.5 21.0
Slept under a bednet 58.1 57.1 61.5 61.1 53.8 69.4 69.8 73.0 74.9 62.7
a Values are mean ± SD or %. All estimates account for clustering. b Sample size at baseline ranged from N = 1498 to 2580 in the full sample; N = 245 to 422 in the T24 arm; N = 522 to 862 in the T18 arm; N = 231 to 426 in the TNFP arm; and N = 500 to 870 in the control arm. c Sample size at follow-up ranged from N = 1144 to 2601 in the full sample; N = 205 to 429 in the T24 arm; N = 385 to 876 in the T18 arm; N = 210 to 431 in the TNFP arm; and N = 344 to 865 in the control arm.
* Study arms differ, p < 0.05.
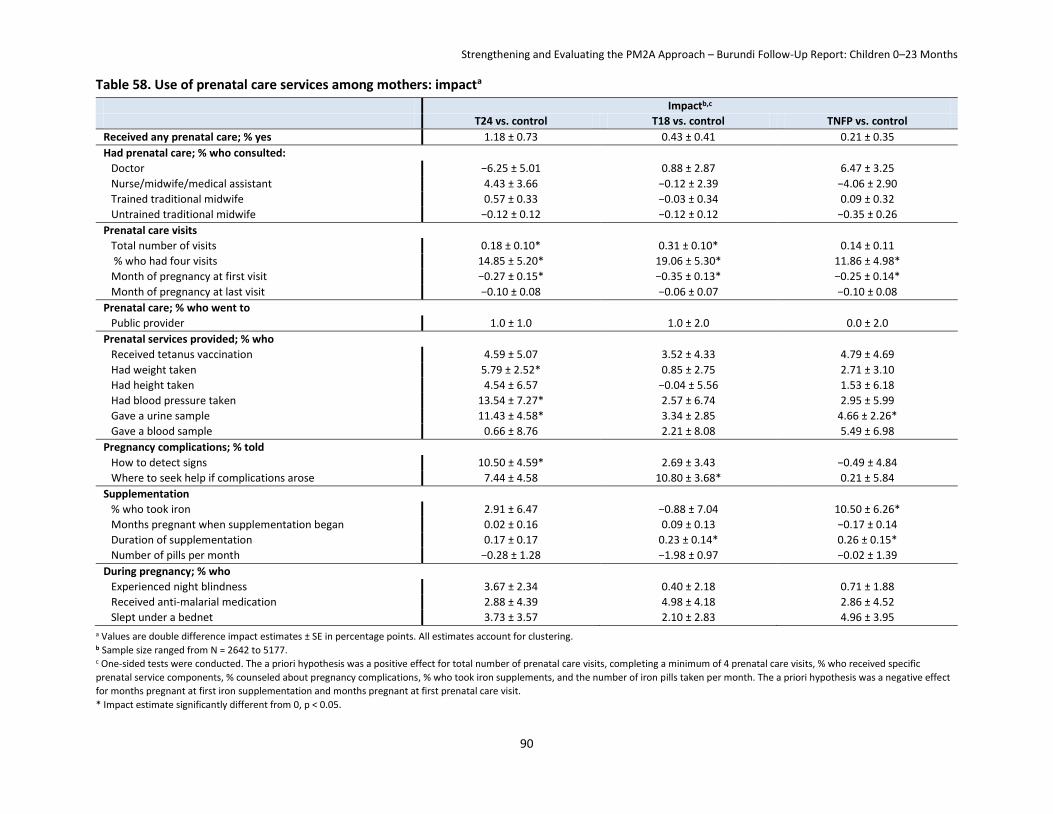
Strengthening and Evaluating the PM2A Approach – Burundi Follow-Up Report: Children 0–23 Months
90
Table 58. Use of prenatal care services among mothers: impacta
Impactb,c
T24 vs. control T18 vs. control TNFP vs. control
Received any prenatal care; % yes 1.18 ± 0.73 0.43 ± 0.41 0.21 ± 0.35
Had prenatal care; % who consulted:
Doctor −6.25 ± 5.01 0.88 ± 2.87 6.47 ± 3.25
Nurse/midwife/medical assistant 4.43 ± 3.66 −0.12 ± 2.39 −4.06 ± 2.90
Trained traditional midwife 0.57 ± 0.33 −0.03 ± 0.34 0.09 ± 0.32
Untrained traditional midwife −0.12 ± 0.12 −0.12 ± 0.12 −0.35 ± 0.26
Prenatal care visits
Total number of visits 0.18 ± 0.10* 0.31 ± 0.10* 0.14 ± 0.11
% who had four visits 14.85 ± 5.20* 19.06 ± 5.30* 11.86 ± 4.98*
Month of pregnancy at first visit −0.27 ± 0.15* −0.35 ± 0.13* −0.25 ± 0.14*
Month of pregnancy at last visit −0.10 ± 0.08 −0.06 ± 0.07 −0.10 ± 0.08
Prenatal care; % who went to
Public provider 1.0 ± 1.0 1.0 ± 2.0 0.0 ± 2.0
Prenatal services provided; % who
Received tetanus vaccination 4.59 ± 5.07 3.52 ± 4.33 4.79 ± 4.69
Had weight taken 5.79 ± 2.52* 0.85 ± 2.75 2.71 ± 3.10
Had height taken 4.54 ± 6.57 −0.04 ± 5.56 1.53 ± 6.18
Had blood pressure taken 13.54 ± 7.27* 2.57 ± 6.74 2.95 ± 5.99
Gave a urine sample 11.43 ± 4.58* 3.34 ± 2.85 4.66 ± 2.26*
Gave a blood sample 0.66 ± 8.76 2.21 ± 8.08 5.49 ± 6.98
Pregnancy complications; % told
How to detect signs 10.50 ± 4.59* 2.69 ± 3.43 −0.49 ± 4.84
Where to seek help if complications arose 7.44 ± 4.58 10.80 ± 3.68* 0.21 ± 5.84
Supplementation
% who took iron 2.91 ± 6.47 −0.88 ± 7.04 10.50 ± 6.26*
Months pregnant when supplementation began 0.02 ± 0.16 0.09 ± 0.13 −0.17 ± 0.14
Duration of supplementation 0.17 ± 0.17 0.23 ± 0.14* 0.26 ± 0.15*
Number of pills per month −0.28 ± 1.28 −1.98 ± 0.97 −0.02 ± 1.39
During pregnancy; % who
Experienced night blindness 3.67 ± 2.34 0.40 ± 2.18 0.71 ± 1.88
Received anti-malarial medication 2.88 ± 4.39 4.98 ± 4.18 2.86 ± 4.52
Slept under a bednet 3.73 ± 3.57 2.10 ± 2.83 4.96 ± 3.95
a Values are double difference impact estimates ± SE in percentage points. All estimates account for clustering. b Sample size ranged from N = 2642 to 5177. c One-sided tests were conducted. The a priori hypothesis was a positive effect for total number of prenatal care visits, completing a minimum of 4 prenatal care visits, % who received specific
prenatal service components, % counseled about pregnancy complications, % who took iron supplements, and the number of iron pills taken per month. The a priori hypothesis was a negative effect
for months pregnant at first iron supplementation and months pregnant at first prenatal care visit.
* Impact estimate significantly different from 0, p < 0.05.

Strengthening and Evaluating the PM2A Approach – Burundi Follow-Up Report: Children 0–23 Months
91
The percentage of mothers delivering at a public health facility increased dramatically, from 57% at baseline to 76% at follow-up (Table 59). Eight percent of women gave birth while in transit at both baseline and follow-up. Only around 60% of all births (irrespective of the place of delivery) were attended by a trained health professional at baseline; this percentage increased to around 77% at follow-up. The already high percentage of mothers reporting at baseline that their newborn infants were immediately cleaned (i.e., dried off) (86%) and wrapped (two important strategies to prevent hypothermia) (86%), further increased to 89.2% and 92.2% at follow-up, respectively. The percentage of newborns weighed at delivery increased from 58.7% to 73.7%.
Tubaramure had no demand effect on where mothers delivered, who attended the deliveries, or on the services received at delivery (Table 60). The clear positive changes over time shown in Table 60, however, may have been caused by Tubaramure’s health strengthening activities.
Nearly all women at both baseline and follow-up received at least some postpartum medical care following the birth of their index child. However, the use of preventive health measures was much lower than during pregnancy at both baseline and follow-up. Almost all mothers were examined by a health professional within 6 weeks of delivery, and only about 20% (as reported in both surveys) were checked immediately after birth (Table 61). The average time elapsing before the first postnatal visit slightly dropped from 1.0 week at baseline to 0.7 weeks at follow-up. Most commonly, a nurse, midwife, or medical assistant at a public institution performed check-ups at both time points. The percentage of women taking iron supplements after giving birth (3.3% at baseline and 4.0% at follow-up) remained very low.
There is no indication that the program had any meaningful supply or demand effect on any of the postnatal care outcomes (Table 62).
9.3 Maternal Diet and Nutritional Status The average women’s dietary diversity score among mothers at follow-up was 4.0 (data not collected at baseline) (Table 63). More than 75% of mothers reported that in the previous 24 hours they had consumed dark green leafy vegetables, vitamin A-rich fruits and vegetables, starchy staples, and legumes/nuts. Consumption of other food groups was much less common: Only about one-third had consumed other fruits and vegetables; one-fourth had consumed meat and fish; and fewer than 2% reported consumption of organ meat, eggs, and dairy products. Intake of CSB in the previous 24 hours was reported by only around 2% of mothers at baseline and approximately 38%–56% at follow-up in the Tubaramure groups. As would be expected, CSB consumption was highest in current CSB beneficiary families (around 75%, 60%, and 58% in the T24, T18, TNFP arms, respectively). Surprisingly, a substantial proportion of mothers who reported being past beneficiaries reported consuming CSB in the past 24 hours. Current beneficiaries consumed CSB around 4 days per week and around 1.5 times per day. The frequency of consumption in “past” and “never” beneficiaries was lower.
Tubaramure had a small positive impact on dietary diversity (ranging from 0.32 to 0.48 food groups, statistically significant in all groups) (Table 64). The largest impact was found on the legumes group (17–20 percentage points, statistically significant in all groups), a direct consequence of CSB consumption. The program increased consumption of fruits and vegetables: There was a significant impact on the consumption of vitamin A-rich fruits and vegetables in the T24 group (7 percentage points) and a significant impact on other fruits and vegetables in the T18 (13 percentage points) and the TNFP group (11 percentage points). Tubaramure also increased the percentage of women who consumed eggs by 1–2 percentage points (statistically significant for the T24 and T18 groups). Dairy consumption increased only in the TNFP group (2 percentage points).

Strengthening and Evaluating the PM2A Approach – Burundi Follow-Up Report: Children 0–23 Months
92
Table 59. Delivery services used by mothersa
Baselineb Follow-upc
Full sample
Study arm Full sample
Study arm
T24 T18 TNFP Control T24 T18 TNFP Control
N 2575 422 861 426 869 2598 427 875 431 865
Location of delivery; % who delivered at
Public institution 57.1 57.6 56.2 65.3 53.6 75.5 72.4 74.9 76.0 77.2
Private institution 1.5 1.2 1.7 2.4 0.9 1.9 1.4 2.8 3.1 0.7
At home 33.5 30.6 35.0 25.4 37.3 14.5 17.1 13.2 12.2 15.7
In transit 8.0 10.7 7.1 6.9 8.2 8.1 9.0 9.0 8.7 6.4
Medical staff at birth; % with presence of:
Doctor 5.3 6.7 4.3 6.6 5.1 5.0 4.4 4.7 8.4 4.0
Nurse/midwife/medical assistant 55.1 54.5 55.4 63.6 50.8 72.1 69.8 71.3 72.2 74.1
Trained traditional midwife 19.6 19.2 20.8 14.6 21.1 13.4 16.4 15.8 9.7 11.3
Untrained traditional midwife 9.6 12.1 8.1 6.6 11.4 4.7 5.2 4.1 3.9 5.3
Parent/friend 9.6 8.5 10.6 8.7 9.5 3.8 4.4 3.4 3.9 3.8
Nobody 6.0 5.5 6.0 6.1 6.1 4.0 3.7 3.7 4.6 4.0
Services received at delivery: % who said:
Child immediately cleaned 85.7 85.4 85.5 88.4 84.8 89.2* 87.1 87.8 93.3 89.5
Child wrapped before placental delivery 85.9* 86.2 88.5 84.5 83.8 92.2 93.3 91.1 92.5 92.5
Child weighed 58.7 60.8 58.3 66.2 54.3 73.7 81.1 72.2 73.9 71.5 a Values are mean ± SD or %. All estimates account for clustering. b Sample size at baseline ranged from N = 2398 to 2575 in the full sample; N = 376 to 422 in the T24 arm; N = 808 to 861 in the T18 arm; N = 389 to 426 in the TNFP arm; and N = 801 to 869 in the control arm. c Sample size at follow-up ranged from N = 2418 to 2598 in the full sample; N = 395 to 427 in the T24 arm; N = 813 to 875 in the T18 arm; N = 404 to 431 in the TNFP arm; and N = 806 to 865 in the control arm.
* Study arms differ, p < 0.05.

Strengthening and Evaluating the PM2A Approach – Burundi Follow-Up Report: Children 0–23 Months
93
Table 60. Delivery services used by mothers: impacta
Impactb T24 vs. control T18 vs. control TNFP vs. control
Location of delivery; % who delivered at
Public institution −8.13 ± 8.96 −5.48 ± 8.75 −12.32 ± 9.06
Private institution 0.40 ± 0.79 1.18 ± 1.50 0.65 ± 1.94
At home 7.81 ± 8.22 0.44 ± 9.74 8.29 ± 8.41
In transit −0.08 ± 2.92 3.87 ± 3.54 3.38 ± 2.84
Medical staff at birth; % with presence of:
Doctor −1.37 ± 2.91 1.11 ± 2.32 2.58 ± 2.51
Nurse/midwife/medical assistant −7.32 ± 8.57 −7.68 ± 8.17 −14.24 ± 8.78
Trained traditional midwife 6.82 ± 6.50 5.03 ± 4.66 4.55 ± 4.75
Untrained traditional midwife −1.00 ± 2.71 2.13 ± 2.62 3.29 ± 2.51
Parent/friend 1.65 ± 2.38 −1.22 ± 2.38 1.06 ± 2.57
Nobody 0.32 ± 2.39 −0.26 ± 1.81 0.72 ± 2.02
Services received at delivery: % who said:
Child immediately cleaned −2.64 ± 4.63 −2.23 ± 3.39 0.57 ± 3.54
Child wrapped before placental delivery −1.27 ± 3.33 −5.87 ± 2.04* −0.34 ± 2.82
Child weighed 3.82 ± 6.27 −3.72 ± 5.65 −9.54 ± 5.23
a Values are double difference impact estimates ± SE. All estimates account for clustering. b Sample size ranged from N = 4816 to 5173.
* Impact estimate significantly different from 0, p < 0.05.

Strengthening and Evaluating the PM2A Approach – Burundi Follow-Up Report: Children 0–23 Months
94
Table 61. Postnatal carea
Baselineb Follow-upc
Full sample
Study arm
Full sample
Study arm
T24 T18 TNFP Control T24 T18 TNFP Control
N 2579 422 863 426 870 2596 427 875 431 865
Postnatal check-up % who received check-up immediately after birth 21.9 24.9 19.9 23.8 21.4 20.8 25.1 19.2 23.9 18.9 Time elapsed before first check-up (weeks) 1.0 ± 1.7 0.8 ± 1.5 1.1 ± 2.1 1.3 ± 1.4 0.9 ± 1.4 0.7 ± 4.5 0.5 ± 1.0 1.1 ± 7.6 0.4 ± 0.6 0.8 ± 2.7 % received examination by health professional
within 6 weeks 99.1 99.0 99.4 99.0 98.9 99.1 100.0 98.2 100.0 98.8
Postnatal check-up conducted by Doctor 14.6 21.9 12.8 13.7 12.6 14.8 15.9 17.6 18.4 9.1 Nurse, midwife or medical assistant 85.4 78.1 87.2 86.3 87.4 85.2 84.1 82.4 81.6 90.9
After birth, % who received postnatal care at Public institution 96.6 96.2 95.9 92.9 99.5 97.4 100.0 95.8 95.0 98.8 Private institution 3.2 3.8 3.5 7.1 0.5 2.6 0.0 4.2 5.0 1.2 At home 0.2 0.0 0.6 0.0 0.0 0.0 0.0 0.0 0.0 0.0
Postnatal supplements % who took iron supplements 3.3 3.8 4.2 2.3 2.5 4.0 7.5 3.4 4.7 2.7 Duration of supplementation (months) 0.8 ± 0.9 1.0 ± 0.9 0.7 ± 0.8 0.8 ± 1.0 0.7 ± 0.9 1.0 ± 1.4 1.1 ± 1.6 1.1 ± 1.1 1.2 ± 1.6 0.6 ± 1.0 Number of pills per month 21.4 ± 14.7 24.0 ± 17.6 18.8 ± 12.7 21.6 ± 24.4 23.8 ± 11.7 20.5 ± 12.8 22.4 ± 12.2 17.3 ± 13.6 25.0 ± 10.4 18.6 ± 14.4
a Values are mean ± SD or %. All estimates account for clustering. b Sample size at baseline ranged from N = 45 to 2579 in the full sample; N = 9 to 422 in the T24 arm; N = 20 to 863 in the T18 arm; N = 5 to 426 in the TNFP arm; and N = 11 to 870 in the control arm. c Sample size at follow-up ranged from N = 55 to 2596 in the full sample; N = 19 to 427 in the T24 arm; N = 20 to 875 in the T18 arm; N = 9 to 431 in the TNFP arm; and N = 7 to 865 in the control arm.
* Study arms differ, p < 0.05.

Strengthening and Evaluating the PM2A Approach – Burundi Follow-Up Report: Children 0–23 Months
95
Table 62. Postnatal care: impacta
Impactb,c
T24 vs. control T18 vs. control TNFP vs. control
Postnatal check-up
% who received check-up immediately after birth 2.84 ± 4.55 2.10 ± 4.30 2.76 ± 4.77
Time elapsed before first check-up (weeks) −0.07 ± 0.39 0.32 ± 0.67 −0.75 ± 0.37*
% received examination by health professional within 6 weeks 0.89 ± 1.62 −1.21 ± 2.14 1.82 ± 2.04
Postnatal check-up conducted by
Doctor −3.77 ± 7.33 4.57 ± 5.15 7.03 ± 5.12
Nurse, midwife, or medical assistant 3.77 ± 7.33 −4.57 ± 5.15 −7.03 ± 5.12
After birth, % who received postnatal care at
Public institution 5.40 ± 2.80 0.68 ± 2.86 4.26 ± 1.47*
Private institution −5.40 ± 2.80 −0.08 ± 2.69 −4.26 ± 1.47*
At home 0.00 ± 0.00 −0.60 ± 0.54 0.00 ± 0.00
Postnatal iron supplementation
% who took iron supplements 3.79 ± 2.06* −0.80 ± 0.88 2.44 ± 1.40*
Duration of supplementation (months) 0.36 ± 0.45 0.42 ± 0.52 1.06 ± 0.52*
Number of pills per month 1.33 ± 4.47 7.04 ± 4.41 6.83 ± 3.96* 1 Values are double difference impact estimates ± SE. All estimates account for clustering. 2 Sample size ranged from N = 100 to 5174. 3 One-sided tests were conducted. The a priori hypothesis was a positive effect for attending a postnatal check-up and receiving postnatal iron supplementation. The a priori hypothesis was a negative
effect for the time before the first check-up.
* Impact estimate significantly different from 0, p < 0.05.

Strengthening and Evaluating the PM2A Approach – Burundi Follow-Up Report: Children 0–23 Months
96
Table 63. Maternal consumption and dietary diversitya
Baselineb Follow-upc
Full sample
Study arm Full sample
Study arm
T24 T18 TNFP Control T24 T18 TNFP Control
N 2584 427 863 425 869 2614 432 880 431 871
Dietary diversity (range 0 to 9) 4.1 ± 1.2* 4.1 ± 1.1 4.3 ± 1.2 4.2 ± 1.2 3.8 ± 1.2
Maternal consumption in previous 24 hours
Starchy staples 86.8 86.1 88.1 88.4 85.2
Dark green leafy vegetables 85.8 87.3 87.5 81.4 85.6
Other vitamin A-rich fruits and vegetables 85.2 88.4 86.9 85.6 81.6
Other fruits and vegetables 37.8* 34.6 43.7 42.4 31.1
Organ meat 1.3 0.5 1.5 3.0 0.7
Meat and fish 26.9 22.3 30.6 28.2 24.7
Eggs 1.8 2.5 2.3 1.9 0.9
Legumes and nuts 81.3* 89.3 86.3 86.8 69.7
Milk and milk products 1.3 1.2 1.1 2.6 0.8
CSB consumption
% who consumed in the last 24 hours
All 2.2 2.3 2.2 2.4 2.1 31.2 56.3 38.3 46.2 4.0
Current Tubaramure benefit 63.6 74.5 60.4 57.6 63.6
Past Tubaramure benefit 14.0 33.3 12.5 13.3 14.0
Never Tubaramure benefit 6.0 5.6 6.0 6.5 6.0
Number of days consumed in the last week
All 2.0 ± 2.7* 3.4 ± 2.9 2.5 ± 2.8 3.3 ± 2.9 0.2 ± 0.9
Current Tubaramure benefit 4.2 ± 2.6 4.4 ± 2.6 4.2 ± 2.6 4.1 ± 2.7 4.2 ± 2.6
Past Tubaramure benefit 0.8 ± 1.8 1.4 ± 2.2 0.7 ± 1.7 1.4 ± 2.3 0.8 ± 1.8
Never Tubaramure benefit 0.3 ± 1.3 0.4 ± 1.4 0.3 ± 1.2 0.3 ± 1.1 0.3 ± 1.3
Times per day consumed in the last week
All 1.3 ± 1.1* 1.3 ± 1.0 1.2 ± 1.2 1.4 ± 1.3 0.5 ± 0.5
Current Tubaramure benefit 1.4 ± 1.2 1.4 ± 1.0 1.4 ± 1.4 1.5 ± 1.3 1.4 ± 1.2
Past Tubaramure benefit 0.9 ± 0.8 1.0 ± 0.5 0.9 ± 0.9 1.0 ± 0.7 0.9 ± 0.8
Never Tubaramure benefit 0.6 ± 0.5 0.7 ± 0.6 0.5 ± 0.5 0.4 ± 0.4 0.6 ± 0.5
a Values are mean ± SD or %. All estimates account for clustering. b Sample size at baseline did not vary. c Sample size at follow-up ranged from N = 30 to 2614 in the full sample; N = 3 to 432 in the T24 arm; N = 19 to 880 in the T18 arm; N = 4 to 431 in the TNFP arm; and N = 58 to 871 in the control arm.
* Study arms differ, p < 0.05.

Strengthening and Evaluating the PM2A Approach – Burundi Follow-Up Report: Children 0–23 Months
97
Table 64. Maternal consumption and dietary diversity: impacta
Impactb,c
T24 vs. control T18 vs. control TNFP vs. control
Dietary diversity (range 0 to 9) 0.32 ± 0.13* 0.48 ± 0.12* 0.40 ± 0.13*
Maternal consumption in previous 24 hours
Starchy staples 0.94 ± 3.43 2.88 ± 1.83 3.23 ± 2.44
Dark green leafy vegetables 1.64 ± 2.71 1.87 ± 2.69 −4.24 ± 3.47
Other vitamin A-rich fruits and vegetables 6.81 ± 4.06* 5.31 ± 3.53 4.03 ± 3.66
Other fruits and vegetables 3.42 ± 5.20 12.59 ± 5.84* 11.27 ± 4.51*
Organ meat −0.23 ± 0.42 0.79 ± 0.53 2.33 ± 1.24*
Meat and fish −2.38 ± 3.62 5.87 ± 3.74 3.53 ± 5.28
Eggs 1.63 ± 0.87* 1.35 ± 0.60* 0.94 ± 0.78
Legumes and nuts 19.67 ± 3.95* 16.69 ± 3.72* 17.12 ± 4.12*
Milk and milk products 0.35 ± 0.78 0.33 ± 0.57 1.75 ± 0.68* a Values are double difference impact estimates ± SE in percentage points when data from both surveys were available and simple difference impact estimates ± SE when only follow-up data were
available. All estimates account for clustering.
b Sample size ranged from N = 2590 to 2614. One-sided tests were conducted for all outcomes. c One-sided tests were conducted. The a priori hypothesis was a positive effect for all indicators.
* Impact estimate significantly different from 0, p < 0.05.
Strengthening and Evaluating the PM2A Approach – Burundi Follow-Up Report: Children 0–23 Months
98
The vast majority of non-pregnant mothers (83.5% at baseline and 81.4% at follow-up) had a normal BMI (Table 65). Those that fell outside of the normal range were more likely to be underweight (13.4% at baseline and 14.7% at follow-up) than overweight (3.1% at baseline and 3.8% at follow-up). On average, mothers weighed 50 kg and were 156 cm tall in both surveys. About 3% of the mothers were of short stature (i.e., less than 145 cm tall) at both baseline and follow-up. Short stature increases the odds of complications during childbirth. Consistent with the decrease in the use of iron supplements during pregnancy, mean Hb dropped from 12.6 g/dL at baseline to 12.1 g/dL at follow-up. This drop in Hb is reflected in a steep increase in the prevalence of anemia, from about 30% of the mothers at baseline to nearly 45% at follow-up. Severe anemia was virtually absent among the women in both surveys.
No significant impact of Tubaramure was observed for maternal weight or BMI (Table 66). The program had a modest protective effect on Hb and anemia, i.e., the overall decrease in Hb levels (and increase in anemia) observed between surveys was lower in the Tubaramure groups. The estimated effect on mean Hb of 0.07 to 0.23 g/dL did not reach statistical significance (p-values 0.12, 0.09, and 0.35 in the T24, T18, and TNFP groups, respectively). Tubaramure had a 4.2–7.5 percentage point effect on anemia prevalence (significant in T24; p-values in the T18 and TNFP groups were 0.08 and 0.19, respectively).

Strengthening and Evaluating the PM2A Approach – Burundi Follow-Up Report: Children 0–23 Months
99
Table 65. Anthropometric status of mothersa
Baselineb Follow-upc
Full sample
Study arm
Full sample
Study arm
T24 T18 TNFP Control T24 T18 TNFP Control
N 2582 428 857 425 874 2595 430 877 425 865
Weight (kg)d 50.2 ± 6.6 50.9 ± 8.0 50.3 ± 6.2 50.4 ± 7.0 49.8 ± 5.9 50.1 ± 6.3 50.2 ± 6.1 50.3 ± 6.4 50.5 ± 6.6 49.8 ± 6.0
Height (cm) 155.7 ± 6.2 156.5 ± 6.2 155.7 ± 6.6 156.1 ± 6.0 155.0 ± 5.8 155.8 ± 5.8 156.2 ± 6.2 155.9 ± 5.7 155.9 ± 5.5 155.2 ± 5.9
% less than 145 cm 2.8 2.6 2.3 3.3 3.2 2.5 2.6 1.9 2.1 3.4
BMI
Mean BMId 20.7 ± 2.9 20.8 ± 2.9 20.8 ± 3.8 20.7 ± 2.3 20.7 ± 2.1 20.7 ± 2.2 20.5 ± 2.1 20.7 ± 2.2 20.8 ± 2.3 20.7 ± 2.1
Underweight (BMI < 18.5) 13.4 11.0 14.4 14.7 12.8 14.7 14.9 15.2 14.7 14.2
Normal (BMI 18.5–24.9) 83.5 85.0 82.1 82.5 84.7 81.4 81.0 80.6 81.4 82.5
Overweight (BMI 25) 3.1 4.0 3.5 2.7 2.5 3.8 4.1 4.2 3.9 3.3
Hemoglobin/anemia
Mean Hb (g/dL) 12.6 ± 1.6* 12.9 ± 1.6 12.6 ± 1.5 12.9 ± 1.6 12.4 ± 1.6 12.1 ± 1.6* 12.4 ± 1.5 12.1 ± 1.6 12.2 ± 1.5 11.8 ± 1.6
% anemice 30.8* 25.9 30.8 26.1 35.5 44.6* 36.3 42.5 40.0 53.2
% severely anemicf 0.5 0.5 0.4 0.7 0.6 1.0 0.2 1.3 0.5 1.3
a Values are mean ± SD or %. All estimates account for clustering. b Sample size at baseline ranged from N = 552 to 2582 in the full sample; N = 98 to 428 in the T24 arm; N = 170 to 857 in the T18 arm; N = 94 to 425 in the TNFP arm; and N = 181 to 874 in the control arm. c Sample size at follow-up ranged from N = 561 to 2595 in the full sample; N = 93 to 430 in the T24 arm; N = 215 to 877 in the T18 arm; N = 90 to 425 in the TNFP arm; and N = 158 to 865 in the control arm. d Weight and BMI are reported only for women who reported not being pregnant at the time of the interview. e The cutoff for anemia was 12 g/dL for non-pregnant women and 11 g/dL for pregnant women.
f The cutoff for severe anemia was 8 g/dL for non-pregnant women and 7 g/dL for pregnant women.
* Study arms differ, p < 0.05.

Strengthening and Evaluating the PM2A Approach – Burundi Follow-Up Report: Children 0–23 Months
100
Table 66. Anthropometric status of mothers: impacta
Impactb
T24 vs. control T18 vs. control TNFP vs. control
Weight (kg)c −0.78 ± 0.70 −0.08 ± 0.47 0.03 ± 0.68
BMI
Mean BMIc −0.21 ± 0.27 −0.16 ± 0.21 0.13 ± 0.23
Underweight (BMI < 18.5) 2.40 ± 3.00 −0.33 ± 2.27 −1.96 ± 2.87
Normal (BMI 18.5–24.9) −1.64 ± 3.09 0.73 ± 2.29 1.73 ± 2.85
Overweight (BMI 25) −0.76 ± 1.55 −0.41 ± 1.17 0.23 ± 1.44
Hemoglobin/anemia
Mean Hb (g/dL) 0.17 ± 0.15 0.23 ± 0.17 0.07 ± 0.18
% anemicd −7.55 ± 4.36* −6.57 ± 4.57 −4.22 ± 4.76
% severely anemice −0.98 ± 0.74 0.16 ± 0.73 −0.97 ± 0.82 1 Values are double difference impact estimates ± SE in percentage points. All estimates account for clustering.
2 Sample size ranged from N = 1113 to 5165. One-sided tests were used for maternal hemoglobin and anemia variables including: adjusted values, maternal anemia, and maternal severe anemia. The
anemia and hemoglobin estimates further controlled for altitude, child age, maternal age and maternal education. 3 Weight and BMI are reported only for women who reported not being pregnant at the time of the interview. 4 The cutoff for anemia was 12 g/dL for non-pregnant women and 11 g/dL for pregnant women. 5 The cutoff for severe anemia was 8 g/dL for non-pregnant women and 7 g/dL for pregnant women.
* Impact estimate significantly different from 0, p < 0.05.
Strengthening and Evaluating the PM2A Approach – Burundi Follow-Up Report: Children 0–23 Months
101
10. Results: Child Impact
10.1 IYCF Practices33 Breastfeeding practices among this population were optimal in many aspects at baseline and continued to show improvement at follow-up. Nearly all of the children 0–23 months of age (99.2% at baseline and 99.4% at follow-up) had ever been breastfed and most (80.7% at baseline and 90.3% at follow-up) were reportedly put to the breast within 1 hour of birth (Table 67). Almost three-quarters of infants under 6 months of age (78.1%) were exclusively breastfed during the preceding 24 hours at baseline, and this percentage increased to 90% at follow-up. Nearly 90% of infants under 6 months were predominantly breastfed at baseline and 95% at follow-up. In addition, almost all children were still breastfed at 1 year of age, and many (77.6% at baseline and 82.8% at follow-up) of the children were still being breastfed at 2 years of age. The high percentage of exclusive breastfeeding and continued breastfeeding explains the high rate of age-appropriate breastfeeding (85.6% at baseline and 91.3% at follow-up). The use of bottles was virtually nonexistent, with less than 1% reporting to have used a bottle to feed their child in the past 24 hours in both surveys. Although breastfeeding practices were quite good in general, among children who were not breastfed (7.3%), very few (3.3% at baseline and 4.1% at follow-up) received at least two milk feeds per day as recommended.
Of children aged 6–8 months, more than 90% had started eating complementary foods in both surveys. The quality of the complementary foods and the feeding frequency, however, were suboptimal, but improved dramatically from baseline to follow-up. Only a small percent of children 6–23 months of age (16.6%) had consumed iron-rich foods in the past 24 hours at baseline, but this had increased considerably to 47.5% at follow-up. At baseline, only about one-third of children received the minimum number of meals recommended for their age (at least two for breastfed children 6–8 months of age, at least three for breastfed children 9–23 months of age, and at least four for non-breastfed children), and the percentage of children receiving the minimum (WHO-recommended) meal frequency dropped with age, from around 40% in children 6–11 months to around 30% in older children. At follow-up, the percentage receiving the minimum number was noticeably higher (46.0%) and did not differ among the age groups. Note that the percent of mothers who knew the WHO-recommended feeding frequency (around 96% and 80% for children 6–8 and 11–23 months, respectively, at follow-up; see Table 53) was considerably higher than the proportion feeding their children the minimum number of meals. At baseline, fewer than 25% of the children were found to have consumed foods from at least four different food groups in the past 24 hours. This percentage increased with age, but was still low (around 30%) for the oldest children. At follow-up, the percentage with minimum dietary diversity had increased considerably (11%–16%) in all age groups. Only 8.1% of the children were classified as receiving a minimal acceptable diet at baseline; this proportion increased dramatically between baseline and follow-up, but remained relatively low at 20.1%.34 Based on this indicator, the youngest children were found to be worst off, with only 5.5% (baseline) and 16.6% (follow-up) receiving a minimally acceptable diet.
CSB was consumed by only around 3% of children (6–23 months) in the previous 24 hours at baseline. At follow-up, 55%–60% of children in the T24 and TNFP groups and around 39% in the T18 group
33 Note that the IYCF practices are assessed using the WHO IYCF indicator cutoffs, which might be different from the WHO guidance for complementary feeding. 34 This indicator was calculated for both breastfed and non-breastfed children. For breastfed children, it was defined as meeting both the minimum dietary diversity and the minimum meal frequency requirements. For non-breastfed children, it was defined as having received at least two milk feedings, having consumed foods from at least four food groups (out of six nutrient-rich food groups), and meeting the minimum meal frequency in the past 24 hours.
Strengthening and Evaluating the PM2A Approach – Burundi Follow-Up Report: Children 0–23 Months
102
reportedly consumed CSB in the day preceding the survey. The lower proportion in the T18 group is due to the fact that beneficiaries in this group did not receive program benefits after the child reached 18 months of age. As would be expected, CSB consumption was highest in current CSB beneficiary families (around 75%, 63%, and 67% in the T24, T18, and TNFP groups, respectively). Surprisingly, a considerable proportion of households that were no longer in the program (13%–27%) and who had never been in the program (9%–12%) reported having fed CSB to their child in the past 24 hours. Beneficiary children consumed CSB 2–3 days per week and in around 11 meals in the past week. The frequency of consuming CSB in “past” and “never” beneficiaries was lower (around 1.0 and 0.5 days per week, respectively).
The program did not have a significant effect on breastfeeding practices, with the exception of an increase in the percentage of children who were still breastfed at 1 year (1–6 percentage points, significant in the T24 group) (Table 68). The impact estimates for the proportion of children receiving complementary foods between 6 and 8 months of age were consistently positive (2–9 percentage points), but did not reach statistical significance (note that sample size for this indicator was very limited). The consumption of CSB led to a significant increase in the percent of children consuming iron-rich or iron-fortified foods (28–40 percentage points, statistically significant in all treatment and age groups). Tubaramure increased the proportion of children receiving the minimum recommended number of meals by 8–26 percentage points (statistically significant for the T18 and TNFP groups; p = 0.08 in T24). The largest impact was found in children 6–11 months and children 18–23 months. The program also led to an estimated increase of 7–12 percentage points on the percent of children receiving the minimum dietary diversity. Finally, Tubaramure had a positive impact on the percentage of children consuming a minimally acceptable diet (5–13 percentage points, statistically significant for the T18 and TNFP groups, p-value in T24 0.126).

Strengthening and Evaluating the PM2A Approach – Burundi Follow-Up Report: Children 0–23 Months
103
Table 67. IYCF practicesa
Baselineb Follow-upc
Full sample
Study arm Full sample
Study arm
T24 T18 TNFP Control T24 T18 TNFP Control
N 2592 427 864 427 874 2608 430 879 431 868
Breastfeeding Child ever breastfed 99.2 99.8 99.2 99.3 99.0 99.4* 99.5 99.3 100.0 99.2 Early initiation of breastfeeding (within 1 hour of birth) 80.7 78.4 83.0 82.3 78.7 90.3* 91.8 90.7 93.0 87.7 Exclusive breastfeeding among children < 6 months of age 78.1 82.5 81.5 78.9 71.8 90.4 94.6 92.5 86.5 87.3 Predominant breastfeeding among children < 6 months of age 88.5 90.3 88.3 89.6 87.1 95.3 96.8 96.3 92.5 94.9 Continued breastfeeding at 1 year (12–15 months) 97.1 96.9 98.1 95.2 97.3 97.3* 100.0 97.9 97.2 95.3 Continued breastfeeding at 2 years or age (20–23 months) 77.6 70.0 80.1 76.9 78.5 82.8 84.6 80.7 88.9 81.4 Age-appropriate breastfeeding 85.6 85.3 86.8 85.9 84.4 91.3* 94.6 91.4 90.7 89.8 Bottle feeding 0.9 0.9 1.4 1.2 0.2 0.6 0.2 1.3 0.2 0.3 Milk feeding frequency for non-breastfed children (≥ 2 feedings/day) 3.3 5.9 3.4 3.7 1.6 4.1 27.3 0.0 7.1 1.9
Complementary feeding Introduction of solid, semi-solid, or soft foods (6–8 months) 93.5 97.6 93.5 88.9 93.6 92.3 93.2 94.6 91.4 89.8
Consumption of iron-rich or iron-fortified foods All (6–23 months) 16.6 16.7 15.8 19.9 15.7 47.5* 66.1 53.0 66.3 24.8 6–11 months 11.7* 12.1 11.6 18.3 8.4 41.9* 55.6 50.5 55.6 19.7 12–17 months 19.0 19.4 17.4 20.0 20.1 55.1* 76.3 62.2 78.3 26.4 18–23 months 18.4 18.1 17.7 21.6 18.1 45.5* 67.3 46.5 65.2 28.3
Minimum meal frequency All (6–23 months) 32.8* 37.8 33.9 24.6 33.1 46.0* 48.9 50.2 53.1 37.1 6–11 months 40.7 45.1 43.9 27.6 41.9 48.8 50.5 52.1 56.1 41.0 12–17 months 29.9 40.6 31.6 27.0 24.1 45.0* 44.5 52.1 53.0 34.6 18–23 months 29.5 30.1 28.9 18.7 33.3 44.1 52.1 46.8 49.4 36.1
Minimum dietary diversity (≥ 4 food groups) All (6–23 months) 23.7 25.2 23.6 28.6 20.8 37.0* 39.0 42.2 44.2 27.9 6–11 months 13.9* 19.0 10.6 22.6 10.3 28.4 27.4 34.1 32.0 21.8 12–17 months 26.9 30.8 26.7 31.2 22.3 42.6* 48.2 48.8 51.7 29.4 18–23 months 29.0 25.6 31.2 31.4 27.6 40.4 42.9 43.4 51.1 32.5
Minimal acceptable diet All (6–23 months) 8.1 11.1 8.0 7.5 7.1 20.1* 21.8 24.2 26.2 12.6 6–11 months 5.5 10.2 4.8 5.9 3.8 16.6* 14.9 22.8 20.0 10.2 12–17 months 10.2 16.7 9.0 11.8 7.2 22.6* 25.9 26.7 29.9 13.6 18–23 months 8.5 7.0 9.7 4.0 9.7 21.2* 25.8 23.2 30.0 14.0
CSB Child (6–23 months) ate CSB yesterday
All 3.5 4.1 3.5 3.3 3.3 33.4* 60.2 38.8 56.1 5.1 Current Tubaramure benef. 67.6 74.8 63.1 66.5 Past Tubaramure benef. 16.7 27.3 16.2 13.3 Never Tubaramure benef. 9.9 11.6 9.5 8.7

Strengthening and Evaluating the PM2A Approach – Burundi Follow-Up Report: Children 0–23 Months
104
b Baseline Follow-upc
Full Study arm Full Study arm
sample T24 T18 TNFP Control sample T24 T18 TNFP Control
N 2592 427 864 427 874 2608 430 879 431 868 Number of days in last week child ate CSB
All 2.2 ± 2.9 3.6 ± 3.0 2.7 ± 2.9 3.9 ± 3.0 0.3 ± 1.0 Current Tubaramure benef. 4.5 ± 2.6 4.5 ± 2.6 4.4 ± 2.6 4.6 ± 2.7 Past Tubaramure benef. 1.1 ± 2.1 1.5 ± 2.8 1.0 ± 2.1 1.4 ± 2.3 Never Tubaramure benef. 0.5 ± 1.6 0.7 ± 1.8 0.5 ± 1.5 0.5 ± 1.5
Number of meals in last week with CSB All 10.2 ± 6.7 10.6 ± 7.0 10.2 ± 6.2 11.4 ± 6.9 4.7 ± 4.5 Current Tubaramure benef. 11.2 ± 6.7 10.8 ± 7.0 10.9 ± 6.1 11.8 ± 6.9 Past Tubaramure benef. 7.6 ± 4.8 10.3 ± 6.4 7.2 ± 4.8 8.0 ± 4.5 Never Tubaramure benef. 5.6 ± 5.5 5.6 ± 4.8 5.9 ± 6.2 4.4 ± 2.4
a Values are mean ± SD or %. All estimates account for clustering. b Sample size at baseline ranged from N = 182 to 2592 in the full sample; N = 34 to 427 in the T24 arm; N = 59 to 864 in the T18 arm; N = 27 to 427 in the TNFP arm; and N = 62 to 874 in the control arm. c Sample size at follow-up ranged from N = 41 to 2608 in the full sample; N = 3 to 430 in the T24 arm; N = 27 to 879 in the T18 arm; N = 5 to 431 in the TNFP arm; and N = 0 to 868 in the control arm.
* Study arms differ, p < 0.05.

Strengthening and Evaluating the PM2A Approach – Burundi Follow-Up Report: Children 0–23 Months
105
Table 68. IYCF practices: impacta
Impactb,c
T24 vs. control T18 vs. control TNFP vs. control
Breastfeeding
Child ever breastfed −0.41 ± 0.50 −0.05 ± 0.52 0.42 ± 0.57
Early initiation of breastfeeding (within 1 hour of birth) 4.54 ± 3.52 −1.37 ± 3.57 1.28 ± 3.53
Exclusive breastfeeding among children < 6 months of age −2.52 ± 6.66 −4.56 ± 5.30 −6.30 ± 8.17
Predominant breastfeeding among children < 6 months of age −0.73 ± 5.33 −0.04 ± 4.80 −2.95 ± 6.40
Continued breastfeeding at 1 year (12–15 months) 6.38 ± 3.70* 1.43 ± 2.62 2.52 ± 2.76
Continued breastfeeding at 2 years or age (20–23 months) 13.05 ± 8.55 −2.04 ± 6.20 9.27 ± 6.51
Age-appropriate breastfeeding 4.21 ± 2.86 −0.55 ± 1.92 −0.45 ± 2.20
Bottle feeding −0.82 ± 0.54 −0.28 ± 0.68 −1.07 ± 0.94
Milk feeding frequency for non-breastfed children (≥ 2 feedings/day) 12.26 ± 11.03 −3.92 ± 3.51 7.70 ± 7.73
Complementary feeding
Introduction of solid, semi-solid, or soft foods (6–8 months) 2.49 ± 5.77 6.23 ± 5.33 9.43 ± 9.03
Consumption of iron-rich or iron-fortified foods
All (6–23 months) 39.60 ± 4.49* 27.61 ± 4.32* 37.16 ± 4.39*
6–11 months 29.47 ± 5.71* 28.10 ± 5.36* 26.22 ± 4.94*
12–17 months 47.81 ± 7.97* 35.05 ± 4.78* 49.14 ± 5.84*
18–23 months 38.48 ± 7.77* 18.28 ± 7.17* 32.39 ± 9.18*
Minimum meal frequency
All (6–23 months) 8.41 ± 6.00 13.80 ± 4.28* 25.69 ± 5.18*
6–11 months 13.13 ± 10.75 15.59 ± 7.14* 34.39 ± 8.05*
12–17 months −8.62 ± 7.68 11.61 ± 7.77 17.27 ± 7.42*
18–23 months 15.40 ± 8.38* 14.47 ± 5.16* 32.61 ± 6.60*
Minimum dietary diversity (≥ 4 food groups)
All (6–23 months) 6.87 ± 4.03* 11.74 ± 4.66* 9.19 ± 4.28*
6–11 months −2.67 ± 5.40 13.78 ± 5.02* −0.05 ± 5.77
12–17 months 12.56 ± 10.49 14.49 ± 6.76* 11.73 ± 7.21
18–23 months 11.35 ± 7.94 7.28 ± 8.11 12.59 ± 9.41
Minimal acceptable diet
All (6–23 months) 5.36 ± 4.63 11.27 ± 2.98* 13.47 ± 3.67*
6–11 months −1.47 ± 4.22 13.61 ± 4.15* 8.54 ± 4.90*
12–17 months 3.33 ± 8.12 11.24 ± 5.74* 11.49 ± 5.89*
18–23 months 12.02 ± 7.75 8.04 ± 3.73* 19.80 ± 4.50* a Values are double difference impact estimates ± SE in percentage points when data from both surveys were available and simple difference impact estimates ± SE when only follow-up data were
available. All estimates account for clustering.
b Sample size ranged from N = 305 to 5200. c One-sided tests were conducted. The a priori hypothesis was a positive effect for all indicators, with the exception of bottle feeding for which the a priori hypothesis was negative.
* Impact estimate significantly different from 0, p < 0.05.

Strengthening and Evaluating the PM2A Approach – Burundi Follow-Up Report: Children 0–23 Months
106
10.2 Child Health The regular use of preventive health services for children 0–23 months of age appears to be uncommon and actually decreased between baseline and follow-up (Table 69). The majority of caregivers reportedly had a vaccination card for their children where vaccinations, micronutrient supplements, height or length, and weight could be recorded (78.7% at baseline and 93.5% at follow-up). The percentage who had the card available at the interview increased from 69.1% at baseline to 83.1% at follow-up. Fewer than one-third of children had attended growth monitoring in the past 2 months at baseline and this dropped to fewer than one-fifth at follow-up. Of these children, the percent who had their weight recorded decreased from around 87% to around 83%; the proportion who had their height or length recorded remained low at around 20%. In line with the low attendance rates at growth monitoring visits, only around 57% of the children 15–23 months of age35 had received vitamin A in the 6 months preceding the baseline survey, and a similar percent had received it at follow-up (60%). Among the group of children with a vaccination card available, around 70% of children were fully vaccinated for their age at baseline and this dropped to 63.2% at follow-up.
The program had a positive impact (2–9 percentage points) on the percent of mothers able to show a vaccination card for their child (statistically significant for TNFP) (Table 70). Tubaramure did not have an impact on growth monitoring attendance, which declined in all study groups (see Table 69). In the small subgroup of children who had a vaccination card and who attended growth monitoring in the past 2 months (n = 1094 at baseline and follow-up combined), the program appears to have increased the proportion whose weight was recorded on the vaccination card, but this effect was not statistically significant. Finally, Tubaramure did not have an impact on the percentage of children having received vitamin A supplementation in the last 6 months or being fully vaccinated for one’s age. The latter declined from baseline to follow-up (except for being fully vaccinated in the T24 group, which remained stable. See Table 69).
Illness was common among the children, and, alarmingly, severe illness was also common (Table 71). Around 44% of all children at baseline had experienced at least one symptom of illness in the past 2 weeks, and this percentage increased to around 52% at follow-up. The most commonly reported symptoms were fever (29.6% at baseline and 32.5% at follow-up), loss of appetite (27.3% at baseline and 32.3% at follow-up), coughing (31.0% at baseline and 35.6% at follow-up), and watery diarrhea (22.5% at baseline and 25.9% at follow-up). More than one in four children (25.7% and 28.0% at baseline and follow-up, respectively) had experienced severe diarrhea (defined as diarrhea with at least one of the following: fever, six or more loose stools per day, vomiting, not wanting to eat or drink, blood in the stool, or parents’ belief that the illness is not getting better) in the past 2 weeks, and between 3% and 4% of children at both surveys had experienced severe respiratory problems (cough in the past 2 weeks along with difficulty or fast breathing due to chest problems).
Tubaramure had large, consistent, and positive effects on reducing child morbidity despite the increase in reported symptoms from baseline to follow-up in all study groups (Table 72). The program thus appears to have protected children from the overall increase in child morbidity. As compared with the control group, the program reduced the proportion of children with morbidity symptoms by 7–12 percentage points (significant in all groups). Similarly, there was an impact on the prevalence of the most common symptoms of illness (fever, lost appetite, cough, and watery diarrhea; significant in the majority of study groups) and for less common (but important) health problems, such as difficulties with drinking, loss of appetite, and vomiting. The impact estimates for severe diarrhea (a 3–8 percentage-point protective effect) did not reach statistical significance (p = 0.054 in T24). No consistent program effect was found on the prevalence of potential pneumonia.
35 As vitamin A supplementation begins at 9 months this variable is tabulated for children 15–23 months.

Strengthening and Evaluating the PM2A Approach – Burundi Follow-Up Report: Children 0–23 Months
107
Table 69. Preventive health care practicesa
Baselineb Follow-upc
Full sample
Study arm Full sample
Study arm
T24 T18 TNFP Control T24 T18 TNFP Control
N 2617 431 870 431 885 2614 432 880 431 871
Vaccination card
Reported having a vaccination card 78.7 79.0 78.1 76.3 80.2 93.5* 96.1 90.9 95.6 93.9
Showed a vaccination card 69.1 71.8 67.8 64.7 71.4 83.1* 90.3 80.1 84.0 82.2
Growth monitoring
Attended growth monitoring in the last 2 months 29.0 35.3 29.7 32.3 23.7 19.3* 23.4 20.1 25.1 13.7
Weight recorded on vaccination card 87.1 86.3 87.0 87.7 87.5 82.6 86.0 81.6 92.4 72.6
Height/length recorded on vaccination card 19.0 16.3 24.3 21.9 13.0 20.7 24.4 13.4 35.5 15.2
Vitamins and vaccinations
Received vitamin A in last 6 monthsd 56.8 61.1 53.5 55.0 58.8 60.3 62.5 60.9 55.2 61.0
Fully vaccinated for age 69.6 73.5 66.0 67.3 72.1 63.2 73.8 57.9 59.0 64.7
a Values are %. All estimates account for clustering. b Sample size at baseline ranged from N = 642 to 2617 in the full sample; N = 129 to 431 in the T24 arm; N = 214 to 870 in the T18 arm; N = 114 to 431 in the TNFP arm; and N = 184 to 885 in the
control arm. c Sample size at follow-up ranged from N = 445 to 2614 in the full sample; N = 90 to 432 in the T24 arm; N = 157 to 880 in the T18 arm; N = 92 to 431 in the TNFP arm; and N = 105 to 871 in the control
arm. d Children 15–23 months of age.
* Study arms differ, p < 0.05.

Strengthening and Evaluating the PM2A Approach – Burundi Follow-Up Report: Children 0–23 Months
108
Table 70. Preventive health care practices: impacta
Impactb,c
T24 vs. control T18 vs. control TNFP vs. control
Vaccination card
Reported having a vaccination card 3.11 ± 6.01 −0.87 ± 3.80 5.61 ± 4.32
Showed a vaccination card 7.71 ± 6.00 1.91 ± 3.39 8.51 ± 4.49*
Growth monitoring
Attended growth monitoring in the last 2 months −1.34 ± 5.74 0.68 ± 5.63 3.59 ± 5.95
Weight recorded on vaccination card 16.93 ± 14.15 11.26 ± 13.82 20.48 ± 14.04
Height/length recorded on vaccination card 6.33 ± 7.91 −12.55 ± 8.73 12.42 ± 7.03*
Vitamins and vaccinations
Received vitamin A in last 6 monthsd 0.33 ± 7.85 5.97 ± 8.98 −0.87 ± 11.07
Fully vaccinated for age 6.97 ± 7.22 −0.93 ± 8.01 0.93 ± 7.26 1 Values are double difference impact estimates ± SE in percentage points when data from both surveys were available and simple difference impact estimates ± SE when only follow-up data were
available. All estimates account for clustering.
2 Sample size ranged from N = 1087 to 5231. 3 One-sided tests were conducted. The a priori hypothesis was a positive effect for all indicators. 4 Children 15–23 months of age.
* Impact estimate significantly different from 0, p < 0.05.

Strengthening and Evaluating the PM2A Approach – Burundi Follow-Up Report: Children 0–23 Months
109
Table 71. Child health and prevalence of morbidity symptomsa
Baselineb Follow-upc
Full sample
Study arm
Full sample
Study arm
T24 T18 TNFP Control T24 T18 TNFP Control
N 2623 432 870 433 888 2614 432 880 431 871
During the past 2 weeks, % who experienced:
Any illness 43.9 50.7 44.5 41.9 41.0 51.9 52.3 49.9 49.5 54.8
Fever 29.6 28.8 31.6 27.6 29.0 32.5* 27.2 31.4 27.2 39.1
Convulsions 5.6 5.6 4.6 5.8 6.3 5.7 5.6 5.4 4.4 6.7
Problems drinking 17.5 16.9 18.9 17.4 16.6 19.8* 16.4 17.5 18.0 24.7
Lost appetite 27.3 29.5 28.7 25.6 25.5 32.3* 27.8 30.3 31.1 37.1
Vomited all (s)he ate/drank 15.9 14.6 16.2 16.5 16.1 20.2* 16.9 18.4 16.4 25.5
Cough 31.0* 39.4 29.9 33.2 27.0 35.6 36.1 36.6 32.2 36.1
Difficulty breathing 20.0 21.6 20.3 19.5 19.1 23.7 22.2 25.2 19.4 24.9
Bloody diarrhea 3.3 4.2 3.2 3.7 2.7 3.6 2.6 3.9 3.5 3.7
Watery diarrhea 22.5 26.0 22.6 23.0 20.4 25.9 23.9 25.1 25.7 27.7
Other type of diarrhea 8.1 6.7 7.8 7.9 9.2 8.7* 6.1 10.8 7.9 8.2
During the past 2 weeks, % who suffered from a potentially morbid illness requiring; immediate medical attention
Severe diarrhead 25.7 29.0 25.5 26.5 23.9 28.0 26.1 27.6 28.3 29.2
Potential pneumoniae 3.8* 5.6 4.4 1.2 3.7 3.3* 1.6 4.2 2.3 3.6
a Values are %. All estimates account for clustering. b Sample size at baseline ranged from N = 2582 to 2623 in the full sample; N = 426 to 432 in the T24 arm; N = 851 to 870 in the T18 arm; N = 429 to 433 in the TNFP arm; and N = 873 to 888 in the
control arm. c Sample size at follow-up ranged from N = 2548 to 2614 in the full sample; N = 418 to 432 in the T24 arm; N = 859 to 880 in the T18 arm; N = 424 to 431 in the TNFP arm; and N = 847 to 871 in the
control arm. d Diarrhea with at least one of the following: fever, six or more loose stools per day, vomiting, not wanting to eat or drink, blood in the stool, or parents’ belief that the illness was not improving. e Cough in the past 2 weeks along with difficulty or fast breathing due to chest problems.
* Study arms differ, p < 0.05.

Strengthening and Evaluating the PM2A Approach – Burundi Follow-Up Report: Children 0–23 Months
110
Table 72. Child health and prevalence of morbidity symptoms: impacta
Impactb,c
T24 vs. control T18 vs. control TNFP vs. control
During the past 2 weeks, % who experienced:
Any illness −12.37 ± 6.49* −8.69 ± 3.24* −6.99 ± 4.09*
Fever −11.98 ± 3.97* −10.86 ± 2.64* −11.05 ± 3.56*
Convulsions −0.44 ± 1.89 0.14 ± 1.45 −1.87 ± 1.73
Problems drinking −8.69 ± 3.35* −9.76 ± 2.37* −7.80 ± 3.94*
Lost appetite −13.30 ± 4.49* −10.20 ± 2.73* −6.59 ± 3.13*
Vomited all (s)he ate/drank −7.29 ± 2.35* −7.34 ± 2.58* −9.86 ± 3.04*
Cough −12.48 ± 5.74* −2.52 ± 3.60 −10.53 ± 4.38*
Difficulty breathing −5.06 ± 3.63 −0.96 ± 2.49 −5.83 ± 3.30*
Bloody diarrhea −2.68 ± 1.28* −0.40 ± 1.09 −1.03 ± 1.41
Watery diarrhea −9.64 ± 4.93* −4.97 ± 4.37 −5.09 ± 4.47
Other type of diarrhea 0.26 ± 2.87 3.88 ± 2.45 0.78 ± 2.52
During the past 2 weeks, % who suffered from a potentially morbid illness requiring; immediate medical attention
Severe diarrhead −8.49 ± 5.19 −3.39 ± 4.44 −4.03 ± 4.27
Potential pneumoniae −3.86 ± 1.67* −0.06 ± 1.51 1.18 ± 0.90 a Values are double difference impact estimates ± SE in percentage points. All estimates account for clustering.
b Sample size ranged from N = 5130 to 5237. One-sided tests were used for all child morbidity symptoms, severe diarrhea, and potential pneumonia. c One-sided tests were conducted. The a priori hypothesis was a negative effect for all indicators. d Diarrhea with at least one of the following: fever, six or more loose stools per day, vomiting, not wanting to eat or drink, blood in the stool, or parents’ belief that the illness was not improving. e Cough in the past 2 weeks along with difficulty or fast breathing due to chest problems.
* Impact estimate significantly different from 0, p < 0.05.
Strengthening and Evaluating the PM2A Approach – Burundi Follow-Up Report: Children 0–23 Months
111
The majority of children who had a fever in the past 2 weeks received a fever-reducing medication, and this proportion increased over time in all study groups (70.1% at baseline and 87.7% at follow-up) (Table 73). Only around 40% of those with diarrhea at both surveys, however, had received ORS and, at both time points, 40% of mothers who had children with diarrhea reported reducing the child’s liquid intake when the child suffered from diarrhea. This is considerably higher than the already high proportion of mothers who reported believing that liquid intake should be reduced in sick children (Table 47). The proportion of mothers with a severely ill child who sought care from a trained professional increased from 67.7% at baseline to 78.6% at follow-up. Very few (< 1%) sought care from someone other than a trained professional, and the remainder did not seek care at all.
The program had a significant impact of 2–15 percentage points on the proportion of children who received medication to fight a fever (significant in the T24 and TNFP groups) (Table 74). This indicates that in addition to the general increase found in all study groups (Table 73), which might be due to Tubaramure’s health strengthening activities in all health centers, the program also increased the demand for this service at the household level in the treatment arms. No significant impact was found for any of the other curative care-seeking behaviors.
10.3 Child Development At baseline, the mean highest attained motor milestone among the full sample of children was standing alone for a long period of time, and there was no statistically significant difference across the groups (Table 75). At follow-up, there was a decrease in the highest average attained milestone to standing alone for a short period of time for the full sample, but there was again no statistically significant difference across the treatment groups. Among children between the ages of 12 and 23 months, there was also a decrease in the highest average motor milestone attained across the full sample (from climbing stairs to running) between the baseline and follow-up. In this age group, there was a statistically significant protective effect of the Tubaramure program for the TNFP arm compared to the control group in the decline of the highest average attained motor milestone (a 1.0 point effect) (Table 76).
With regard to language development, there were no meaningful changes in the highest average attained language milestone for the full sample or for the two age groups between baseline and follow-up (Table 75). However, the highest average attained language milestone among children in the control group declined between baseline and follow-up and stayed about the same for the children in the T24 and T18 groups (Table 75). This decline in highest attained language milestone in the control group between baseline and follow-up was more pronounced among children between the ages of 12 and 23 months of age. Conversely, there was a slight increase in the highest average attained language milestone for children in the T24 and T18 groups resulting in a significant impact of Tubaramure on improving children’s language development among the full sample (a 0.4 and 0.6 point effect for the T24 and T18 groups, respectively), with a stronger effect among children between the ages of 12 and 23 months (a 1.1 and 0.8 point effect for the T24 and T18 groups, respectively) (Table 76).

Strengthening and Evaluating the PM2A Approach – Burundi Follow-Up Report: Children 0–23 Months
112
Table 73. Treatment of illness and malnutritiona
Baselineb Follow-upc
Full sample
Study arm
Full sample
Study arm
T24 T18 TNFP Control T24 T18 TNFP Control
N 2617 432 869 432 885 2611 432 880 430 870
Fever
Received medication for fever 70.1* 59.2 71.2 65.8 76.3 87.7 89.7 85.0 89.7 88.5
Diarrhea:
Received ORS 38.7* 41.4 42.6 45.1 29.9 43.1 51.3 39.2 49.6 40.1
Liquids given; % who were given
Nothing or less than normal 39.8 45.2 33.9 39.8 42.9 42.6 35.0 42.6 39.7 47.5
Same as normal 16.4 17.5 17.8 10.6 17.4 14.9 16.2 17.5 11.1 13.6
More than normal 43.8 37.3 48.3 49.6 39.7 42.5 48.7 39.8 49.2 38.9
Children with symptoms requiring immediate medical attention (severe diarrhea or respiratory problems); % who:
Sought care/advice from trained professional 67.7 53.2 73.4 68.8 70.3 78.6 82.1 80.4 72.5 78.3
Sought care/advice from somebody else 0.5 0.8 0.5 0.0 0.5 0.3 0.0 0.4 0.0 0.4
Did not seek care 31.8 46.0 26.1 31.2 29.2 21.1 17.9 19.1 27.5 21.3
a Values are %. All estimates account for clustering. b Sample size at baseline ranged from N = 635 to 2617 in the full sample; N = 120 to 432 in the T24 arm; N = 207 to 869 in the T18 arm; N = 109 to 432 in the TNFP arm; and N = 195 to 885 in the
control arm. c Sample size at follow-up ranged from N = 705 to 2611 in the full sample; N = 106 to 432 in the T24 arm; N = 235 to 880 in the T18 arm; N = 117 to 430 in the TNFP arm; and N = 244 to 870 in the
control arm.
* Study arms differ, p < 0.05.

Strengthening and Evaluating the PM2A Approach – Burundi Follow-Up Report: Children 0–23 Months
113
Table 74. Treatment of illness and malnutrition: impacta
Impactb,c
T24 vs. control T18 vs. control TNFP vs. control
Fever
Received medication for fever 15.30 ± 5.92* 2.26 ± 5.06 10.34 ± 5.75*
Diarrhea
Received ORS −3.00 ± 8.44 −11.67 ± 6.49 −4.14 ± 8.11
Liquids given; % who were given
Nothing or less than normal −15.77 ± 9.69 1.95 ± 6.81 −7.98 ± 8.17
Same as normal 0.41 ± 5.54 3.33 ± 5.08 3.01 ± 5.66
More than normal 15.35 ± 9.74 −5.28 ± 8.73 4.97 ± 9.46
Children with symptoms requiring immediate medical attention (severe diarrhea or respiratory problems); % who:
Sought care/advice from trained professional 18.55 ± 9.83 −1.94 ± 8.65 −5.23 ± 9.27
Sought care/advice from somebody else −0.46 ± 0.97 0.49 ± 0.83 0.43 ± 0.39
Did not seek care −18.08 ± 9.35 1.45 ± 8.49 4.80 ± 9.09 a Values are double difference impact estimates ± SE in percentage points. All estimates account for clustering.
b Sample size ranged from N = 1340 to 5228. c One-sided tests were conducted. The a priori hypothesis was a positive effect for treatment of fever with medication and treatment of diarrhea with ORS.
* Impact estimate significantly different from 0, p < 0.05.

Strengthening and Evaluating the PM2A Approach – Burundi Follow-Up Report: Children 0–23 Months
114
Table 75. Motor and language milestones attaineda
Baselineb Follow-upc
Full sample
Study arm
Full sample
Study arm
T24 T18 TNFP Control T24 T18 TNFP Control
N 2282 358 764 373 789 2278 381 748 368 781
Highest motor milestone attained
All (4–23 months) 15.1 ± 6.7 15.2 ± 6.6 15.4 ± 6.5 15.0 ± 6.6 14.9 ± 6.9 14.6 ± 6.3 14.4 ± 6.3 14.6 ± 6.5 14.7 ± 6.6 14.6 ± 6.0
4–11 months 8.5 ± 4.7 8.6 ± 4.4 8.8 ± 4.5 8.8 ± 5.0 8.2 ± 4.8 8.9 ± 4.6 8.9 ± 4.3 8.6 ± 4.6 8.9 ± 4.6 9.3 ± 4.6
12–23 months 19.1 ± 4.0 19.2 ± 4.1 19.2 ± 4.1 18.8 ± 4.0 19.1 ± 4.0 18.6 ± 3.9* 18.7 ± 3.9 18.7 ± 3.9 19.1 ± 3.8 18.1 ± 3.9
Highest language milestone attained
All (4–23 months) 6.3 ± 4.3 6.2 ± 4.2 6.4 ± 4.3 6.3 ± 4.3 6.3 ± 4.3 6.1 ± 3.9 6.1 ± 4.1 6.3 ± 4.1 6.0 ± 4.0 6.0 ± 3.5
4–11 months 2.5 ± 2.2 2.5 ± 2.1 2.6 ± 2.1 2.7 ± 2.3 2.5 ± 2.2 3.0 ± 2.1 2.9 ± 2.1 2.8 ± 2.0 3.1 ± 2.6 3.2 ± 1.9
12–23 months 8.5 ± 3.6 8.3 ± 3.6 8.5 ± 3.6 8.5 ± 3.7 8.7 ± 3.4 8.3 ± 3.4* 8.5 ± 3.5 8.6 ± 3.4 8.3 ± 3.4 7.8 ± 3.1
3 Values are mean ± SD. All estimates account for clustering. 1 Sample size at baseline ranged from N = 856 to 2282 in the full sample; N = 134 to 358 in the T24 arm; N = 275 to 764 in the T18 arm; N = 143 to 373 in the TNFP arm; and N = 303 to 789 in the
control arm. 2 Sample size at follow-up ranged from N = 927 to 2278 in the full sample; N = 165 to 381 in the T24 arm; N = 300 to 748 in the T18 arm; N = 158 to 368 in the TNFP arm; and N = 304 to 781 in the
control arm.
* Study arms differ, p < 0.05.
Table 76. Motor and language milestones attained: impacta
Impactb,c
T24 vs. control T18 vs. control TNFP vs. control
Highest motor milestone attained
All (4–23 months) 0.16 ± 0.36 0.03 ± 0.34 0.35 ± 0.36
4–11 months −0.48 ± 0.41 −0.37 ± 0.42 −0.66 ± 0.38
12–23 months 0.44 ± 0.56 0.26 ± 0.44 1.00 ± 0.51*
Highest language milestone attained
All (4–23 months) 0.64 ± 0.27* 0.39 ± 0.23* 0.24 ± 0.28
4–11 months −0.08 ± 0.30 −0.20 ± 0.25 −0.21 ± 0.33
12–23 months 1.05 ± 0.40* 0.78 ± 0.32* 0.45 ± 0.35 a Values are double difference impact estimates ± SE in percentage points. All estimates account for clustering and control for child sex, child age, and maternal education.
b Sample size ranged from N = 1779 to 4544. c One-sided tests were conducted. The a priori hypothesis was a positive effect for all indicators.
* Impact estimate significantly different from 0, p < 0.05.
Strengthening and Evaluating the PM2A Approach – Burundi Follow-Up Report: Children 0–23 Months
115
10.4 Child Hemoglobin Levels and Anemia Status The mean Hb concentration among children 6–23 months of age at baseline was 10.6 g/dL, but this decreased to 10.1 g/dL at follow-up. Correspondingly, the prevalence of anemia increased from baseline (59.8%) to follow-up (72.9%). The lowest Hb concentrations (and the highest prevalence of anemia) at both baseline and follow-up were found in children 6–11 months of age (Table 77). The prevalence of severe anemia among children 6–23 months increased from 2.0% to 5.1% from baseline to follow-up. We do not know what might explain this increase in anemia.
The program had a protective effect on child Hb levels, i.e., the general decline in Hb levels observed in all study groups between surveys was less steep in the Tubaramure group than in the control group (Table 78). The estimated size of the protective effect was 0.2–0.6 g/dL (significant in the T24 and T18 groups; p-value in the TNFP group 0.054). The largest impacts were found in the youngest and oldest children. The estimated reduction in the prevalence of child anemia (1–9 percentage points) was only significant in the T18 group. The largest effect on the reduction in severe anemia was found in the oldest children, with effect sizes ranging from 4 to 6 percentage points (significant in the TNFP group, p-values in the T24 and T18 groups 0.09 and 0.11, respectively).
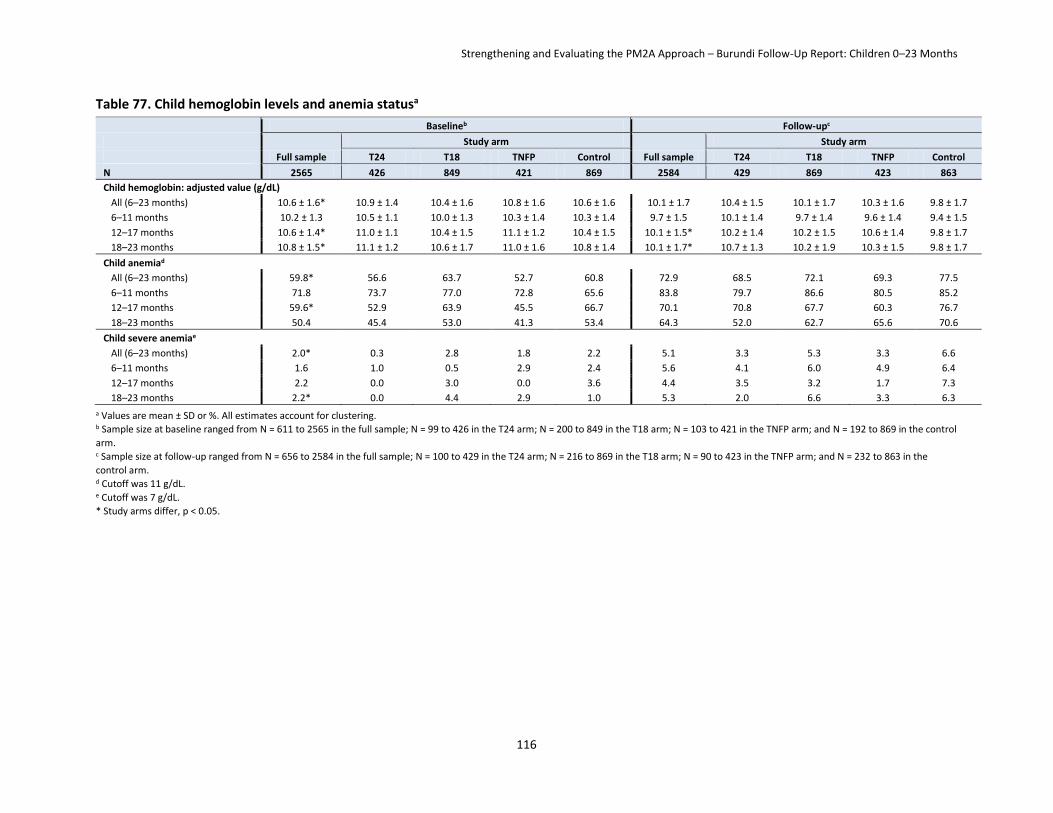
Strengthening and Evaluating the PM2A Approach – Burundi Follow-Up Report: Children 0–23 Months
116
Table 77. Child hemoglobin levels and anemia statusa
Baselineb Follow-upc
Full sample
Study arm
Full sample
Study arm
T24 T18 TNFP Control T24 T18 TNFP Control
N 2565 426 849 421 869 2584 429 869 423 863
Child hemoglobin: adjusted value (g/dL)
All (6–23 months) 10.6 ± 1.6* 10.9 ± 1.4 10.4 ± 1.6 10.8 ± 1.6 10.6 ± 1.6 10.1 ± 1.7 10.4 ± 1.5 10.1 ± 1.7 10.3 ± 1.6 9.8 ± 1.7
6–11 months 10.2 ± 1.3 10.5 ± 1.1 10.0 ± 1.3 10.3 ± 1.4 10.3 ± 1.4 9.7 ± 1.5 10.1 ± 1.4 9.7 ± 1.4 9.6 ± 1.4 9.4 ± 1.5
12–17 months 10.6 ± 1.4* 11.0 ± 1.1 10.4 ± 1.5 11.1 ± 1.2 10.4 ± 1.5 10.1 ± 1.5* 10.2 ± 1.4 10.2 ± 1.5 10.6 ± 1.4 9.8 ± 1.7
18–23 months 10.8 ± 1.5* 11.1 ± 1.2 10.6 ± 1.7 11.0 ± 1.6 10.8 ± 1.4 10.1 ± 1.7* 10.7 ± 1.3 10.2 ± 1.9 10.3 ± 1.5 9.8 ± 1.7
Child anemiad
All (6–23 months) 59.8* 56.6 63.7 52.7 60.8 72.9 68.5 72.1 69.3 77.5
6–11 months 71.8 73.7 77.0 72.8 65.6 83.8 79.7 86.6 80.5 85.2
12–17 months 59.6* 52.9 63.9 45.5 66.7 70.1 70.8 67.7 60.3 76.7
18–23 months 50.4 45.4 53.0 41.3 53.4 64.3 52.0 62.7 65.6 70.6
Child severe anemiae
All (6–23 months) 2.0* 0.3 2.8 1.8 2.2 5.1 3.3 5.3 3.3 6.6
6–11 months 1.6 1.0 0.5 2.9 2.4 5.6 4.1 6.0 4.9 6.4
12–17 months 2.2 0.0 3.0 0.0 3.6 4.4 3.5 3.2 1.7 7.3
18–23 months 2.2* 0.0 4.4 2.9 1.0 5.3 2.0 6.6 3.3 6.3
a Values are mean ± SD or %. All estimates account for clustering. b Sample size at baseline ranged from N = 611 to 2565 in the full sample; N = 99 to 426 in the T24 arm; N = 200 to 849 in the T18 arm; N = 103 to 421 in the TNFP arm; and N = 192 to 869 in the control
arm. c Sample size at follow-up ranged from N = 656 to 2584 in the full sample; N = 100 to 429 in the T24 arm; N = 216 to 869 in the T18 arm; N = 90 to 423 in the TNFP arm; and N = 232 to 863 in the
control arm. d Cutoff was 11 g/dL.
e Cutoff was 7 g/dL.
* Study arms differ, p < 0.05.

Strengthening and Evaluating the PM2A Approach – Burundi Follow-Up Report: Children 0–23 Months
117
Table 78. Child hemoglobin levels and anemia status: impacta
Impactb,c
T24 vs. control T18 vs. control TNFP vs. control
Child hemoglobin: adjusted value (g/dL)
All (6–23 months) 0.34 ± 0.20* 0.56 ± 0.18* 0.24 ± 0.14
6–11 months 0.36 ± 0.30 0.53 ± 0.22* 0.31 ± 0.19
12–17 months −0.16 ± 0.26 0.44 ± 0.24* 0.10 ± 0.25
18–23 months 0.61 ± 0.20* 0.58 ± 0.25* 0.29 ± 0.34
Child anemia
All (6–23 months) −5.61 ± 5.26 −8.69 ± 4.22* −0.97 ± 3.53
6–11 months −10.62 ± 10.47 −11.55 ± 8.41 −15.70 ± 6.88*
12–17 months 11.27 ± 7.54 −3.10 ± 6.19 6.70 ± 8.62
18–23 months −11.51 ± 6.91 −7.53 ± 6.04 3.77 ± 8.05
Child severe anemia
All (6–23 months) −1.38 ± 2.71 −1.96 ± 1.60 −3.08 ± 1.52*
6–11 months 0.09 ± 3.67 1.71 ± 2.33 −1.87 ± 2.11
12–17 months 0.14 ± 3.36 −3.00 ± 2.67 −1.28 ± 2.48
18–23 months −3.64 ± 2.65 −3.53 ± 2.90 −6.24 ± 3.64* a Values are double difference impact estimates ± SE in percentage points. All estimates account for clustering and control for altitude, child sex, and child age.
b Sample size ranged from N = 1308 to 4053. c One-sided tests were conducted. The a priori hypothesis was a positive effect for mean hemoglobin and a negative effect for anemia and severe anemia.
* Impact estimate significantly different from 0, p < 0.05.

Strengthening and Evaluating the PM2A Approach – Burundi Follow-Up Report: Children 0–23 Months
118
11. Summary of Findings along the Program Impact Pathways
In this section of the report, we summarize and discuss the key findings along the primary program impact pathways that correspond to the three program components: the food component, the health component, and the BCC component. We conclude with a section on the impacts on maternal and child Hb concentrations and anemia and child development.
11.1 The Tubaramure Food Component The food component of the Tubaramure program is expected to increase household availability of micronutrient-rich food and, in turn, consumption of such foods and to improve diet diversity. To achieve these goals, all beneficiaries enrolled in the Tubaramure program are supposed to receive a monthly household food ration and an individual food ration meant to be consumed by the woman while she is pregnant or when her child is under 6 months of age and by the child when it is 6–23 months of age.
The Tubaramure program was found to be well known by respondents, and a large proportion (75%–85%) of eligible households were either previous or current program beneficiaries. When asked about the program benefits and activities, nearly all current beneficiaries mentioned food rations. Notwithstanding the large distance to reach the distribution site (an average of 1.5 hours), missing a food distribution was rare and nearly all participants reported that they received CSB and oil as they expected. Many of the key program impacts, such as improvements in women’s dietary diversity (largest effect in the legumes group, a consequence of consuming CSB) and IYCF practices, appear to be a direct consequence of receiving the food rations (for instance, consumption of CSB led to a significant increase in the proportion of children consuming iron-rich or iron-fortified foods).
As would be expected with a program providing large food rations to food insecure households, Tubaramure had an important positive effect on household access to food as measured by the HFIAS (Coates et al. 2007). The program reduced the percentage of severely food insecure households by 9–18 percentage points. Tubaramure had a minimal impact on the low level of household dietary diversity (households consumed on average foods from only 4 food groups out of a possible 12).
Tubaramure had a small positive impact (ranging from 0.31 to 0.40 food groups) on the very limited diversity of mothers’ diets. The largest impact for a single food group was found for legumes, a direct consequence of CSB36 consumption in beneficiary mothers. The program also improved all complementary feeding practices. The largest impact was seen in the proportion of children consuming iron-rich foods (a 27–40 percentage point increase), which appeared to be directly related to the increased intake of CSB. A more modest positive impact (5–26 percentage points) was found for the other three complementary practices we assessed: the proportion of children receiving the minimum recommended number of meals, the proportion of children receiving the minimum dietary diversity (which appears to be a consequence of CSB consumption), and the percentage of children consuming a minimally acceptable diet.
11.2 The Tubaramure BCC Component Tubaramure’s BCC strategy was designed specifically to address many of the underlying causes of undernutrition in Burundi and to encourage the adoption of best practices in health, hygiene, and nutrition. The BCC strategy was designed to be implemented by program staff, locally hired THPs, and
36 As indicated previously, CSB, consisting of corn and soy, contributed to the starchy staples and legumes group when we assessed women’s (and children’s) dietary diversity.

Strengthening and Evaluating the PM2A Approach – Burundi Follow-Up Report: Children 0–23 Months
119
leader mothers who are program beneficiaries selected by their fellow beneficiary mothers to teach them. Leader mothers are expected to train the beneficiary mothers in care groups (which should meet every 2 weeks) on the topics that they have most recently learned from the THP.
When asked about the program benefits and activities, four-fifths of all current beneficiaries mentioned BCC sessions. Participation in the care groups, however, was considerably less common than attending food ration distributions: Attendance was only around half of what is intended by the Tubaramure program design. Exposure to cooking demonstrations was even lower, as only half the mothers who had ever participated in a care group reported that a cooking demonstration had ever been offered.
11.2.1 Health and Nutrition Knowledge
The program had no significant effect on mothers’ very limited knowledge of danger signs during pregnancy or for childhood illnesses. As a matter of fact, the number of signs mothers could mention decreased considerably from baseline to follow-up in both the Tubaramure and control groups. However, the program did substantially reduce the large proportion of mothers who previously believed that children’s breast milk, liquid, and food intake should be reduced when they are ill.
Surprisingly, for a program aimed at improving child nutritional status, Tubaramure had no clear impact on mothers’ limited knowledge of the reasons for child malnutrition or the foods essential for child growth. The program clearly increased awareness of vitamin A- and iron-rich foods, but did not change the percentage of mothers who knew the consequences of vitamin A or iron deficiency.
Tubaramure had a positive (but modest) effect on the limited knowledge related to complementary feeding. The program significantly reduced the percentage of mothers who thought that liquids and foods other than breast milk should be introduced before 6 months of age. Importantly, the program did not reduce the common belief that complementary foods should be introduced after 6 months of age. However, the program substantially increased the percentage of mothers who knew the correct feeding frequency for infants and young children.
The program dramatically increased the percentage of mothers who knew handwashing with soap is important after toilet use and before feeding a child. However, Tubaramure had no clear effect on maternal awareness of appropriate worm-protection methods, and no significant effect was observed on knowledge of appropriate methods for purifying drinking water.
In summary, Tubaramure’s impact on maternal health and nutrition knowledge was mixed, with clear improvements in knowledge related to specific optimal practices (e.g., feeding frequency) and no detectable effect in areas where key health and nutrition knowledge should be improved (e.g., danger signs, reasons for undernutrition). Several factors may explain the limited impact of the program on health and nutrition knowledge. First, mothers were exposed to only about half of the intended BCC sessions. Second, the process evaluation revealed that Tubaramure’s BCC strategy suffered significant delays in the design and rollout of the module on complementary feeding. As a result, only a fraction of mothers had been exposed to this module at the time of the follow-up survey. The process evaluation further showed that the leader mothers had limited technical expertise and teaching skill (Olney et al. 2013). Better delivery and utilization of the BCC strategy might have resulted in a larger impact on maternal knowledge, better health and nutrition practices, and a larger impact on nutritional status.
11.2.2 Hygiene and Sanitation Practices
Tubaramure had a modest positive impact on household hygiene and sanitation practices. The percentage of households that treated their water increased only slightly, but a considerable effect was found on the

Strengthening and Evaluating the PM2A Approach – Burundi Follow-Up Report: Children 0–23 Months
120
proportion of households that composted their trash rather than discarding it in a public space. The importance of composting was emphasized on a household poster provided to all Tubaramure households. No significant impact by Tubaramure on bednet ownership or use was observed. Even though most households owned soap, it was rarely used at key handwashing times. The effect of Tubaramure was limited to a small increase in the proportion of households reporting the use of soap after defecating. In a spot-check of hands, hair, clothes, and face of mothers and children, Tubaramure was found to somewhat improve cleanliness on all four domains. The percentage of households with clean exteriors and interiors also improved.
11.2.3 Impact on IYCF
Breastfeeding practices among this population were optimal in many aspects at baseline and continued to improve between surveys. Tubaramure did not have a significant effect on any breastfeeding practices, with the exception of an increase in the percentage of children who were still breastfed at 1 year of age. Tubaramure did lead to a significant improvement in complementary feeding practices.
11.2.4 Impact on Preventive and Curative Care Seeking and Child Health
Tubaramure did not have an impact on the reported attendance at growth monitoring services or any of the other types of preventive health care utilization. The general decline in growth monitoring attendance (from one-third to one-fifth in the 2 months preceding the survey), the low percentage of children having received vitamin A supplementation in the 6 months preceding the survey (57% at baseline and 60% at follow-up), and the percentage being fully vaccinated for their age (from 70% to 63%) is of great concern.
Tubaramure protected children from the overall increase in child morbidity observed from baseline to follow-up. Said differently, the increase in reported symptoms from baseline to follow-up was not as steep (or absent) in the Tubaramure groups as in the control group. Significant program effects were found for general morbidity symptoms and for key problems, such as fever, lost appetite, cough, watery diarrhea, difficulty drinking, loss of appetite, and vomiting.
The program had a significant positive impact on the proportion of children who received medication to fight a fever (significant in the T24 and TNFP groups). This indicates that in addition to the general increase in this indicator found in all study groups, which might be due to Tubaramure’s health strengthening activities, the program also increased the demand for this service at the household level in the treatment arms. No significant impact was found for any of the other curative care-seeking behaviors, which were found to be largely inadequate: Only around 40% of children with diarrhea had received ORS and approximately 40% of mothers reported reducing the child’s liquid intake during diarrhea.
11.3 The Tubaramure Health Component Tubaramure’s health systems strengthening component aimed to improve the quality of preventative and curative care provided at public health centers. Health systems strengthening was implemented in all health centers regardless of whether they were located in a treatment or control colline, and the lack of a control group prevents attributing any changes in health center characteristics directly to Tubaramure (see Section 2.4.7). Differences between baseline and follow-up suggest that several aspects of health service delivery may have improved, and findings also reveal further areas for improvement.
11.3.1 Health Services
More health centers staffed A2 level nurses, who are the highest qualified staff members mandated for health centers, and more (though still only two) staffed an A2 level laboratory technician. Overall, key service components for sick children, children with diarrhea, and for pregnant women and mothers

Strengthening and Evaluating the PM2A Approach – Burundi Follow-Up Report: Children 0–23 Months
121
improved over time. However, there were several exceptions to this general trend. First, zinc supplementation was rarely offered to children with diarrhea. Additionally, when treating sick children, some health centers failed to use curative consultations as an opportunity to monitor preventative care status (chart weight, evaluate immunizations status, and evaluate having received a Vitamin A supplement every 6 month). This is a missed opportunity for families who do not otherwise seek preventative health care services for their children.
For women seeking prenatal care there were small improvements in the availability of services However, iron folate distribution was still not universal. On a more positive note, malaria and HIV testing were available to pregnant mothers at every health center, suggesting a strong potential to provide laboratory tests when other key components (e.g. training, supplies) are in place. Despite offering these tests to assess malaria and HIV, other basic laboratory services, such as urine and anemia tests, were offered in only one health center.
Medication and immunization shortages were common and likely limited successful provision of many services. Ensuring the continuous supply is a challenging but important component of successfully providing health services to these communities. However, these aspects of service delivery are beyond the scope of Tubaramure.
11.3.2 Impact on the Use of Pre-, Peri- and Postnatal Health Care Practices
Tubaramure had no significant impact on the already high percentage of mothers who received prenatal care or on whether mothers consulted health professionals for prenatal care. The intervention increased the “demand” for prenatal services: it increased the total number of prenatal visits, led to a substantial increase in the percentage of mothers who had at least four prenatal visits, and caused women to have their first prenatal visit a week to 10 days earlier in pregnancy. The only possible “supply” effect on the types of services received during prenatal visits was observed for providing a blood sample. Other key services, such as checking blood pressure and testing urine samples, remained unacceptably low.
An alarming finding is the dramatic drop in the proportion of women taking iron supplements during pregnancy, the opposite of what would be expected if Tubaramure had had a positive supply effect. The positive changes over time in the use of malaria prevention (anti-malarial medication and sleeping under a bednet) were seen in all groups, which suggests a possible Tubaramure supply effect.
The percentage of mothers delivering at a public health facility increased considerably, which might be due to Tubaramure’s health strengthening activities. Similar positive effects were found for the percentage of births attended by a trained health professional, the percentage of newborn infants immediately cleaned and wrapped (two important strategies to prevent hypothermia), and the percentage of newborns weighed at delivery.
The program had no supply or demand effect on the very low percentage of women taking iron supplements after giving birth.
11.4 Impact on Maternal Nutrition and Child Nutrition and Development The three Tubaramure components discussed above (food, BCC, and health) were expected to have impacts on maternal nutrition and on child nutrition and development, as discussed below.

Strengthening and Evaluating the PM2A Approach – Burundi Follow-Up Report: Children 0–23 Months
122
11.4.1 Hemoglobin Level and Anemia
Consistent with the decrease in the use of iron supplements during pregnancy, we found an overall steep increase in the prevalence of anemia of about 15 percentage points between surveys. The program’s protective effect on the prevalence of anemia (4.2 to 7.5 percentage points) was modest.
A similar trend was found in children. We observed an overall decline over time in mean hemoglobin concentration among children 6 to 23 months of age and correspondingly, an increase in the prevalence of anemia (to around 73%). The intervention had a protective effect on children’s Hb levels, i.e. the general decline in Hb levels observed in all study groups between surveys was less steep (0.24 to 0.56 g/dL) in the three Tubaramure groups than in the control group.
11.4.2 Impact on Child Development
We also observed a general decline between surveys in the highest attained language and motor milestones among children 4 to 23 months of age. The program was found to have a protective effect on the highest attained motor milestone in the TNFP group and on the highest attained language milestone in the T24 and T18 groups.

Strengthening and Evaluating the PM2A Approach – Burundi Follow-Up Report: Children 0–23 Months
123
12. References
Ballard, T.; Coates, J.; Swindale, A.; and Deitchler, M. 2011. Household Hunger Scale: Indicator Definition and Measurement Guide. Washington, DC: FHI 360/FANTA.
Coates, J.; Swindale, A.; and Bilinsky, P. 2007. Household Food Insecurity Access Scale (HFIAS) for Measurement of Food Access: Indicator Guide. Washington, DC: FHI 360/FANTA. pp. 1–36.
Cogill, B. 2003. Anthropometric Indicators Measurement Guide. Washington, DC: FHI 360/FANTA. pp. 1–93.
Deitchler, M.; Ballard, T.; Swindale, A.; and Coates, J. 2010. Validation of a measure of household hunger for cross-cultural Use. Washington, DC: FHI 360/FANTA.
EICV. 1998. Rwanda enquête intégrale sur les conditions de vie des ménages (EICV).
Food Security and Nutrition Working Group. 2010. FSNWG Update: Central and Eastern Africa. pp. 11–12).
Griffiths, R. 1970. A comprehensive system of mental measurement for the first eight years of life. London: Child Development Research Centre.
IFAD. 2012. Enabling poor rural people to overcome poverty in Burundi. Rome. pp. 1–12.
ISTEEBU and INSP. 2011. Enquête démographique et de santé Burundi 2010 - rapport préliminaire (pp. 1–35). Bujumbura, Burundi.
International Nutritional Anemia Consultative Group. 2002. Adjusting hemoglobin values in program survey. Geneva. pp. 1–6.
Kennedy, G.; Ballard, T.; and Dop, M. 2011. Guidelines for measuring household and individual dietary diversity.
McCarthy, D. 1972. Manual for the McCarthy scales of children’s abilities. New York: Psychological Corporation. pp. 1–209.
Ministère de la Santé Publique. 2010. Module formation CPN (consultation prénatale) focalise. Bujumbura, Burundi.
Ministère de la Santé Publique/WHO. 2007. Les normes sanitaires pour la mise en œuvre du Plan National de Développement Sanitaire 2006–2010 au Burundi. Bujumbura, Burundi: Ministère de la Santé Publique/WHO.
Ministère de la Santé Publique et de la Lutte contre le SIDA. 2012a. La liste nationale des médicaments essentiels. 7th edition. Bujumbura, Burundi.
———. 2012b. Normes sanitaires pour la mise en oeuvre du Plan National de Développement Sanitaire 2011–2015 au Burundi. Bujumbura, Burundi.
Olney, D.K. et al. 2009. “Development of nutritionally at-risk young children is predicted by malaria, anemia, and stunting in Pemba, Zanzibar.” Journal of Nutrition, 139, 763–772. doi:10.3945/jn.107.086231.of.
Strengthening and Evaluating the PM2A Approach – Burundi Follow-Up Report: Children 0–23 Months
124
Olney, D. et al. 2013. A Process Evaluation of the Tubaramure Program for Preventing Malnutrition in Children under 2 Approach (PM2A) in Burundi. Washington, DC: FHI 360/FANTA.
Parker, M. et al. 2012. Strengthening and Evaluating the Preventing Malnutrition in Children under 2 Approach (PM2A) in Burundi: Baseline Report. Washington, DC: FHI 360/FANTA. pp. 1–131.
Rao, J. and Scott, A. 1984. “On chi-squared tests for multiway contingency tables with cell proportions estimated from survey data.” Annals of Statistics. 12, 6–60.
StataCorp. 2009. Stata Statistical Software: Release 11. College Station, TX: StataCorp LP.
Stevens, G.A. et al. 2013. “Global, regional, and national trends in haemoglobin concentration and prevalence of total and severe anaemia in children and pregnant and non-pregnant women for 1995–2011: a systematic analysis of population-representative data.” The Lancet Global Health. 1(1), e16–e25. doi:10.1016/S2214-109X(13)70001-9.
Stoltzfus, R.J. et al. 2001. “Effects of iron supplementation and anthelmintic treatment in Zanzibar: double blind, placebo controlled study.” British Medical Journal. 323, 1–8.
Swindale, A. and Bilinsky, P. 2006. Household Dietary Diversity Score (HDDS) for Measurement of Household Food Access: Indicator Guide Version 2. Washington, DC: FHI 360/FANTA.
UN Stats. 2009. Recensement general de la population et de l’habitat 2008: resultats preliminaires commentés. Bujumbura, Burundi.
UNICEF. 2002. Facts for life (3rd ed.). New York: UNICEF. pp. 1–175.
United Nations Department of Economic and Social Affairs Statistics Division. 2005. Household sample surveys in developing and transition Countries. No. 96. New York. pp. 1–655).
UNDP. 2013. Human Development Report 2013. The rise of the south: human progress in a diverse world. New York. pp. 1–216.
WHO Expert Committee on Physical Status. 1995. Physical status: the use and interpretation of anthropometry. Geneva: WHO. pp. 1–47.
WHO Multicentre Growth Reference Study Group. 2006. WHO child growth standards: Length/height-for-age, weight-for-age, weight-for-length, weight-for-height and body mass index-for-age: methods and development. Geneva: WHO. pp. 1–336.
———. 2012. Economics database.
———. 1994. A user’s guide to the self-reporting questionnaire (SRQ). Geneva: World Bank. pp. 1–90.
———. 2008. Indicators for assessing infant and young child feeding practices: part 1 definitions. Geneva: WHO.
———. 2010. Indicators for assessing infant and young child feeding practices: part 2 measurement. Geneva: WHO. pp. 1–91.
———. 2011a. Hemoglobin concentrations for the diagnosis of anaemia and assessment of severity. Geneva: Vitamin and Mineral Nutrition Information System. Geneva: WHO.

Strengthening and Evaluating the PM2A Approach – Burundi Follow-Up Report: Children 0–23 Months
125
———. 2011b. Iron Deficiency Anaemia Assessment, Prevention, and Control: A guide for programme managers.
World Bank. 2011. Poverty headcount ratio at $1.25 a day (PPP) (% of population).

Strengthening and Evaluating the PM2A Approach – Burundi Follow-Up Report: Children 0–23 Months
126
Appendix 1. Monthly Ration Size for the Tubaramure Beneficiary Population
CSB Vegetable oil Energy/ month Energy/daya
Energy/day/ capitab
(kg) (g) (kcal) (kcal) (kcal)
Target groupc
Pregnant/lactating women 6 600 27,846 915 158c
Children under 2 3 300 13,923 458 79c
Family ration 12 1,200 55,692 1,831 316
Total ration
Pregnant/lactating women 18 1,800 83,538 2,746 474
Children under 2 15 1,500 69,615 2,288 395 a Energy per day is calculated using 30.42 days/month. b Energy per capita is calculated based on the assumption of 5.8 average household size. c Note that the individual ration is not meant to be shared, but this may be difficult to achieve, as the individual and the family ration include
the same foods.

Strengthening and Evaluating the PM2A Approach – Burundi Follow-Up Report: Children 0–23 Months
127
Appendix 2. List of Collines according to Study Treatment Arm
Province Commune Colline Study arma
Cankuzo Cankuzo Kabezera T18
Cankuzo Cankuzo Murehe TNFP
Cankuzo Cankuzo Muterero T24
Cankuzo Cankuzo Nyarutiti T24
Cankuzo Cendajuru Gashirwe Control
Cankuzo Cendajuru Gitaramuka TNFP
Cankuzo Cendajuru Kabageni TNFP
Cankuzo Cendajuru Nyamugari T18
Cankuzo Gisagara Gerero T18
Cankuzo Gisagara Gisagara T24
Cankuzo Gisagara Gitwenge TNFP
Cankuzo Gisagara Kibogoye T24
Cankuzo Gisagara Murago Control
Cankuzo Kigamba Rujungu T18
Cankuzo Kigamba Rwamvura TNFP
Cankuzo Kigamba Shinge T24
Cankuzo Mishiha Buyongwe 1 Control
Cankuzo Mishiha Mwiruzi Control
Cankuzo Mishiha Rugerero Control
Cankuzo Mishiha Rutsindu T18
Ruyigi Butaganzwa Gikwiye TNFP
Ruyigi Butaganzwa Kanyinya TNFP
Ruyigi Butaganzwa Kirangara Control
Ruyigi Butaganzwa Kiyabu T24
Ruyigi Butaganzwa Masazi T24
Ruyigi Butaganzwa Muriza T18
Ruyigi Butaganzwa Nyagashubi T24
Ruyigi Butaganzwa Taba T18
Ruyigi Butezi Bwagiriza T24
Ruyigi Butezi Muyange TNFP
Ruyigi Butezi Nombe T24
Ruyigi Butezi Rutegama Control
Ruyigi Bweru Gatwaro TNFP
Ruyigi Bweru Kirambi T18
Ruyigi Bweru Mubavu T24
Ruyigi Bweru Nkanda T24
Ruyigi Bweru Nyarunazi T24
Ruyigi Gisuru Bunyambo T24
Ruyigi Gisuru Kabingo T18
Ruyigi Gisuru Kabuyenge Control
Ruyigi Gisuru Kinama TNFP
Ruyigi Gisuru Mwegereza T18
Ruyigi Gisuru Nkurubuye Control

Strengthening and Evaluating the PM2A Approach – Burundi Follow-Up Report: Children 0–23 Months
128
Province Commune Colline Study arma
Ruyigi Gisuru Nyabigozi T24
Ruyigi Gisuru Rwerambere TNFP
Ruyigi Gisuru Taba Control
Ruyigi Kinyinya Bugongo TNFP
Ruyigi Kinyinya Gataba Control
Ruyigi Kinyinya Kabanga TNFP
Ruyigi Kinyinya Kinyinya TNFP
Ruyigi Kinyinya Nyakibere Control
Ruyigi Kinyinya Nyamusasa T18
Ruyigi Kinyinya Vumwe Control
Ruyigi Nyabitsinda Nyakiyonga Control
Ruyigi Nyabitsinda Nyarumuri T18
Ruyigi Nyabitsinda Remba T18
Ruyigi Ruyigi Bunogera Control
Ruyigi Ruyigi Buruhukiro T18
Ruyigi Ruyigi Rutonganikwa T18
Ruyigi Ruyigi Ruyigi rural TNFP a T24: 15 collines assigned to the intervention arm receiving the full Tubaramure program from pregnancy to 24 months
T18: 15 collines assigned to the intervention arm receiving the full Tubaramure program from pregnancy to 18 months
TNFP: 15 collines assigned to the intervention arm receiving the full Tubaramure program from pregnancy to 24 months, without food rations
during pregnancy
Control: 15 collines assigned to the control arm of the research study.
More details are provided in the text.