
Steel Girders by Spacecchem Engineers | Girders for Bridges | Beams
-
STRENGTH OF SHIP HULL GIRDERS
UNDER
MOMENT, SHEAR AND TORQUE
by
Yaofeng Chen
A Thesis
Presented to the Graduate Committee
of Lehigh University
in Candidacy for the Degree of
Master of Science
in
Civil Engineering
Lehigh University
1992

ACKNOWLEDGMENTS
This thesis is based on a research project "Ultimate Strength of
Ship Hull Girders under Moment, Shear and Torque", presently conducted
at the Fritz Engineering Laboratory, Department of Civil Engineering,
Lehigh University, Bethlehem, Pennsylvania. Dr. Lynn S. Beedle is
Director of Laboratory and Dr. David A. VanHorn is chairman of the
Civil Engineering Department. The project is sponsored by the
Maritime Administration University Research Program of the Department
of Commerce (Contract No. MABO-SAC-01081 ).
The author is deeply indebted to Dr. Alexis Ostapenko, thesis
supervisor, for his continued guidance, encouragement and cooperation.
Many thanks are due to the author's wife Meng-Ling and Miss
Shirley Matlock for their help in producing the manuscript, and Mr.
Peter A. Ostapenko for reducin~ the test data used in this thesis.
iii

Table of Contents
ACKNOWLEDGMENTS ABSTRACT 1. INTRODUCTION 1.1 Background 1.2 Purpose and Scope 2. THEORETICAL ANALYSIS 2.1 Elastic Analysis
2.1.1 Introduction 2.1.2 Flexural Stresses 2.1.3 Shearing Stresses 2.1.4 Torsional Stresses
2.2 Non-Linear Behavior 2.3 Behavior of Compression Flange
2.3.1 Introduction 2.3.2 Beam-Column 2.3.3 Effect of Strain Reversal
2.4 Stresses in Web 2.4.1 Prebuckling and Buckling Behavior 2.4.2 Post-Buckling Behavior
3. EFFECT OF WARPING 3.1 Introduction 3.2 Elastic Analysis of Warping 4. DESCRIPTION OF THE METHOD OF ANALYSIS 5. COMPUTER PROGRAMS 5.1 Introduction 5.2 Computer Program for Stiffened Plate
5.2.1 Brief Description 5.2.2 Extrapolation
5.3 Box Girder Computer Program 5.3.1 Background and Assumptions 5.3.2 Computational Procedure
6. DESCRIPTION OF HULL GIRDER TESTS 6.1 Test Specimen 6.2 Test Setup 6.3 Loading Conditions 6.4 Analysis of Test 3 7. SUMMARY, CONCLUSIONS AND RECOMMENDATIONS 7.1 Summary 7.2 Conclusions 7.3 Recommendations TABLES FIGURES REFERENCES VITA
iv
iii
1 3 3 4 6 6 6 6 7 7
10 12 12 13 14 1 5 15 16 19 19 19 23 27 27 28 28 29 31 31 33 35 35 36 37 39 42 42 44 45 46 47 67 70
ABSTRACT
A method for the determination of the behavior and ultimate
strength of longitudinally stiffened single-cell ship hull girders
under the combined l0ading of moment, shear and tor~ue is described.
The main features are: (1) Individual components are analysed under
the re~uirement of deformational compatibility among them; (2) The
compression flange is assumed to be made up of parallel beam-columns
with the axial force for each defined as a function of the axial
deformation (buckling, plastification and large deformation are taken
into account); (3) A multiple tension-field action is considered for
the webs in the post-buckling stage; (4) Warping of the cross section
is incorporated by assuming linear variation of the average axial
deformations across the width of each component (flange or web) of the
cross section, but without re~uiring that the cross section remain
plane.
A previously developed computer program was modified to carry out
the analysis, with some data obtained in experiments used as input.
This method of analysis shows a better correlation with the
experimental results than the method used previously, although the
prediction is still somewhat optimistic with respect to the test
results.

The following topics are recommended for future investigation:
(1) Inclusion of the effect of shear lag on the behavior of flanges ;
(2) Inclusion of the effect of shearing stress on the behavior of the
plate components in the compression flange; (3) Formulation of an
energy criterion for determining the optimum degree of warping.
2

1. INTRODUCTION
1.1 Background
In the conventional methods of ship design, the strength of ship
hull is based on the linear elastic response of the hull components.
The section modulus plays an important role in computing the ship hull
bending strength. However, more often than not the strength of a ship
hull implied by the safety factor is not an accurate indicator of the
true ultimate strength. With the growing knowledge of wave loading
and the introduction of novel ship types (large tankers, container and
special purpose ships), the need for a more realistic evaluation of
ship ultimate strength is becoming more important.
Much research has been done on the ultimate strength of
individual ship hull components; plate f9, 11, 14], stiffened plate
and grillages f4, 6, 10, 20, 2?], and plate girders
~1, 2, 3, 8, 13, 15, 16, 21, 24, 261. Caldwell proposed a method of
considering the fully plastified cross section in computing the
bending moment, for which the post buckling plate strength would be
determined by using an eff~ctive width at the maximum plate capacity
[5). In the method developed previously in the current research for
computing the ultimate strength of ship hull girder under moment ,
shear and torque, the compression flange was treated as a series of
identical beam-columns having the same axial deformations. The
3

buckling and the post-buckling tension field action of the webs were
considered ~17]. The method was found to be reasonably accurate for
moment and shear loading but over-optimistic for moment, shear and
torque. The method presented here represents a further development of
that method.
1.2 PurpQse and Scope
The main purpose of this research was to continue the development
of the method for determining the ultimate strength of ship hull
girders under the general loading of bending moment, shear and torque.
Treatment of the individual components of the ship hull girder is the·
same as in the previous formulation. The ship hull girder is modeled
by a box girder stiffened both in the longitudinal and transverse
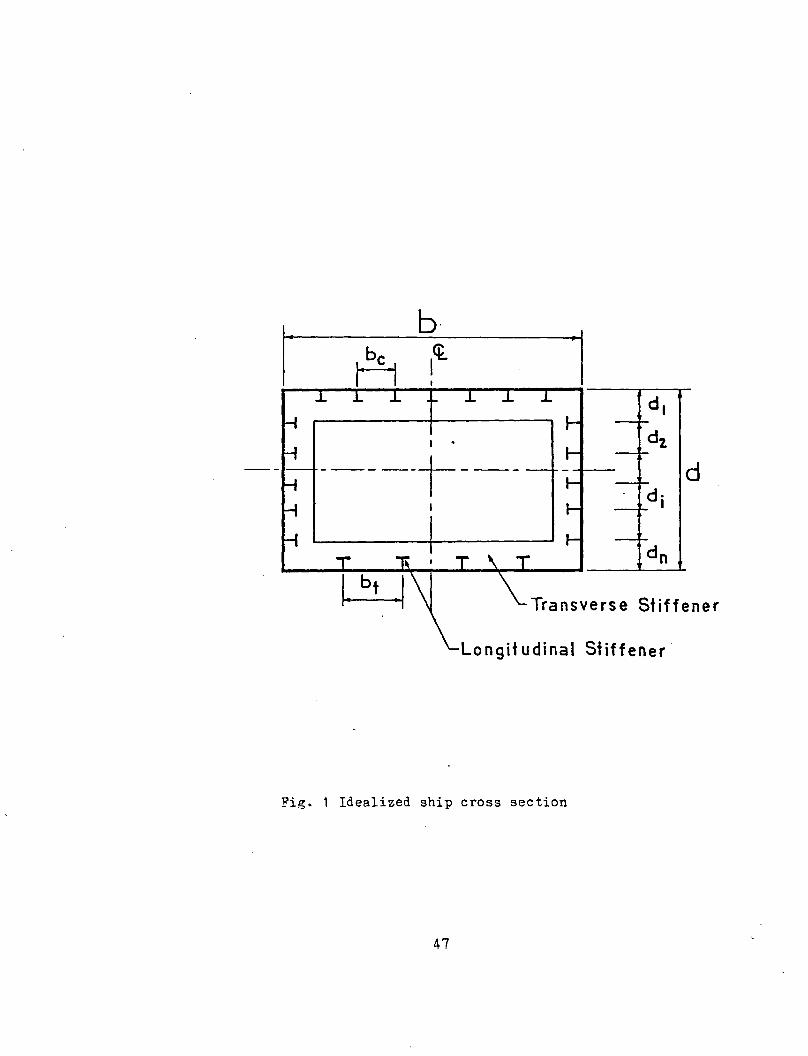
directions. A typical cross section is shown in Fig. 1 where the
transverse stiffeners represent transverse frames or bulkheads in the
ship hull and the longitudinally stiffened webs and flanges represent
the sides, the deck and the bottom plating.
A fixed relationship between the cross-sectional forces (moment,
shear and torque) was assumed for the hull segment to exist at all
levels of loading. In analyzing the individual components of the ship
hull, the methods derived in prior research were applied to determine
the behavior and the ultimate strength of ship bottom plating and side
4

plating. For the plating of the compression flange, a previously
developed crimputer program was adopted to obtain the axial load vs.
average axial deformation relationship (22]. The following principal
improvements were made in the method of analysis of the hull girder:
(1) Inclusion of the effect of warping, by considering linearly
varying axial deformation across the width of the flanges; (2) An
equilibrium formulation in which both, the axial force and the bending
moment about the vertical centroidal axis, should be equal to zero.
A test specimen from the previous research was analyzed by this
method and the computed output was compared with the test results.
The comparison indicates the direction for future research to more
accurately predict the behavior of ship hull girders.
5

2. THEORETICAL ANALYSIS
2.1 Elastic Analysis
2.1.1 Introduction
Although elastic analysis is not applicable for computing the
ultimate and post-ultimate behavior, it is suitable for describing the
behavior of a hull girder under external loading up to the initiation
of non-linear effects due to buckling, yielding or second-order
deformations. Thus, linearly elastic analysis of a hull girder is
valid under the following conditions:
1. The material properties of all components are linearly elastic.
2. The member is straight and prismatic with the distortion of the cross section being negligible.
3. Residual stresses are small.
2.1.2 Flexural Stresses
Flexural stresses in the box girder cross section can be closely
approximated by the simple beam theory :
( 2.1 )
where moments Mx, !liy' and Ix, Iy refer to the principal centroidal
axes x and y.
6

2.1.3 Shearing Stresses
For single-cell thin-walled closed sections loaded in the plane
of symmetry the shearing stress is given by:
(2.2)
where t is the wall thickness , qopen is the shear flow for the open
section made by introducing an arbitrary cut in the closed section
(usually at the vertical axis of symmetry for a symmetrical section),
q0
is the additional shear flow in the plate required to maintain no
relative displacement between the two edges of the cut.
homogeneous section, q0
is given by:
jc qopen/t)ds qo = )r(d;/t)d;----
For a
where s is measured. from one end of the cut to the other [ 7 J. Note
that longitudinal stiffeners on the webs and flanges enter into the
computation of qopen' but only the plate components are involved in
the computation of J<qope/t)dt and Jcds/t)ds.
2.1.4 T9rsi&nal Stresses
Torsional moment is carried by the cross section in two parts,
pure torsion (St. Venant torsion) and warping torsion
T = Tsv + Tw (2.4)
7

For a general loading case, stresses caused by torque occur in
addition to the stresses caused by moment and shear. Uniform shear
stress results from the presence of pure torsion and is called St.
Venant torsional stress. Warping stresses occur in addition to the
St. Venant torsional stress in members of general cross section under
torsional loading. Warping shear stress and warping normal stress
develop when the section is restrained from deplanation.
The differential equation for the deformation of a member
subjected to a concentrated torque is
(2 .5)
where G: shear modulus
E: modulus of elasticity
<P : angle of twist
z: the coordinate along the longitudinal axis
Iw: warping moment of inertia
The solution for the angle of twist, expressed as a function of
z, is
(2 .6)
8

where X = GJ/Eiw Rnd the constants of integration depend on the
boundary conditions of the beam. Once cp is determined, St. Venant
shear, warping shear stress and warping normal stress can be readily
calculated at any location in the beam. They are:
T sv
T w
uw
where
GJ(dcl>/dz) = -----------
A = 0
area bounded by the box cross section
Sw= Warping static moment
w = normalized unit warping n
(2.7)
(2.8)
(2.9)
The distribution of the St. Venant shear flow, defined by rsv'
is constant across the cross section. Figures 2 and ) show the
distribution of wn and Sw in the cross section of a typical ship hull.
wn and Sw are functiGns only of the geometry of the cross section and
they directly influence the warping shear stress rw and the warping
normal stress (f • w The distribution of warping shear stress and
warping normal stress is shown in Figure 4 as a function of location
across a span, with both ends restrained against warping and subjected
to constant torque.
9
In an actual structure, there is neither free nor fully
restrained condition against warping, but the structures are
restrained partially. Thus, the actual distribution of stresses
caused by torque in a structure can be obtained only approximately,
the accuracy being dependent on the degree of torsional restraint at
the ends of the segment.
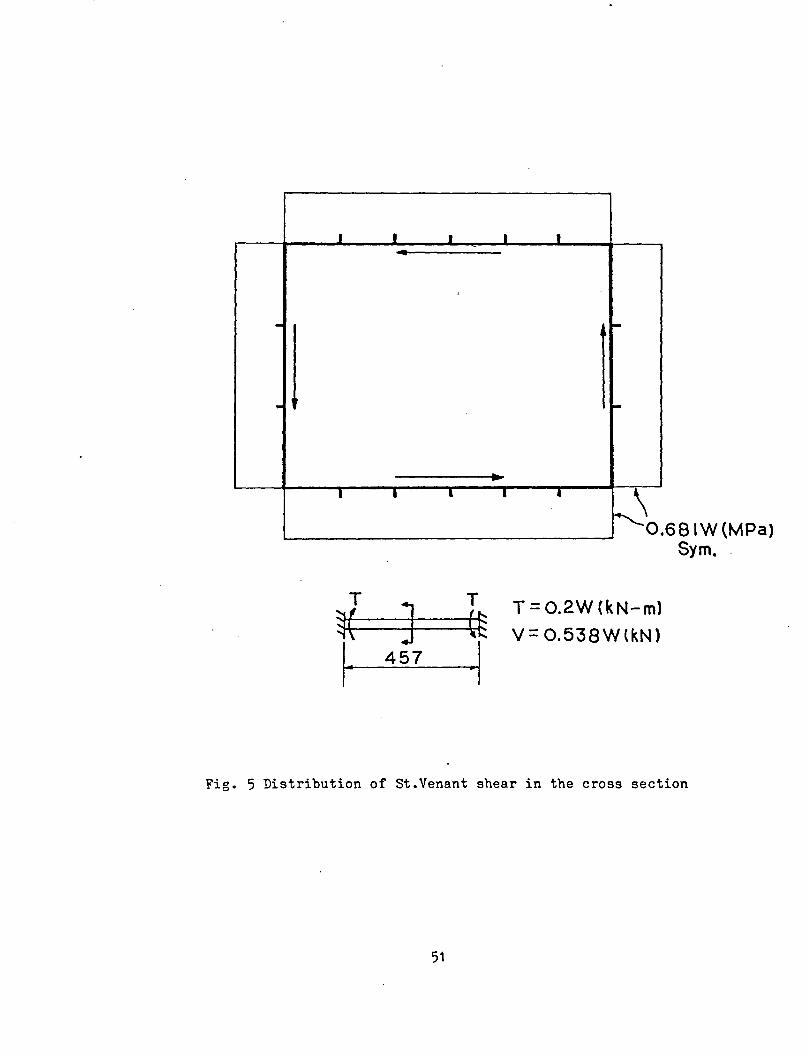
Figures 5 through 7 show the shearing stresses at the mid-length
of a typical box girder with longitudinal stiffeners, when the ends
are fully restrained against deplanation under the combined effects of
moment, shear and torque. Figures 8 through 10 show the normal stress
distributions in the same box girder at a cross section near the end.
2.2 N&n-Linear Behavier
With the assumptions stated in Art. 2.1.1, a ship hull girder has
linearly elastic behavior only until a component buckles or starts
non-linear behavior. After this, the principle of superposition
cannot be applied.
In the proposed method of analysis the following analytical
assumptions were used for individual components of the box girder:
1. The effect of shear on the behavior of the compression flange is negligible.
2. Shear stress distribution is uniform in the individual web
10

subpanels.
). After a web subpanel has buckled, it can no longer carry any additional normal stress.
The behavior of the hull girder is analyzed by considering the
behavior of individual components and enforcing compatibility at the
junctions between respective components. The compression flange is
under axial loading with or without the presence of lateral load.
Non-linearity of the compression flange arises from its
non-symmetrical nature; the longitudinal stiffeners are located on one
side of the compression flange. The behavior of the compression
flange can be modeled by parallel beam-columns hinged or fixed at the ·
transverses. In so doing, the large deformations and strain reversal
that take place in the compression flange can be taken into account.
In reality, there can either be lateral loading or no lateral load
acting on the compression flange, depending on whether the ship deck
plating or bottom plating is analyzed. At the present stage the
compression flange is assumed to have no lateral load.
For the hull girder webs, shear and bending stresses can be
computed by simple beam theory as long as the web plate is flat and
there are no significant residual stresses. After buckling, the
capacity of the buckled subpanel to carry additional normal stress is
greatly reduced and a stress redistribution takes place. The
11
/
additional normal stress caused by bending moment is then carried by
the flanges and the yet unbuckled subpanels. However, the buckled web
subpanel can still carry additional shear by the tension-field action.
The web subpanel is assumed not to carry any more loading when the
shear deformation reaches the point where the diagonal fiber in the
subpanel yields.
2.3 Behavior of Compression Flange
2.3.1 Introduction
The compression flange (deck or bottom plating) of a typical ship
hull girder is composed of a plate and a number of longitudinal.
stiffeners. Behavior of such stiffened plate under axial compression
has been studied in the pre- and post-buckling ranges, including the
ultimate and post-ultimate ranges [12, 18, 25J and a method for
performing analysis has been formed.
In the method presented here, the axial deformation in the
compression flange is assumed to vary linearly across the width.
Thus, each longitudinal stiffener has a different axial defo:mation,
and the compression flange is treated as if it consisted of a series
of individual stiffeners behaving independently from each other.
Then, each stiffener with its tributary portion of the plate is
treated as a beam-col~~n.
12
2.3.2 Beam-Column
A typical beam-column used to model the response of a particular
longitudinal stiffener of the compression flange is shown in Fig. 11.
It is sub.jected to an axial load P, end moments M and lateral line
loading q.
The behavior of individual components of the beam-column is
treated differently. The overall stress-strain relationship of the
plate is described by the average stress vs. overall shortening of the
plate (Fig. 12). It takes into account the effect of buckling and
residual stresses. The stress-strain relationship of the stiffener is
defined by the material property. Most commonly, the material is
taken to be linearly elastic-plastic (Fig. 12).
A computer program developed in prior research was used to
analyze the beam-column [22 J. This method was developed for
analyzing ship bottom plating subjected to axial and lateral loads
which exist when the ship hull is bent under the hogging moment (Fig.
13). However, when the ship hull is sagging, there is no lateral
loading present on the deck plating (Fig. 14) and the computer program
cannot be used directly and a modification had to be made. Solutions
13

for two to three different lateral loading intensities were
extrapolated to get the axial load-deformation behavior of the
beam-column with zero lateral loading. The resultant response of the
beam-column consists of the following three ranges (Fig. 15):
1. Prebuckling: up to 0.6 - 0.8 Pu' the response appears to be linear with deformation mainly due to the axial shortening of the beam column.
2. Non-linear post-buckling flattening till the ultimate load Pu is reached.
3. Post-ultimate reduction of the load capacity.
2.3.3 Effect of Strain Reversal
Special consideration had to be taken for the response of the
beam-column in the post-ultimate range. The need for this arose from
the direct equilibrium formulation of the method used in which past
deformations are not considered. The result of this is that in the
post-ultimate range the load-deformation response is unrealistically
distorted (Fig. 16) since each point is computed individually without
recognizing the fact that the structure may have been subjected to a
higher axial load and thus, strain reversal may have taken place.
To remedy this distorted response in the post-ultimate range, the
following correction was made to account for strain reversal; the
deformation corresponding to the computed axial load was approximated
14

by assuming
~ = ~ + A pu c (2.10)
where ~ pu is the axial shortening at the ultimate load P u • The
curvature shortening ~c is kept the same. The behavior computed this
way showed reasonable agreement with some test data. A more detailed
description of this effect can be found in Ref. [17j.
2.4 Stresses in Web
2.4.1 Prebuckling and Buckling Behavior
For closed box sections under moment, shear and torque, the
stresses in the webs are the superimposed effects of moment, shear and
torque. Figures 7 and 10 show the normal and shearing stress
distributions. The buckling of the web plate or of the web subpanel
occurs when· the bending, shearing and normal stresses satisfy the
following interaction expression:
ubcri 2 +(-------) Fbcri
0' • +(-~22r~-) = 1.0
Fccri (2.11)
where ~ri is the shear stress, ubcri is the bending stress and 0' • ccr~
is the compression stress existing in the subpanel, and Fvcri' Fbcri
F ;cri are the buckling stresses of a plate panel ·under shearing,
compression or bending stresses, each acting alone. The formulas
15

defining these critical buckling stresses are listed in Table 1. The
plate panels are conservatively assumed to be simply supported at all
four eiges.
2.4.2 Post-Buckling Behavior
In the post-buckling range, the strength of an individual web
subpanel was assumed to develop independently from other subpanels.
Thus, the shear force in a web is the sum of the shear capacities of
the individual subpanels.
Vweb = ~ V subpanels (2.12)
The subpanels can either be in the elastic, buckling or post-buckling
state depending on the stress level. After a subpanel has buckled,
the normal stress in it is assumed to remain constant and therefore
not to contribute to the moment carrying capacity of the box section.
T'he additional shear capacity is computed according to the
tension-field action (1, 2, 15, 19J. The ultimate shear strength of
the i-th web subpanel is then the sum of the shear stress at buckling
and the tension field action
T • u~ Tcri + Ttfi (2. 1?)
where and Ttfi are the ultimate shear strength and the
16

tension-field action contributions to shear in the i-th subpanel,
respectively. The ultimate shear deformation of the i-th subpanel is
assumed to be reached when the diagonal fiber reaches the yield
strain [15]. Thus,
F 1 (2.14) r =
__ y_ (ai + ----) ui E a.
~
where rui is the ultimate shearing strain, and
a a. = ~
is the aspect ratio of the given subpanel.
To simplify the problem, the shear stress-strain relation between.
the buckling and ultimate levels of stress for each subpanel is
assumed to be a straight line. As a result, the shear stress-strain
relationship for each subpanel is tri-linear defined by the points at
zero, buckling and ultimate stresses. With the assumed shear
stress-strain relationship, one has to keep in mind that,
1. After buckling of the subpanel the normal stress in a subpanel remains at the buckling stress level, and any additional normal stresses from the increase in the external load must be distributed to the yet unbuckled subpanels, longitudinal stiffeners and the flanges.
2. After the ultimate shear strain in a subpanel has been reached, the shear stress remains constant as the shear strain increases.
3. When the width-thickness ratio of a particular web subpanel is sufficiently small, the subpanel will yield rather than buckle. The maximum octahedral shearing stress yield criterion (Von Mises) was used to check the yielding condition.
17
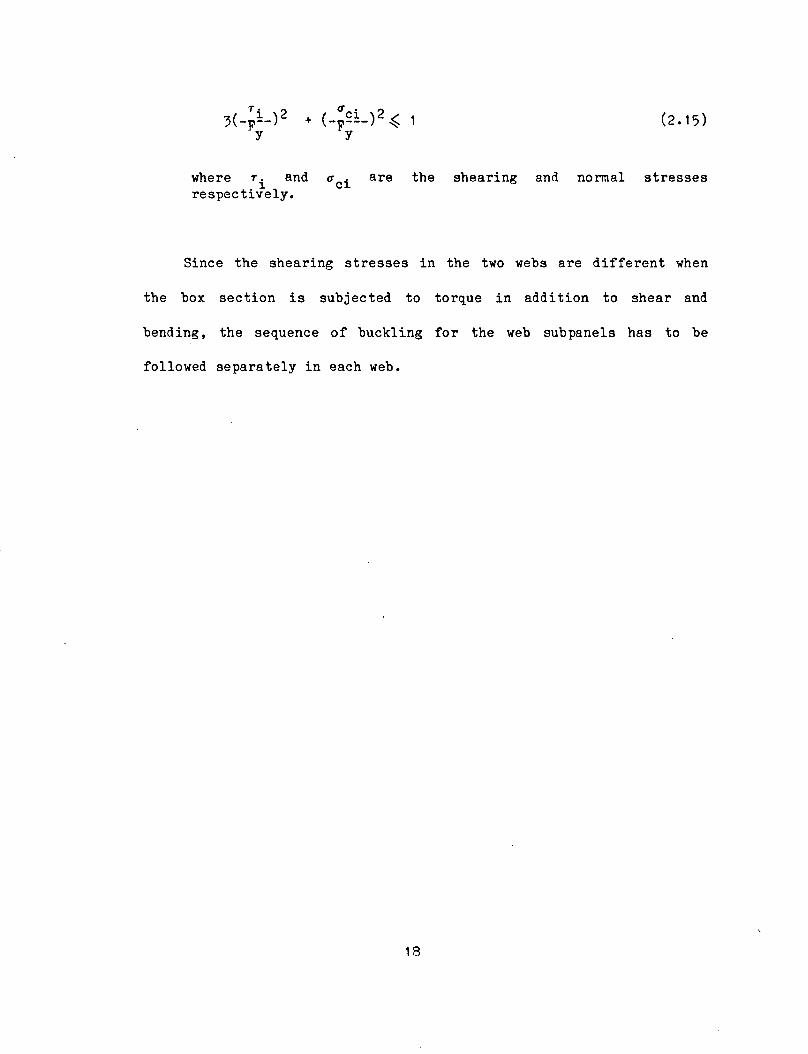
CTci 2 + (-p---) ~
y (2.15)
where :i and CTci are the shearing and normal stresses respectl.vely.
Since the shearing stresses in the two webs are different when
the box section is subjected to torque in addition to shear and
bending, the sequence of buckling for the web sub panels has to be
followed separately in each web.
18

3. EFFECT OF WARPING
3.1 Introduction
·When a simply supported beam is subjected only to moment and
shear, normal stresses in the linearly elastic range can be computed
by using Eq. ( 2.1). However, for a general case, when the torque is
also applied, the additional torsional stresses must be considered.
These stresses are produced by both, the uniform (St. Venant) and the
non-uniform (Warping) torsional actions as discussed in Article 2.1.
The normal stress caused by the bending moment is uniform in the
top and bottom flanges of the cross section, whereas torsional actions.
produce a self-equilibrated and varying normal stress distribution in
the cross section. The fact that one is uniform and the other varying
provides clues as to whether warping was playing a significant role
before any buckling occurs. An analysis was performed on the test
segment ·or · the specimen to see if the effect of warping was
significant even at s~all level of loading.
3.2 Elastic Analysis of Warping
Warping torsion results in normal and shear stresses, and their
distributions are similar to those shown in Figs. 2 and 3 for a hull
girder cross section as can be seen from Eq. (2.8) and Eq. (2.9).
Warping stresses also vary along the segment depending on the
19
restraint to warping deformations at the ends. Figure 4 shows the
distribution of warping normal and shear stresses along a prismatic
beam with the warping restrained at the ends. The final state of
stress in the box girder is the superimposed effect of the flexural
and warping stresses typified by a cross section of the test segment
as shown in Figures 7 and 10.
An elastic analysis was performed on the test segment with
various extreme boundary condi tiona assumed to exist at the ends.
This was necessary since, for testing one particular segment, the
other two segments were reinforced with temporary stiffeners and thus
provided some unknown amount of restraint. Also, the end portions of
the specimen were composed of thicker plates than in the test segments
(Art. 6. 1). The two extreme conditions assumed were: both ends
prevented from warping (torsionally fixed) or one end restrained and
the other end free to warp (torsionally simply supported).
In the case where the ends were restrained against warping at the
transverse stiffeners, the distribution of warping normal stress was
such that there were large normal stresses at the ends and zero
warping normal stress at the mid-length of the segment (Fig. 4).
The other case of the boundary condition was for one end of the
20

test segment, where there were reinforcements attached to the
transverse stiffeners to strengthen the already tested segment, to be
strong enough to keep the end from deplanation, and for the other end,
where only the plate thickness of the segment changed, free warping
was allowed. This lead to the maximum warping normal stress at the
mid-length of Test 3 of only 3.0 x 10⁻⁵ of the magnitude of the normal
stress caused by the bending moment. An analysis of the same boundary
conditions (one end fixed and the other end free) for the same test
set-up with the fixed end being at the location of the transverse
frame where the transverse load acted and the free end being one of
the support of the test specimen where the two X-rollers were located
(Fig. 19), gave even lower warping normal stress (10-9 of the amount
of flexural normal stress). All these assumed boundary conditions
seem to indicate that there would be negligible normal warping
stresses at the mid-length of the test segment. However, this does
not explain the observed strain distribution in the test segment which
showed significant variation of the normal stresses across the width
of the flanges • This behavior indicates that some other explanation
of the variation of normal stresses in the flange is needed for a
section under torsion, than warping.
Possible explanations are as follows:
1. The distortion of the cross section as the load applied might have been large enough so that the bending moment was acting on
21

a cross section other than the doubly symetrical which was assumed. As a result, the normal stress under bending was no longer uniform in the flanges.
2. The initial deformation of the plate panels might have been such that nonlinear inelastic behavior had already occurred during the early stages of loading so that elastic behavior was precluded.
Both these effects can be eliminated or minimized by using a
larger test specimen.
22

4. DESCRIPTION OF THE METHOD OF ANALYSIS
In the earlier research on the strength of ship hull girders , a
computer program was developed which used two strains as variables to
define the state of stress in the hull girder cross section. Under
the assumption that "a plane section remains plane", the condition of
equilibrium for the axial force was sufficient to determine the strain
in the tension flange for a particular value of the strain in the
compression flange. In other words, a uniform strain distribution was
assumed to exist in the compression and tension flanges. A comparison
of the computed results with the results of the tests showed that the
computer program could quite accurately predict the ultimate strength
of a hull girder subjected to moment and shear • However, for the
case of moment, shear and torque acting simultaneously, predictions of
the ultimate strength were over-estimating the observed results by as
much as 70~ l17].
It was found that, under the loading of moment, shear and torque,
the observed strain distribution was not uniform but had significant
and non-planar variation over the box cross section. This indicated
that warping took place when torque was applied.
In order to accommodate the deplanation of the cross section into
the computer programs, the variation of strains between the four
23

~orners had to be considered. As a starting point, linearly varying
deformations across the width of the individual component of the cross
section were assumed. This line of approach created an immediate
difficulty since the number of variables changed from two (one strain
in the compression flange and one in the tension flange) to four (the
strains at the four corners). Yet, there were only two conditions ,
viz, resultant axial force and the bending moment about the vertical
axis of the cross section to be equal to zero. It was thus necessary
to make the following modification to the computer program •
In the equilibrium formulation, the strain readings taken in the
test at two corners of the cross section are used as additional input
into the computer program in order to compensate for the lack of
equilibrium conditions. Then, by enforcing the axial force and the
bending moment about vertical centroidal axis to be equal to zero
through an iterative process, the other two corner strains are
computed. The load parameter corresponding to the computed corner
strains can be compared with the test load and to other results
obtained in the test.
As a result of the assumption that there is a linearly varying
strain distribution across the width of individual components, the
formulation of the computer program underwent two major changes.
24

(1) Instead of treating the compression flange as a set of identical
beam-columns having the same axial deformation as was assumed in the
uniform strain distribution approach the compression flange is
treated as if it were composed of identical beam-columns each with a
different deformation according to the linearly varying strain. Then,
the respective axial force in each beam-column is determined from the
load-deflection relationship.
(2) In the uniform strain distribution approach, buckling of the
corresponding web subpanels occurred in both webs at the same time.
\fuereas this is true for the loading condition of moment and shear
only, the analysis is seriously in error for the case of moment, shear
and torque when one web is loaded more heavily in shear than the other
(Fig. 6). This effect is taken into account in the present approach
by checking the buckling of each web subpanel independently as the
deformation in each subpanel increases.
Since in this method two strains are used as input, there is no
guaranty that the computed Mx (and the load parameter W) corresponds
to the true solution of the problem. Actually, the method gives an
upper bound solution , that is, the computed ~ (or W) should be
greater or, at best, equal to the actual moment ~·
25

The scope of the present study has been mainly concerned with the
development of the many computational procedures needed in the
programming of the method and, thus, the approach was not checked for
a general case, but only for the specimens tested in the previous
phase of this research program.
26

5. COMPUTER PROGRAMS
5.1 Introduction
Two computer programs were used for analyzing the behavior and
ultimate strength of ship hull girders. The first program, developed
in previous years, was used to generate the axial load-deformation
response of longitudinally stiffened panels with fixed or simply
supported end conditions. Two to three axial load-deformation
relationships under different lateral loading were first produced and
then extrapolated to the condition of zero lateral load.
The extrapolated axial load-deformation response modelled the
behavior of the compression flange of the box girder in the second
computer program which was used to analyze the load deformation
response of a typical ship hull girder segment subjected to a
simultaneous action of moment, shear and torque. The values of
moment, shear and torque were assumed to remain in the same ratio to
each other and thus, for convenience, were related to each other
through a load parameter equivalent to a concentrated load acting on a
simply supported beam. This load parameter is, for brevity, referred
to as the load in this presentation. The output was an array of load
(load parameter)values versus the average axial deformation values of
the compression flange.
27

Present effort was mainly concerned with the development of the
box girder program; the merging of the two programs into one is
recommended for future work.
5.2 Computer Program for Stiffened Plate
5.2.1 Brief Description
An already developed computer program for analyzing the axi~.l
load vs. deformation response of stiffened· panels was used L22].
However, some modifications had to be made in order to use it in the
present study.
One of the modifications involved the programming of the
extrapolation of the output of hm or three runs for different small
values of lateral loading to the desired output corresponding to zero
lateral load. This extrapolation was needed for the case where the
compression flange of the box girder represented the deck plating and
had no lateral loading. The number of runs used depended on whether
linear or parabolic extrapolation was desired.
Detailed development of the original computer program is
described elsewhere I_ 10, 22]. The important features of it include
the following.
1. The beam-column is composed of a plate and longitudinal
28

stiffener. The stiffener may be with or without a flange.
2. While an average stress vs. overall strain relationship was assumed for the plate component, the longitudinal stiffener web and flange were assumed to have a linearly elastic-plastic material properties (Fig. 12). The web and flange of the stiffener may have different yield stress values.
3. The effect of residual stresses in the plate can be included.
4. The ends of the beam-column can be fixed or simply-supported.
5.2.2 Extrapolation
The output obtained from the stiffened panel computer program was
an array of axial loads and deformations for a certain non-zero
lateral load. In order to model the response of the compression.
flange of the box girder when there was no lateral loading, the
behavior of the stiffener panel for some two or three small lateral
load values was extrapolated to the case of zero lateral load.
Normally, two to three axial load-deformation arrays associated
with lateral loading values between q = 0.03 to 0.15 produced good
extrapolated results.
-q --;-~-0
where q: lateral loading per unit length of beam column
r: radius of gyration of cross section
29

u : buckling stress 0
A: area of cross section of beam-column
The resultant load-deformation relationship is in the following
form (Fig. 15):
.1;1 ) f(----Uy
Where .1 is the axial deformation of the beam-column.
(5. 2)
The computational process of extrapolation involved first
selecting the array that had the minimum post-ultimate axial
deformation. The curve length of the selected array was determined
from the linear distances between one data point to · -- 13Xt. Based
on this curve length, a set of new points with equal linear distance
were established on the curve. The number of these points defined the
number of_ the desired extrapolation data points and their abscissae.
With the abscissa of a desired data point known, seven data points
from one of the input data arrays were chosen around the neighborhood
of the point to be extrapolated, and a cubic curve fitting performed
to determine its ordinate.
Following this same procedure for the second and the third array
around the selected abscissa value, either a linear or a parabolic
30

extrapolation was used to find the ordinate, which was the axial force
corresponding to a zero lateral loading. This extrapolation was
performed point by point until every axial force data point in the
extrapolated array was calculated.
The adoption of curve fitting through seven points instead of
interpolating between the data points was necessary because the data
points computed by the stiffened plate computer program had a certain
degree of approximation and, thus, did not result in a smooth curve
passing through them. In consequence, when extrapolation was
performed through the points interpolated between two neighboring
computed points, the extrapolated points (for zero lateral loadng)
exhibit a very erratic pattern. Some such points even fell below all
the data points used for extrapolation, although they were expected to
be above The use of the seven-point curve fitting produced a
reasonably smooth extrapolated curve which was very close to. the
results obtained previously by manual extrapolation I_ 17].
5.3 Box Girder Computer Program
5.3.1 Background and Assumptions
The box girder computer program performs the analyses of a
typical segment of ship hull girder bounded by two transverse
stiffener rings. The segment is of a single-cell box shape composed
31

of plating and longitudinal stiffeners in the flanges and webs. The
input to the computer program includes the hull girder geometry, the
response of the stiffened panel under compression as obtained from the
computer program described above (Art. 5. 2), the moment, shear and
torque in terms of their relationship to the load parameter, and the
stress-strain relationships of the web plate, web stiffeners and the
tension flange. The principal output consists of an array of the
concurrent values of the load parameter and of the deformation defined
by the average of the axial strains at the two edges of the
compression flange. Supplementary optional output gives a detailed
picture of the stress and deformation conditions for each load value.
In the method used in the preceding research, it was assumed that
"a plane section remains plane" with the consequence that the axial
deformation in the flanges ·was uniform and only two deformation
parameters (top and bottom corner strains) were used as variables. In
the present program, three deformational parameters are involved, as
described in Chapter 4. Among the basic assumptions used in the new
computer program are the following:
1. The box girder segment is straight and prismatic, the cross section is single-cell and symmetric about the vertical axis.
2. Effect of shear lag is neglected.
3. Variation of the axial deformation between the four corners is linear.
32

4. Warping shear is ne~ligible.
5. There are no gross residual stresses in the box girder section, and the effect of residual stresses on the behavior of the compression flange is incorporated into the axial load vs. deformation relationship obtained by a separate computer program.
6. After a web subpanel has buckled, the normal stress is assumed to remain constant at the buckling level.
5.3.2 Computational Procedure
The program calculates the load parameter for successive input
values of edge strains. The deformation input consists of the edge
strains at the two corners of the box girder segment, E1 and E4 as
obtained from Test 3 (fig.21). The strain at the other two corners is
interpolated by enforcing equilibrium of the cross section with
respect to the axial load and the bending moment about the vertical
centroidal axis, both of which are zero in this case.
After the equilibrium of the cross section is achieved, the
moment about the horizontal centroidal axis is calculated. This
moment gives the load parameter W and the corresponding shear and
torque from the following moment(M), shear(V), torque(T) and load
parameter(W) relationships,
M = c1 W
v = c2 w
33
(5.3)
(5.4)

T
The shear stresses, which include the effects of flexural shear and
St. Venant torsional shear, are distributed to the web subpanels. The
interaction of the bending stress, normal stress and shear stress is
then checked for each subpanel to see if they have made the subpanel
buckle. If no new subpanels have buckled, the calculated corner
strains and the load parameter represent one state of response for the
hull girder under given loading. If one of the subpanels has buckled,
the overall strain is decreased and several cycles of iteration are
performed to get the theoretical buckling state before the next set of
corner strains is input. After a particular subpanel buckles, its
normal stress is kept at the value of buckling. The web subpanel can
continue to carry additional shear stress by means of the
tension-field action. Repeated strain input produces an array giving
the load response of the hull girder from zero load to the ultimate
and through the post-ultimate range.
In addition to checking buckling interaction due to bending,
normal and shearing stresses, the stress condition was checked against
von Mises yield criterion. In the post-ultimate range where the load
was decreasing with an increasing strain input, the corresponding
decrease in shear was assumed to be linearly elastic.
34

6. DESCRIPTION OF HULL GIRDER TESTS
6.1 Test Specimen
To check the soundness of the assumptions made in the analytical
method, a test specimen was fabricated and three tests conducted.
Figure 17 shows the test specimen and the location of the test
segments. In the first test, only moment and shear were applied while
torque was added in the second and third tests. The values of moment
shear an1 torque are shown in terms of the load parameter.
Two of the tests (T1 - bending and shear, and T2 - bending, shear
and torque) are described in Reference l_ 17]. The third test ( T3 -
moment, shear and torque) was conducted later and is briefly
introduced here. A summary of this test program is outlined below.
The specimen was design~d to model a portion of a typical ship
hull girder. Figure 18 shows two views and two sections of the test
specimen. Its overall dimensions were: length- 2972mm ( 117in.),
width- 667mm (26.25in.), and depth- 508mm (20in.). In the middle
portion !_ 1372mm long (54 in.)], the plate thickness was
1.85mm(0.073in.). The end portions were 686mm(27in.) and 914~m(36in.)
long, and the thickness of the flange plate was 6.35~m(1/4in.) and of
the web plate 3.18mm(1/Bin.)
35

Four transverse stiffeners 51~m(2in.) by 9.53mm(3/8in.) divided
the mid-portion of the test specimen into three equal segments
457mm(18in.) long. In the test segments, there were five longitudinal
stiffeners 3.18mm(1/4in.) by 20mm(0.787in.) spaced evenly on the
outside of the compression and tension flanges. On the webs, there
were two longitudinal stiffeners of the same size as on the flanges,
located at 168mm(6.625in.) from the top and bottom flange plates.
Although in an actual ship hull structure, all stiffeners would
be all located on the inside, in the test specimen, the stiffeners
were put on the outside. This was done in consideration of the ease
of inspection during fabrication and the convenience of observation of
the behavior of the stiffeners, flanges and webs during testing.
6.2 Test Setup
At one.end (left end in Fig. 19), the box girder section was
supported on two X-rollers , one roller under each web. The X-rollers
made it possible for the specimen to rotate only in the longitudinal
direction. At the other end of the specimen (right end in Fig. 19),
an X-Y roller was used so that the specimen could pivot and move in
both the longitudinal and transverse directions. This support
arrangement was designed to make the girder simply supported for
bending moment and shear and to carry all the torque in the portion
36

between the load point and the end supported on the two X-rollers
(left end).
The external load was applied by means of a hydraulic jack
positioned between the transverse test frame and a spreader beam which
was supported on two plates welded to the two vertical transverse
stiffeners on the test specimen. Thus, the load was applied to the
test segment through the webs. Torque was introduced by positioning
the jack with the specified eccentricity with respect to the centroid
of the girder.
During the testing of a particular segment, the yet untested
segments were protected by reinforcement to prevent undue distortions.
The already failed test segments were reinforced in order not to
interfere with the testing of the next segment L17].
6.3 Loading Conditions
For the three tests conducted, there was constant proportionality
between the external load applied at the hydraulic jack and the
moment, shear and torque at the mid-span of each test segment. The
moment and shear were simply the moment and shear at the mid-length of
the test segment are to the load applied to the whole specimen, simply
supported at the ends (Fig. 17). In Test 1, the loading was applied
37

at the center of the transverse frame so that no torque was produced.
The torque in Test 2 and Test 3 was achieved by applying the jack with
some ~rescribed eccentricity.
Constants c1, c2 and c3 as defined in Eq.(5.3) through Eq.(5.5)
related the moment shear and torque to the load parameter. In this
case, the vertical load W applied to the specimen was used as the load
parameter. The theoritical ultimate load, the ultimate load as
recorded in the experiment, and their ratios for all the three tests
are listed as follows:
Test
M/W = c1
V/W = c2
T/W = c3
Load Wu
wtheo
Constants and Ultimate Loads
0.562
o. 615
0
306.9
266.9
1.15
2
0.616
0.385
0.194
280.2
164.6
1.70
3
0.615
o. 5 "'8
0.200
276.9
192.9
1.44
The ratios of the theori tical and experimental ultimate loads
show that the estimate was good when torque has not introduced (only
15% overestimate), but considerable difference occurred when torque
38

was applied.
6.4 Analysis of Test 3
As an illustration of the application of the developed computer
program, it is used here to analyze Test 3. The corner strain
readings at the edges of the compression flange (at the mid-length of
the test segment) were used as input to the computer program (Fig.
21 ) •
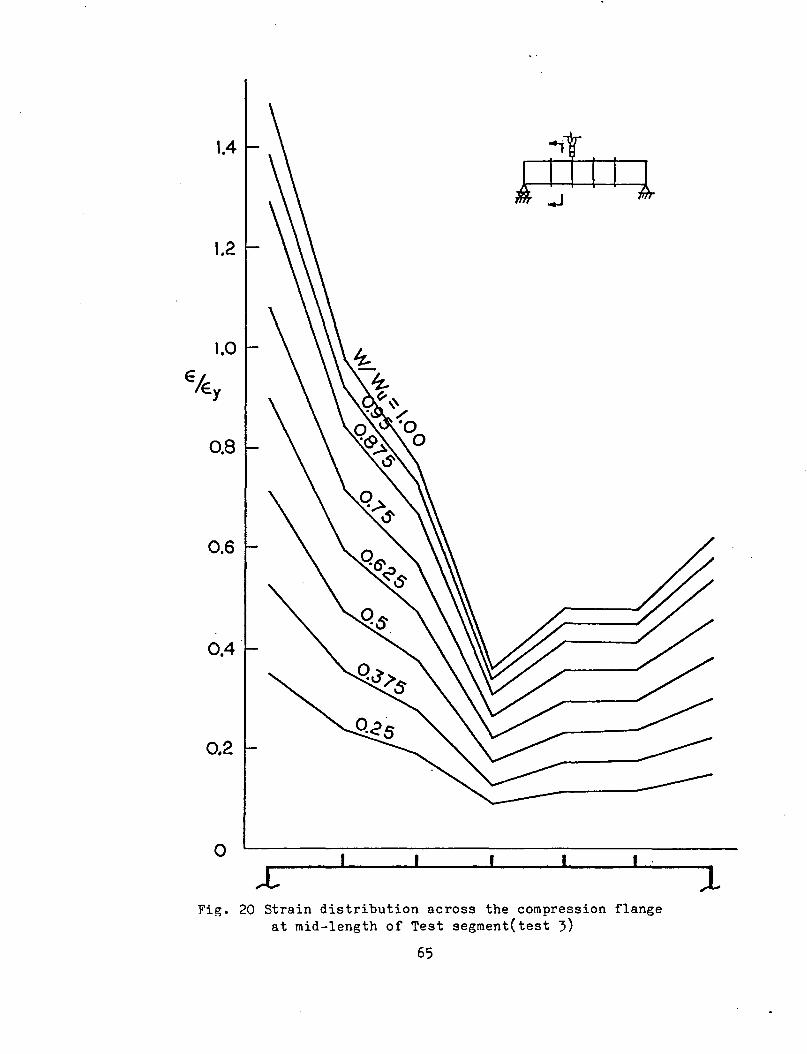
An examination of the strain distribution in the compression
flange of the test segment showed that there was a very large
variation (Fig. 20). If only the corner strains at the edges in the
compression flange were used and the large variation in-between
ignored, the resulting axial force in the compression flange would
have appeared to be misleadingly larger than expected in reality.
In an attempt to compensate for this variation of strains in the
test specimen, when only the corner strains had to be used in the
computer program, a linear fit of the strain readings in the
compression flange was performed to give an equivalent linearly
varying strain pattern. The relationship between the ratio of the
reduced corner strains to those observed for the corresponding load
parameter appeared to be nearly constant (Fig. 21):
39
Ee 1 0, 68 E 1 ( 6. 1)
E e2 = 0, 38 E 2 (6. 2)
For a particular set of input strains, these two reduction
I
coefficients were applied to the edge strains in the compression
flange involved in the computation of forces. As for the other parts
of the cross section, they were still subjected to the same unreduced
strains. This approach gave the follow~ng results:
1. The computed E3 were almost twice as large as the E3
observed.
2. The computed E1 remained within 5% of the observed value for the loads up to the ultimate load. In the post-ultimate range, the computed E 1 showed a strain reversal that was contrary to the test observation that the strain kept increasing in that range.
3. The computed ultimate load the observed ultimate load an 30% over-estimate as obtained from the previous
was 233.3kN(52.45kips) as compared to of 177.9kN(40kips), which constituted compared to the 70% over-estimate
computer program.
The fact that the computed E 3 value was much larger than the
observed value can be partially explained by the following:
1. The strain gages measured only the strain on the plate surface rather than the true average, thus, the accuracy of the strain readings may be in question.
2. The fact that the compression flange deflected more at the mid-portion than at the ends made the measured strain in that part less pronounced. Still, this could account only partly for the unusually large variation of the observed strains (Fig. 20). Apparently, the effect of shear lag, which causes the same type
40

of strain distribution, should be considered to improve the accuracy.
3. Distortion of the cross section, which was not accounted for in the present analysis, could have affected the measured strain values.
41

7. SUMMARY, CONCLUSIONS AND RECOMMENDATIONS
7.1 Summary
A theoretical analysis was made of the behavior of ship hull
girder segments between two transverses. The main purpose was to
study the behavior in the pre- and post-ultimate range under the
combined loading of moment, shear and torque. The results predicted
by this analysis were compared to previously conducted test
observations to verify the assumptions of the proposed method.
The method adopted in the analysis consisted of considering the
behavior of the individual components comprising the ship hull girder
through continuous interaction among them from a zero load up to the
ultimate and post-ultimate stages of loading. Compatibility was
maintained at the junctions between the components as the load
increased. The compression flange was modelled by parallel
beam-columns, each consisting of a longitudinal stiffener and the
tributary portion of the plate. Each beam-column was assumed to have
the axial deformation corresponding to a linear variation of the
strain across the width of the compression flange. Buckling and
post-buckling, plastification and residual stresses were all taken
into account. The webs were analyzed by considering the behavior of
individual web subpanels in the buckling, post-buckling and ultimate
ranges.
42

A previously developed computer program was considerably modified
in order to more properly model the behavior of a ship hull girder
under combined loading. The principal modifications were the
following:
1. The effect of warping of the ship hull cross section was considered by assuming a linearly varying strain distribution between the junctions of the flanges and the webs. This feature was included as a result of the observations in the previously conducted tests that under combined loading there was significant warping of the cross section.
2. In the modelling of the behavior of the ship hull girder webs, the fact that the individual web subpanels buckle at different stages of loading was recognized. Buckling of the web subpanels could develop independently of each other.
The procedure of the method in the computer program relied on inputing
two corner strains. For expediency, the strains obtained from a test
were used • Using an average strain value in the compression flange,
the two computed corner strains, together with the computed load
parameter constituted the results for comparison with the observed
results.
This comparison of the analytical and experimental results for
Test ' showed that:
1. Predicted E1 strain values (Fig. 21) follow closely the obtained strain up to the ultimate stage.
2. Predicted E' values ivere as much as twice of the values from test observation.
3. Computed ultimate strength of the test segment was 30% higher than the observed value.
43

7.2 Conclusions
Results of the three tests conducted shows that for the loading
case of moment and ,shear, the prediction by the analytical method
comes close to the experimental results but was optimistic (an 15%
over-estimate). In the tests where torque was involved (Test 2 and
Test ~), the method utilized needs refining as it showed as much as
70% over-estimate.
Considering that essentially arbitrary corner strains have to be
input in the present method to participate in the iteration to reach
equilibrium, there might be the same external load computed when
inputting another set of corner strains. This leads to the conclusion
that the calculated external load would be always larger than the·
value obtained from a test and at best equal to it, i.e., the strains
produced by the external loadings in the experiment will always give
the lower bound of the potential energy provided by the particular
boundary conditions in the test. Any other set of corner strains
producing the same external loading will have a potential energy
larger than that.
44
7.3 Recommendations
The following recommendations with regard to future research are
made:
1. Establishment of an energy criterion is needed to determine the m~n~mum potential energy in various combinations of corner eliminate the present need of the external load parameter.
the hull girder segment under strain sets. This criterion will inputting two strains to compute
2. Consideration of one web gradually becoming weaker as the external load increases to the point that the cross section, in ~ffect, becomes an open section (relocation of the shear center).
3. Incorporation of the effect of shear on the behavior of the compression flange plate subpanels.
4. Incorporation of the effect of shear lag into the behavior of individual plate components.
5. Tests on larger specimens so that the effect of geometric imperfections could be minimized.
45

Table 1 Reference buckling stresses
Aspeci Buckling Relative Plate For Buckling Stres~ Pure Stress Ratio Coefficient Slenderness >. Yield Stress
d.:d;tij k
~0.58 Fvcr
=0.58 Shear Fy ...... ..__ .__ ...__
1
t ldi di/lf ~0.58 Fvcr 1.18
1 5 k =5+- >-v=0.8T E k ~ 1.41 Fy 0.58-0.357( Av -0.58)
1 v ~7.. w v
I~~--~~ )1.41 ;vcr = 0.58( 1/X;) y
Bending >_g_ ~0.65 Fbcr 2
1 \ 3 kb= 24
di/tw Jlt ~1.5 Fy 0.072(Xb-5~62) -0.78
<_g_ kb =24+73(~-J Xb- 0.95 E kb
Fbcr 2 ~1.5 = l/Xb 3 Fy
Axia I ~0.65 Fccr 2
~ ~ >I k = 4
~1.5 Fy 0.072(Xc-5.62) -0.78 c _ dj/twJ:f
I l >-c- 0.95. E kc
Fccr 2 <I kc = ( d..+ Ci"') ~1.5 -1/x Fy - c
,. b· .I l<t
dl
I . ------r---- d
Transverse Stiffener
Longitudinal Stiffener·
Fig. 1 Idealized ship cross section
4'7
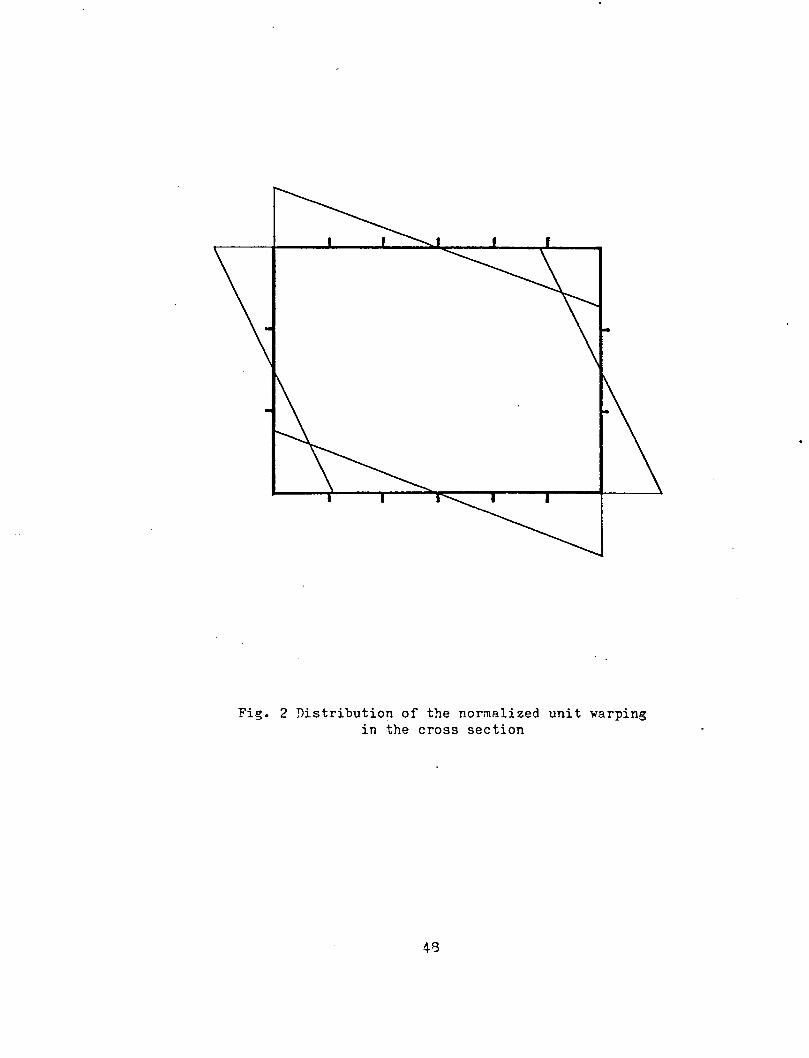
Fig. 2 Distribution of the normalized unit warping in the cross section

Fig. ) Distribution of the warping statical moment in the cross section
49

d,_<P (G J) dz2 T~
I. L ·I
0 0.1 0.2 0.3 0.4 0.5
0 0.1
Z/L
~L= 11.41
0.4 0.5 0.6 0.7 0.8 0.9
Z/L
Fig. 4 Distribution of warping normal stress and warping shear stress along a span subjected to
constant torque with warpin~ deformation restrained
50
-0.2 -0.4
-0.6
-0.8 -1.0
1.0
0.8 0.6 0.4
0.2
1.0
I I I
'
-
-
I I '
T
~( ] I· 457
I
I
T
{~
·I
I
r-
-
I
~ o.
T = 0.2W (kN-m)
v= 0.538W(kN)
681W(MPa) Sym . .
Fig. 5 Distribution of St.Venant shear in the cross section
51

0.745W (MPal
Fig. 6 Distribution of flexural shear stress in the cross section
52
0.990WCMPa)

1.426 W(MPa)
1.671WtMPa)
T
~( J 457
T T = 0.2W(kN -m)
v= 0.538W{kNJ
Fig. 7 Resultant shear stress in the cross section
53

T
~(
I· 457 ·I
3.23W(MPa)
3.23W(MPa)
T=0.2WCkN-m)
M=0.615W(kN- m)
Fig. 8 Distribution of flexural normal stresses in the cross section according to simple beam theory
54

1.77W(MPa)
Fig. 9 Distribution of warpin~ normal stress in the cross section
55
Sym.

4.99W(MPa)
T
~(
'· 457 .1
T=0.2W(kN-m)
M=0.615W(kN-ml
Fig. 10 Resultant normal stress in the cross section
56

p~ M
Fi g. 11
q=:q'b c
Beam ... -col umn
57
L

<Y or <Yave
Material Stress- Strain Curve
----,--Assumed
Stress- Strain Curve for the Plate
E or Eedge
Fig. 12 Average stress vs. strain relationship for plate under compression
58

(A) HOGGING MOMENT
Fig. 13 Hogging Moment
(B) SAGGING MOMENT
Fig. 14 SaP,ging Moment

q=o
0.40
0 0.20 0.40 0.60 0.80 1.00 1.20 1.40
Fi~. 15 Axial lo~d vs. ~xial deform~tion relationship for q•O

"' .....
0
Longitudinally Stiffened
Plate Under Compress ion
~ q = 0.03 (adjusted for
/ strain reversal)
q
P I I I I j I'<( I I I I I p
--.. rlf ...: .. A.,...__
I. L ~·J 6 (6/L)/Ey
~----~------~----~------~----~------~----~~----~--0.20 0.40 0.60 0.80 1..00 1.20 1.40 1.60
Fig. 16 Axial load vs. deformation relationship when strain reversal is not considered in post-ultimate range

~w Test Segment
508I~----+-~~~~~--~ I: :I
a) Test I : Moment + Shear
b) Test 2 :-Moment + Shear + Torque
b) Test 3 : Moment + Shear + Torque
M= 0.562W(kN-ml V=0.615W(kN)
T=O ( kN-m)
M::; 0.616W( kN-m) V:::0.385W(kN)
T=O.I94WCkN-m)
M=0.615WlkN-ml V=0.538WlkN)
T=0.200W( kN-ml
Fig. 17 ~est Segments (all dimensions are in mm)
62

--
co 0 I!)
-'---
-.----
-
_.._
1~ 3.2 Web ~ ·I• A1 Bl
1.6 Web ll?.. ·I• 3.2 Web ~ 1
19x 3.2 ltyp.l\_
·-
~152 152H 915 3@ 457 = 1371 686
. ELEVATION A.J B _j
I 6.4 Flanqe ~ 1 1.6 Flange ~ 6.4 Flange~ t I
51 x 9.5 < txp.)_ 1--
- 1--r----z= 1------
t--19x3.2(typ.) _
915
1--
3@457 1371 ., .. 686
TOP AND BOTTOM VIEWS
51 X 9.5(fyp.)
·I
19 X 3.2 (fyp.) 1.6 <typ.) 6.4
co 0 lO
51~ ,.6@111=666 .. 1l-51_
SECTION A-A
co ~ 3.2
1- 666 6.4·1
SECTION 8-B
Fig. 18 Test Specimen Scantlings (All dimensions are in mm)
3.2

Test 3
W8X32
~2---- 2 X- Roller
Bearings
Test I and 2
""{___-Jdck y Steel Plate
Test Specimen
ELEVATION
-~-Y Roller Bearing
Wood Bearing Spreader Beam Block
I e I
H --~- d d - - ---r---- -I
I I
b ~ b J SECTION A-A <Tesf I ) SECTION A-A ( Tes:t 2 and 3J
Fig. 1q Test ~tup
64
1.4
1.2
0.8
0.6
0.4
0.2
0 I I .
Fig. 20 Strain distribution across the compression flange at mid-length of Test segment(test 3)
65
1

1.5X 10⁻³
-3 0.5 X I 0
Ee: edge strains obtained by linear regression I through the strains
0 at stiffeners 1
I 0
0
1 Ee~ 1
Ez
k/ 0
i 0
I X
! l-
0
0.2 0.4 0.6
a~
Fig. 21 R~tio of linearly fitted edge strains to observed edge strain readings for increasing load W
as indicated by the value of f1 and f2
66

REFERENCES
[1] K. Basler. "Strength of Plate Girders Under Combined Bending and Shear,"
Journal of the Struct. Div., ASCE, Vol. 87, No. ST7, Proc. Paper 2968, October 1961.
[2] K. Basler. "Strength of Plate Girders in Shear," Journal of the Struct.
Div., ASCE, Vol. 87, No. ST7, Proc. Paper 2967, October 1961. ~3) K. Basler and B. Thurlimann.
"Strength of Plate Girders in Bending," Journal of the Struct. Div., ASCE, Vol. 87, No. ST7, Proc. Paper 2913, August 1961.
(4] H. Becker and A. Colao. "Compressive Strength of Ship Hull Girders," (Part III, Theory
and Additional Experiments), SSC No. 267, Ship Structure Committee, Washington, 1977.
(5] J. B. C~ldwell. " Ultimate Longitudinal Strength," Proceedings of the Royal
Institution of Naval Architects, Vol. 107, London, 1965. !_6) J. Dwight.
"Collapse of Steel Compression Panels," Trans. Developments in Bridge Design and Construction, University College, Cardiff, 1971.
(7] T. V. Galambos. "Structural Members and Frames," Englewood Cliffs, N. J.,
Prentice Hall, 1968. l_sj M. Herzog.
"Ultimate Strength of Plate Girders From Tests, Journal of the Struc. Div., ASCE, Vol. 100, No. ST5, Proc. Paper 10530, May 1974.
1_9J W.T.Koiter. "The· Effective Width of Flat Plates for Various Longitudinal
Edge Conditions at Loads Far Beyond fuckling Load, "National Luchtvaartlaboratorium, Netherlands, Rep. S287 (in Dutch), 194 ).
!_ 1 0 J J • Kondo • "TJl timate Strength of Longitudinally Stiffened Plate Panels
Subjected to Combined Axial and Lateral Loading," Fritz Engineering Laboratory Report No. 248.13, Lehigh University, 1965.
I_ 11 J T. T. Lee. "Elastic-Plastic Analysis of Simply Supported Rectangular Plates
Under Combined Axial and Lateral Loading," Fritz EngineeringLaboratory Report No. 248.7, Lehigh University, 1961 •
(12J A. E. Mansour. "Charts for the fuckling and Post-Buckling Analysis of Stiffened
67

?lates under Combined Loading," Technical and Research Bulletin No. 2-22 Society of Naval Architects and Marine Ehgineers, July, 1976.
(131 Ch. Massonnet. "Design of Steel Plate and Pox Girder Bridges," Journal of
Struc. Div., ASCE, Vol. 101, No. 11, Proc. Paper 11686, p.2477' 1975.
[14) K.E. Moxham and C.D. Bradfield. "The Strength of Welded Steel Plates Under Inplane Compression,"
University of Cambridge, Department of Ehgineering, Technical Report No. CUED/C-Struct/TR.65, 1977.
(15j A. Ostapenko and C. Chern. "Ultimate Strength of Longitudinally Stiffened Plate Girders
under Combined Loads", IABSE Proceedings, Vol. 11, II, London, 1971.
1_16_1 A. Ostapenko, C. Chern and S. Parsanejad. " Ultimate Strength Design of Plate Girders", in Developments in
Bridge Design and Construction, Crosby, Lockwood and Son, Ltd., University College, Cardiff, 1971.
(17J A. Ostapenko and A. Vaucher. "Ultimate strength of Ship Hull Girders under Moment, Shear and
Torque," MARAD Report No. MA-RD-940- 80077 (Fritz Ehgineering Laboratory Report No. 453.9), July 1980.
f1sl A. Ostapenko. "Ultimate strength Design of Wide Stiffened Plates Loaded
Axially and Normally," in Proceedings of Symposium on Structural Analysis, Non-Linear Behavior and Techniques, Transport and Road Research Laboratory (TTRL) Supplementary Report 164 UC, p. 175, 1975.
(19j A. Ostapenko •. "Shear Strength of Long:l.. tudinally stiffened Plate Girders,"
?roceedings of Structural Stability Research Council, 1980. r2ol S. Parsanejad and A. Ostapenko.
"Ultimate strength Analysis of Plate Grillages under Combined Loads," Fritz Ehgineering Laboratory Report No. 323.11, Lehigh University, 1972.
(21] K. C. Rockey, H.R. ENans and D. M. Porter. "A Design Method for Predicting the Collapse Behavior t"'f ?late
Girders," Proc. Institution of Civil Engineers, Part 2, Vol. 65, p. 85-112, March 1978.
C22l D. R. Rutledge. "Computer Program for Ultimate Strength of Longitudinally
Stiffened Panels," Fritz Engineering Laboratory Report No. 248.23, Lehigh University, 1968.
(231 D. R. Rutledge and A. Ostapenko. "Ultimate strength of Longitudinally Stiffened Plate Panels
(Large and Snall b/t, General Material Properties) ," Fritz
t::8

Engineering Laboratory Report No. 248.24, Lehigh University, 1968.
~24] W. Schueller and A. Ostapenko. "Tests on a Transversely Stiffened and on a Longitudinally
Stiffened Unsymmetrical Plate Girder , WRC Bulletin No. 156, November 1970.
(25] c. s. Snith. "Compressive Strength of 'velded Steel Ship Grillages,"
~roceedings of the Royal Institution of Naval Architects, Vol. 117, London, 1975.
(261 J. D. Vernarr. "Comparison Study of Plate Girder Ultimate Strength Methods,"
Report CE 481, Department of Civil Ehgineering, Lehigh University, September 1977.
69

VITA
The author was born in Taipei, Taiwan on April 9, 1953 as the
fourth child of Ching-Sung and Pi-Tao (Hsu) Chen.
He graduated from Chien-Kuo High School in Taipei in July 1971.
Then, he attended the National Taiwan University beginning in
September 1971 and he received the degree of Bachelor of Science in
Civil Engineering in June, 1975.
From July, 1975 to June, 1977 he served in the Army (Republic of
China) as an Army Engineer stationed on Quemoy, Fukien. The author
joined the Taiwan Power Company as a construction engineer in October
1977.
In September 1979, he enrolled at Lehigh University in the Master
of Science program in Civil Engineering. At first, he also served as a
Teaching Assistant, but since September 1980, he was Research
Assistant on the project Ultimate Strength of Ship Hull Girdes.
'7()


