strength in numbers - Massmart · strength in numbers. Store Region Map Foldout ... Divisional...
184
annual report strength in numbers
-
Upload
duongthien -
Category
Documents
-
view
221 -
download
0
Transcript of strength in numbers - Massmart · strength in numbers. Store Region Map Foldout ... Divisional...

annual report
strength in numbers

Store Region Map Foldout
Group Profile 1
Strategic Principles 4
Looking Back 5
Financial Highlights 6
Operating Highlights and Prospects 7
Looking Forward 8
Non-executive Directors 10
Executive Directors 11
Executive Committee 12
Investment Proposition 14
Letter from the Non-executive Chairman 15
Letter from the Deputy Chairman and Chief Executive Officer ..............................................................................................................
Letter from the Chief Financial Officer ...............................................................................................................................................
Seven-year Review ...........................................................................................................................................................................
Massmart in the Headlines 52
Divisional Reviews 53
Divisional Analysis 62
Channel Collaboration Review 64
Sustainability Report ........................................................................................................................................................................
Corporate Governance 99
Approval of the Annual Financial Statements 109
Directors’ Report 110
Consolidated Group Annual Financial Statements .............................................................................................................................
Company Annual Financial Statements 167
Notice of Annual General Meeting 175
Form of Proxy 179
Administration ibc
Financial Calendar ibc
Contents

9w
hole
sale
and
ret
ail c
hain
s,ea
ch fo
cuse
d on
hig
hvo
lum
e,lo
w
mar
gin,
low
co
st
dist
ribu
tion
of
mai
nly
bran
ded
cons
umer
goo
ds f
or c
ash,
in
Mas
smar
t is
a m
anag
ed p
ortf
olio
of
228
stor
es,a
nd
divi
sion
s
com
pris
ing
thro
ugh
1478 m
embe
r bu
ying
ass
ocia
tion
11
4co
untr
ies
in S
outh
ern
Afr
ica
Mas
sdis
coun
ters
(Gen
eral
mer
chan
dise
disc
ount
er)
Mas
swar
ehou
se(W
areh
ouse
clu
bdi
scou
nter
)
Mas
scas
h(F
ood
who
lesa
ler
and
buyi
ng a
ssoc
iatio
n)
R30 4
48 m
illio
n(T
otal
sal
es)
R1 3
34 m
illio
n(T
radi
ng p
rofit
)
Sal
esR
8 0
96 m
illio
n EB
ITA
R546.4
mill
ion
Sal
esR
7 6
61 m
illio
n EB
ITA
R288.3
mill
ion
Mas
sbui
ld(H
ome
impr
ovem
ent
reta
iler)
Sal
esR
3 8
93 m
illio
n EB
ITA
R290.4
mill
ion
Sal
esR
10 7
98 m
illio
n**
EBIT
A R
208.4
mill
ion
26 s
tore
s ac
quired
1 J
uly
1998
Now
70
sto
res
RSA
,Bot
swan
a,N
amib
ia,M
auriti
us,
Moz
ambi
que,
Uga
nda,
Zam
bia,
Nig
eria
Gen
eral
mer
chan
dise
and
no
n-pe
rish
able
gro
ceries
LSM
5 –
10
*
As
a 6 s
tore
cha
in M
akro
was
the
fou
ndin
gen
tity
of
Mas
smar
t
Now
14
sto
res
RSA
,Zim
babw
e
Food
/liq
uor/
gene
ral m
erch
andi
se
Liqu
or a
nd g
ener
al m
erch
andi
se L
SM
6 –
10*
and
food
LSM
2 –
4*
8 B
uild
ers
War
ehou
se s
tore
s ac
quired
28 F
ebru
ary
2003
3 D
e La
Rey
sto
res
acqu
ired
1 J
une
2005
Reb
rand
ing
of D
e La
Rey
cur
rent
ly in
pro
gres
s
Now
20 s
tore
s
RSA
Hom
e im
prov
emen
t su
pplie
s/to
ols/
build
ing
mat
eria
ls
LSM
5 –
10
*
14 C
CW
Sto
res
acqu
ired
1 J
une
1998
22 B
row
ns a
nd W
eirs
Sto
res
acqu
ired
1 J
uly
2001
Two
chai
ns c
ombi
ned
unde
r C
BW
for
mat
from
1 J
uly
2001
Now
62 s
tore
s
RSA
,Les
otho
,Nam
ibia
,Bot
swan
a
Food
/liq
uor/
groc
erie
s
LSM
2 –
4*
1m
assm
art
annu
al r
epor
t
2m
assm
art
annu
al r
epor
t
The G
roup is
the t
hir
d lar
gest
dis
trib
uto
r of
consu
mer
goods
inA
fric
a, t
he lead
ing r
eta
iler
of
genera
lm
erc
han
dis
e,
liquor
and h
om
e im
pro
vem
ent
equip
ment
and s
upplie
s, a
nd t
he lead
ing w
hole
sale
r of
bas
ic f
oods.
Mas
smar
t at
a g
lanc
eS
tore
Reg
ion
Map
Fold
out
Gro
up P
rofil
e1
Str
ateg
ic P
rinci
ples
4
Look
ing
Bac
k5
Fina
ncia
l Hig
hlig
hts
6
Ope
ratin
g H
ighl
ight
s an
d Pr
ospe
cts
7
Look
ing
Forw
ard
8
Non
-exe
cutiv
e D
irect
ors
10
Exec
utiv
e D
irect
ors
11
Exec
utiv
e C
omm
ittee
12
Div
isio
nal D
irect
orat
e12
Inve
stm
ent
Prop
ositi
on14
*LS
M r
efer
s to
Liv
ing
Sta
ndar
d M
easu
re,w
hich
isa
wea
lth in
dex
that
is u
sed
to s
egm
ent
hous
ehol
ds
in t
he S
outh
Afr
ican
mar
ket
in t
erm
s of
sta
ndar
d of
livi
ng r
athe
r th
an in
com
e.**
Incl
udes
Fur
nex
whi
ch w
as s
old
with
eff
ect
from
1M
arch
20
06
.

Sto
re R
egio
n M
ap
ATL
AN
TIC
OC
EA
N
IND
IAN
OC
EA
N
WES
TER
N C
APE
NO
RTH
ERN
CA
PE
Upi
ngto
n
EAST
ERN
CA
PEU
mta
ta
Kin
g W
illia
m’s
T
own
Mku
ze
Erm
elo
Rus
tenb
urg
NO
RTH
WES
T
FREE
STA
TE
LIM
POPO
Wel
kom
Mak
hado
Empa
ngen
i
Mtu
batu
baQ
wa
Qw
a
Vryh
eid
But
terw
orth
Que
enst
own
Port
She
psto
ne
Kak
amas
Her
man
us
Paar
lU
itenh
age
Cap
e To
wn
Port
Eliz
abet
h
East
Lon
don
Ric
hard
s B
ay
Blo
emfo
ntei
n
SO
UTH
AFR
ICA
SWA
ZIL
AN
D
LESO
THO
Witb
ank
3
3
1
9
1
11
1
1
2
1
She
lley
Bea
chM
arga
te
Haz
yvie
w
Lady
smith
Non
gom
a
Ste
llenb
osch
Vred
enbu
rg
Gin
gind
lovu
2
Fick
sbur
g1
1
1
11
11
1
1
1
1
1
1
1
2
1
1
1
12
21
1
1
2
2
11
6
1
1
1
2
1
1
1
Polo
kwan
e
1
2
1
1
1
2
7
21
1W
orce
ster
Dun
dee
Kle
rksd
orp
Tzan
een
Maf
iken
g
Kim
berle
y
Dur
ban
Nel
spru
it
Kru
gers
dorp
11
Esho
we
New
cast
le
Sec
unda
2
2
Spr
ingb
ok
Mid
rand
1
1
Kny
sna
Ulu
ndi
1
Man
guzi
1
Park
Ryn
ie
3
1
1
1
1
1
1
1
1
1
1
1
1
1
1 Som
erse
t W
est
1
11
4
21
3
1
3
11
1
Kok
stad
1
KW
AZ
ULU
-N
ATA
L
1
1
1
3
1
1
1
1
1
1
1
1
1
11 2
Vryb
urg
1
Mas
eru
2
3814 6 10
1
Joha
nnes
burg
12
25Pr
etor
ia4 O
lifan
tsfo
ntei
n
Vand
erbi
jlpar
kVe
reen
igin
g
GA
UTE
NG
MPU
MA
LAN
GA
Geo
rge
Piet
erm
aritz
burg
SO
MA
LIA
KEN
YA
CO
NG
O
CA
MER
OO
N
ETH
IOP
IA
CH
AD
NIG
ER
GH
AN
A
MA
LIALG
ERIA
LIB
ERIA
MA
UR
ITA
NIA
SEN
EGA
L GU
INEA
BIS
SA
U
SIE
RR
A L
EON
E
LIB
ERIA
BU
RK
INA
FAS
O
IVO
RY
CO
AS
T
MO
RO
CC
O
WES
TER
NS
AH
AR
A
EGY
PT
SU
DA
N
MA
UR
ITIU
S
MA
DA
GA
SC
AR
1
2
1
AFR
ICA
TAN
ZA
NIA
DEM
OC
RAT
ICR
EPU
BLI
C O
FC
ON
GO
EQU
ATO
RIA
LG
UIN
EAG
AB
ON N
AM
IBIA
AN
GO
LA
MO
ZA
MB
IQU
E
ZIM
BA
BW
E
SO
UTH
AFR
ICA
MA
LAW
IZ
AM
BIA
SEY
CH
ELLE
S
SW
AZ
ILA
ND
NIG
ERIA
BO
TSW
AN
A
7
2
UG
AN
DA
1
1
2 1
1
Gau
teng
53
25
.63
9.8
35
.1
Kw
aZul
u-N
atal
45
21
.71
7.6
15
.9
Wes
tern
Cap
e3
31
5.9
15
.11
2.8
East
ern
Cap
e3
31
5.9
8.9
9.2
Nor
th W
est
94
.34
.27
.2
Lim
popo
83
.94
.06
.7
Mpu
mal
anga
11
5.3
4.0
5.8
Free
Sta
te1
04
.85
.35
.8
Nor
ther
n C
ape
52
.41
.21
.7
Tota
l2
07
10
0.0
10
0.0
10
0.0
Ret
ail s
ales
by
prov
ince
Mas
smar
t sa
les
per
prov
ince
Mas
smar
t st
ores
per
prov
ince
Nat
iona
l ret
ail i
ndus
try
sal
es p
er p
rovi
nce
No.
of
stor
es%
%%
Prov
inci
al s
tore
and
sal
es d
istri
butio
n
Sto
res
Insi
deO
utsi
de
by C
hain
Sou
th A
fric
aS
outh
Afr
ica
Tota
l
Gam
e6
19
70
Dio
n1
01
0
Mak
ro1
22
14
Bui
lder
s W
areh
ouse
20
20
Bui
lder
s Tr
ade
Dep
ot3
13
1
Bui
lder
s Ex
pres
s1
41
4
CB
W5
21
06
2
Jum
bo7
7
20
72
12
28
Div
isio
ns
Mas
sdis
coun
ters
Mas
swar
ehou
se
Tota
l
Div
isio
nal/
chai
n st
ore
dist
ribut
ion
Mas
scas
h
Mas
smar
tat
a g
lanc
e

R837 million(Headline earnings)
34 Federated Timbers stores acquired 1 June 2005,rebranding currently in progress
Now 31 stores
RSA
Home improvement supplies/tools/building materials
LSM 5 – 10*
378 member companiesacquired 1 March 1992
Now 478 members
RSA, Botswana, Namibia, Swaziland
Food/groceries
LSM 1 – 4*
Group profile
6 stores acquired 1 April 2001
Now 7 stores
RSA, Lesotho, Namibia, Botswana
Food/groceries/ethnic cosmetics
LSM 1 – 4*
14 Servistar stores acquired 1 June 2005,rebranding currently in progress
Now 14 stores
RSA
Home improvement supplies/tools/building materials
LSM 5 – 10*
20 stores acquired 31 May 1993
10 stores
RSA
General merchandise
LSM 6 – 10*
3massmart annual report

Strategic Principles
4massmart annual report
Strategic intentTo be considered a leader by all stakeholders
in our chosen markets.
ValuesWe value diversity, dignity and respect, integrity and trust, stewardship and
accountability, and entrepreneurship.
VisionMassmart’s vision describes the
response we strive for from stakeholders.
Customers will regard Massmart’s wholesale andretail formats as their first choice when buyingthose categories of merchandise offered by theformats.
Suppliers will regard Massmart as a valued partnerin accessing and understanding their end-consumers.
Career retailers will regard Massmart as thepreferred employer in the distribution industry.
Investors will regard Massmart as a portfoliorendering superior growth and total returns atrelatively lower risk than alternative wholesale andretail investments.
The community will regard Massmart as asensitive, caring, trustworthy, South Africancorporation.
MissionMassmart’s mission describes the assets
and competencies necessary forstrategic success.
Massmart is a South African-based internationalmanagement group, invested in a portfolio ofdifferentiated, complementary, focused wholesaleand retail formats, each reliant on high volumesand operational excellence as the foundation ofprice leadership, in the distribution of mainlybranded consumer goods for cash.
The Group actively seeks the continual improvementof performance in the portfolio and its parts, throughstrategic and structural clarity, high market shares,excellent management, principle driven ethicalleadership, cost-effective technology and thesharing or agglomeration of capabilities,knowledge, resources, influence and information.
To this end, thought leadership, individual andcollective performance, and collaborationthroughout the Group are appropriately rewarded,with executive management incentivisedpredominantly on Group performance.

5massmart annual report
Looking Back
Massmart earnings and share price performance versus JSE General Retailers Index (rebased to 100)
Jul 00 Sep 00 Dec 00 Mar 01 Jun 01 Sep 01 Dec 01 Mar 02 Jun 02 Sep 02 Dec 02 Mar 03 Jun 03 Sep 03 Dec 03 Mar 04 Jun 04 Sep 04 Dec 04 Mar 05 Jun 05 Sep 05 Dec 05 Mar 06 Jun 06
500
450
400
350
300
250
200
150
100
50
0
900
800
700
600
500
400
300
200
100
0
General retail index Massmart share price performance Massmart headline earnings
R/m’s
HEPS upby 103%
Acquisition ofJumbo and
Browns and Weirs
Acquisitionof BuildersWarehouse
Acquisitionof Furnex
HEPS upby 33%
Disposalof Furnex
HEPS up by 12% – Restated for IFRS
and otheradjustments
Massmartrestructured into
four divisions
HEPS upby 22%
HEPS upby 67%
Massmartlisted on theJSE Limitedon 4 July
2000at R12.50per share
BEEtransactionannounced
HEPS upby 28%
Acquisition ofServistar, De La Rey
and FederatedTimbers
Financial Highlights
6massmart annual report
for the year ended 30 June 2006
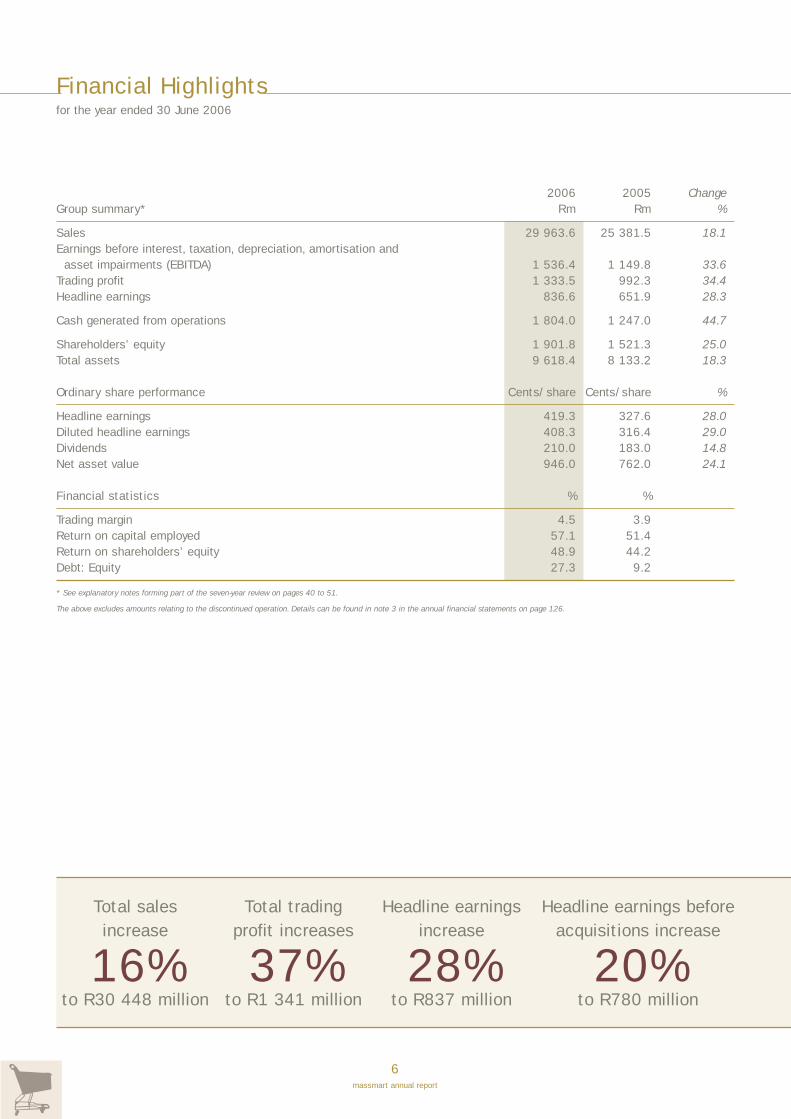
2006 2005 ChangeGroup summary* Rm Rm %
Sales 29 963.6 25 381.5 18.1Earnings before interest, taxation, depreciation, amortisation and
asset impairments (EBITDA) 1 536.4 1 149.8 33.6Trading profit 1 333.5 992.3 34.4Headline earnings 836.6 651.9 28.3
Cash generated from operations 1 804.0 1 247.0 44.7
Shareholders’ equity 1 901.8 1 521.3 25.0Total assets 9 618.4 8 133.2 18.3
Ordinary share performance Cents/share Cents/share %
Headline earnings 419.3 327.6 28.0Diluted headline earnings 408.3 316.4 29.0Dividends 210.0 183.0 14.8Net asset value 946.0 762.0 24.1
Financial statistics % %
Trading margin 4.5 3.9Return on capital employed 57.1 51.4Return on shareholders’ equity 48.9 44.2Debt: Equity 27.3 9.2
* See explanatory notes forming part of the seven-year review on pages 40 to 51.
The above excludes amounts relating to the discontinued operation. Details can be found in note 3 in the annual financial statements on page 126.
Total salesincrease
16%to R30 448 million
Total tradingprofit increases
37%to R1 341 million
Headline earningsincrease
28%to R837 million
Headline earnings beforeacquisitions increase
20%to R780 million

Operating Highlights and Prospects
7massmart annual report
Headline EPSincreases
28%to 419.3 cents
Cash flow fromoperations increases
45%to R1 804 million
Dividendincreases
15%to 210 cents per share
Operating highlightsfor the year ended 30 June 2006
The highlights of the year were:• Record total sales of R30.4 billion,
5.4% of which was from 21 foreignstores.
• Comparable store sales grew 5.5%and sales before acquisitions grew8.3%.
• Consumer credit sales comprised1.2% of Group sales.
• Total trading profit grew 36.7% toR1.3 billion.
• Pre- and post-interest operating profitmargins increased to 4.4% and 4.3%respectively.
• Full year cash flow from operationsrose 44.7% to exceed R1.8 billion.
• Return on equity increased from44.2% to 48.9%.
• The store network was increasedto 228 (922 855 m2) with theopening of 17 new stores and theacquisition of two stores withcombined estimated annual sales ofR1.8 billion.
ProspectsIt can be expected that a tightening ofmonetary policy in response to graduallyincreasing inflation will slow the
extraordinary rate of retail sales growththat South Africa has enjoyed in recentyears. There is as yet no evidence ofslower growth in Massmart’s sales andindeed recent trends suggest apromising Christmas season, which willinclude the sales from 12 new storesplanned to open before then. Our currentview is therefore that Massmart willenjoy a good first half with sales andprofit growth ahead of that of thecomparable period in 2005 and withearnings well ahead of sales growth forthe year to June 2007.
Looking beyond this, shareholdersshould be mindful of two important facts.
The first is that as a cash retailer,Massmart’s value proposition has
traditionally become relatively moreattractive to consumers in periods ofhigher interest rates. The second is thatcompany-initiated growth and profitinitiatives have historically had a greaterimpact on Massmart’s sales and profitperformance than economic cycles.
For the 15 weeks to 8 October 2006,total sales grew 16.2%, and comparablestore sales grew 12.9%, with profitgrowth significantly ahead of salesgrowth and last year. Inflation for thesame period was 3.8%.
Sales exceeded
R30 billionfor the first time
Looking Forward
8massmart annual report
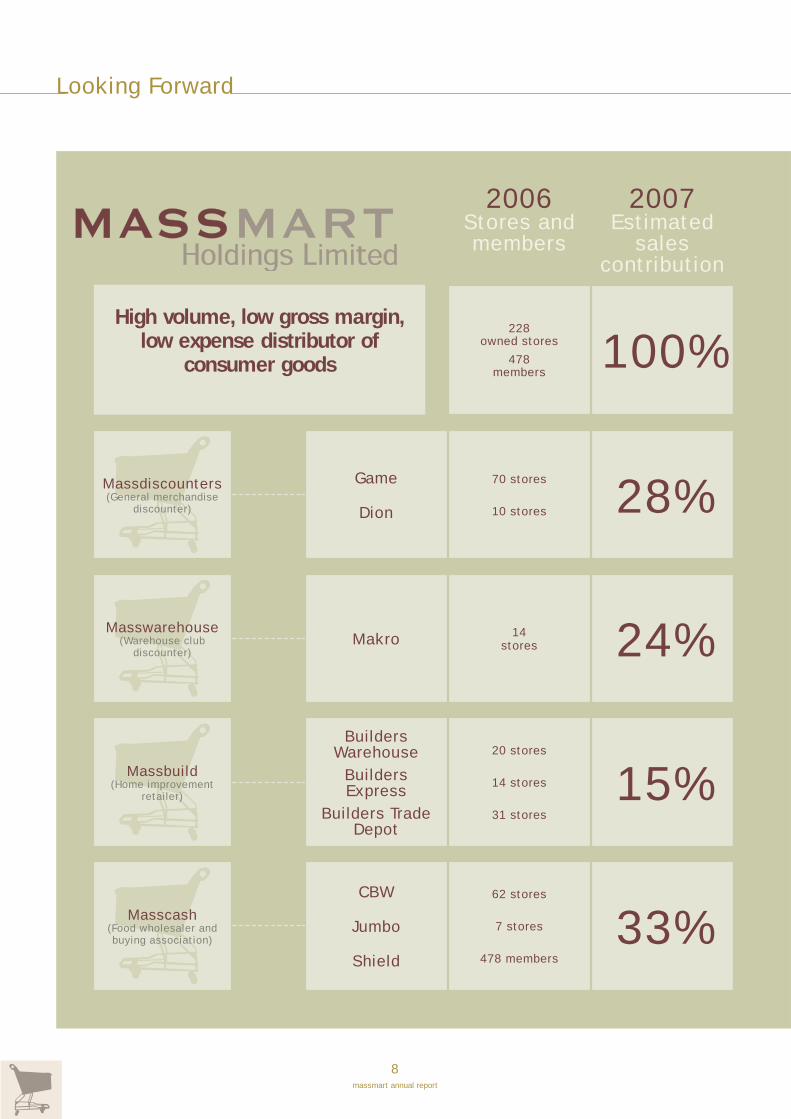
70 stores
10 stores 28%Game
Dion
228owned stores
478members
2006Stores andmembers
100%
2007Estimated
salescontribution
14stores 24%Masswarehouse
(Warehouse clubdiscounter)
Makro
20 stores
14 stores
31 stores
15%Massbuild(Home improvement
retailer)
BuildersWarehouse
BuildersExpress
Builders TradeDepot
62 stores
7 stores
478 members
33%Masscash(Food wholesaler andbuying association)
CBW
Jumbo
Shield
High volume, low gross margin,low expense distributor of
consumer goods
Massdiscounters(General merchandise
discounter)

9massmart annual report
• Manage for cash and returns• Limited store growth
62 stores
7 stores
478 members
Achieved Target International Benchmarkin 2006 Makro South America
2.1% 3.0% 3.0%
• New stores in RSA• Integrate acquisitions• Roll out new brands
34 stores
34 stores
32 stores
Achieved Target International Benchmarkin 2006 Home Depot/B&Q
7.6% 8.0% 10.0%
• New stores in RSA• Leverage customer
relationship managementcompetence
16warehouse
clubs
Achieved Target International Benchmarkin 2006 Metro AG C&C
4.1% 4.0% 5.0%
• New large Game stores inAfrica
• New small Game formatstores in South Africa
• Reposition Dion
91 stores
10 stores
Achieved Target International Benchmarkin 2006 Walmart ex food
7.1% 7.0% 7.4%
Massmart’s growth strategy• Build portfolio through
acquisitive and organic growth,based on category expertise
• Mitigate portfolio coststhrough internal collaborationand joint initiatives (notcentralised)
• Incentivise for alignment
283owned stores
478members
Achieved Target International Benchmarkin 2006
4.3% *5.0% *6.2%* Pro forma using 2006 sales mix and target margins
2007Growth vectors
2009Target stores and members
2009Targeted PBT
returns on sales

Non-executive Directors
10massmart annual report
Chris Seabrooke (53)#
BCom, BAcc, MBA, FCMA
Chairman of the Board, Chairman of theNomination and Remuneration Committee,Member of the Audit Committee.Appointed 1 February 2000.
Chris has, over the years, been a director ofover 20 JSE-listed companies. He is currentlyCEO of Sabvest Limited, Chairman of MetrofileHoldings Limited and Set Point TechnologyHoldings Limited, and a director of DatatecLimited and Primedia Limited. He is also adirector of Net1 U.E.P.S. Technologies Inclisted on Nasdaq in the USA. He is a directorof a number of unlisted companies overseasand locally, including S.A. Bias IndustriesLimited and Mineworkers InvestmentCompany (Pty) Limited in South Africa. He is aformer Chairman of the South African StateTheatre and former Deputy Chairman of boththe inaugural National Arts Council and thefounding Board of Business & Arts SouthAfrica (BASA).
Nigel Matthews (61)#
MA (Oxon), MBA (UCT)
Chairman of the Audit and Risk Committeesand Member of the Nomination andRemuneration Committee.Appointed 1 November 2001.
Nigel’s career in the South African hotel andtourism industry included the positions ofManaging Director of Holiday Inn andexecutive director of Rennies. He later startedhis own business, Sentry Group, and wasChairman of the company when it was sold toan international group in 2001. He is a non-executive director of City Lodge HotelsLimited, Sun International Limited andMetrofile Holdings Limited, and is non-executive Chairman of Lenco HoldingsLimited.
Dods Brand (63)#
Member of the Risk and SustainabilityCommittees.Appointed 25 February 2003.
Dods is the Chairman and majorityshareholder of Posse Management Group(Pty) Limited and Posse Investment Holdings(Pty) Limited. He has extensive experience inretail and was Chief Executive Officer ofMoregro (Morkels Retail Group Limited), inwhich he held various directorships and seniorpositions in both the Group and its chains. Hewas also a director of KAP Beteiligungs AG, aFrankfurt-listed company, as well as a numberof JSE-listed companies. Dods is currently anon-executive director of Peermont GlobalLimited and Johnnic Communications Limited.
Zitulele (“KK”) Combi (54)#
Chairman of the Sustainability Committee.Appointed 25 February 2003.
KK is currently the Executive Chairman ofMaster Currency. He also holds directorshipsat the VAT Refund Administrators, RegionalBoard of ABSA (Western Cape), Master Coin(Pty) Limited, and Combi and Co (Pty) Limited.He is a member of the SA Institute ofDirectors, the World Entrepreneur Academy,and a member of the world CEO Organisation.In 2000 he was awarded SA Entrepreneur ofthe Year, in 2001 he was awarded the CapeTimes Business Personality of the Year, theIMM Award for Outstanding Achievement, wasnamed as Ernst & Young’s World Entrepreneurof the Year for Managing Change and receivedthe Entrepreneurship Award from theSouthern African Enterprise Network. In 2003he received the SABC 2 Tribute MagazineAchievers Award in the business category.
James (“Jim”) Hodkinson (62)*#
Appointed 25 August 2004.
Commencing in 1962 as trainee manager, Jimprogressed through a multi-functional careerin retail to attain the position of ChiefExecutive for B&Q PLC, a subsidiary ofKingfisher PLC, in which capacity he served forfour years. Amongst other roles held atKingfisher, Jim served as InternationalDevelopment Director and led the pursuit ofopportunities in Asia. After a short term atHome Depot (USA), Jim returned to B&Q asChairman and Chief Executive and served onthe Kingfisher board as Chairman of DIY. AsChief Executive of New Look PLC, Jimtransformed a family-owned business to apublic company with a multinational footprint.Currently, Jim is the Chairman of Wyevale PLCand his directorships include PolymerLogistics, Big Idea Management, FurnitureVillage, Ideal Shopping Direct and PJH, all UK-based companies.
Phumzile Langeni (32)#
Member of the Sustainability Committee.Appointed 25 August 2004.
Phumzile Langeni is currently an executivedirector of Anooraq Resources, a Canadianjunior platinum mining company listed on theToronto Venture Exchange and the AmericanExchange (AMEX). Prior to joining Anooraq, shewas an executive director of BJM Securities.A stockbroker by profession, Phumzile haspractised as an equity trader for both local andinternational institutions. Following a term atReal Africa Durolink (RAD) securities whereshe subsequently sat on the board, she wasone of the founding members and executivedirector of Mazwai Securities. She remains a
practising member of the South AfricanInstitute of Stockbrokers, is a non-executivedirector of Imperial Holdings, a member ofthe ALT-X Advisory Board and a member of theSecurities Regulation Panel.
Peter Maw (45)#
BCom (Hons), CA(SA), HDip Tax Law
Member of the Audit and Risk Committees.Appointed 25 February 2003.
Peter is a specialist in private equity andcorporate finance and heads the privateequity interests of the Oppenheimer family inSouth Africa. He was one of the founders ofPrimedia Limited and, as an executive directorfrom 1992 to 2003, was responsible for all ofits corporate finance activities. Peter remainsa non-executive director and member of theAudit and Risk Committees of PrimediaLimited. Prior thereto, following thecompletion of his articles at Coopers andLybrand in 1987, Peter spent two years incorporate finance at Standard Merchant Bankbefore co-founding Merhold Kirsh Capital in1991.
Dawn Mokhobo (57)#
BA (Social Science)
Member of the Nomination and RemunerationCommittee, and the Sustainability Committee.Appointed 1 June 2002.
Dawn is a member of the boards of directorsof Nozala Investments, Engen, CapacityOutsourcing, Vitalair, Sabvest and serves asChairperson of the Fedics Group, AfricanInternational Advisors (AIA), and Empowerdex.Dawn is a previous recipient of the SouthAfrican Businesswoman of the Year Award.
Michael Rubin (56)#
BSc, MBA (UCT), MBA (Columbia)
Member of the Sustainability Committee.Appointed 30 August 1990.
Michael worked as a specialised retailconsultant in New York and Toronto for nineyears. After returning to South Africa, hejoined Massmart as Development Directorin 1989. Michael left Massmart in 1997to become involved in private equitymanagement and property development.
* United Kingdom# Independent

Executive Directors
11massmart annual report
Mark J Lamberti (56)BCom, MBA (Wits), PPL (Harvard)
Chief Executive Officer and Deputy Chairmanof the Board, Chairman of the ExecutiveCommittee.Appointed 1 August 1988.
Following progress through a multi-functionalretail career that began in 1975, Mark wasappointed Managing Director of the ailing sixstore Makro chain in 1988. Following thesuccessful repositioning of the chain, hefounded Massmart in 1990 to pursue anaggressive growth strategy in high volume, lowgross margin, low expense retailing andwholesaling.
His role as architect and leader of Massmarthas been widely recognised with numerousawards including that of the Ernst & YoungSouth African Entrepreneur of the Year in1994. In 1996 he was appointed ExecutiveChairman of Massmart and from July 2003CEO and Deputy Chairman of the Board incompliance with the JSE Limited requirements.
Mark serves on the board and auditcommittee of Allied Electronics CorporationLimited, a leading South African controlledinformation and communication technologyand power electronics group. His commitmentto education has led to his involvement as abenefactor, director, or advisor to a number ofeducational institutions.
Grant Pattison (35)BSc (Eng)
Chief Executive Officer Designate, Member ofthe Risk Committee and Member of theSustainability Committee.Appointed 7 December 2004.
Grant holds a BSc degree with honours inElectrical Engineering from the University ofCape Town. Following four years with the AngloAmerican Group and two years consulting withThe Monitor Group, Grant joined Massmart asExecutive Assistant to the Executive Chairmanin June 1998. He has since held variouspositions within the Group, includingManaging Director of Massdiscounters andMasscash. He was appointed to the ExecutiveCommittee in 2000, to the Board on7 December 2004, to the position of DeputyChief Executive Officer on 1 July 2005, andto his current position of CEO Designate on1 June 2006.
Guy Hayward (41)BCom, CTA, CA(SA)
Chief Financial Officer, Member of the RiskCommittee, Secretary to the Nomination andRemuneration Committee.Appointed 15 May 2001.
Guy graduated from the University of CapeTown in 1986 and qualified as a CharteredAccountant with Deloitte Haskins & Sells in1989. Previous work experience includessenior financial roles at Malbak, CNA Galloand investment bank, Goldman Sachs, inLondon. Guy joined Massmart as GroupFinancial Executive in 2000 and wasappointed Chief Financial Officer in 2001.
Stephanus (“Fanus”)Nothnagel (44)BCom, Dip MAct, ACMA
Chief Operating Officer and Member of theRisk Committee.Appointed 25 May 2005.
Fanus’s early career was spent at LeverBrothers and South African Breweries,whereafter he joined SC Johnson & Son asFinancial Director, South Africa, beforespending three years in marketing and salesin the United States. In 1999, Fanus returnedto South Africa as Managing Director of SCJohnson & Son South Africa, which wasfollowed by his promotion to General ManagerSC Johnson throughout sub-Saharan Africa.Fanus joined Massmart as Managing Directorof Massdiscounters and a member of theExecutive Committee in July 2003. From 1 July2005, he was appointed Chief OperatingOfficer with responsibility for Massdiscountersand Masswarehouse.

Executive Committee
12massmart annual report
The Executive
Committee, chaired by
Mark Lamberti,
comprises Guy Hayward,
Grant Pattison, Fanus
Nothnagel, and the
following executives:
Aubrey Cimring (35)BCom (Hons), CA(SA)
Deputy Chief Financial Officer
Aubrey qualified as a CharteredAccountant in 1995. Previouswork experience includes the roleof Financial Director at ChoiceHoldings Limited before joiningDiscovery Holdings Limitedwhere, for almost six years, heheld the senior financial role atboth Discovery Health andDiscovery Holdings. Aubrey joinedMassmart in the role of GroupFinancial Executive and CompanySecretary in February 2003 andwas appointed to the ExecutiveCommittee in February 2005. Hewas appointed Deputy ChiefFinancial Officer in May 2005.
Gareth (“Joe”)Owens (57)
Divisional Chief Executive
With effect from 1 July 2005, Joewas appointed Chief Executive ofthe Massbuild division,comprising Builders Warehouse,Federated Timbers, De La Reyand Servistar. Joe was previouslythe Chief Executive Officer ofMakro, having first joined thecompany in July 1971. Followinga period with the Checkers groupfrom 1978, he returned to Makroin October 1988 as MerchandiseDirector, and was appointedManaging Director in 1993. Joehas 35 years of mass merchant,general merchandise and FMCGexperience.
Robin Wright (50)BCom, CA(SA)
Divisional Chief Executive
After studying at Natal Universityand serving articles with Ernst &Young, Robin qualified as aChartered Accountant in 1978and spent six years in retailingand wholesaling at WG Brownbefore founding CCW in 1985. In1998 Robin sold a controllinginterest in CCW to Massmart andwas appointed to the ExecutiveCommittee. He subsequently ledthe acquisition and integration ofBrowns and Weirs, and thegrowth of the division to becomeSouth Africa’s leading foodwholesaler.
Massdiscounters
Mark Lamberti (56)
Chairman
Guy Hayward (41)
Fanus Nothnagel (44)
Divisional Chief Executive
Jan Potgieter (37)
BCompt (Hons), CTA, CA(SA)
Financial Director
Joined Massdiscounters
2005
Mark Turner (37)
BCompt (Hons), CA(SA)
Marketing Director
Joined Massdiscounters
2006
Rob Barrell (49)
Store Operations Director
Joined Game 1981
John Hart (40)
BCom, MBA
Systems & Supply Chain
Director
Joined Massdiscounters
2005
Tyrone Vieira (34)
Merchandise Director
Joined Dion 1991
Pearl Maphoshe (38)
BA, MA
Human Resources
Director
Joined Massdiscounters
2006
Masswarehouse
Makro
Fanus Nothnagel (44)
Chairman
Mark Lamberti (56)
Guy Hayward (41)
Grant Pattison (35)
Kevin Vyvyan-Day (41)
Divisional Chief Executive
Joined Makro 2005
Bruce Cayzer (46)
Food Director
Joined Makro 1999
Michael Jordan (51)
ACIS, ACMA, GMP (Michigan),
MBA
Financial Director
Joined Makro 1999
Derick Kalan (38)
General Merchandise Director
Joined Makro 1986
Gert Lourens (52)
Operations Director
Joined Makro 1993
Thuli Mpshe (47)
BCom, Postgraduate
Certificate in Business
Management
Human Resources Director
Joined Makro 2003
Chris Nezar (48)
BCom, MBA
Marketing Director
Joined Makro 1989
Divisional directorate

13massmart annual report
Kevin Vyvyan-Day(41)BCom (Wits), BAcc (Wits),CA(SA)
Divisional Chief Executive
After graduating from Wits, Kevincommenced articles with Deloitteand qualified as a charteredaccountant in 1989, whereafterhe consulted at both the StrategyGroup – Deloitte as well as atGemini Consulting. Kevin joinedUPD as the Group Operations andSystems Director in 1995 andwas appointed Group ChiefExecutive Officer in December1996. Kevin joined Massmart asa member of the ExecutiveCommittee and Divisional ChiefExecutive responsible for Makroon 1 August 2005.
Richard Potash (33)BBusSci(Hons), MCom
Divisional Chief Executive
Richard graduated from theUniversity of Cape Town with aBusiness Science degree anda Masters degree in FinancialManagement. After four years inmerchant banking with ABSACorporate and Merchant Bankand Standard Corporate andMerchant Bank, he joined Afgri asOperations Director and a memberof the Executive Committee.Richard joined Massmart on1 July 2005 as Divisional ChiefExecutive and a member ofthe Executive Committee withresponsibility for Shield andFurnex. Richard is now responsiblefor Shield, Jumbo and Cell-Shack.
Steve Glendinning(45)BSocSci (Hons), MEd (EdPsych), Senior Exec Program forSA (Harvard)
Group Organisational Executive
Steve was appointed GroupOrganisational Executive in May2002, with Group responsibilityfor human capital and thecoordination of Group Organi-sation Development. He waspreviously an executive directorof Massdiscounters. Prior tothat, Steve gained extensiveexperience in industry andconsulting which included fouryears with Deloitte & ToucheConsulting Group and executivepositions in the Mondi division ofAnglo American.
Jay Currie (32)BSc
Group Commercial Executive
Jay graduated from NatalUniversity with a BSc in Biologyin 1995. Following a periodmanaging the Mala Mala GameReserve and after founding asmall IT solutions provider,Jay joined Massdiscountersin the role of IT TechnicalManager in November 1999.He was appointed tothe Massdiscounters board,responsible for IT, in 2002. Heassumed responsibility for thesupply chain of that company in2003 and was appointed to theMassmart Executive Committeein the role of Group CommercialExecutive in January 2006.
Massbuild
Mark Lamberti (56)
Chairman
Joe Owens (57)
Divisional Chief Executive
Guy Hayward (41)
Aubrey Cimring (35)
Norman Kretzmer (43)
BCom, BAcc, CA(SA)
Joined Builders Warehouse
2004
John Keil (60)
CA(SA)
Joined Servistar 1980
Robbie Best (43)
BCom, CA(SA)
Joined De La Rey 2003
Graham Booysen (42)
MBA (Henley)
Joined Makro 1994 and
Federated Timbers 2006
Carlos Gomes (38)
Joined De La Rey 1989
Alison Lambert (48)
BA, HDE
Joined Makro 1989 and
Massbuild 2005
John Hudson (51)
BCom, MBA
Joined Makro 1985 and
Massbuild 2005
Llewellyn Steeneveldt (37)
BSc Metallurgical (Eng), GDE
(Ind.Eng.), MBA
Joined Massmart 2002 and
Servistar 2006
Masscash
Shield
Grant Pattison (35)
Chairman
Guy Hayward (41)
Aubrey Cimring (35)
Richard Potash (33)
Divisional Chief Executive
Joined Massmart 2005
Bradley Evelyn (53)
BCom, Postgraduate Diploma
in Accounting
Financial Director
Joined Game 1986 and
Masstrade 2004
Ahmed Goondiwala (65)
Business Development
Director
Founded Shield 1973
John Loomes (38)
MBA
Retail Franchise Director
Joined Shield 2003
Mike Marshall (49)
FCMA
Business Systems and
Process Director
Joined Shield 2004
Richard Millson (34)
BCom (Hons), MBA
Director
Joined Massmart 2002 and
Masstrade 2004
CBW
Grant Pattison (35)
Chairman
Guy Hayward (41)
Jay Currie (32)
Robin Wright (50)
Divisional Chief Executive
Neville Dunn (37)
BCom, CA(SA)
Financial Director
Joined CBW 2002
Mike Marshall (49)FCMA
Business Systems and
Process Director
Joined CBW 2006
Craig Surmon (44)Marketing Director
Joined CBW 1987
JumboGrant Pattison (35)Chairman
Mark Lamberti (56)Aubrey Cimring (35)Fred Cresswell (39)BSc Civil (Eng), MBA
Managing Director
Joined Massmart 2001 and
Jumbo 2002
Chris Lourens (46)Management Diploma, MBA
Operations Director
Joined Makro 1991 and
Jumbo 2005

14massmart annual report
Investment Proposition
Within southern African retail and wholesale distribution,is a unique investment offering:
Strategic and structural clarity• Strict adherence to organic and acquisitive growth
criteria
• Focused divisions, each a leader in its target
market and business type
• Additional value created through inter-divisional
collaboration
• Behaviour aligned by short- and long-term
incentives
Management quality and depth• The top 85 executives, average age 45, hold
138 degrees and have an average 15 years’
retail or wholesale experience
Diversification• Customers – All mass market socio-economic
strata
• Geography – Eleven sub-Saharan African countries
• Merchandise – Leadership in five general
merchandise categories and liquor, with a
significant wholesale food profile
• Formats – Optimum deployment of appropriate
formats in different markets
Revenue growth• Proven record of successful organic (33%) and
acquisitive (15 acquisitions) growth
• Proven record of comparable store sales growth
• Consistent merchandise innovation
• New stores in South Africa planned for Game,
Makro, Builders Warehouse, Builders Express and
Builders Trade Depot
• New stores in Africa planned for Game
• Acquisition opportunities constantly under
consideration
Profit growth• Growing productivity of capital, space and labour
• Improving operating practices and expense and
working capital reduction
• Inter-divisional collaboration
• Higher growth in higher net margin Chains
• Commencement of supply chain enhancement
Relatively low risk• Diversified portfolio of low cost business models
with complementary margin and cash
characteristics
• High cash generation and high cash earnings
• Retail credit only 1% of total sales
Good governance• Record of good disclosure
• Compliant with the King II Report on Corporate
Governance
• Compliant with the JSE SRI Index criteria
• Member of the Ethics Institute of South Africa

15massmart annual report
The operating environmentThe economic environment in South Africa remained highly
favourable to retailers during the financial year, with consumer
confidence high and record sales growth in the retail sector.
In the ten other countries in sub-Saharan Africa in which the
Group has outlets, the economies were relatively stable, with
the notable exception of Zimbabwe.
The socio-political environment in South Africa is stable and
continues to mature, with the exception of increasing levels
of crime and violence in some areas, requiring increased
store security and affecting the home lives of many of the
Group’s executives and employees. It is fundamentally
important that Government prioritises programmes aimed at
reducing crime levels nationally.
PerformanceMassmart’s management has again delivered a superb set of
results. Revenue from continuing operations increased 18.1%
to R29.9 billion and headline earnings per share increased by
28% to 419 cents per share. All four of the Group’s divisions
performed well, with particularly strong growth in earnings
from Masswarehouse and Massbuild.
All four of the Group’s key productivity ratios were maintained
or improved, reflecting management’s focus on improving
returns in the context of the Group’s value proposition to
consumers.
Sales have grown at a compound rate of 19.4%, profit aftertax at 42.3% and headline earnings per share at 32.8% overthe past seven years – a remarkable performance indeed,particularly given the size and scale of the Group.
Massmart’s balance sheet is strong, its liquidity levels arehigh, and structural and liquidity risks remain negligible.
Strategic developmentsThe Group has well defined mission statements and strategies,all of which have been well communicated to stakeholders.
Massmart concentrates on building its portfolio ofdifferentiated, complementary, focused wholesale and retailformats distributing mainly branded consumer goods for cashin sub-saharan Africa.
Massmart grows both organically and by acquisition andcontinues to use its collaborative channel strategies tobalance the returns generated by the divisions.
GovernanceThe Board of Massmart comprises four executive directorsand nine independent, non-executive directors, three of whomare black and two of whom are female.
The Board has targeted that in due course at least 50% of thenon-executive directors should be black, 30% should befemale and the majority of the non-executive directors shouldcontinue to be independent.
We intend to appoint a further two black non-executive directors
in the coming year, at least one of whom will be female.
The non-executive directors have an appropriate mix of retail,
financial, governance and human capital skills. The Board and
its committees functioned well during the year. A fourth
committee focusing on sustainability issues has been
established under the chairmanship of Mr KK Combi.
The Board regards its key functions as:
• The keepers of strategy;
• The monitors of risk;
• The custodians of management excellence;
• The overseers of performance of the Company
Sound corporate governance has been maintained at all
levels and I am pleased to refer stakeholders to the detailed
corporate governance review contained in this report.
Letter from the Non-executive Chairman
The CEO’s successionOne of the most important functions of any board is to ensureeffective and transparent succession planning. In anticipationof the retirement of Mark Lamberti as Group CEO in June2007, a comprehensive succession process has been underway since 2004. This included an exhaustive selectionprocess and a benchmarking exercise by a leading executivesearch professional.
This resulted in us being able to make the very pleasingannouncement in May this year that Mr Grant Pattison wouldbe appointed CEO Designate from 1 June 2006 and that hewill take over as Chief Executive Officer on 1 July 2007. Hisappointment is unanimously supported by the Board and theExecutive Committee and has been well received by the Groupand its stakeholders. He is an exceptional executive, who iswell equipped to lead Massmart and its highly qualifiedmanagement team.
I should like to pay tribute to Mark Lamberti for the thorough,comprehensive and selfless approach he has followed in thisprocess which is evidenced by a very satisfactory outcomefully supported by his executive and non-executive colleagues.
Future chairmanshipMy Board colleagues and I are unanimously of the view thatthe interests of Massmart’s stakeholders will be very wellserved by the retention of the skills and experience of MarkLamberti in a non-executive capacity within the Board andcommittee forums after his retirement as CEO. In arriving atthis conclusion we held numerous discussions over a lengthyperiod to consider the matter carefully from the perspectivesof governance, continuity, risk, perception, the needs ofMassmart’s constituents and shareholders, the personalitiesinvolved, general succession issues and Board functionality.We accordingly decided to offer Mark the non-executivechairmanship of the Group from 1 July 2007 and were verypleased that he accepted.
The chairmanship will continue to be completely non-executive and subject to all existing policies relating toremuneration and tenure.
To further facilitate sound governance, the roles of DeputyChairman and CEO will be separated and, at the request ofthe Board, I have agreed to serve as independent DeputyChairman and lead independent director from 1 July 2007. Inaddition, the chairs of the four Board committees willcontinue to be held by independent directors.
I believe this is a very satisfactory outcome for the Group andwill optimise future Board performance.
Sustainable developmentAn exceptionally detailed sustainability report is included inthe financial statements. The report reflects the strongprogress made, in particular in the formulation of acomprehensive BEE staff share ownership transaction whichwill be implemented in the current financial year.
I am proud to note in the report the clear evidence in all areasthat Massmart is proactively addressing the inequalities ofthe past and the vision of a united South African society inthe future, through its commitment to employment equity andCSI programmes, its innovative approach to promotingenterprise development and the inclusion of BEE targets asthe sole qualitative element of executive incentive schemes.
ShareholdersI am pleased to welcome all new shareholders who haveinvested in the Group during the year. The Group now has6 629 registered shareholders including 4 803 individualsand numerous retirement, endowment and investment funds.The Group has no controlling shareholder or shareholder ofreference and its shares are widely held in South Africa andabroad. It is interesting to note that the foreign shareholdingin the Group continued to increase and now exceeds 60%, themajority of which are domiciled in the USA, with the balancepredominantly in the United Kingdom and Europe.
Liquidity in the shares has again improved. Shares traded inthe past twelve months amounted to 116% of issued sharecapital making Massmart one of the more liquid shares onthe JSE.
AppreciationI record my personal appreciation to my colleagues on theBoard and to the CEO and his team for their unfailing support,and also to the Group’s professional advisors and bankers forthe high quality of their services to the Group.
It has been a pleasure and honour to lead the Board of thisexceptional Group over the past year and I look forward to thelast year of my tenure as Chairman with excitement andenthusiasm.
Christopher Seabrooke17 October 2006
16massmart annual report
Letter from the Non-executive Chairman continued
17massmart annual report
Letter from the Deputy Chairman and Chief Executive Officer
A remarkable yearIf the intention of this report was simply to comment onyesterday, it would be an easy one to write.
Consumer confidence soared to its highest level in recordedhistory in the first quarter of 2006, manifest in an averageannual growth of retail industry sales at constant 2000 pricesof 6.9% in the second half of 2005 and, ahead ofexpectations at 9.6% in the first five months of 2006.
General business confidence mirrored that of consumers in allbut the last quarter, when a slowdown in the growth of vehiclesales and house prices was accompanied by a correction tothe stock market and a deterioration of the Rand.
Against this backdrop, all but the most incompetent retailersprospered. Most retailers reported high rates of comparablestore sales growth, many embarked on aggressive new storeprogrammes and those who could, extended credit to avoracious market. The consolidation of South African retailcontinued apace and, with national chains now the majorparticipants in every retail category other than liquor,competition for the most part was aggressive but rational.
For all of us privileged to lead your company, 2006 was a yearof extraordinary corporate and personal achievement in whichstrategic evolution, structural development and operationalcontrol converged to produce a group-wide, record financialperformance by any measure. Massmart is more valuablethan a year ago, and we laud all who made it so.
Massmart has now delivered 35 consecutive half years ofreal sales growth over 8% and our 16 consecutive half yearsof headline earnings per share growth, which hascompounded at 31.1% over the past five years.
But looking backwards in celebration will do little to help youdecide on a future relationship with the Group. My morechallenging obligation is therefore to provide insight into whywe did what we did and to share those of today’sphilosophies, strategies and plans that will determine thedirection and shape of Massmart tomorrow.
Refining the strategy and portfolioStarting with a modest six store base 18 years ago,Massmart has become the third largest retailer in Africa –more profitable than the two slightly larger competitors – asa direct consequence of strategic thinking. We are thoughtfulabout every aspect of our business, but particularly so aboutstrategy. We have developed the disciplines necessary toidentify and analyse the strategic significance of changes inthe world around us, we believe that there is little chance ofsustained business success without a strategic context andwe know that strategy is not long term planning.
Our understanding of strategy is best captured by MichaelPorter’s 1996 comment: “In many companies, leadership hasdegenerated into orchestrating operational improvements andmaking deals. But the leader’s role is broader and far moreimportant. General management is more than the steward-ship of individual functions. Its core is strategy: defining andcommunicating the Company’s unique position; making trade-offs; and forging fit among activities.”
We respond to this enjoinder both as a Group and as itsconstituent parts.
“Unique positioning”Massmart is uniquely positioned in South African retail. Anysusceptibility to economic cycles resulting from its leadershipin the general merchandise and home improvement sectors(52% of Group sales), is mitigated both by its participation inwholesale food and its cash profile (consumer creditconstitutes only 1.2% of Group sales). Massmart cannot becompared to the furniture or fashion credit retailers who aremore cyclical or the food retailers who are less so.
Within the divisions we strive at all times to achieve asustainable difference in the minds of customers by virtue ofgeographic location, retail format, merchandise mix,marketing appeal and business model.
18massmart annual report
“Trade-offs”We are clear about the trade-offs. Firstly, we are a subSaharan African business and we regard the risks of venturingbeyond this territory as too high to contemplate. Secondly, weare a low gross margin, low expense, cash business and weavoid consumer credit in the firm belief that it will introducerisk that our low gross margins cannot support, andcomplexity and cost that will ultimately undermine our lowprice value proposition to customers. Thirdly, we will notoperate small stores that could reduce the low expense tosales ratio, which results from our distributing 17% of thesales and 19% of the cost of sales of all JSE listed retailersthrough only 2% of the outlets. Our average sales per store ofR122 million is core to the productivity ratios that underpinour low prices and we regard the courage and competence tooperate very large stores as part of our competitive strength.Finally, being mindful of the distinct differences betweenvarious lines of retail trade, we are cautious about venturinginto product categories that require substantially differentskill sets to those we have.
In the divisions and trading entities, we resist the temptationto copy competitors, we are increasingly selective in ourpursuit of quality sales, and we avoid situations where theonly basis of competition is operational efficiency, which weknow is seldom sustainable.
In short we are very clear about what we will and what we willnot do, and we have been faithful to our strategic criteria inall of the acquisition or organic development decisions that
have resulted in a 25% compounded growth of sales over thepast eighteen years. The efficacy of our strategy wasconfirmed during the past year by Deloitte ranking Massmartas the 24th fastest growing of the largest 250 retailers in theworld over the past five years.
“Fit among activities”Our enduring strategic quest is the pursuit of value beyondthe sum of Massmart’s parts. We create this value by seekinginter- and intra-divisional synergy, alignment and inter-dependence between the many complementary andsupporting activities that comprise our supply chain, withoutever undermining front line management responsibility forcustomers or profits.
We give effect to this objective through central control ofstrategy, capital, performance and leadership development,and by promoting divisional collaboration in: procurement;the coordination of retail positioning, promotion and pricing;the sharing of non-differentiating services; the developmentof human capital; benchmarking and learning. Weconstantly seek out opportunities to simplify our business,to eliminate complexity and to obtain the highest possiblereturn on managerial effort. How we do things is asimportant as what we do.
Portfolio developmentOver the past year the application of these preceptsenhanced divisional focus and the size of the portfolio, andmoved the Group closer to its targeted returns by enhancing
Letter from theDeputy Chairman and Chief Executive Officer continued
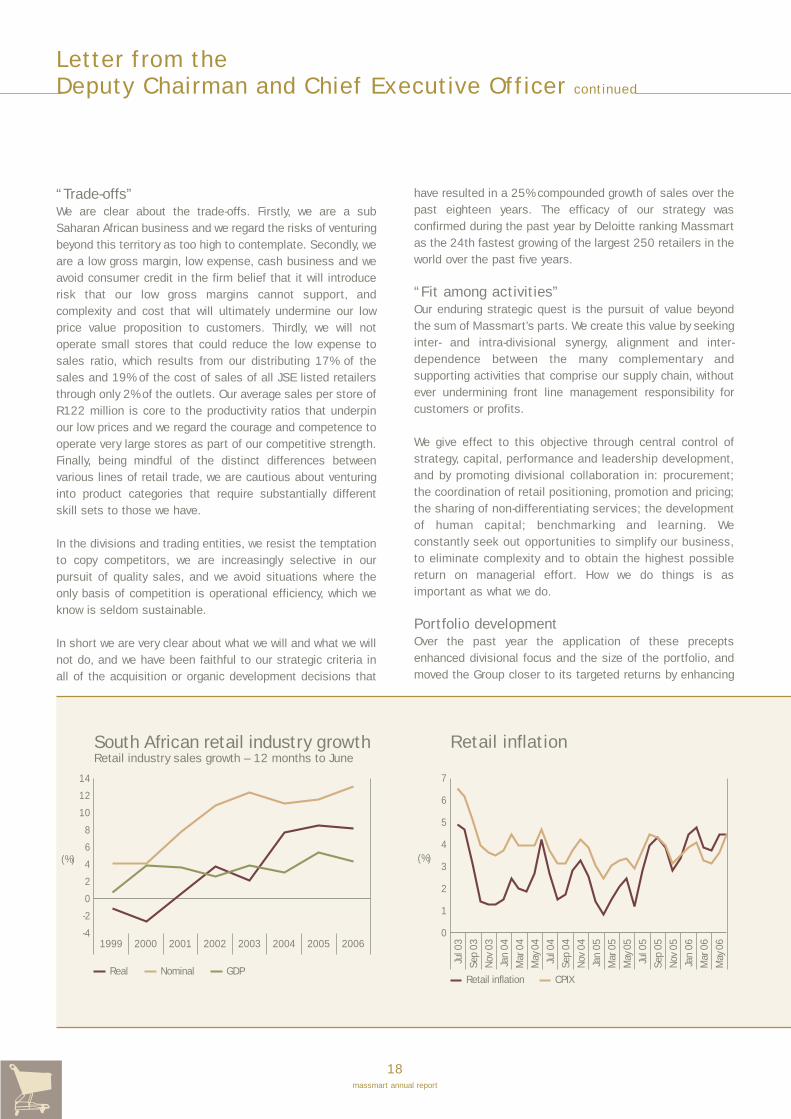
South African retail industry growthRetail industry sales growth – 12 months to June
1999
14
12
10
8
6
4
2
0
-2
-42000 2001 2002 2003 2004 2005 2006
GDPReal Nominal
(%)
Retail inflation
7
6
5
4
3
2
1
0
Retail inflation
Jul 0
3
CPIX
Sep
03
Nov
03
Jan
04
May
04
Jul 0
4
Sep
04
Nov
04
Jan
05
May
05
Jul 0
5
Sep
05
Nov
05
Jan
06
Mar
06
May
06
Mar
04
Mar
05
(%)

19massmart annual report
Massmart has now delivered35 consecutive half years of real sales growth over 8%
the value proposition to customers, improving working capitalmanagement, space productivity and containing costs withoutcompromising asset development and renewal.
Massdiscounter’s role as Southern Africa’s leading generalmerchandise discounter (trading under the Game andDion brands) was entrenched with the opening of nine newstores – some which were a new more efficient Game formatthat will enable us to penetrate smaller markets that werepreviously not viable – and through the formulation of plansfor the rationalisation and repositioning of the Dion chain asa new appliance and home electronics format, which will betested in the current year.
The Masswarehouse leadership in warehouse clubdiscounting (trading as Makro) advanced as the new storesopened in 2005 became more profitable, the better use ofMakro’s unique Customer Relationship Management softwareenhanced sales and margins, and the decision was taken toopen two more outlets over the next three years.
Massbuild’s position as South Africa’s leading homeimprovement retailer (in future trading under the BuildersWarehouse, Express and Trade Depot brands) wasestablished with the opening of four new Builders Warehousestores and the definition of the strategy, structure, formats,footprint and brands necessary to integrate the businessesacquired over the past three years as a national chain undera unified management team.
The competitiveness and prospects of Masscash, our foodwholesaling business (trading under the CBW, Jumbo andShield formats), were enhanced by the acquisition of twostores, the sale of Furnex, investment in the refurbishmentand management in Jumbo, and the clarification of anintegration strategy that will optimise our position in the cashand carry wholesaling of basic food, groceries, liquor andhousewares to smaller independent retailers.
The Massmart portfolio now comprises 228 stores, distributingthree major product categories, through four divisions undernine retail brands in 11 countries in sub-Saharan Africa.
Vision 2009We remain committed to a formal annual strategic reviewwhich charts our course over the following three years withinour strategic constraints and in response to environmentaland industry developments.
In early 2006 this process resulted in the formulation of“Vision 2009”, the successful implementation of which will
result in sales growth in excess of the sum of gross domesticproduct growth, inflation and space growth, with cash profitgrowth well in excess of this over the period.
This will be achieved through the strategic developmentsdescribed above, the unrelenting pursuit of operating efficiency,trading tactics to increase real comparable store sales growth– in our view the most critical measure of retail performance –and the carefully researched opening of 58 stores which willgenerate additional estimated sales of R6.5 billion by June2009. Of these, 27 stores will be opened in the current yeargenerating estimated annualised sales of R2.0 billion.
Aborted acquisitionIn October 2005, the Competition Commission recommendedthe prohibition of Massmart’s acquisition of 84.1% ofMoresport for R403.8 million, first announced on 26 April2005. In April 2006 the Competition Tribunal upheld thisdecision. The parties and their advisors are of the view that theCommission and the Tribunal erred in their analysis anddecisions, failing to show how the merged entity could possiblyundermine competition or impinge negatively on anystakeholder, none of whom were opposed to the transaction.
Massmart wished to proceed with the appeal against theTribunal’s decision but it was possible that a ruling would onlybe handed down in September 2006 or later, 16 months ormore after the transaction was entered into. This presentedthe Sellers (Vestacor, Nedbank and Moresport management)with a diminution of relative value and with challenges relatingto the management and growth of Moresport within theconstraints of a sale agreement. The Sellers’ positionbecame untenable and they decided not to proceed with anappeal. The parties therefore agreed to terminate allagreements between them with effect from May 2006.
Increasing organic growthWhile acquisition remains a part of our growth strategy, it isclear that the importance of acquisition as the primary driverof Massmart’s sales and profit growth is declining. Havingachieved the requisite critical mass, Massmart’s excitinggrowth prospects are not reliant on acquisitions.
20massmart annual report
Letter from theDeputy Chairman and Chief Executive Officer continued
Increasingly, sales growth is being driven by expeditious newstore development, innovative merchandising and marketing,and the refinement of the positioning of the retail propositionto customers. This trend is reflected in the fact that 46% oflast year’s growth was organic, compared to 33% ofMassmart’s growth since 1988.
The growth of profits and operating margins is being driven byimproving operating efficiencies, increasing the participationof higher margin merchandise, and emphasising the growthand development of higher margin business models in theportfolio. Over the past three years the 25.5% improvementin operating margins has resulted from each of these, thelatter reflected in a decline in the sales participation of thelower margin food and liquor categories from 59.0% to 49.4%in favour of the higher margin general merchandise and homeimprovement categories.
Embracing sustainabilityOne of the benefits of the advent of good corporategovernance as a business practice rather than as anexpression of leadership diligence and integrity is the conceptof sustainability. Couple this to the notion of the incapacity ofthe Company and you start to think about many dimensionsof business leadership in a different way. We certainly have.
While always respecting the rights of owners, we have neversubscribed to the concept of shareholder supremacy, whichruns the risk of ignoring or demeaning the rights of otherstakeholders. Allied to this we have always eschewed short-term thinking. But sustainability practice has broughtdiscipline, structure and measurement to bear on ourapproach to the long-term interests of stakeholders. There isno doubt that Massmart is a better company as a result andwe report fully on our progress with sustainability as a majorsection of this report.
During the past year we registered progress on fiveparticularly noteworthy initiatives that will enhanceMassmart’s sustainability for many years to come.
Choosing my successorLast year we reported generally on our management ofsuccession and specifically on the process that would befollowed to select my successor on the expiry of my contractin June 2007.
While the choice of Chief Executive is arguably a Board’s mostonerous decision, I regard succession as a Chief Executive’sresponsibility and have accordingly devoted time to studyingand observing CEO succession practice over many years. This
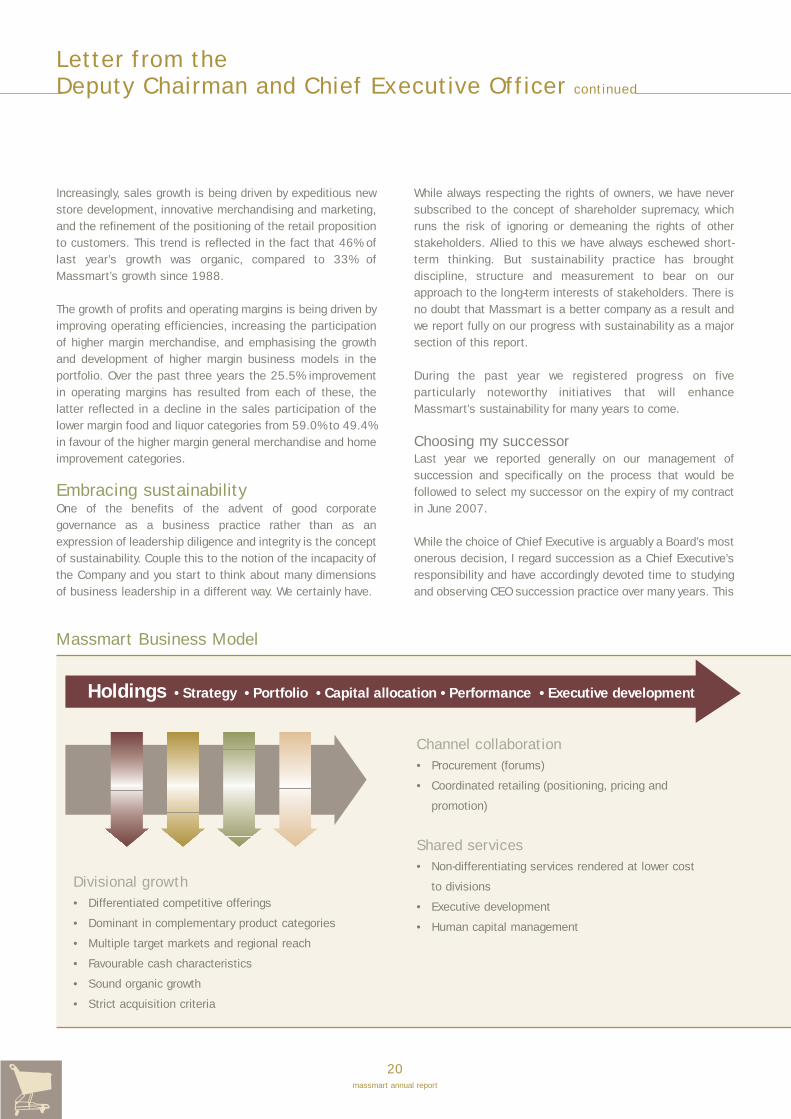
Massmart Business Model
Holdings •Strategy •Portfolio •Capital allocation •Performance •Executive development
Divisional growth• Differentiated competitive offerings
• Dominant in complementary product categories
• Multiple target markets and regional reach
• Favourable cash characteristics
• Sound organic growth
• Strict acquisition criteria
Channel collaboration• Procurement (forums)
• Coordinated retailing (positioning, pricing and
promotion)
Shared services• Non-differentiating services rendered at lower cost
to divisions
• Executive development
• Human capital management

21massmart annual report
resulted in the formulation of the following principles, someof which are in contradiction with conventional wisdom on thesubject: CEO succession must be led and driven by theincumbent CEO in close collaboration with the Board; otherthan in the case of disaster it is a process not an event; theprocess should be inclusive of key executives; an internalappointment is preferable unless the company is in trouble;the organisation’s tacit view of the likely successor should notbe ignored; a “race” between two or more candidates isdivisive and highly destructive to the organisation; and thefinal decision must be informed by objective assessment.
Guided by these principles we devised an innovative,inclusive process, which commenced in early 2004 andenabled the Board and Executive Committee to reach aninformed, confident, unanimous decision. During May 2006the Board announced the appointment of Grant Pattisonas Chief Executive Officer Designate with effect from 1 June2006, to succeed me as Chief Executive Officer from 1 July2007.
Grant has worked closely with me for eight years and hasdemonstrated his leadership, intellect and acumen in manyroles and situations. He has been my most trustedconfidante in the crafting of Massmart’s current strategy, hehas successfully managed the Group’s largest divisions, hehas started new companies and departments and fixedtroubled ones, he has formulated the structure andprocesses that enable inter-divisional collaboration, and indoing so he has earned the respect of his colleaguesthrough deploying expertise and influence rather thanpower. In short his impact is visible everywhere in Massmartand I look forward to him expanding that as Chief Executive.
Developing resilient leadersTo paraphrase my previous comment on strategy, there islittle chance of executive development without a leadershipcontext. The South African business leadership context isdemanding and unique in many respects.
South African executives, like their international peers,operate in a climate of negative recognition where businessleaders are too often denigrated in the eyes of the public –the impressions created by the appalling behaviour of thefew devolve on the many who with great dedication andintegrity, lead organisations that contribute widely to society.But in addition, the challenges of the skills shortage, rapidlyevolving legislation, a dearth of strong middle management,a fledgling civil service, high levels of violent and whitecollar crime and the obligation to satisfy diverse and often
opposing constituencies regarding the transformationimperative, are foreign to our international counterparts.This is the context in which the leadership of Massmart isobliged to serve all stakeholders.
As the most senior executive forum, the calibre andeffectiveness of the Massmart Executive Committee iscentral to the performance and progress of the Group. Withthe appointment of Jay Currie as Group CommercialExecutive, the Committee increased to eleven people, threeof whom are successors to other members of theCommittee who will retire over the next five years. TheCommittee operates effectively within its charter as a forumfor: formulating and refining strategy, principles andpolicies; facilitating and driving collaboration; taking andapproving decisions circumscribed by the governanceauthorities; and directing and controlling the businesswithin the parameters of the authority and responsibilitymandated by the Board.
Under the leadership of Steve Glendinning we have formulateda number of leading edge executive and managementdevelopment programmes, structured to imbue environmentaland competitive awareness, strategic insight, world class retailexecutive competence and leadership resilience.
Succession and career planning throughout the organi-sation remains a priority. During the year we recognisedthe need for Massmart to augment its substantialinvestment in executive development, with more frequentredeployment and rotation of high potential leaders intodifferent roles and we will do so.
Finally, but most importantly, we are determined to increasethe ratio of senior black (African, Coloured and Indian) andfemale managers in Massmart. Despite good intentions, ourprogress with this imperative has been slow at the moresenior levels and the profile of our current executiveleadership remains predominantly white male. To redress thisnew policies related to recruitment, development andremuneration have been introduced and employment equity
Massmart’s headlineearnings per share growthhas compounded at 31.1%for the last 5 years

22massmart annual report
Letter from theDeputy Chairman and Chief Executive Officer continued
is now the only non-financial criterion on which incentivesare based.
Empowering our staffOn 14 July 2006, shareholders approved a R1 billion,company facilitated transaction whereby ownership, includingrights to vote and earn dividends, equivalent to approximately10% of Massmart’s issued share capital pre-dilution willbe issued to two trusts representing approximately 14 500members of Massmart’s permanent general staff andpreviously disadvantaged managers in South Africa, 83% ofall whom are classified as previously disadvantaged.
The transaction will cost the Company R235 million oversix years, representing a 2% dilution to shareholders.During the current year the transaction will reduce earnings by18.6 cents per share.
This transaction, the most significant in Massmart’s history,
was motivated by the Board’s firm belief that Massmart has
a responsibility to contribute towards the redress of the
economic divide. Together with our commitment to create
sustainable employment, this transaction will assist
thousands of previously disadvantaged South Africans to live
a better life, as their participation as equity owners enables
them to accumulate wealth aligned with the progress and
success of the company.
Reporting to shareholdersMassmart’s 2005 annual report was ranked among the best
25 on the JSE by Ernst & Young, and the Association of
Chartered Certified Accountants named it the Best Newcomer
Sustainability Report.
2000 – present
2000• Massmart listed on the JSE Limited• Sales exceed R10 billion
2001• Acquisition of Jumbo (six stores) and• Browns and Weirs (22 stores)
2002• Acquisition of Furnex (390 members)• Operating profit exceeds R500 million
2003• Integration of Furnex• Acquisition of Builders Warehouse (five stores)• Sales exceed R20 billion
2004• Acquisition of three independent cash and carry businesses into
CBW• Massmart’s liquidity rises significantly on the JSE as
institutional shareholders purchase SHV’s 31% shareholding
2005• Acquisition of three new chains: Servistar, De La Rey and
Federated Timbers (rebranded to Builders Express, BuildersWarehouse and Builders Trade Depot respectively)
• Trading profit exceeds R1 billion
2006• BEE transaction announced• Disposal of Furnex• Sales exceed R30 billion
Massmart defining events 1990 to 2006
1990 – 1994
1990• Massmart founded• With R895 million sales through six Makro stores, Massmart’s
multi-chain, organic and acquisitive growth strategy formulated
1991• Transpaco Stationers acquired and integrated to form
Makroffice
1992• Drop Inn acquired • Acquisition of Shield (378 members)
1993• Acquisition of Dion (20 stores)
1994/6• Merger, profit fall and demerger of Makro/Dion
1995 – 1999
1996• Sale of 25% of Massmart to SHV • Balance of “Channel & Chain” clarified (Channel collaboration
page 64)
1997• Acquisition of Makro franchise in Zimbabwe
1998• Acquisition of 51% of CCW (14 stores)• Acquisition of Game (26 stores)• Sales exceed R5 billion
1999• Operating profit exceeds R100 million• Massdiscounters formed to integrate and rationalise Dion and
Game

23massmart annual report
This year we report under International Financial ReportingStandards for the first time and credit is due to Guy Haywardand the entire financial community throughout the Group forthe excellent management of a complex transition which hadno impact on our historic high standard of accurate andtimeous accounting
HIV/AidsIn addition to our considerable investment in the prevention ofHIV/Aids through education and training, we have taken thedecision to mitigate the impact of the Aids pandemic byproviding free medical attention and antiretroviral medicationto members of our staff who are HIV positive. We believe thatthe costs of this decision are insignificant relative to ourobligation as a caring employer in South Africa today.
Expressing gratitudeThe past financial year was a remarkable one for Massmartand its leaders.
The 2004 decisions to increase the strength of the Executiveteam and the head office resource have enabled a year ofunprecedented progress and a sound response to many ofour stakeholder expectations of a company of Massmart’ssize and stature.
My gratitude is due to the Chairman for his personal supportand his incisive management of the Board, to the membersof the Board for their efforts and good counsel through someof the most important decisions in the Company’s history, andto my colleagues on the Executive Committee for theexceptional deployment of their extraordinary talent during aperiod of challenging change. Few leaders are granted theprivilege to be surrounded by such a remarkable group ofpeople and I thank you.
Throughout the past year, in every division, store, departmentand office, the people of Massmart dedicated themselves tothe simple but challenging objective of improving theexperience of the tens of millions of customers who shop inour stores. The way we choose to do this is not easy. Ourfounding promise of low price can only be sustained by veryhigh volumes, increased productivity and lower costs, andvery often our hardest and most important work takes placewhen non-retailers are at leisure.
We never take this for granted.
The contribution of each of our 22 000 Massmart colleaguesis manifest not only in these outstanding results but also in
the considerable progress we made towards enhancing theGroup’s portfolio for sustained performance, and on behalf ofthe Board I thank every one of you.
Looking forwardMassmart is moving into a new phase of development andgrowth, characterised by a number of trends that are clearlyevident. More organic growth, fewer larger formats, simplifiedstructures, better information, a more efficient supply chain,increased collaboration, more diverse leadership group andgreater leverage of the Group’s resources, are all trends thatwill have a profound impact on the organisation and itspeople.
As a much larger more confident organisation with a higherpublic profile, Massmart will assert a greater influence on thestrategies, structures, processes, brands, cultures andvalues of its constituent parts, without underminingindividual’s ownership and accountability for the assets andfunctions entrusted to them. The leadership required to dothis, is very, very subtle, and requires a rare quality of insight,intellect and timing.
Over the last months of my tenure as Chief Executive, whilepassing the baton, I look forward to observing Grant conceivethe new leadership model he will create for the next phase inthe Group’s history. Massmart and its people are ready forthe change.
Mark J Lamberti17 October 2006
Massmart distributes 17%of the sales and 19% ofthe cost of sales of all JSE-listed retailers with only2% of the outlets
24massmart annual report
Letter from the Chief Financial Officer
This is the first year that Massmart is reporting fully underIFRS (International Financial Reporting Standards), whichcame into effect for all financial years commencing after 1 January 2005. Group-wide, the work and analysis requiredby the financial community to properly address the demandsof IFRS was significant, requiring education and guidance fromMassmart Corporate, working closely with the externalauditors. Due however, to the relative simplicity of Massmart’sretail and wholesale financial models, and their associatedaccounting consequences, the implications of the IFRS werenot as complex or as far-ranging as other businesses withmore sophisticated financial or accounting models.
The reasons for, and impact of, all the changes effected to theGroup’s financial statements arising from IFRS are explainedfully on pages 29 to 37 of this CFO report, as are othersmaller changes effected this financial year.
We continually strive to improve the quality of Massmart’sexternal financial reporting, as well as to better the technicaldisclosure in our annual report – but always to keep the detailsand explanations clear and simple even as the accountingstandards become increasingly complex and technical. Theseefforts paid off earlier this year when the Massmart 2005annual report was awarded an Excellent rating in the Ernst &Young South African annual report survey.
Financial targetsThe Group has clearly-stated medium-term financial targets ormeasures that we believe represent optimal performancelevels within the income statement or balance sheet, or thecombination of both. Certain of these targets are “stretchtargets” that will only be achieved in two to three years andwith exceptional performance.
These target ratios are shown below:
Target ratio Definition
ROS > 5.0% Return on sales (ROS) is the ratio ofprofit before tax (excluding impairmentand amortisation of intangibles) to sales
ROE > 35% Return on equity (ROE) is the ratio ofheadline earnings to average ordinaryshareholders equity (not adjusting for anyintangible previously written off)
Gearing < 30% Gearing is the ratio of average netinterest-bearing debt to average ordinaryshareholders’ equity
Dividend cover Dividend cover represents the ratio of of x2.0 headline earnings to dividends declared
and paid to ordinary shareholders
Return on sales (ROS)This ratio combines all the key elements of the incomestatement, being sales, gross margin, supplier income,expenses (including depreciation), and net interest received(or paid). Every important financial aspect of the retail orwholesale business model is captured in this ratio. Thelargest asset investment at the Massmart Chain level is inworking capital (being inventory and debtors), with theconcomitant liability (in trade payables), and the relativesuccess of management’s impact on net working capital willtherefore be reflected in a changed net interest paid (orreceived). This year the ROS target was increased from 4.5%to 5.0% due to the increasing proportion of the higher marginMassbuild businesses in the Group performance, as well asthe continually improving profitability of several of the Group’sdivisions.
Progress to date – Massmart’s current ROS is 4.3% (prioryear 3.8%). Massmart has grown its ROS every year since2000 and we believe that the new higher ROS target of 5.0%remains achievable in the medium-term.
Return on equityMassmart is committed to delivering superior returns toshareholders. The Group’s medium-term targets are toexceed a 35% return on average ordinary shareholders’equity. This target was increased this year due to the Group’simproved profitability and the increase in the target ROS.
The Chains are responsible for delivering operational returns,being the returns on net working capital and non-currentassets excluding intangibles (goodwill and trademarks).Massmart, through the Board and Executive Committee, isresponsible for delivering on investment returns including thebook value of intangibles (raised on acquisitions or
25massmart annual report
otherwise), as well as setting the Group’s gearing levels toinfluence returns to shareholders and the overall risk profile.
As part of this, the Chains are recapitalised annually byMassmart with non-interest-bearing shareholders’ funds thatare equivalent to the book value of long-term assets in eachChain. Each business therefore must fund its net workingcapital position through cash or interest-bearing debt,depending upon the characteristics of each business model.This process enables business or divisional returns to beevaluated and compared on a consistent basis across theGroup, and from one year to the next. This policy has not yetbeen rigidly applied in CBW due to minority shareholders inthat business.
Adjusting for intangibles (goodwill and trademarks) previouslywritten off, (i.e. reversing the write-off), the Group’s return onaverage shareholders’ equity exceeds 20%. Depending uponthe purchase price, acquisitions in the retail and wholesaleindustry tend to generate significant accounting goodwill due tothe relatively low net asset values of those business models.
Progress to date – during the year, Massmart’s return onaverage shareholders’ equity was 48.9% (2005: 44.2%).
GearingGiven the Group’s high cash generation and its preference forleasing rather than owning stores, it is difficult to permanentlygear (i.e. trade in a net interest-bearing debt position) theGroup over the long-term. It may be possible to gear theGroup through a strategy of owning rather than leasing allstores, but this would potentially reduce asset and equityreturns. Massmart prefers some level of gearing, up to amaximum of 30%, in order to leverage the return onshareholders’ equity. Depending upon the cashcharacteristics of a target company, however, this gearingratio may be increased but probably no higher than 50%.
As the period-end balance sheet tends to be unrepresentativeof the Group’s average net cash or debt position during theyear (showing higher cash balances as monthly creditors arepaid after month-end), the Group’s gearing levels are bestcalculated using the net interest paid (or received) for theperiod as a proxy.
Progress to date – the Group averaged gearing of 21.8%(2005: 18%) for the year to June 2006. The medium-termfunding secured this financial year for the Massbuildpurchase considerations increased the gearing but this willtrend towards nil over the next two financial years.
Dividend coverMassmart’s current dividend policy is to pay total annual cashdistributions representing a x2.0 dividend cover ratio, unlesscircumstances dictate otherwise. This ratio is not a target –
because it is already being achieved – but is provided to giveclarity on future dividend levels. The Board believes that thisdividend cover ratio is appropriate given the Group’s currentand forecast cash generation, planned capital expenditureand gearing levels.
The Board has no desire to build up a cash reserve and sowill, where practical, reduce dividend covers and/or mayexecute a share buyback – depending upon the actual tradedshare price and our view of its valuation – in order to returnsurplus cash to shareholders.
AcquisitionsShareholders are reminded that the financial results of thethree Massbuild acquisitions are included for a full year inthese 2006 results but only for one month in the prior year.Massmart owns 100% of both Federated Timbers andServistar, although a portion of the Servistar purchaseconsideration is deferred to 2007. Massmart initiallyacquired and owned 51% of De La Rey for the 2006 financialyear, but recently the remaining 49% balance was acquiredresulting in De La Rey being wholly owned with effect from 1 July 2006.
In April 2005, the conditional acquisition of Moresport byMassmart was announced. Following a prohibitionrecommendation by the Competition Commission, andsupported by the Competition Tribunal, but before the matterwent to approval, the sellers of Moresport decided towithdraw from the transaction in May 2006 as the 13-monthdelay was adversely impacting the business. In themeantime, Massmart had secured shareholders’ authority toissue up to R500 million in permanent preference shares tofund this acquisition. As circumstances currently stand,Massmart will not be issuing those preference shares.
DisposalFurnex, the buying association supplying certain generalmerchandise to its members, was totally disposed of by theGroup with effect from 1 March 2006. The main reason for thedisposal was that increasingly the smaller-store Game formatwas beginning to compete with Furnex’s members in the SouthAfrican regional towns. The business, which made a profit aftertax of R3.7 million for the eight months to 1 March 2006(2005: loss after tax of R9.7 million, before a goodwillimpairment of R72.4 million), was sold for a cash considerationof R25.7 million and recorded a net loss on disposal ofR1.8 million. Warranties and conditions usual to a corporatetransaction of this nature were provided by Massmart.
Black economic empowerment staffequity transactionThere is no effect in the June 2006 financial results of theBlack Economic Empowerment (BEE) staff equity issue that

26massmart annual report
was announced in May 2006 and formally approved byMassmart shareholders in July 2006. This BEE issue waseffective from 1 October 2006 and so will first be includedwith the December 2006 and June 2007 financial results.
Full disclosure on this BEE staff equity transaction waspublished in the circular issued to shareholders dated15 June 2006. Details of the transaction can also be foundon pages 82 and 83.
Income statementThis review covers the consolidated income statement shownon page 113, and the related notes on the ensuing pages.
Note that all financial figures for 2005 have been restated asa result of applying IFRS and that, unless indicated, all figuresare for the continuing Group businesses, i.e. excluding Furnex.
SalesGeneral merchandise prices for the financial year, using theGroup’s sales mix, averaged deflation of 2.4%. During thefinancial year food deflation decreased and then, in the latterhalf, moved into inflation. Combined inflation for the Group’sFood and Liquor was 4.3%, while Home Improvement reportedinflation of 3.5%. The Group’s weighted-average inflation ratefor the 2006 financial year was 1.2%.
The Rand weakness since June 2006, coupled with recentfuel price increases and the general pressure on prices fromrising South African core inflation, will result in furtherinflation in the Group and, currency dependent, could average4% – 6% for the June 2007 financial year.
Total sales of R29 964 million increased by 18.1% over2005, both years representing 52 weeks’ trading. Of thissales growth, the Group’s existing businesses and storescontributed 5.5%, new stores added 4.8% and acquisitionsthe remaining 7.8%.
During the financial year the Group opened 17 new stores,closed four stores and acquired two stores, therebyincreasing its trading area by 38 204 m2. The Group’s totaltrading area is now 992 855 m2, an increase of 13.1% overthe prior year figure of 877 878 m2. The new stores wereGame stores in George, the Vaal Mall, Makhado, ShellyBeach, Wonderpark, Ermelo, Worcester, Ladysmith and Lagos,Nigeria; CBW stores in Pretoria West and Springs; BuildersWarehouse opened stores in Rivonia (Johannesburg North),The Glen (Johannesburg South), Bloemfontein, and PortElizabeth; and De La Rey opened another two stores in CapeTown. CBW acquired two stores in Olifants and Lepopo,Botswana. The stores closed were Dion Vanderbijlpark, theold Builders Warehouse, Rivonia and Federated Timbers,Seadoone Durban and Highveld, Witbank.
Gross profitThe basis of calculating gross profit was necessarily restatedduring this year, resulting in certain categories of supplierincome, discounts and rebates now reducing the cost ofsales rather than net operating expenses. An amount ofR586 million (2005: R523 million) was reallocated fromexpenses to cost of sales, resulting in changes to both thoseratios to sales. Gross profit of R5 313.6 million reflects a17.7% gross margin that is greater than the prior year’srestated 16.5%.
The reasons for this improvement were twofold: the first beingthe portfolio effect of the greater proportion of the highermargin Massbuild businesses, and the second being tacticallyhigher margins in Masswarehouse and Masscash. The Group’sgross margin will always be dependent upon the mix of salesacross the divisions and the required trading aggressionoccasioned by competitor activity, but is expected to improvemarginally due to the increased proportion of the higher grossmargin sales from the faster-growing Massbuild division.
Other income Other income of R117.0 million (2005: R135.6 million)comprises royalties and franchise fees, property rentals,investment income (excluding interest), finance charges fromMassdiscounters’ small consumer credit book, and sundrymanagement and administration fees. These are shown inmore detail in note 5 on page 128.
ExpensesAs noted in the gross profit section above, accounting changesresulted in net operating costs being restated. Total expensesof R3 985.5 million (2005: R3 187.2 million) represent 13.3%of sales, slightly higher than the prior year’s restated 12.6% ofsales. This ratio was expected to increase slightly due to theincreased proportion of the higher-expense Massbuildbusinesses, but was also impacted by several larger itemsdescribed in more detail below. Many of the 17 new storesopened during the 2006 financial year would not yet be tradingat optimal levels and so will distort traditional expense andsales ratios. As trading levels accelerate, these stores willbecome more efficient and the ratios will improve towardsGroup norms. Costs and cost-productivity remain areas ofcontinual focus across the Group.
Due to ongoing store improvements and refurbishments, andexpansion through new stores, the depreciation charge ofR202.9 million (2005: R157.5 million) increaseddramatically, and will continue to increase as it reflects thehigher capital costs of this expansion. Makro, Game, and, toa lesser extent, Builders Warehouse, have been refurbishingtheir major stores, resulting in higher depreciation charges.Due to these refurbishments, the annualisation ofdepreciation arising from the capital expenditure on new
Letter from the Chief Financial Officer continued
27massmart annual report
stores in 2006, and that arising from the new storeexpenditure scheduled for 2007, the Group’s depreciationcharge for 2007 will grow by more than the rate of salesgrowth.
Employment costs of R2 079.0 million (2005: R1 656.7 million)are 25.5% higher than the prior year but, excluding theMassbuild acquisitions, are 14% higher. The existingbusinesses employed 9.2% more employees (mostly for newstores) and had annual salary and wage increases of 7% –8%. The acquisitions increased total employees by 13.5%. At6.9% of sales, employment costs are higher than last year’sequivalent figure of 6.5% and remain the Group’s singlelargest operating cost. Due to the significant degree ofincentivised remuneration for the Group’s staff, managementand executives, total employment costs will generallyincrease at a rate greater than inflation when exceptionalperformance is achieved, as was the case in 2006. For theforthcoming financial year the Group’s salary increases arebetween 4% – 6% while the wage increases are 7% – 8%.
Occupancy costs, the Group’s second biggest operating cost,increased 7.0% before acquisitions, but in total increased15.0% to R740.5 million (2005: R644.0 million). Total tradingspace increased by 13.1% to 992 855 m2. As a percentageof sales, however, this figure at 2.47% is lower than the prioryear equivalent of 2.54%. This would have primarily beencaused by the annualisation of the two new Makro storesopened in the prior year. The lease-smoothing accountingpolicy that applies to operating leases has the effect ofkeeping comparable-store lease charges broadly equal fromone year to the next, and so any increase between yearswould therefore be from new stores. Another effect of thislease-smoothing accounting policy is that annual leaseescalations will no longer increase the Group’s lease charge.
Other significant itemsIncluded in operating profit is a net gain on foreign exchangetransactions and translations of R33.3 million (2005: netgain of R25.4 million). Of this, R17.6 million (2005: gain ofR4.8 million) relates to realised and unrealised gains arisingfrom Massdiscounters’ African stores, a R8.0 million loss(2005: loss of R1.5 million) was recorded in CBW arising fromthe devaluation of the Botswana currency, and the balance ofthe net gain arose primarily from IAS 39 adjustments relatingto forward exchange contracts held at Massmart.
Operating profit After all the above, Group operating profit of R1 328.1 million(2005: R992.3 million) is 33.8% ahead of prior year and hasimproved from 3.90% to 4.45% of sales. This improvementwas generated from different actions across the Group, butcan broadly be summarised as excellent cost control inMassdiscounters and Makro, increased gross margins fromtrading in Makro and CBW, and the greater contribution from
the higher margin Massbuild. Given the cost increaseshighlighted above and the expected low level of salesinflation, cost control and real sales growth remain keyimperatives for the Group.
Net interest paidNet interest paid of R32.2 million (2005: R20.2 million)increased due to the medium-term funding secured for thethree Massbuild acquisitions in 2005. Taking into accountanticipated capital expenditure and excluding any unforeseendevelopments or new initiatives, the Group will remain netgeared for two years.
TaxationThe total tax charge of R444.6 million represents a totaleffective tax rate of 34.3% compared to the prior year chargeof R307.5 million at 31.6%. Two factors caused this, the firstwas the higher charge from the secondary tax on companies(STC), arising from the higher dividends paid, which increasedfrom 2.2% to 3.2% within the effective tax rate. The secondwas a write-off of the net deferred tax asset of R20 millionarising from operations at the Group’s loss-making GameMauritius store. The higher level of STC will be the norm whilethe deferred tax write-off was a one-off.
Excluding the impact of STC, Massmart expects its futureeffective tax rate to be at or near the South African corporaterate of 29%, although higher tax rates in certain foreignjurisdictions may marginally increase this.
Massmart is not concerned about any specific element of tax riskin the Group’s historical tax returns, but there always remains theuncertainty that adjustments arising from potentiallyunfavourable tax assessments from the past tax returns, someof which have not yet been assessed by SARS, could impactfuture earnings. In addition, SARS can reopen any taxassessments within three years of issuing such assessments.
Headline earningsAdjusting for net losses on the disposal and write-off ofvarious assets (see note 9 on page 131), headline earningsof R836.6 million are 28.3% higher than the prior year.Slightly more shares in issue marginally reduced the headlineEPS increase to 28.0%. After adjusting for the potential futureconversion of 5.4 million share options, the diluted headlineEPS of 408.3 cents is lower than actual headline EPS of419.3 cents (calculated in terms of AC 104).
Balance sheetThis review covers the consolidated balance sheet shown onpage 114 and the related notes on the ensuing pages.
Note that all financial figures for 2005 have been restated asa result of applying IFRS.
28massmart annual report
Fixed assetsProperty, plant and equipment of R944.3 million (2005:R802.6 million) and goodwill of R1 196.4 million (2005:R1 149.9 million) together represent the greatest proportionof the Group’s non-current assets.
Over the past few years, Massmart began investing heavily inrefurbishing and building new stores and during this yearR314.3 million (2005: R351.8 million) was spent on property,plant and equipment. Of this, R173.1 million was replacementcapital expenditure while the balance of R141.2 million wasinvested in new capital assets, including new stores.
A detailed reconciliation of the movements in property, plantand equipment is shown in note 10 on page 132.
Goodwill increased by R46.5 million which reflects some earn-out payments in connection with the 2005 Servistaracquisition. In terms of IFRS all goodwill must be annuallytested against the value of the business units with which it isassociated and, if overstated, that goodwill must be impaired(see note 11 on page 135 for more details). No goodwill wasimpaired this financial year.
The figure of R102.3 million (2005: R111.5 million) in otherintangibles represents computer software that IFRS requiresto be disclosed in this category.
Investments and loansInvestments of R190.9 million (2005: R155.4 million)comprise a R116 million investment in a treasury andinternational costing module, revalued to reflect foreign-denominated assets within that module. Loans of R190.7 million (2005: R119.7 million) comprise primarily aninterest-free amount of R149.5 million (2005: R83.7 million)owed by participants in the Massmart employee sharepurchase trust. This loan amount reduces as employees selltheir shares and repay the related loans, and increases whereexecutives elect to own Massmart shares rather than optionsissued by the trust. The finance lease deposit of R34.3 millionis related to the financing of the Makro Strubens Valley store.
Deferred taxThe deferred tax asset of R409.5 million (2005: R430.5 million)arises primarily from numerous temporary differences,including tax deductions on trademarks, and unutilisedassessed losses. This asset will reduce over time as theassociated tax benefits are utilised. More detail is provided innote 15 on page 139.
Current assetsInventories of R3 221.0 million (2005: R2 677.0 million)represent approximately 48 days’ sales (using the historicbasis), marginally higher than the prior year figure of 46 days.Massdiscounters, as a retail discounter with 80 stores, hasthe highest inventory levels and its sales days in inventory arealmost double that of Massmart’s wholesale businesses
(Masswarehouse and Masscash). The Massbuild busi-nesses, Builders Warehouse and De La Rey, also have higherinventory days given the need to carry a broad and deepmerchandise range in their stores.
Total trade receivables and prepayments, net of provisions, areR1 770.0 million (2005: R1 836.9 million). Although tradecredit is offered to customers in De La Rey, Servistar andFederated Timbers, it is well controlled and within the Group’sparameters, and does not affect the Group’s working capital.
Of Massmart’s total sales, approximately 1.2% are consumercredit sales whilst cash (including cheques and credit cards)accounts for 87.1% and trade credit for 11.6% of total salesrespectively. Included in trade receivables and prepaymentsare net trade accounts receivable of R860.8 million(2005: R1 025.7 million) and consumer accounts receivable ofR264.5 million (2005: R255.9 million). Consumer credit, beinghire-purchase and revolving credit, is found only inMassdiscounters. For more detail, refer also to thecommentary on credit risk in the financial risks section below.
Due to creditor payments being made shortly after eachmonth-end, cash balances in the Group at year-end are notrepresentative of the average level of cash or overdraft duringthe remaining period.
Non-current liabilitiesThese comprise medium-term bank loans and capitalisedfinance leases, deferred tax, long-term provisions and theoperating lease liability arising from the lease-smoothingadjustment. Interest-bearing liabilities are R519.7 million(2005: R140.0 million) and non-interest-bearing liabilitiesare R474.7 million (2005: R471.0 million). Details of allnon-current liabilities, excluding deferred tax, are includedin notes 22 and 23 on pages 143 and 145.
Included in interest-bearing liabilities are medium-term bankloans of R429.7 million (2005: R38.0 million) representingamounts due on medium-term bank loans held with majorSouth African banks. As noted earlier, two R250 million five-year amortising loans were raised during the financial year tofinance the Massbuild acquisitions. Capitalised finance leasebalances are R90.0 million (2005: R92.5 million).
Included in non-interest-bearing liabilities are the long-termprovisions arising from the actuarial valuation of the Group’spotential liability arising from post-retirement medical aidcontributions owed to current and future retirees. This liabilityis unfunded. With effect from 1999, post-retirement medicalaid benefits are no longer offered to new employees joiningthe Group. The main balance is the operating lease liability ofR474.5 million (R471.0 million) which will be released overthe remaining period of the Group’s operating leases. Thisfigure increased as a result of the significant number of newstores opened during the financial year.
Letter from the Chief Financial Officer continued

29massmart annual report
The deferred tax liability of R97.2 million (2005: R100.1 million)arises primarily from prepayments and other timingdifferences. More detail is provided in note 15 on page 139.
Current liabilities Trade payables of R5 875.7 million (2005: R5 001.7 million)represent approximately 87 days of cost of sales (using the historicbasis), which is similar to the prior year figure of 86 days.
The current taxation liability of R410.9 million (2005: R287.7 million)reflects the Group’s liability for provisional corporate tax paymentspayable within days of the financial year-end.
Cash flow statementThe consolidated cash flow statement is shown on page 115.
Cash flow from trading of R1 543.6 million (2005: R1 136.5 million)is 35.8% higher than the prior year and closely approximatesthis year’s operating profit before depreciation andamortisation of R1 536.4 million, demonstrating the cashunderpin of Massmart’s earnings.
Cash taxation paid of R487.4 million (2005: R337.5 million)increased above the growth in taxable income due to thehigher STC payments (were R20.9 million, now R45.1 million).This higher level of cash tax will continue as noted in theearlier comment on the likely future Group tax rate.
Due to the IFRS restatement of the prior year’s earnings(lowering those earnings), the relative increase in the dividendpaid in cash has been distorted and the actual amount paidof R403 million is below the prior year figure of R416 million.
Total capital expenditure (replacement and expansion) wasR362.6 million. Capital expenditure for 2007 is budgeted atR480 million, which includes approximately R50 million rolledover from 2006.
Financial risksLiquidity risk Liquidity risk is considered low due to the Group’sconservative funding structure and its high cash generation.Massmart’s liquidity requirements are continually assessedthrough the Group’s cash management and treasury function.The Group has total banking facilities, incorporatingovernight, short and medium-term borrowings, letters ofcredit, forward exchange contracts and electronic fundtransfers of R3 492 million (2005: R2 460 million). As atJune 2006, total interest-bearing debt amounted to R756.7 million (2005: R670.4 million). For more detail referalso to note 35 on page 161.
As the Group begins to build inventory levels for the festiveseason, net interest-bearing debt will increase up to a maximumof approximately R1.0 billion in November and December, butwill reduce rapidly as peak year-end trading accelerates.
Interest riskInterest rate exposure is actively monitored due to the Group’ssignificant intra-month cash movements and the seasonalchanges in its net funding profile during the financial year. Ofthe two new medium-term bank loans (note 22 on page 143),the interest rates on both were fixed.
Credit riskTrade credit is available at Massbuild, Masswarehouse andMasscash, and is adequately controlled by using appro-priately trained personnel, applying credit granting criteria,continual monitoring and the use of software tools. A portion of the trade debtors book in Shield is insured withan international insurance company and a further portion issecured through general notarial bonds, pledges and otherforms of security from debtors.
Massmart is only exposed to consumer debt through its hire-purchase and revolving-credit debtors books in Massdiscounters.The net book of R265 million (2005: R256 million) isconservatively managed, adequately provided for andrepresents approximately seven months’ credit sales. Formore detail, refer also to note 35 on page 161.
Currency riskCurrency risk in the Group is actively managed. All foreign-denominated trading liabilities are covered by matchingforward-exchange contracts. Foreign-denominated assets arenot covered by forward-exchange contracts, as these arepermanent assets held for the long term.
Accounting policiesThe Board reports that the appropriate accounting policies,supported by sound and prudent management judgementand estimates, have been consistently applied except asnoted below.
International Financial Reporting Standards(IFRS)Massmart is a first-time adopter of the International FinancialReporting Standards (IFRS), with effect from 1 July 2005. TheGroup’s December 2005 interim financial statements wereIFRS compliant and prepared using the transitional provisionsprovided in IFRS 1 First-time Adoption of IFRS. Massmartselected three of the optional exemptions as follows:
• IFRS 3 Business Combinations was applied to businesscombinations executed on or after 31 March 2004. As aresult, IAS 36 Impairment of Assets and IAS 38 IntangibleAssets were also applied from this date.
• IFRS 2 Share-based Payments was not applied to equityinstruments granted on or before 7 November 2002, nor toequity instruments granted after 7 November 2002 thatvested before 1 January 2005. The standard was also notapplied to share-based payment liabilities settled before 1 January 2005.

Standard Standard’s name Effective date Impact on the Group
IFRS 1 First Time Adoption Annual periods beginning on This standard has an impact on the Group in that itof IFRS or after 1 January 2004 provided implementation guidance for the first time
adoption of IFRS. The financial effect is limited to theoptional exemptions selected as detailed in the notesabove.
IFRS 2 Share-based Payments Annual periods beginning on This standard has a material financial impact on theor after 1 January 2005 Group as detailed in the notes above.
IFRS 3 Business Combinations Business combinations after This standard has an impact, but no material financial31 March 2004 effect on the Group. Additional disclosure in the financial
statements is also required as a result of the standard.
IFRS 4 Insurance Contracts Annual periods beginning on This standard has no impact on the Group. or after 1 January 2005
IFRS 5 Non-current Assets held Annual periods beginning on This standard has an impact, but no material financialfor Sale and or after 1 January 2005 effect on the Group. Additional disclosure in the financial Discontinued Operations statements is also required as a result of the standard.
30massmart annual report
• The foreign currency translation reserve (FCTR), representingthe cumulative translation differences for all foreignoperations, calculated in accordance with IAS 21 Effects ofChanges in Foreign Exchange Rates, was deemed to be zeroon date of transition (1 July 2004) to IFRS.
Apart from the three standards listed above, the following twostandards also had an impact on the Group:
• IAS 16 Property, Plant and Equipment• IAS 27 Consolidated and Separate Financial Statements
Details on the impact of each of these are provided below.
IAS 16 Property, Plant and Equipment requires an annualreview of useful life and residual values for assets. Thisstandard had a limited financial impact on the Group.
IFRS 3 Business Combinations (including IAS 36 Impairmentof Assets and IAS 38 Intangible Assets), required a change inaccounting treatment for goodwill. Goodwill is no longeramortised but rather tested annually for impairment. Thischange was made prospectively and had a limited financialimpact on the Group.
IFRS 2 Share-based Payments. The Group has recognised anexpense in the income statement for share options granted toemployees, with a corresponding credit to equity, representingthe fair value of outstanding employee share options grantedafter 7 November 2002. The fair value at grant date is chargedto profit or loss over the relevant vesting periods, adjusted toreflect actual and expected vesting levels. Fair value isdetermined using the Binomial model, which takes into accountfactors including the risk free rate, volatility, dividend yield,
employee turnover and exercise behaviour. The expenses in theincome statement before and after tax (there is no tax relief)were as follows: 2006: R17.4 million and 2005: R17.0 million.
IAS 27 Consolidated and Separate Financial Statementseliminated the option of temporary control, where the entitywas operating under severe long-term restrictions thatsignificantly impaired its ability to transfer funds to theparent. As a result, Massmart’s operations in Zimbabwe havebeen consolidated retrospectively. All these companiesoperate in a hyperinflationary environment, and thus theprinciples of IAS 29 Financial Reporting in HyperinflationaryEconomies have been applied. The financial impact on netprofit attributable to equity holders of the parent for June2006 is a loss of R1.1 million.
IAS 21 Effects of Changes in Foreign Exchange Ratesintroduces a new approach to determine the method used fortranslating a subsidiary. The focus is now on the “functionalcurrency” rather than the level of integration between theholding company and subsidiary as previously required bySouth African Generally Accepted Accounting Practice.This change primarily affected accounting for the Africansubsidiaries of Massdiscounters, where there was a shift offoreign exchange gains and losses from the incomestatement to the foreign currency translation reserve in thebalance sheet.
The following accounting standards were effective andadopted for the June 2006 year-end. Some of these have hadno impact on the Group, and have been included forcompleteness. Where there is a financial impact, this hasbeen indicated.
Letter from the Chief Financial Officer continued
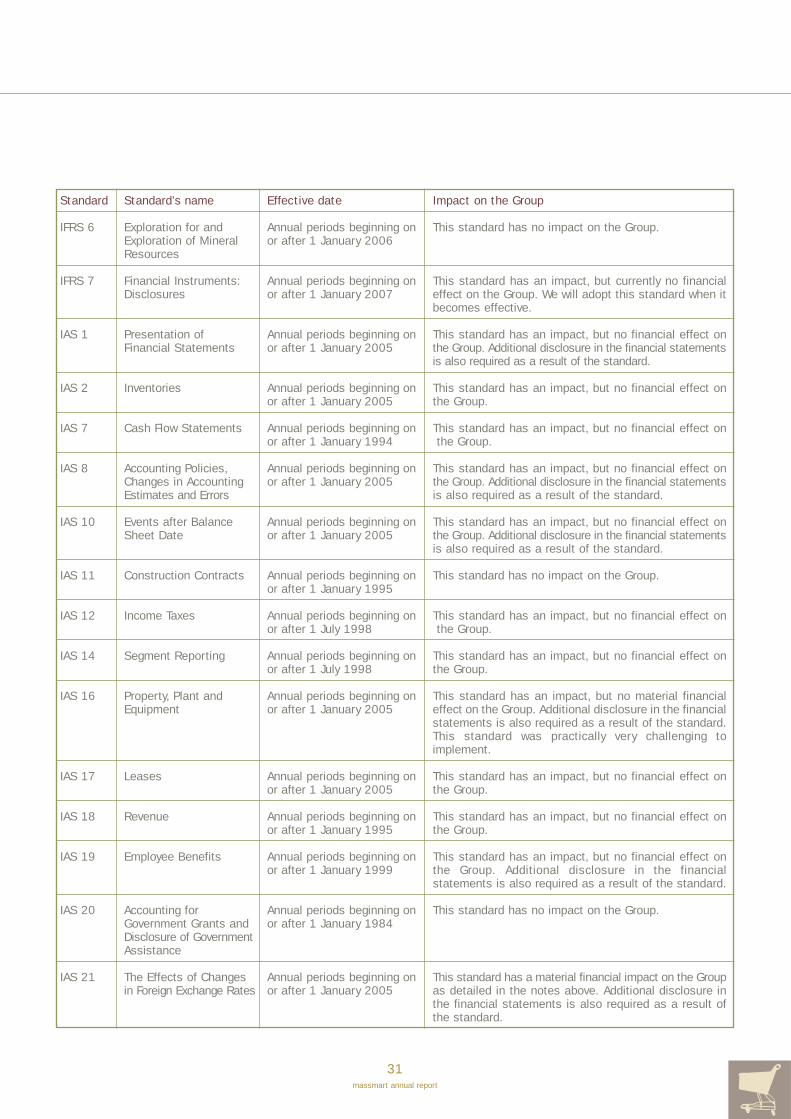
31massmart annual report
Standard Standard’s name Effective date Impact on the Group
IFRS 6 Exploration for and Annual periods beginning on This standard has no impact on the Group.Exploration of Mineral or after 1 January 2006Resources
IFRS 7 Financial Instruments: Annual periods beginning on This standard has an impact, but currently no financial Disclosures or after 1 January 2007 effect on the Group. We will adopt this standard when it
becomes effective.
IAS 1 Presentation of Annual periods beginning on This standard has an impact, but no financial effect on Financial Statements or after 1 January 2005 the Group. Additional disclosure in the financial statements
is also required as a result of the standard.
IAS 2 Inventories Annual periods beginning on This standard has an impact, but no financial effect on or after 1 January 2005 the Group.
IAS 7 Cash Flow Statements Annual periods beginning on This standard has an impact, but no financial effect onor after 1 January 1994 the Group.
IAS 8 Accounting Policies, Annual periods beginning on This standard has an impact, but no financial effect on Changes in Accounting or after 1 January 2005 the Group. Additional disclosure in the financial statementsEstimates and Errors is also required as a result of the standard.
IAS 10 Events after Balance Annual periods beginning on This standard has an impact, but no financial effect on Sheet Date or after 1 January 2005 the Group. Additional disclosure in the financial statements
is also required as a result of the standard.
IAS 11 Construction Contracts Annual periods beginning on This standard has no impact on the Group.or after 1 January 1995
IAS 12 Income Taxes Annual periods beginning on This standard has an impact, but no financial effect onor after 1 July 1998 the Group.
IAS 14 Segment Reporting Annual periods beginning on This standard has an impact, but no financial effect onor after 1 July 1998 the Group.
IAS 16 Property, Plant and Annual periods beginning on This standard has an impact, but no material financial Equipment or after 1 January 2005 effect on the Group. Additional disclosure in the financial
statements is also required as a result of the standard.This standard was practically very challenging toimplement.
IAS 17 Leases Annual periods beginning on This standard has an impact, but no financial effect onor after 1 January 2005 the Group.
IAS 18 Revenue Annual periods beginning on This standard has an impact, but no financial effect onor after 1 January 1995 the Group.
IAS 19 Employee Benefits Annual periods beginning on This standard has an impact, but no financial effect onor after 1 January 1999 the Group. Additional disclosure in the financial
statements is also required as a result of the standard.
IAS 20 Accounting for Annual periods beginning on This standard has no impact on the Group.Government Grants and or after 1 January 1984Disclosure of GovernmentAssistance
IAS 21 The Effects of Changes Annual periods beginning on This standard has a material financial impact on the Groupin Foreign Exchange Rates or after 1 January 2005 as detailed in the notes above. Additional disclosure in
the financial statements is also required as a result ofthe standard.

32massmart annual report
Letter from the Chief Financial Officer continued
Standard Standard’s name Effective date Impact on the Group
IAS 23 Borrowing Costs Annual periods beginning on This standard has no impact on the Group.or after 1 January 1995
IAS 24 Related Party Annual periods beginning on This standard has an impact, but no financial effect onDisclosures or after 1 January 2005 the Group. Additional disclosure in the financial statements
is also required as a result of the standard.
IAS 26 Accounting and Annual periods beginning on This standard has no impact on the Group.Reporting by Retirement or after 1 January 1988Benefit Plans
IAS 27 Consolidated and Annual periods beginning on This standard has a financial impact on the Group as Separate Financial or after 1 January 2005 detailed in the notes above. Additional disclosure in theStatements financial statements is also required as a result of the
standard.
IAS 28 Investments in Annual periods beginning on This standard has an impact, but no financial effect onAssociates or after 1 January 2005 the Group. Additional disclosure in the financial statements
is also required as a result of the standard.
IAS 29 Financial Reporting in Annual periods beginning on This standard has a financial impact on the Group asHyperinflationary or after 1 January 1990 detailed in the notes above. Additional disclosure in theEconomies financial statements is also required as a result of the
standard.
IAS 30 Disclosure in Financial Withdrawn and replaced This standard has no impact on the Group.Statements of Banks with IFRS 7and Similar Financial Institutions
IAS 31 Interests in Joint Annual periods beginning on This standard has no impact on the Group.Ventures or after 1 January 2005
IAS 32 Financial Instruments: Annual periods beginning on This standard has an impact, but no financial effect onDisclosure and or after 1 January 2005 the Group. Additional disclosure in the financial statementsPresentation is also required as a result of the standard.
IAS 33 Earnings per Share Annual periods beginning on This standard has an impact, but no financial effect on or after 1 January 2005 the Group. Additional disclosure in the financial
statements is also required as a result of the standard.
IAS 34 Interim Financial Annual periods beginning on This standard has an impact, but no financial effect onReporting or after 1 January 1999 the Group. Additional disclosure in the financial
statements is also required as a result of the standard.
IAS 36 Impairment of Assets Business combinations after This standard has an impact, but no material financial31 March 2004 to all other effect on the Group. Additional disclosure in the financial assets for annual periods statements is also required as a result of the standard.beginning on or after 31 March 2004
IAS 37 Provisions, Contingent Annual periods beginning on This standard has an impact, but no financial effect onLiabilities and or after 1 July 1999 the Group. Additional disclosure in the financial statementsContingent Assets is also required as a result of the standard.

33massmart annual report
Standards (IFRS) or issues where unsatisfactory orconflicting interpretations have developed, or seem likely todevelop. It thus promotes the rigorous and uniformapplication of IFRSs.
The following IFRICs have been issued. Many of these haveno impact on the Group, and have been included forcompleteness. Where there is a financial impact, this hasbeen indicated.
Interpretations issued by the InternationalFinancial Reporting Interpretations Committee(IFRIC)The IFRIC is a committee of the International AccountingStandards Board (IASB) that assists the IASB in establishingand improving standards of financial accounting and reportingfor the benefit of users, preparers and auditors of financialstatements. The role of the IFRIC is to provide timelyguidance on newly identified financial reporting issues notspecifically addressed in International Financial Reporting
Standard Standard’s name Effective date Impact on the Group
IAS 38 Intangible Assets Business combinations after This standard has an impact, but no material financial31 March 2004 to all other effect on the Group. Additional disclosure in the financialintangible assets for annual statements is also required as a result of the standard.periods beginning on or after 31 March 2004
IAS 39 Financial Instruments: Annual periods beginning on This standard has an impact, but no financial effect onRecognition and or after 1 January 2005 the Group. Additional disclosure in the financial statementsMeasurement is also required as a result of the standard.
IAS 40 Investment Property Annual periods beginning on This standard has no impact on the Group.or after 1 January 2005
IAS 41 Agriculture Annual periods beginning on This standard has no impact on the Group.or after 1 January 2003
AC 501 Accounting for Annual periods beginning on This standard has an impact, but no financial effect on “Secondary Tax on or after 1 January 2004 the Group.Companies (STC)”
AC 502 Substantively Enacted Effective upon issue – This standard has an impact, but no financial effect on Tax Rates And Tax Laws 1 February 2006 the Group.
AC 503 Accounting For Black Annual periods beginning on This standard has an impact, but no financial effect on Economic Empowerment or after 1 May 2006 the Group. The Group’s BEE deal became effective on(Bee) Transactions 1 October 2006 and will be accounted for in the June
2007 financial year. Details can be found on pages 82and 83 and in the note below relating to the BEE circular.
IFRIC Name Effective date Impact on the Group
IFRIC 1 Changes in Existing Annual periods beginning on This IFRIC has no impact on the Group.Decommissioning, or after 1 September 2004.Restoration and Similar Liabilities
IFRIC 2 Members’ Shares in Annual periods beginning on This IFRIC has no impact on the Group.Cooperative Entities or after 1 January 2005and Similar Instruments
IFRIC 4 Determining whether an Annual periods beginning on This IFRIC has no impact on the Group.Arrangement contains or after 1 January 2006a Lease

34massmart annual report
Letter from the Chief Financial Officer continued
IFRIC Name Effective date Impact on the Group
IFRIC 5 Rights to Interests Annual periods beginning on This IFRIC has no impact on the Group.arising from or after 1 January 2006Decommissioning,Restoration and Environmental Rehabilitation Funds
IFRIC 6 Liabilities arising from Annual periods beginning on This IFRIC has no impact on the Group.Participating in a Specific or after 1 December 2005Market – Waste Electricaland Electronic Equipment
IFRIC 7 Applying the Restatement Annual periods beginning on This IFRIC has no impact on the Group. It was writtenApproach under IAS 29 or after 1 March 2006 for companies reporting in a hyperinflationary economyFinancial Reporting in for the first time.Hyperinflationary Economies
IFRIC 8 Scope of IFRS 2 Annual periods beginning on This IFRIC has an impact on the Group. It has beenShare-based Payment or after 1 May 2006 incorporated into the IFRS restatement. This IFRIC has
been early adopted.
IFRIC 9 Reassessment of Annual periods beginning on This IFRIC has no impact on the Group.Embedded Derivatives or after 1 June 2006
IFRIC 10 Interim Financial Annual periods beginning on This IFRIC has no impact on the Group.Reporting and or after 1 November 2006Impairment
The relevant IFRIC interpretations have been applied prospectively from the date of issue or other specified effective date.
An IFRIC becomes inoperative and is withdrawn when an IFRS orother authoritative document issued by the IASB that overridesor confirms a previously issued IFRIC becomes effective.
CircularsA circular is issued by the JSE or SAICA where guidance orclarification is required on an identified financial reportingissue on a South African platform (as apposed to an IFRIC,discussed above, that operates on an international platform).
This assistance is required to establish and improve standardsof financial accounting and reporting for the benefit of users,preparers and auditors of financial statements. It thus promotesthe rigorous and uniform application of the standards.
The following circulars were issued since the start of thefinancial year. Many of these have had no impact on theGroup and have been included for completeness. Where thereis a financial impact, this has been indicated.
Circular Name Date issued Impact on the Group
Circular Operating Leases August 2005 This circular has a material financial impact07/2005 on the Group as detailed in the
notes below.
Circular Status of Professional Pronouncements August 2005 This circular has an impact, but no financial 08/2005 (replacing 05/00) or disclosure effect on the Group.
Circular The Reporting Accountant’s Reporting August 2005 This circular has no impact on the Group.09/2005 Responsibilities in terms of Section 13 of
The Listings Requirements of The JSE Limited Relating to Property Companies

35massmart annual report
Circular Name Date issued Impact on the Group
Circular Reporting on Attorneys’ Trust Accounts in terms August 2005 This circular has no impact on the Group.10/2005 of The Attorneys Act and The Rules of The Law
Societies
Circular Reporting in terms of The Immigration Act September 2005 This circular has no impact on the Group.11/2005 (as amended) and The Immigration Regulations
Circular Guidance on the Electronic Submission of October 2005 This circular has no impact on the Group.12/2005 Financial Information of Retirement Funds
Circular Reports Relating to Certificates Prepared by a December 2005 This circular has no impact on the Group.13/2005 Company for Conveyancing Purposes
Circular Disclosures in Relation to Deferred Tax February 2006 This standard has an impact, but no01/2006 financial or disclosure effect on the Group.
Circular Clarification of Certain Sections of the Financial March 2006 This circular has no impact on the Group.02/2006 Intelligence Centre Act
Circular Evaluation of Compliance with Statements of GAAP March 2006 This circular has an impact, but no03/2006 financial or disclosure effect on the Group.
Circular Afrikaans Translation – Illustrative Financial March 2006 This circular has no impact on the Group. 04/2006 Statements
Circular Medical Schemes’ Summarised This circular has no impact on the Group.05/2006 Financial Statements
Circular Interim Guideline on Fees for Audits Done on April 2006 This circular has no impact on the Group.06/2006 Behalf of the Auditor-General
Circular Auditor’s Reporting Responsibilities in terms April 2006 This circular has no impact on the Group.07/2006 of the Regulations to the Banks Act
Circular Disclosure of Accounting Policy for Accounting May 2006 This circular has a financial impact on the08/2006 for Black Economic Empowerment (BEE) Group as detailed in the notes below.
Transactions
Circular Transactions Giving rise to Adjustments to May 2006 This circular has a financial impact on the 09/2006 Revenue/Purchases Group as detailed in the notes below.
Circular Recognition and Measurement of Short-Term June 2006 This circular has no impact on the Group.10/2006 Insurance Contracts
Circular Guideline on Fees for Audits Done on July 2006 This circular has no impact on the Group.11/2006 Behalf of the Auditor-General
Circular Operating Leases August 2006 This circular replaces Circular 07/200512/2006 and has no additional impact on the
Group above the original circular.
Where a circular impacts the Group, the results of the Group have been adjusted retrospectively, as if the Group had alwaysaccounted for the circular correctly.

36massmart annual report
Letter from the Chief Financial Officer continued
Circular 8/2006: Disclosure of Accounting Policy foraccounting for Black Economic Empowerment (BEE)transactionsThe Group announced its Black Economic Empowerment(BEE) Transaction on 16 May 2006. The estimated economiccost of entering into the BEE transaction for the Group and itsshareholders is approximately R235 million. This representsapproximately 2.2% of the market capitalisation of the Groupat 31 May 2006. This figure was calculated with reference tothe requirements of IFRS 2 Share-based Payments.
The principles underlying the accounting treatment are incompliance with IFRS. The standard requires the total chargeto be amortised over the period of the BEE transaction, beingsix years. This amortised charge will commence in the June2007 financial year. South African tax legislation currentlydoes not allow any tax deduction associated with this charge.
Shown below is an illustration of the anticipated effect on theGroup if the transaction had been in place for the current yearresults.
2006Reduced headline earnings R49.0 millionReduced headline earnings per share 24.6 cents
Generally accepted accounting practice in terms of IFRS willhave the effect of reducing Massmart’s future reportedheadline earnings by the amount of the dividend paid to theholders of the “A” Preference Shares. This has beenconfirmed in a technical opinion issued by the reportingaccountants. Given that the amortised IFRS 2 charge in effectalready includes the cost of this preference dividend, therewill be an element of double-counting the cost associatedwith this dividend. Based on current accounting framework,statements and practice, this double-counting appears to beunavoidable.
A summarised review of the transaction can be found on pages 82 and 83.
Circular 9/2006: Transactions giving rise to adjustments torevenue/purchasesThis circular provides clarity on the accounting treatment forcash discounts, settlement discounts, rebates and extendedpayment terms. This is in line with the accounting treatmentrequired by IAS 18 Revenue and IAS 2 Inventories.
The consolidated financial results have been restated, andthe effect on the Group has been a reallocation increasingother operating costs and reducing cost of sales by R523.1 million in 2005. There is no effect on tax, attributableearnings or headline earnings.
Other adjustments giving rise to a restatement of theconsolidated resultsDue to the nature of the current IFRS accounting environment,where standards are written for international application andrequire extensive interpretations for accurate adoption, thereis a potential exposure to future interpretations or changes incurrent interpretations that would require a change inaccounting application that is not driven by a change in thestandard itself. This type of change could arise as a result ofan IFRIC statement or circular, where the required bodies havedocumented the interpretation, or could arise on a smallerscale, where the effect would only be on the Group. Thefollowing two adjustments must be viewed in this light, andthe reader must bear in mind that the restatement wascompleted to provide more accurate results that better reflectthe financial position of the Group.
Accounting for extended warranty contractsDuring 2006, Massmart changed its accounting policy for thetreatment of extended warranty protection provided on thesale of goods and products. Previously, Massmart recognisedrevenue earned from the sale of extended warranty contractsas the contacts were signed. A provision was raised forpossible future obligations to provide future warrantyprotection.
The revenue earned from the extended warranty contracts isnow deferred and recognised in income on a straight-linebasis over the contract period except in those circumstanceswhere sufficient historical evidence indicates that the costsof performing services under the contract are incurred otherthan on a straight-line basis. In these circumstances, revenueis recognised over the contract period in proportion to thecosts expected to be incurred in performing services underthe contract. Management judges that this policy providesreliable and more relevant information because it results in amore transparent treatment of revenue and is consistent withinternational industry practice, making Massmart’s financialstatements more comparable.
Before the issue of IFRS 4 Insurance Contracts, various viewsexisted for the accounting treatment of extended warrantycontracts. The issue of IFRS 4 clarified that these contractsshould not be accounted for in accordance with IFRS 4 byreferring to these contracts in the scope exclusion section.Guidance previously issued by the Financial AccountingStandards Board (FASB) in the form of a technical bulletin,FTB 90-1: Accounting for Separately Priced Extended Warrantyand Product Maintenance Contracts. The technical bulletinclarified the accounting treatment for revenue from separatelypriced extended warranty and product maintenance contracts,which lead to the change in accounting policy as detailed above.

This change in accounting policy has been accounted forretrospectively, and the comparatives for 2005 have beenrestated. The details of restatement can be found in note 2 ofthe financial statements on page 124. In summary, there wasR59.8 million reduction to the 2005 opening retained income.
2006 2005Reduced headline earnings R10.6 million R12.5 millionReduced headline earnings per share 5.3 cents 6.3 cents
Accounting for debtorsIAS 39 requires that the amortised cost of a financial assetbe calculated using the effective interest method. Thismethod allocates interest over the relevant period by applyingthe effective interest rate to the carrying amount of the assetor liability.
At the date of transition to IFRS, being 1 July 2004, Massmartmade an adjustment to the carrying amount of certainfinancial assets that are measured at amortised cost underIAS 39 to reflect the effect of discounting future cash flows.This adjustment was recognised as an adjustment to theopening balance of retained earnings at the transition date.There is no effect on earnings or headline earnings for thetwo reporting periods.
SummaryThe Group’s accounting policies are governed by the IFRS andthe AC 500 series as issued by the Accounting PracticesBoard and listed above. Guidance has been obtained fromIFRICs and circulars effective on 17 October 2006, also listedabove. Due to the nature and volatility of Exposure Drafts(EDs), no review has been provided.
A complete reconciliation of the financial impact of IFRS,effective IFRICs, circulars and other interpretations, canbe found in note 2 of the financial statements on page 124.
The Group maintains the view that the standards set theminimum requirement for financial reporting. The financialstatements in this annual report have been prepared with theaim of exposing the reader to a very detailed view of thenumbers, using a simplified approach, in the hope offacilitating a deeper and informed understanding of theCompany.
Going-concern assertionThe Board has formally considered the going-concernassertion for Massmart and its subsidiaries and believes that it is appropriate for the forthcoming financial year. See page 112 for more detail.
AppreciationThe implementation of IFRS this financial year was anenormous task for the entire Massmart Group Financialcommunity that required careful analysis, planning andexecution. It was important to understand the many technicalrequirements and impact of the plethora of accountingstatements and circulars, and then to restate and report thenew financial figures – both for management reporting and forexternal reporting purposes – accurately and timeously.
The planning and execution of this task was a highly effectivecollaboration, initially between the Massmart CorporateFinance team, in particular Brenda Shelly and Aubrey Cimring,and our external auditors, Deloitte, which was then rolled outto the broader Group Financial community for practicalimplementation and reporting.
I would therefore like to pay tribute to the long hours investedby my Financial colleagues and their teams at all theMassmart Chains, and to the similarly long hours worked bythe many members of the Deloitte audit teams, during theyear and at the financial year-end to ensure the seamlessimplementation and execution of IFRS.
I would also like to acknowledge the efficient, effective andhigh quality work performance by everyone in the MassmartCorporate Finance and Accounting team, which due to theirdiligence and efficiency may sometimes go unnoticed. Inparticular, Penny Kriel and her team managing Corporate Taxhas become a centre of excellence addressing all the aspectsof compliance and reporting for the Group’s major tax payingcompanies. This role too, has been ably assisted by expertsfrom the Deloitte Tax department.
Guy Hayward17 October 2006
37massmart annual report
38massmart annual report
Inflation ......................................................................................................................................... 18, 26Moresport ..................................................................................................................................... 19, 25, 112Targets ........................................................................................................................................... 24Sale of Furnex ............................................................................................................................. 25, 126IFRS ................................................................................................................................................ 29, 124Risks .............................................................................................................................................. 29, 101, 161Going Concern ............................................................................................................................. 37, 112Share Price ................................................................................................................................... 48, 142Massdiscounters Review ......................................................................................................... 55Masswarehouse Review ........................................................................................................... 57Massbuild Review ...................................................................................................................... 59Masscash Review ...................................................................................................................... 61Sustainability Report Verification Statement ....................................................................... 68Sustainability Scorecard ........................................................................................................... 68Black Economic Empowerment Equity Transaction ........................................................... 82, 83Employee Development ............................................................................................................ 85Global Reporting Initiative ......................................................................................................... 98Calls to Massmart Ethics Line ............................................................................................... 106
King ll Index ................................................................................................................................. 107Deloitte & Touche (external auditors) ................................................................................... 109Dividends ...................................................................................................................................... 110, 113, 131Zimbabwe ..................................................................................................................................... 125Directors’ Emoluments ............................................................................................................. 152
Quick reference


Seven-year Review
40massmart annual report
Sales (Rm)
00
01
02
03
04
05
06
10 357.7
11 568.4
16 709.2
20 369.5
23 787.7
25 381.5
29 963.6
Operating profit (Rm)
00
01
02
03
04
05
06
201.5
267.9
499.1
698.2
776.2
992.3
1 328.1
EBITDA (Rm)
00
01
02
03
04
05
06
265.4
360.0
645.0
855.5
984.3
1 149.8
1 536.4
40massmart annual report
Definitions/Explanations
Income statement (Rm)Continuing operations:SalesCost of sales
Gross profit
Depreciation and amortisation costsImpairment of assetsEmployment costs This includes the IFRS 2 Share-based Payments expense.Occupancy costsNet operating costs
Total expenses
Operating profitFinance costs The net amount of interest received and interest paid.Exceptional items
Profit before taxTaxation
Profit for the year from continuing operationsDiscontinued operation:
Profit/(loss) for the yearLoss on disposal
Profit for the year
Attributable to:Equity holders of the parentMinority interest
EBITDA Earnings before interest, taxation, depreciation, amortisation and asset impairments.
EBITA Earnings before interest, taxation and asset impairments. We prefer using EBITA rather than operating profit as the latter includes the charge for asset impairments which can distort traditional trading ratios and returns.
Headline earnings
Operating statistics (excludes the discontinued operation)
Depreciation and amortisation costs as a % of sales
Impairment costs as a % of salesEmployment costs as a % of salesOccupancy costs as a % of sales
Total expenses as a % of sales

41massmart annual report
EBITA (Rm)
00
01
02
03
04
05
06
201.5
277.0
538.8
747.7
850.8
992.3
1 333.5
Headline earnings (Rm)
00
01
02
03
04
05
06
216.0
361.6
480.0
583.1
651.9
836.6
106.2
Total expenses as % of sales
00
01
02
03
04
05
06
14.0
12.6
11.5
11.9
12.6
13.3
14.4
41massmart annual report
Six-yearcompoundgrowth % 2006 1, 2 & 3 2005 1, 2 & 3 2004 1 2003 2002 2001 2000
19.4 29 963.6 25 381.5 23 787.7 20 369.5 16 709.2 11 568.4 10 357.7(24 650.0) (21 202.0) (20 183.2) (17 319.5) (14 112.1) (9 680.5) (8 668.3)
21.0 5 313.6 4 179.5 3 604.5 3 050.0 2 597.1 1 887.9 1 689.4
(202.9) (157.5) (133.5) (107.8) (106.2) (83.0) (63.9)(5.4) – (74.6) (49.5) (39.7) (9.1) –
(2 079.0) (1 656.7) (1 416.6) (1 168.5) (1 017.2) (778.8) (694.5)(740.5) (644.0) (563.7) (408.8) (366.0) (277.5) (291.0)(957.7) (729.0) (639.9) (617.2) (568.9) (471.6) (438.5)
(3 985.5) (3 187.2) (2 828.3) (2 351.8) (2 098.0) (1 620.0) (1 487.9)
36.9 1 328.1 992.3 776.2 698.2 499.1 267.9 201.5(32.2) (20.2) (7.2) (50.4) (14.1) 9.4 (56.6)
– – 5.0 6.7 5.2 (30.6) (9.8)
45.8 1 295.9 972.1 774.0 654.5 490.2 246.7 135.1(444.6) (307.5) (253.9) (215.2) (164.4) (63.0) (33.4)
42.5 851.3 664.6 520.1 439.3 325.8 183.7 101.7
3.7 (82.1) – – – – –(1.8) – – – – – –
853.2 582.5 520.1 439.3 325.8 183.7 101.7
42.3 828.5 580.1 511.2 429.3 321.7 179.7 99.624.7 2.4 8.9 10.0 4.1 4.0 2.1
42.5 853.2 582.5 520.1 439.3 325.8 183.7 101.7
34.0 1 536.4 1 149.8 984.3 855.5 645.0 360.0 265.4
37.0 1 333.5 992.3 850.8 747.7 538.8 277.0 201.541.1 836.6 651.9 583.1 480.0 361.6 216.0 106.2
(0.7) (0.6) (0.6) (0.5) (0.6) (0.7) (0.6)– – (0.3) (0.2) (0.2) (0.1) –
(6.9) (6.5) (6.0) (5.7) (6.1) (6.7) (6.7)(2.5) (2.5) (2.4) (2.0) (2.2) (2.4) (2.8)
(13.3) (12.6) (11.9) (11.5) (12.6) (14.0) (14.4)
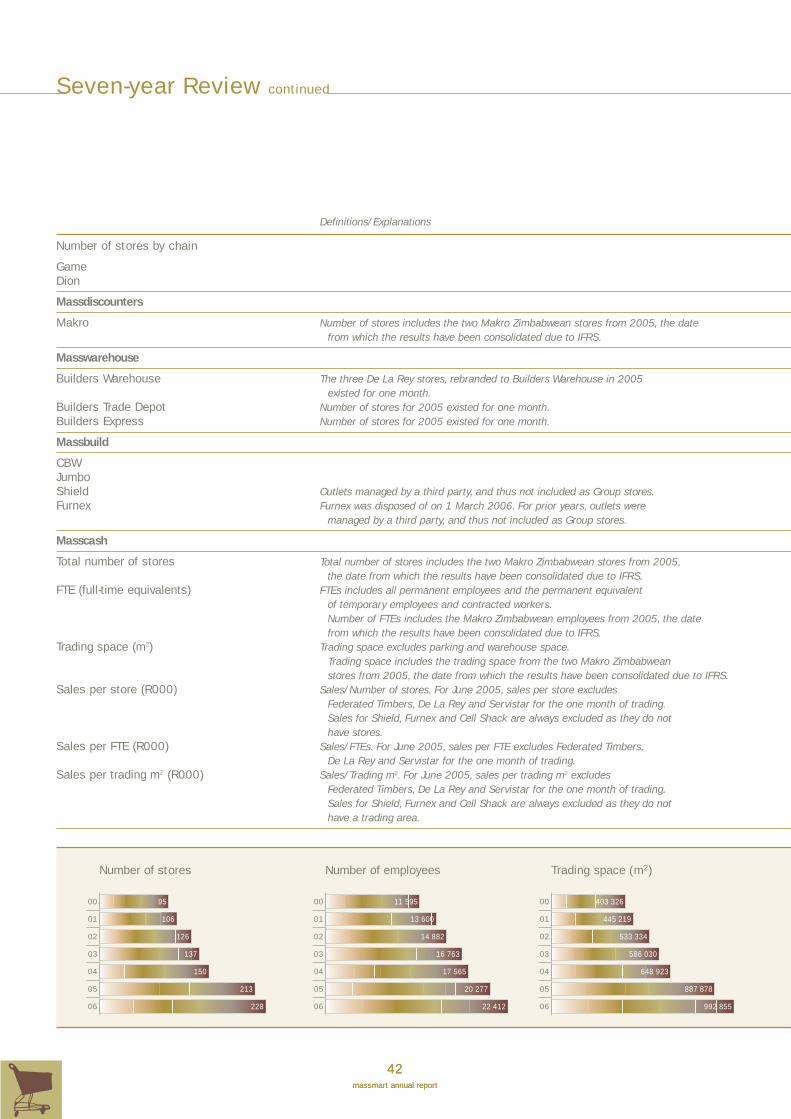
42massmart annual report
Seven-year Review continued
Number of stores
00
01
02
03
04
05
06
95
106
126
137
150
213
228
Number of employees
00
01
02
03
04
05
06
11 595
13 600
14 882
16 763
17 565
20 277
22 412
Trading space (m2)
00
01
02
03
04
05
06
403 326
445 219
533 334
586 030
648 923
887 878
992 855
Definitions/Explanations
Number of stores by chain
GameDion
Massdiscounters
Makro Number of stores includes the two Makro Zimbabwean stores from 2005, the datefrom which the results have been consolidated due to IFRS.
Masswarehouse
Builders Warehouse The three De La Rey stores, rebranded to Builders Warehouse in 2005 existed for one month.
Builders Trade Depot Number of stores for 2005 existed for one month.Builders Express Number of stores for 2005 existed for one month.
Massbuild
CBWJumboShield Outlets managed by a third party, and thus not included as Group stores.Furnex Furnex was disposed of on 1 March 2006. For prior years, outlets were
managed by a third party, and thus not included as Group stores.
Masscash
Total number of stores Total number of stores includes the two Makro Zimbabwean stores from 2005,the date from which the results have been consolidated due to IFRS.
FTE (full-time equivalents) FTEs includes all permanent employees and the permanent equivalentof temporary employees and contracted workers.Number of FTEs includes the Makro Zimbabwean employees from 2005, the datefrom which the results have been consolidated due to IFRS.
Trading space (m2) Trading space excludes parking and warehouse space.Trading space includes the trading space from the two Makro Zimbabwean stores from 2005, the date from which the results have been consolidated due to IFRS.
Sales per store (R000) Sales/Number of stores. For June 2005, sales per store excludesFederated Timbers, De La Rey and Servistar for the one month of trading.Sales for Shield, Furnex and Cell Shack are always excluded as they do not have stores.
Sales per FTE (R000) Sales/FTEs. For June 2005, sales per FTE excludes Federated Timbers,De La Rey and Servistar for the one month of trading.
Sales per trading m2 (R000) Sales/Trading m2. For June 2005, sales per trading m2 excludesFederated Timbers, De La Rey and Servistar for the one month of trading.Sales for Shield, Furnex and Cell Shack are always excluded as they do not have a trading area.
42massmart annual report

43massmart annual report
43massmart annual report
Six-yearcompoundgrowth % 2006 1, 2 & 3 2005 1, 2 & 3 2004 1 2003 2002 2001 2000
70 61 56 55 54 55 5310 11 11 11 11 11 11
80 72 67 66 65 66 64
14 14 12 13 12 12 12
14 14 12 13 12 12 12
20 15 8 6 – – –31 33 – – – – –14 14 – – – – –
65 62 8 6 – – –
62 58 57 46 43 22 197 7 6 6 6 6 –– – – – – – –
– – – – – – –
69 65 63 52 49 28 19
228 213 150 137 126 106 95
22 412 20 277 17 565 16 763 14 882 13 600 11 595
992 855 877 878 648 923 586 030 533 334 445 219 403 326
122 509 143 122 136 662 129 007 114 881 95 640 90 884
1 337 1 421 1 354 1 216 1 123 851 893
28 32 32 30 27 23 21
Sales per store (R000)
00
01
02
03
04
05
06
90 884
95 640
114 881
129 007
136 662
143 123
122 509
Sales per FTE (R000)
00
01
02
03
04
05
06
893
851
1 123
1 216
1 354
1 421
1 337
Sales per trading m2 (R000)
00
01
02
03
04
05
06
21
23
27
30
32
32
28
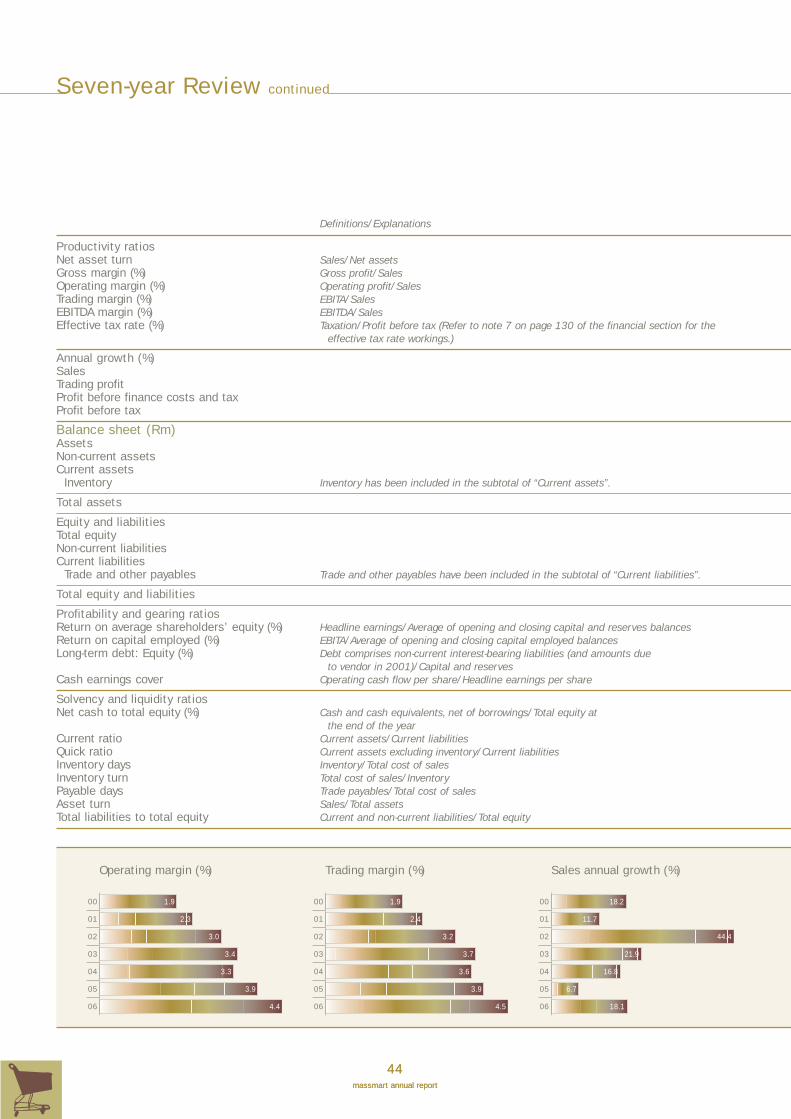
44massmart annual report
Seven-year Review continued
Operating margin (%)
00
01
02
03
04
05
06
1.9
2.3
3.0
3.4
3.3
3.9
4.4
Trading margin (%)
00
01
02
03
04
05
06
1.9
2.4
3.2
3.7
3.6
3.9
4.5
Sales annual growth (%)
00
01
02
03
04
05
06
18.2
11.7
44.4
21.9
16.8
6.7
18.1
Definitions/Explanations
Productivity ratiosNet asset turn Sales/Net assetsGross margin (%) Gross profit/SalesOperating margin (%) Operating profit/SalesTrading margin (%) EBITA/SalesEBITDA margin (%) EBITDA/SalesEffective tax rate (%) Taxation/Profit before tax (Refer to note 7 on page 130 of the financial section for the
effective tax rate workings.)
Annual growth (%)SalesTrading profitProfit before finance costs and taxProfit before tax
Balance sheet (Rm)AssetsNon-current assetsCurrent assets
Inventory Inventory has been included in the subtotal of “Current assets”.
Total assets
Equity and liabilitiesTotal equityNon-current liabilitiesCurrent liabilities
Trade and other payables Trade and other payables have been included in the subtotal of “Current liabilities”.
Total equity and liabilities
Profitability and gearing ratiosReturn on average shareholders’ equity (%) Headline earnings/Average of opening and closing capital and reserves balancesReturn on capital employed (%) EBITA/Average of opening and closing capital employed balancesLong-term debt: Equity (%) Debt comprises non-current interest-bearing liabilities (and amounts due
to vendor in 2001)/Capital and reservesCash earnings cover Operating cash flow per share/Headline earnings per share
Solvency and liquidity ratiosNet cash to total equity (%) Cash and cash equivalents, net of borrowings/Total equity at
the end of the yearCurrent ratio Current assets/Current liabilitiesQuick ratio Current assets excluding inventory/Current liabilitiesInventory days Inventory/Total cost of salesInventory turn Total cost of sales/InventoryPayable days Trade payables/Total cost of salesAsset turn Sales/Total assetsTotal liabilities to total equity Current and non-current liabilities/Total equity
44massmart annual report

45massmart annual report
45massmart annual report
Six-yearcompoundgrowth % 2006 1, 2 & 3 2005 1, 2 & 3 2004 1 2003 2002 2001 2000
12 12 14 13 10 9 1817.7 16.5 15.2 15.0 15.5 16.3 16.34.4 3.9 3.3 3.4 3.0 2.3 1.94.5 3.9 3.6 3.7 3.2 2.4 1.95.1 4.5 4.1 4.2 3.9 3.1 2.6
34.3 31.6 32.8 32.9 33.6 25.5 24.7
18.1 6.7 16.8 21.9 44.4 11.7 18.234.4 16.6 13.8 38.8 94.5 37.5 48.933.8 27.0 10.8 39.8 112.5 23.8 (23.6)33.3 25.6 18.3 33.5 98.7 82.6 (26.2)
25.7 3 034.1 2 769.6 1 789.5 1 483.3 1 230.1 1 233.6 770.219.2 6 584.3 5 363.6 5 319.8 4 559.8 3 714.8 2 909.8 2 297.416.1 3 221.0 2 677.0 2 356.5 2 236.7 1 981.9 1 555.7 1 318.5
21.0 9 618.4 8 133.2 7 109.3 6 043.1 4 944.9 4 143.4 3 067.6
22.1 1 952.4 1 559.0 1 461.5 1 319.1 1 426.7 1 215.7 588.851.0 1 133.8 744.5 774.7 838.8 281.9 71.3 95.818.3 6 532.2 5 829.7 4 873.1 3 885.2 3 236.3 2 856.4 2 383.019.3 5 875.7 5 001.7 4 437.8 3 684.2 3 042.7 2 247.1 2 034.1
21.0 9 618.4 8 133.2 7 109.3 6 043.1 4 944.9 4 143.4 3 067.6
48.9 44.2 42.8 35.4 27.6 19.1 24.957.1 51.4 52.7 46.3 37.3 30.6 38.5
27.3 9.2 14.1 19.1 16.7 42.4 0.51.6 1.4 2.0 1.4 1.6 1.4 (0.2)
70.5 26.0 70.1 42.7 38.6 41.0 (14.2)1.0 0.9 1.1 1.2 1.1 1.0 1.00.5 0.5 0.6 0.6 0.5 0.5 0.4
days 48 46 43 47 51 59 567.7 7.9 8.6 7.7 7.1 6.2 6.6
days 87 86 80 78 79 85 863.1 3.1 3.3 3.4 3.4 2.8 3.43.9 4.2 3.9 3.6 2.5 2.4 4.2
Return on shareholders’ equity (%)
00
01
02
03
04
05
06
24.9
19.1
27.6
35.4
42.8
44.2
48.9
Return on capital employed (%)
00
01
02
03
04
05
06
38.5
30.6
37.3
46.3
52.7
51.4
57.1
Long-term debt: Equity (%)
00
01
02
03
04
05
06
0.5
42.4
16.7
19.1
14.1
9.2
27.3
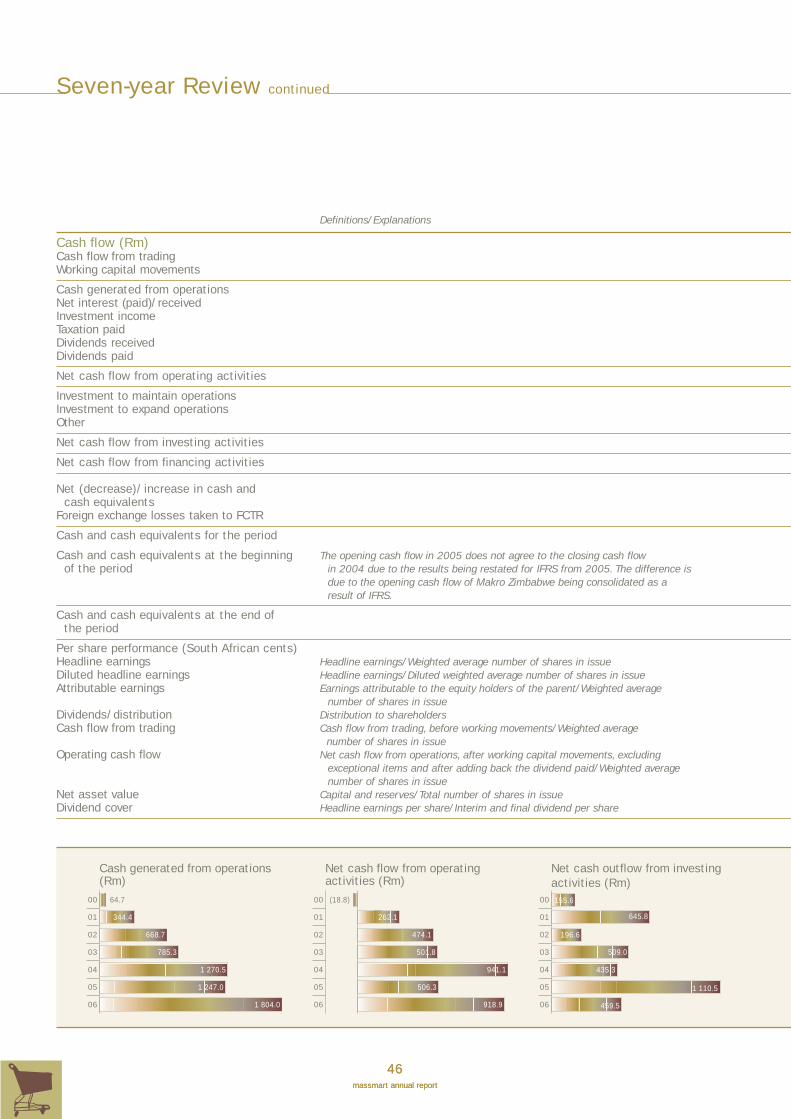
Seven-year Review continued
46massmart annual report
Definitions/Explanations
Cash flow (Rm)Cash flow from tradingWorking capital movements
Cash generated from operationsNet interest (paid)/receivedInvestment incomeTaxation paidDividends receivedDividends paid
Net cash flow from operating activities
Investment to maintain operationsInvestment to expand operationsOther
Net cash flow from investing activities
Net cash flow from financing activities
Net (decrease)/increase in cash and cash equivalents
Foreign exchange losses taken to FCTR
Cash and cash equivalents for the period
Cash and cash equivalents at the beginning The opening cash flow in 2005 does not agree to the closing cash flowof the period in 2004 due to the results being restated for IFRS from 2005. The difference is
due to the opening cash flow of Makro Zimbabwe being consolidated as aresult of IFRS.
Cash and cash equivalents at the end of the period
Per share performance (South African cents)Headline earnings Headline earnings/Weighted average number of shares in issueDiluted headline earnings Headline earnings/Diluted weighted average number of shares in issueAttributable earnings Earnings attributable to the equity holders of the parent/Weighted average
number of shares in issueDividends/distribution Distribution to shareholdersCash flow from trading Cash flow from trading, before working movements/Weighted average
number of shares in issueOperating cash flow Net cash flow from operations, after working capital movements, excluding
exceptional items and after adding back the dividend paid/Weighted averagenumber of shares in issue
Net asset value Capital and reserves/Total number of shares in issueDividend cover Headline earnings per share/Interim and final dividend per share
46massmart annual report
Cash generated from operations(Rm)
00
01
02
03
04
05
06
64.7
344.4
668.7
785.3
1 270.5
1 247.0
1 804.0
Net cash flow from operatingactivities (Rm)
00
01
02
03
04
05
06
262.1
474.1
501.8
941.1
506.3
918.9
(18.8)
Net cash outflow from investingactivities (Rm)
00
01
02
03
04
05
06
155.6
645.8
196.6
509.0
435.3
1 110.5
459.5
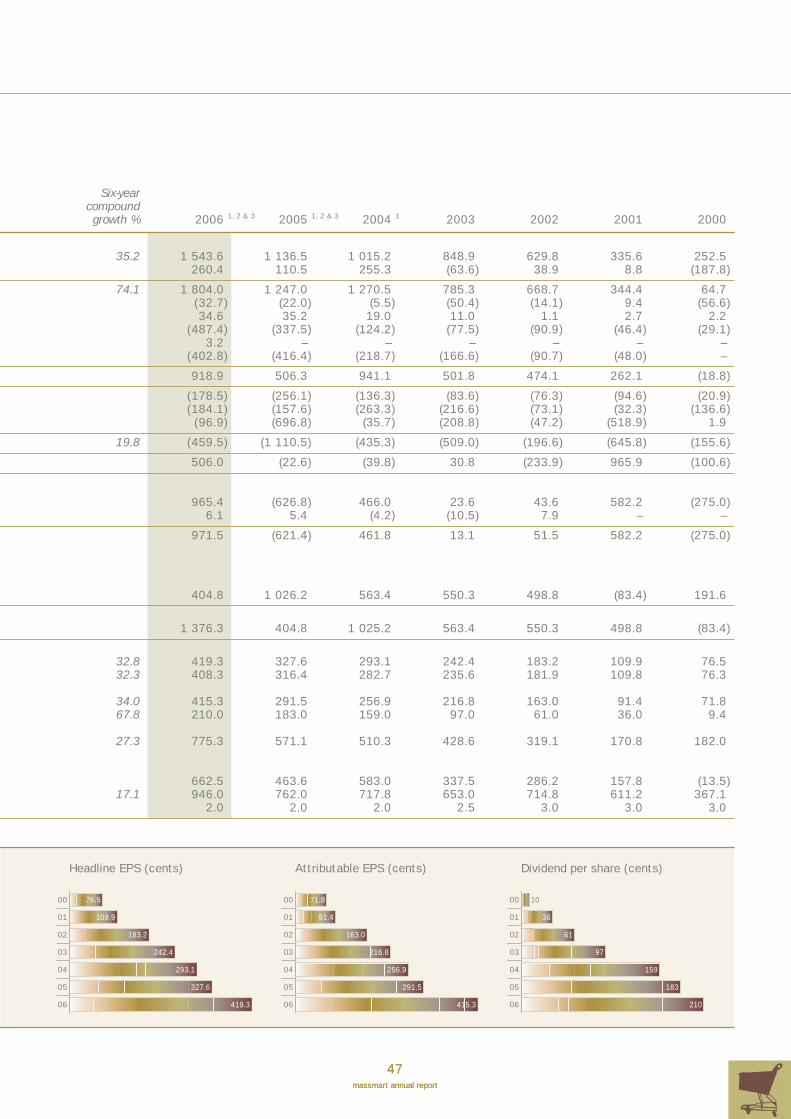
47massmart annual report
47massmart annual report
Six-yearcompoundgrowth % 2006 1, 2 & 3 2005 1, 2 & 3 2004 1 2003 2002 2001 2000
35.2 1 543.6 1 136.5 1 015.2 848.9 629.8 335.6 252.5260.4 110.5 255.3 (63.6) 38.9 8.8 (187.8)
74.1 1 804.0 1 247.0 1 270.5 785.3 668.7 344.4 64.7(32.7) (22.0) (5.5) (50.4) (14.1) 9.4 (56.6)34.6 35.2 19.0 11.0 1.1 2.7 2.2
(487.4) (337.5) (124.2) (77.5) (90.9) (46.4) (29.1)3.2 – – – – – –
(402.8) (416.4) (218.7) (166.6) (90.7) (48.0) –
918.9 506.3 941.1 501.8 474.1 262.1 (18.8)
(178.5) (256.1) (136.3) (83.6) (76.3) (94.6) (20.9)(184.1) (157.6) (263.3) (216.6) (73.1) (32.3) (136.6)(96.9) (696.8) (35.7) (208.8) (47.2) (518.9) 1.9
19.8 (459.5) (1 110.5) (435.3) (509.0) (196.6) (645.8) (155.6)
506.0 (22.6) (39.8) 30.8 (233.9) 965.9 (100.6)
965.4 (626.8) 466.0 23.6 43.6 582.2 (275.0)6.1 5.4 (4.2) (10.5) 7.9 – –
971.5 (621.4) 461.8 13.1 51.5 582.2 (275.0)
404.8 1 026.2 563.4 550.3 498.8 (83.4) 191.6
1 376.3 404.8 1 025.2 563.4 550.3 498.8 (83.4)
32.8 419.3 327.6 293.1 242.4 183.2 109.9 76.532.3 408.3 316.4 282.7 235.6 181.9 109.8 76.3
34.0 415.3 291.5 256.9 216.8 163.0 91.4 71.867.8 210.0 183.0 159.0 97.0 61.0 36.0 9.4
27.3 775.3 571.1 510.3 428.6 319.1 170.8 182.0
662.5 463.6 583.0 337.5 286.2 157.8 (13.5)17.1 946.0 762.0 717.8 653.0 714.8 611.2 367.1
2.0 2.0 2.0 2.5 3.0 3.0 3.0
Headline EPS (cents)
00
01
02
03
04
05
06
76.5
109.9
183.2
242.4
293.1
327.6
419.3
Attributable EPS (cents)
00
01
02
03
04
05
06
71.8
91.4
163.0
216.8
256.9
291.5
415.3
Dividend per share (cents)
00
01
02
03
04
05
06
10
36
61
97
159
183
210
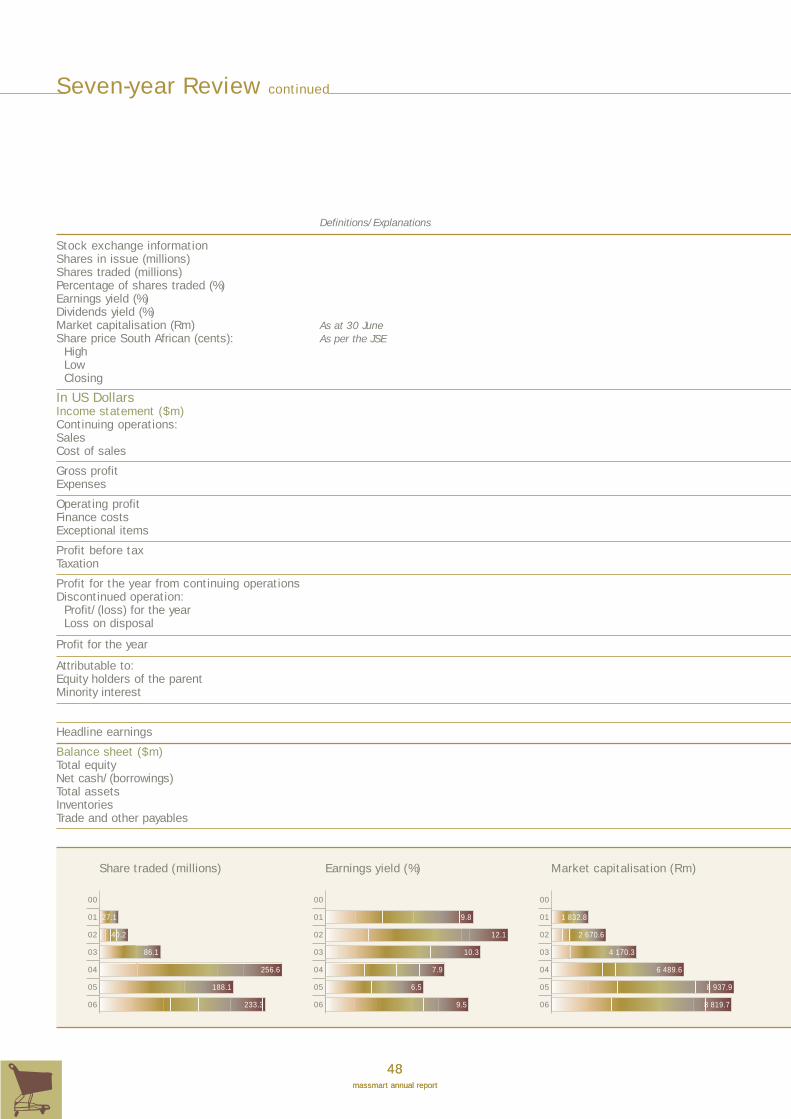
48massmart annual report
Seven-year Review continued
Definitions/Explanations
Stock exchange informationShares in issue (millions)Shares traded (millions)Percentage of shares traded (%)Earnings yield (%)Dividends yield (%)Market capitalisation (Rm) As at 30 JuneShare price South African (cents): As per the JSE
HighLowClosing
In US DollarsIncome statement ($m)Continuing operations:SalesCost of sales
Gross profitExpenses
Operating profitFinance costsExceptional items
Profit before taxTaxation
Profit for the year from continuing operationsDiscontinued operation:
Profit/(loss) for the yearLoss on disposal
Profit for the year
Attributable to:Equity holders of the parentMinority interest
Headline earnings
Balance sheet ($m)Total equityNet cash/(borrowings)Total assetsInventoriesTrade and other payables
48massmart annual report
Share traded (millions)
00
01
02
03
04
05
06
27.1
40.2
86.1
256.6
188.1
233.3
Earnings yield (%)
00
01
02
03
04
05
06
9.8
12.1
10.3
7.9
6.5
9.5
Market capitalisation (Rm)
00
01
02
03
04
05
06
1 832.8
2 670.6
4 170.3
6 489.6
8 937.9
8 819.7

49massmart annual report
49massmart annual report
Six-yearcompoundgrowth % 2006 1, 2 & 3 2005 1, 2 & 3 2004 1 2003 2002 2001 2000
201.0 199.6 199.2 198.6 197.8 197.1 –233.3 188.1 256.6 86.1 40.2 27.1 –116.0 94.2 128.8 43.4 20.3 13.8 –
9.5 6.5 7.9 10.3 12.1 9.8 –4.8 4.1 4.9 4.6 4.5 3.9
8 819.7 8 937.9 6 489.6 4 170.3 2 670.6 1 832.8 –
6 408 5 370 3 359 2 222 1 550 1 455 –4 185 3 145 2 080 1 275 930 760 –4 387 4 477 3 258 2 100 1 350 930 –
19.2 4 667.2 4 087.2 3 477.7 2 248.3 1 643.0 1 518.2 1 631.1(3 839.6) (3 414.2) (2 950.8) (1 911.6) (1 387.6) (1 270.4) (1 365.1)
20.8 827.7 673.0 526.9 336.7 255.4 247.8 266.0(620.8) (513.2) (413.5) (259.6) (206.3) (212.6) (234.3)
36.7 206.9 159.8 113.4 77.1 49.1 35.2 31.7(5.0) (3.3) (1.1) (5.6) (1.4) 1.2 (8.9)
– – 0.7 0.7 0.5 (4.0) (1.5)
45.5 201.9 156.5 113.0 72.2 48.2 32.4 21.3(69.3) (49.5) (37.1) (23.8) (16.2) (8.3) (5.3)
42.2 132.6 107.0 75.9 48.4 32.0 24.1 16.0
0.6 (13.2)(0.3) –
132.9 93.8 75.9 48.4 32.0 24,1 16,0
42.1 129.1 93.4 74.6 47.3 31.6 23.6 15.73.8 0.4 1.3 1.1 0.4 0.5 0.3
42.3 132.9 93.8 75.9 48.4 32.0 24.1 16.0
40.8 130.3 105.0 85.2 53.0 35.6 28.3 16.7
20.5 254.3 226.0 225.5 163.5 139.1 149.5 83.2184.0 60.1 161.7 71.1 54.1 61.9 (12.0)
19.5 1 285.9 1 208.5 1 121.3 762.1 486.3 514.1 442.514.6 430.6 397.8 371.7 282.1 194.9 193.0 190.217.8 785.5 743.2 700.0 464.6 299.2 278.8 293.4
Massmart share price (cents)
00
01
02
03
04
05
06
930
1 350
2 100
3 258
4 477
4 387
Sales ($m)
00
01
02
03
04
05
06
1 518.2
1 643.0
2 248.3
3 477.7
4 087.2
4 667.2
1 631.1
Headline earnings ($m)
00
01
02
03
04
05
06
28.3
35.6
53.0
85.2
105.0
130.3
16.7
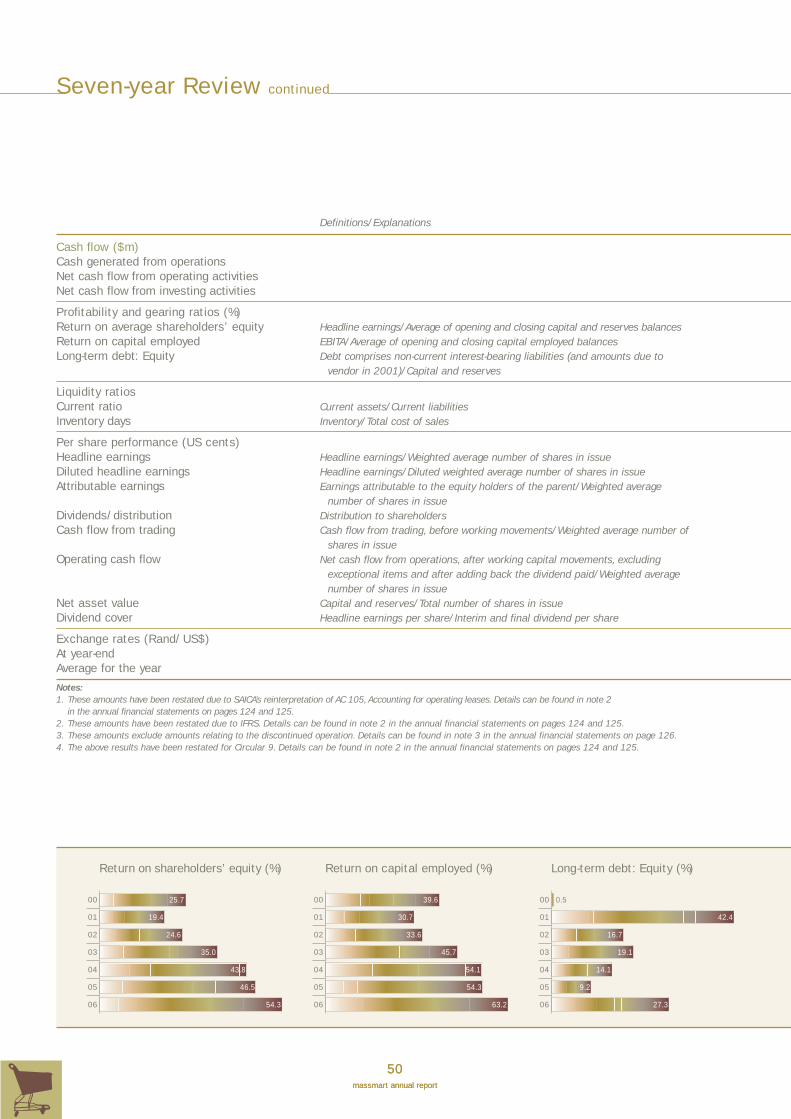
50massmart annual report
Seven-year Review continued
Definitions/Explanations
Cash flow ($m)Cash generated from operationsNet cash flow from operating activitiesNet cash flow from investing activities
Profitability and gearing ratios (%)Return on average shareholders’ equity Headline earnings/Average of opening and closing capital and reserves balancesReturn on capital employed EBITA/Average of opening and closing capital employed balancesLong-term debt: Equity Debt comprises non-current interest-bearing liabilities (and amounts due to
vendor in 2001)/Capital and reserves
Liquidity ratiosCurrent ratio Current assets/Current liabilitiesInventory days Inventory/Total cost of sales
Per share performance (US cents) Headline earnings Headline earnings/Weighted average number of shares in issueDiluted headline earnings Headline earnings/Diluted weighted average number of shares in issueAttributable earnings Earnings attributable to the equity holders of the parent/Weighted average
number of shares in issueDividends/distribution Distribution to shareholdersCash flow from trading Cash flow from trading, before working movements/Weighted average number of
shares in issueOperating cash flow Net cash flow from operations, after working capital movements, excluding
exceptional items and after adding back the dividend paid/Weighted averagenumber of shares in issue
Net asset value Capital and reserves/Total number of shares in issueDividend cover Headline earnings per share/Interim and final dividend per share
Exchange rates (Rand/US$)At year-endAverage for the year
Notes:1. These amounts have been restated due to SAICA’s reinterpretation of AC 105, Accounting for operating leases. Details can be found in note 2
in the annual financial statements on pages 124 and 125.2. These amounts have been restated due to IFRS. Details can be found in note 2 in the annual financial statements on pages 124 and 125.3. These amounts exclude amounts relating to the discontinued operation. Details can be found in note 3 in the annual financial statements on page 126.4. The above results have been restated for Circular 9. Details can be found in note 2 in the annual financial statements on pages 124 and 125.
50massmart annual report
Return on shareholders’ equity (%)
00
01
02
03
04
05
06
19.4
24.6
35.0
43.8
46.5
54.3
25.7
Return on capital employed (%)
00
01
02
03
04
05
06
30.7
33.6
45.7
54.1
54.3
63.2
39.6
Long-term debt: Equity (%)
00
01
02
03
04
05
06
42.4
16.7
19.1
14.1
9.2
27.3
0.5

51massmart annual report
51massmart annual report
Six-yearcompoundgrowth % 2006 1, 2 & 3 2005 1, 2 & 3 2004 1 2003 2002 2001 2000
73.8 281.0 200.8 185.7 86.7 65.8 45.2 10.2143.1 81.5 137.6 55.4 46.6 34.4 (3.0)
19.6 (71.6) (178.8) (63.6) (56.2) (19.3) (84.8) (24.5)
54.3 46.5 43.8 35.0 24.6 19.4 25.763.2 54.3 54.1 45.7 33.6 30.7 39.6
27.3 9.2 14.1 19.1 16.7 42.4 0.5
1.0 0.9 1.1 1.2 1.1 1.0 1.041 43 46 54 51 55 51
32.5 65.3 52.8 42.9 26.8 18.0 14.4 12.032.0 63.6 51.0 41.3 26.0 17.9 14.4 12.0
33.7 64.7 46.9 37.6 23.9 16.0 12.0 11.367.5 32.7 29.5 23.2 10.7 6.0 4.7 1.5
27.1 120.5 92.0 74.6 47.3 31.4 22.4 28.7
103.2 74.7 85.2 37.3 28.1 20.7 (2.1)15.6 126.5 113.2 113.2 82.3 70.3 75.8 53.0
2.0 2.0 2.0 2.5 3.0 3.0 3.0
7.48 6.73 6.34 7.93 10.17 8.06 6.936.42 6.21 6.84 9.06 10.17 7.62 6.35
Headline EPS (US cents)
00
01
02
03
04
05
06
14.4
18.0
26.8
42.9
52.8
65.3
12.0
Attributable EPS (US cents)
00
01
02
03
04
05
06
12.0
16.0
23.9
37.6
46.9
64.7
11.3
Exchange rate at year-end(ZAR/US$)
00
01
02
03
04
05
06
8.06
10.17
7.93
6.34
6.73
7.48
6.93

52massmart annual report
52massmart annual report
Massmart in the Headlines
2000 to 2006
* These headlines have been selectively extracted from Business Day, Business Report and Financial Mail to highlight Massmart’s growth from
2000 to 2006.
Retail group Massmart made a strong debut onthe Johannesburg Stock Exchange yesterday.Business Day 5/7/2000
Newly listed wholesale and retail group Massmartproduced a 38% rise in earnings to 84,5 cents ashare on the back of record sales and profits.Business Day 16/8/2000
Massmart Holdings reported a 9% increase inturnover, to R6,17 billion from R5,65 billion, in itsmaiden interim results for the six months toDecember 31.Business Day 20/2/2001
Massmart’s sales soar by 33% – MassmartHoldings managed to lift sales a hefty 33 per centto R8,02 billion in the 26 weeks to December.Business Report 25/2/2002
Bulk retailer and wholesaler Massmart streakedahead of market forecasts yesterday, posting awhopping 95 per cent rise in trading profit toR539 million in the year to June.Business Report 22/5/2002
Massmart pushed up sales 32% to R10,5 billionand saw a 45% jump, to R430 million, in tradingprofit in its half-year results to December . . .Business Day 27/2/2003
Massmart has go-ahead for acquisition – Allconditions for consumer goods distributorMassmart’s acquisition of the Builders Warehouseand Tile Warehouse were fulfilled or waived afterlast week’s Competition Tribunal approval . . .Business Day 10/3/2003
Massmart pencils in record profit – Diversifiedmass market retailer and wholesaler Massmarthad pencilled in record sales and profits for thefull year to June, it said in a trading statement thisweek.Business Report 7/5/2003
Solid offshore interest boosts Massmart –Shares in Massmart soared nearly 7 per centyesterday as a 30,9 per cent stake owned byDutch member SHV Holdings was snapped up.Business Report 23/1/2004
Massmart provides fresh evidence of retail boom– A trading update from Massmart on Friday hasgiven fresh evidence of the retail boom . . . salesfor the 52 weeks to 27 June had ramped up16,7% to R23,8 billion.Business Day 5/7/2004
Massmart budgets R1,6 billion for new stores –Massmart has budgeted about R1,6 billion for theopening of new stores in the next few years.Business Report 27/8/2004
Massmart improves house with new buys –Massmart . . . has boosted its move into thehome improvement market by acquiring FederatedTimbers and Cape-based De La Rey.Business Report 25/2/2005
Massmart spruces up holdings with Servistar buy– Massmart Holdings has acquired the Servistarchain of home improvement stores based inKwaZulu-Natal, the Eastern and Southern Cape.Business Report 8/3/2005
Massmart gets green light to acquire Cell-Shack– Massmart has received the go-ahead fromcompetition authorities for its acquisition ofcellphone business Cell-Shack Communications.Business Report 18/3/2005
Massmart marks profit record – Retail groupMassmart on Thursday reported a 16 per centincrease in HEPS to 341 cents for the year endedJune 2005 from 293,1 cents.Business Report 25/8/2005
Mass empowerment – Mass discounter Massmartyesterday announced a group wide empowermenttransaction it described as “one of the largest andmost important transactions” in its history. Business Day 17/5/2006
Diamond Massmart – A record of 35 consecutivesix-month periods of sales growth over 8% is anachievement any retailer would be justified incrowing about . . .Financial Mail 1/9/2006


Massdiscounters
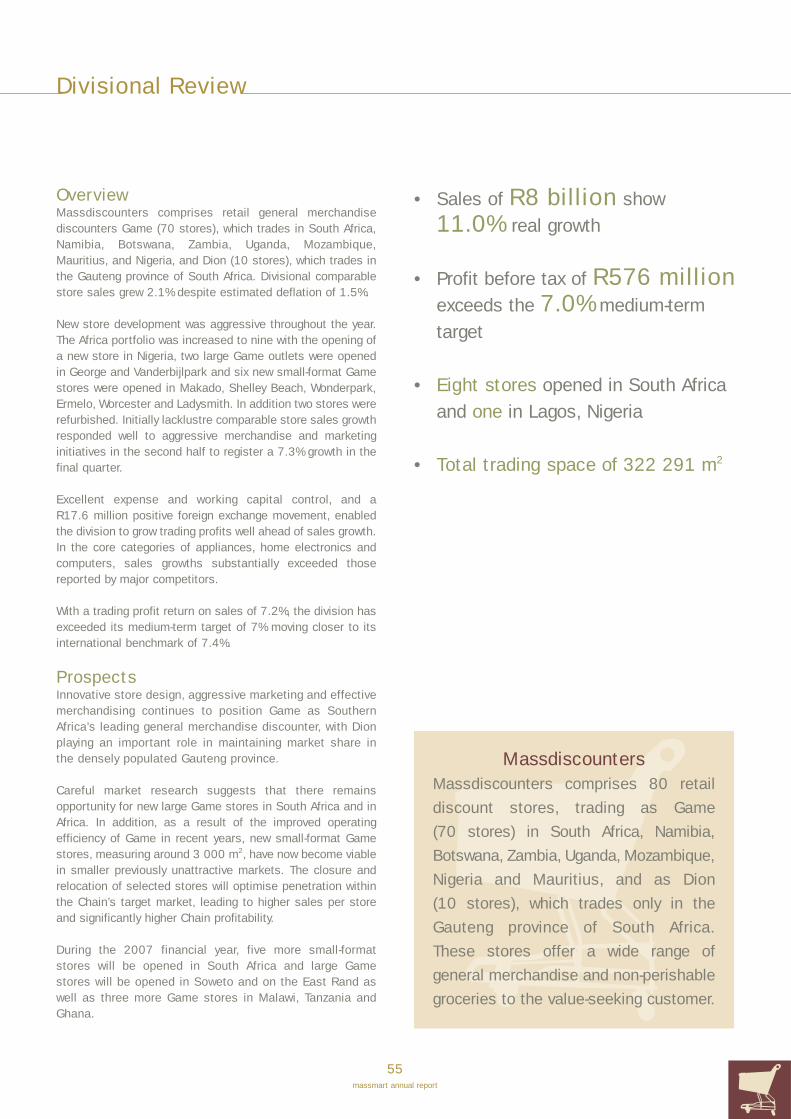
Divisional Review
55massmart annual report
OverviewMassdiscounters comprises retail general merchandisediscounters Game (70 stores), which trades in South Africa,Namibia, Botswana, Zambia, Uganda, Mozambique,Mauritius, and Nigeria, and Dion (10 stores), which trades inthe Gauteng province of South Africa. Divisional comparablestore sales grew 2.1% despite estimated deflation of 1.5%.
New store development was aggressive throughout the year.The Africa portfolio was increased to nine with the opening ofa new store in Nigeria, two large Game outlets were openedin George and Vanderbijlpark and six new small-format Gamestores were opened in Makado, Shelley Beach, Wonderpark,Ermelo, Worcester and Ladysmith. In addition two stores wererefurbished. Initially lacklustre comparable store sales growthresponded well to aggressive merchandise and marketinginitiatives in the second half to register a 7.3% growth in thefinal quarter.
Excellent expense and working capital control, and aR17.6 million positive foreign exchange movement, enabledthe division to grow trading profits well ahead of sales growth.In the core categories of appliances, home electronics andcomputers, sales growths substantially exceeded thosereported by major competitors.
With a trading profit return on sales of 7.2%, the division hasexceeded its medium-term target of 7% moving closer to itsinternational benchmark of 7.4%.
ProspectsInnovative store design, aggressive marketing and effectivemerchandising continues to position Game as SouthernAfrica’s leading general merchandise discounter, with Dionplaying an important role in maintaining market share inthe densely populated Gauteng province.
Careful market research suggests that there remainsopportunity for new large Game stores in South Africa and inAfrica. In addition, as a result of the improved operatingefficiency of Game in recent years, new small-format Gamestores, measuring around 3 000 m2, have now become viablein smaller previously unattractive markets. The closure andrelocation of selected stores will optimise penetration withinthe Chain’s target market, leading to higher sales per storeand significantly higher Chain profitability.
During the 2007 financial year, five more small-formatstores will be opened in South Africa and large Gamestores will be opened in Soweto and on the East Rand aswell as three more Game stores in Malawi, Tanzania andGhana.
• Sales of R8 billion show11.0% real growth
• Profit before tax of R576 millionexceeds the 7.0% medium-termtarget
• Eight stores opened in South Africaand one in Lagos, Nigeria
• Total trading space of 322 291 m2
MassdiscountersMassdiscounters comprises 80 retail
discount stores, trading as Game
(70 stores) in South Africa, Namibia,
Botswana, Zambia, Uganda, Mozambique,
Nigeria and Mauritius, and as Dion
(10 stores), which trades only in the
Gauteng province of South Africa.
These stores offer a wide range of
general merchandise and non-perishable
groceries to the value-seeking customer.
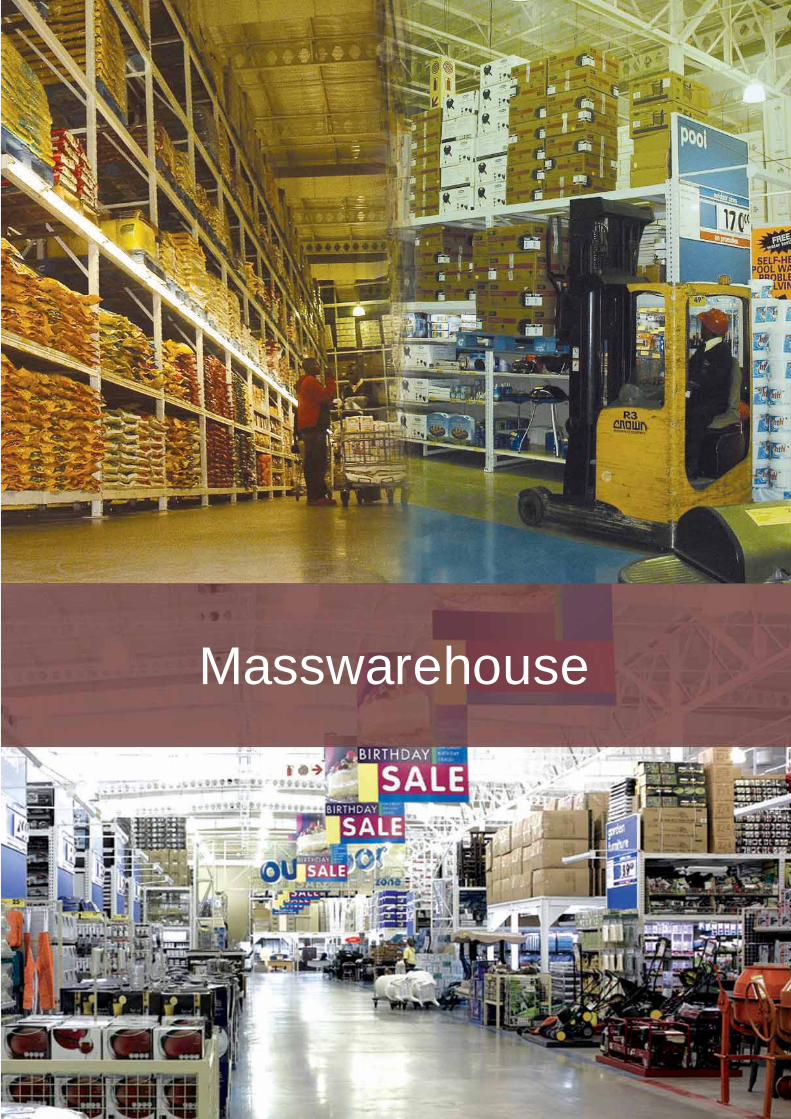
Masswarehouse
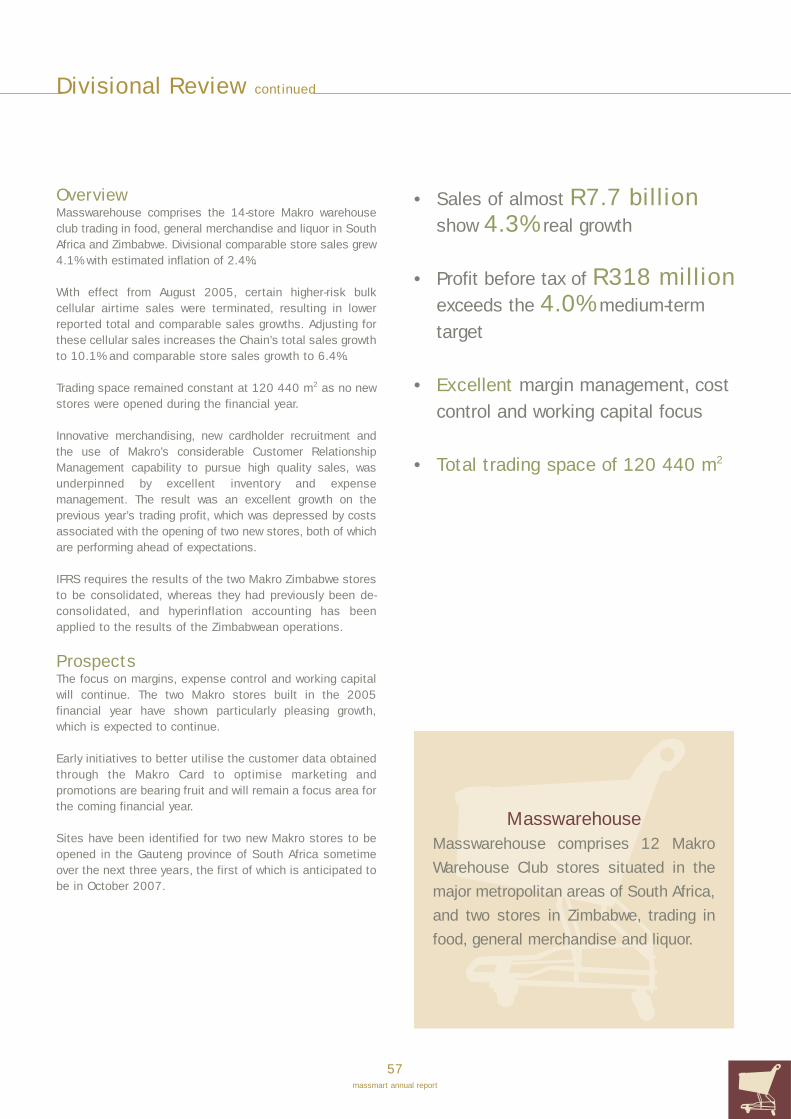
Divisional Review continued
57massmart annual report
OverviewMasswarehouse comprises the 14-store Makro warehouseclub trading in food, general merchandise and liquor in SouthAfrica and Zimbabwe. Divisional comparable store sales grew4.1% with estimated inflation of 2.4%.
With effect from August 2005, certain higher-risk bulkcellular airtime sales were terminated, resulting in lowerreported total and comparable sales growths. Adjusting forthese cellular sales increases the Chain’s total sales growthto 10.1% and comparable store sales growth to 6.4%.
Trading space remained constant at 120 440 m2 as no newstores were opened during the financial year.
Innovative merchandising, new cardholder recruitment andthe use of Makro’s considerable Customer RelationshipManagement capability to pursue high quality sales, wasunderpinned by excellent inventory and expensemanagement. The result was an excellent growth on theprevious year’s trading profit, which was depressed by costsassociated with the opening of two new stores, both of whichare performing ahead of expectations.
IFRS requires the results of the two Makro Zimbabwe storesto be consolidated, whereas they had previously been de-consolidated, and hyperinflation accounting has beenapplied to the results of the Zimbabwean operations.
ProspectsThe focus on margins, expense control and working capitalwill continue. The two Makro stores built in the 2005financial year have shown particularly pleasing growth,which is expected to continue.
Early initiatives to better utilise the customer data obtainedthrough the Makro Card to optimise marketing andpromotions are bearing fruit and will remain a focus area forthe coming financial year.
Sites have been identified for two new Makro stores to beopened in the Gauteng province of South Africa sometimeover the next three years, the first of which is anticipated tobe in October 2007.
• Sales of almost R7.7 billionshow 4.3% real growth
• Profit before tax of R318 millionexceeds the 4.0% medium-termtarget
• Excellent margin management, costcontrol and working capital focus
• Total trading space of 120 440 m2
MasswarehouseMasswarehouse comprises 12 Makro
Warehouse Club stores situated in the
major metropolitan areas of South Africa,
and two stores in Zimbabwe, trading in
food, general merchandise and liquor.
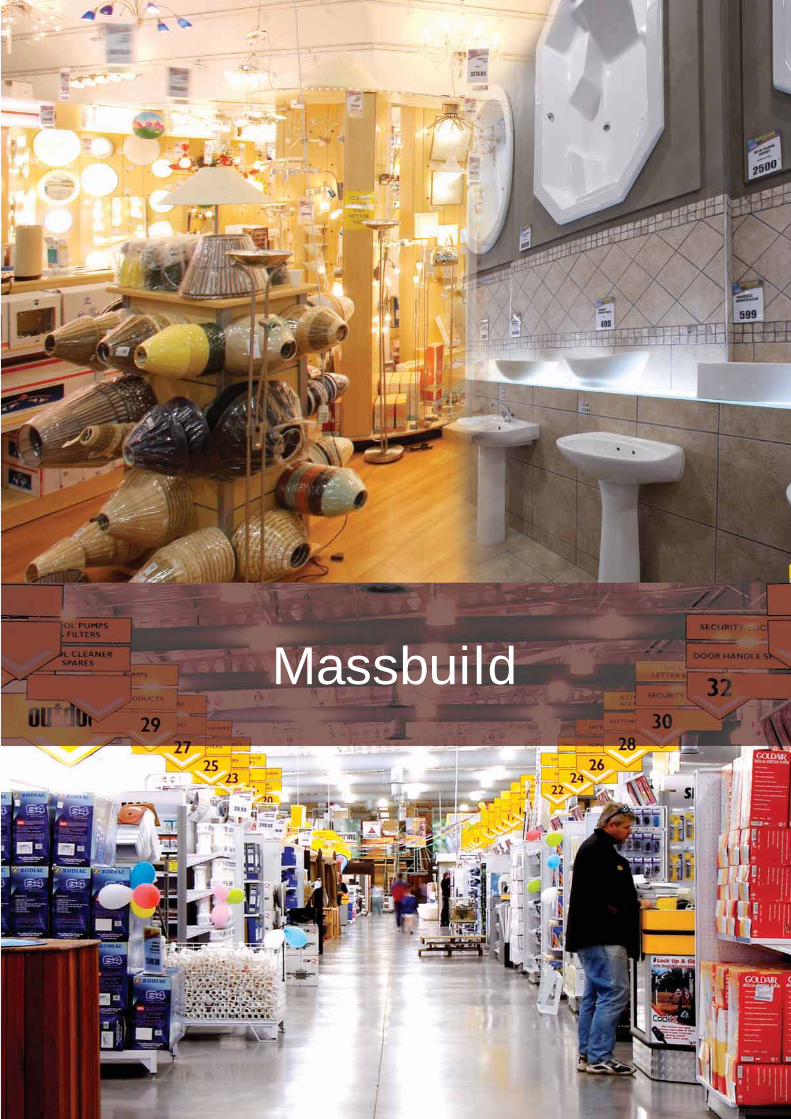
Massbuild

Divisional Review continued
59massmart annual report
OverviewMassbuild – comprises 65 outlets, trading in DIY, homeimprovement and builders hardware, under the BuildersWarehouse, Builders Express and Builders Trade Depotformat throughout South Africa. Divisional comparable storesales grew 12.9% with estimated inflation of 3.5%.
Following extensive analysis of the market and Massmart’sassets in home improvement, it was decided to rationalisethe five existing brands under one major brand “Builders”,trading through three distinctive specifically targeted retailformats, with the positioning of each sub-brand captured in itsby-line:
• “Builders Warehouse – Home Improvement A-Z”,comprising Builders Warehouse, Tile Warehouse andDe La Rey
• “Builders Express – Home and Garden Centre”,comprising Servistar; and
• “Builders Trade Depot – Building Material Supplies”,comprising Federated Timbers
The strategic rationale for doing this, the precise marketpositioning of the formats and the optimum national footprint,were clarified in a strategy that will dictate the direction of thedivision for the next three to five years.
Massmart’s early impact on the acquired businesses and theopening of four new Builders Warehouse outlets enabled thedivision to register the Group’s highest levels of sales growth,comparable sales growth and profit growth, although thelatter was depressed by costs associated with enhancedmanagerial structures, integration, systems and new stores.
Massbuild’s trading profit return on sales of 7.5% comparesto its medium-term target of 8% and its internationalbenchmark of 10%.
ProspectsThe aggressive growth plans are on target to create a nationalfootprint of unique home improvement and building supplystores, under the “Builders” brand, executed through threefocused and complementary formats. This growth will beunderpinned by driving stronger management skills deeperinto the organisation and significantly improving systems,training and logistics.
The division is currently rolling out the new Builders livery toall its stores. In the current financial year, De La Rey will berebranded and incorporated into the Builders Warehousechain, and Servistar and Federated Timbers will be rebrandedas Builders Express and Builders Trade Depot respectively.
• Acquisitions boost sales to almost R4 billion, up by 158%
• Profit before tax of R297 million,up by 99%
• Six stores opened in BuildersWarehouse and De La Rey
• Total trading space of 318 691 m2
MassbuildMassbuild comprises three Chains of65 stores, currently trading as BuildersWarehouse (20 stores), Builders Express(14 stores) and Builders Trade Depot(31 stores). These Chains focus on homeimprovement trading in decorativehardware, tools, sanitaryware, buildershardware, tiles and garden services,throughout South Africa.
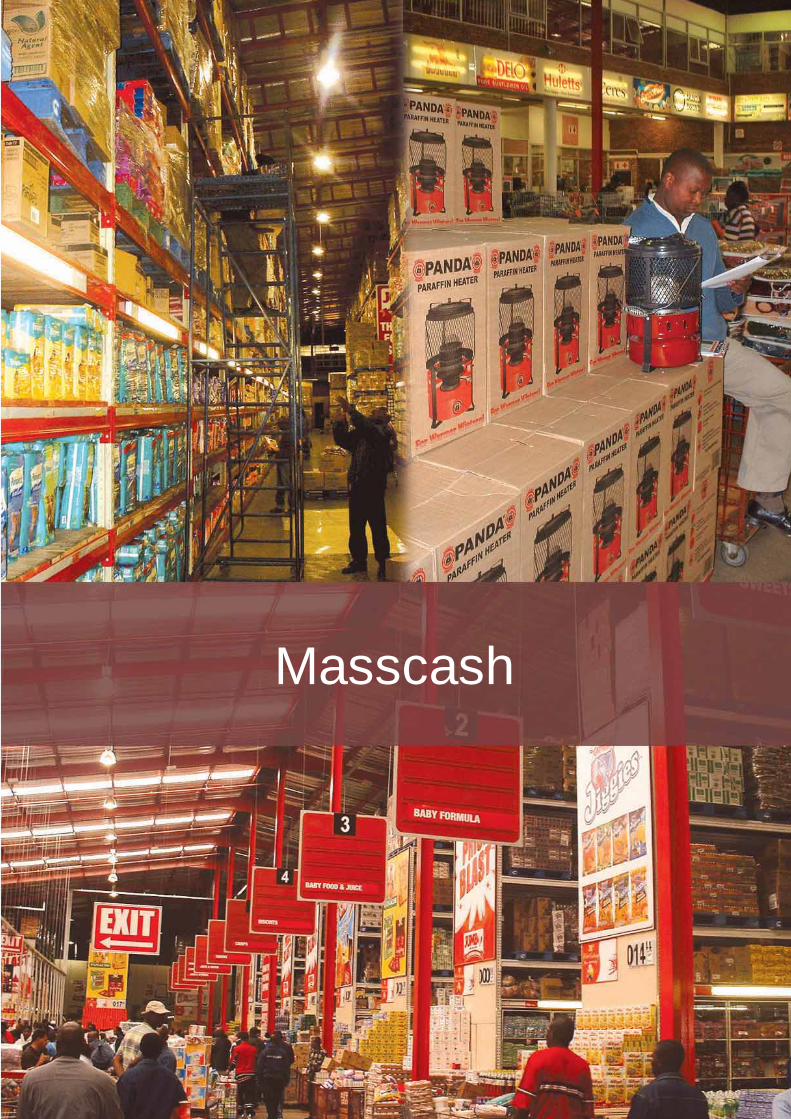
Masscash

Divisional Review continued
61massmart annual report
OverviewMasscash comprises 62 CBW and seven Jumbo wholesalecash and carry outlets trading in South Africa, Lesotho,Namibia, and Botswana, and voluntary buying organisationShield (serving 478 independent food outlets). Divisionalcomparable store sales grew by 8.8% with estimated inflationof 4.3%.
Increasing inflation in the second half, more coordinatedpurchasing and tight control of expenses, enabled CBW toproduce an excellent result with profit growth over twice itsdouble digit sales growth and profitability in excess of thedivisional return on sales target.
The further imposition of Massmart’s management structuresand processes in Jumbo and the re-launch of the flagshipCrown Mines store in late February contributed to animproved second half performance, although full year profitswere depressed by the investment in store development andprofessional management structures and processesnecessary for the repositioning of the chain.
The focus in Shield remained on the preservation of assetsand the implementation of the processes and controlsnecessary to mitigate risk. While depressing sales growth,this approach continued to result in an improvement in thestate of the short-term debtor’s book.
Given the potential conflict of the roll-out of smaller Gamestores with the customers of Furnex, the latter was disposedof with effect from 1 March 2006.
Masscash’s trading profit return on sales of 2.2% compares withits medium-term target and its international benchmark of 3%.
Divisional prospectsIn CBW the alignment of expenses and product inflation levelswill result in a solid trading performance in the currentfinancial year. The benefits realised in the second half of the2006 financial year from the margin and cost initiatives willcontinue and return CBW's performance to its historicallevels of profitability.
At Jumbo, with its restructured store base and significantlystrengthened management team, sustained and profitablesales growth is expected. This, coupled with trading marginimprovements and better cost control, will result in improvedprofitability.
Shield will continue to focus on higher quality sales and costcontrol, whilst improving the quality of its service offering toits customers.
MasscashThis Chain comprises 62 CBW and
seven Jumbo wholesale cash and carry
outlets, trading in South Africa, Lesotho,
Namibia and Botswana, and Shield, a
voluntary buying organisation serving
478 independent food outlets.
Whilst the division remains focused primarily on growth fromits current wholesale food and grocery assets, the return of anormalised inflation environment, coupled with the benefitsresulting from improved management strength and focusshould result in the division nearing its medium-term target of3% profit before tax return on sales.
• Sales exceed R10 billion andshow 6.6% real growth
• Profit before tax of R222 millionrecovers towards the medium-termtarget of 3.0%
• Improved margin management, costcontrol and working capital focus
• Furnex disposed of with effect from 1 March 2006
• Total trading space of 231 433 m2

Divisional Analysis
62massmart annual report
Net capital expenditure
36% – Massdiscounters10% – Masswarehouse32% – Massbuild22% – Masscash
Cash flow from operatingactivities
42% – Massdiscounters26% – Masswarehouse18% – Massbuild14% – Masscash
Number of stores
35% – Massdiscounters6% – Masswarehouse29% – Massbuild30% – Masscash
Sales
27% – Massdiscounters26% – Masswarehouse13% – Massbuild34% – Masscash
EBITA
41% – Massdiscounters22% – Masswarehouse22% – Massbuild15% – Masscash
Operating profit beforeinterest
41% – Massdiscounters22% – Masswarehouse22% – Massbuild15% – Masscash
Group1 Massdiscounters
2006 2005 % change 2006 2005 % change
Financial informationSales Rm 29 963.6 25 381.5 18.1 8 095.7 7 396.6 9.5EBITA Rm 1 333.5 992.3 34.4 546.4 466.4 17.2Operating profit before interest Rm 1 328.1 992.3 33.8 546.4 466.4 17.2
Inventories Rm 3 221.0 2 677.0 20.3 1 272.5 1 046.6 22.6Total assets Rm 9 618.4 8 133.2 18.3 3 265.8 2 588.1 26.2Total liabilities Rm 7 665.9 6 574.2 16.6 3 224.3 2 569.4 25.5
Net capital expenditure Rm 354.0 408.6 (13.4) 120.3 177.1 (32.1)
Cash flow from operating activities Rm 918.9 506.3 81.5 458.6 304.3 50.7
Operational informationNumber of stores 228 213 7.0 80 72 11.1Number of outlets served – – – – – –Trading area m2 992 855 877 878 13.1 322 291 297 407 8.4Number of employees 22 412 20 277 10.5 9 925 9 545 4.0
Operational statistics5
Sales per store (excluding Shield and Furnex) R000 122 509 143 122 (14.4) 101 196 102 731 (1.5)
Sales per outlet4 R000 – – – – – –Sales per m2 (excluding
Shield and Furnex) R000 28 32 (12.5) 25 25 –Sales per employee R000 1 337 1 421 (5.9) 816 775 5.3EBITA per employee R000 59 56 (5.4) 55 49 12.2
1. Group includes consolidation adjustments and head office figures.2. Masswarehouse now includes Makro Zimbabwe for both years as a result of IFRS. Details can be found in note 2 in the annual financial statements on pages 124 and 125.3. Massbuild includes Builders Warehouse, Federated Timbers, De La Rey and Servistar. For 2005 the one-month figures for Federated Timbers, De La Rey and Servistar,
acquired on 1 June 2005, have been excluded when calculating the operational statistics. The latter three chains are currently being rebranded to Builders TradeDepot, Builders Warehouse and Builders Express respectively.
4. Shield is shown as average sales to each independently owned outlet (ie this represents only a portion of the outlet's sales).5. The operational statistics have been calculated using year-end balance sheet figures.6. The 2005 results have been restated for IFRS and other adjustments. Details can be found in note 2 in the annual financial statements on pages 124 and 125.7. The above results exclude amounts relating to the discontinued operation (Furnex). Details can be found in note 3 in the annual financial statements on page 126.
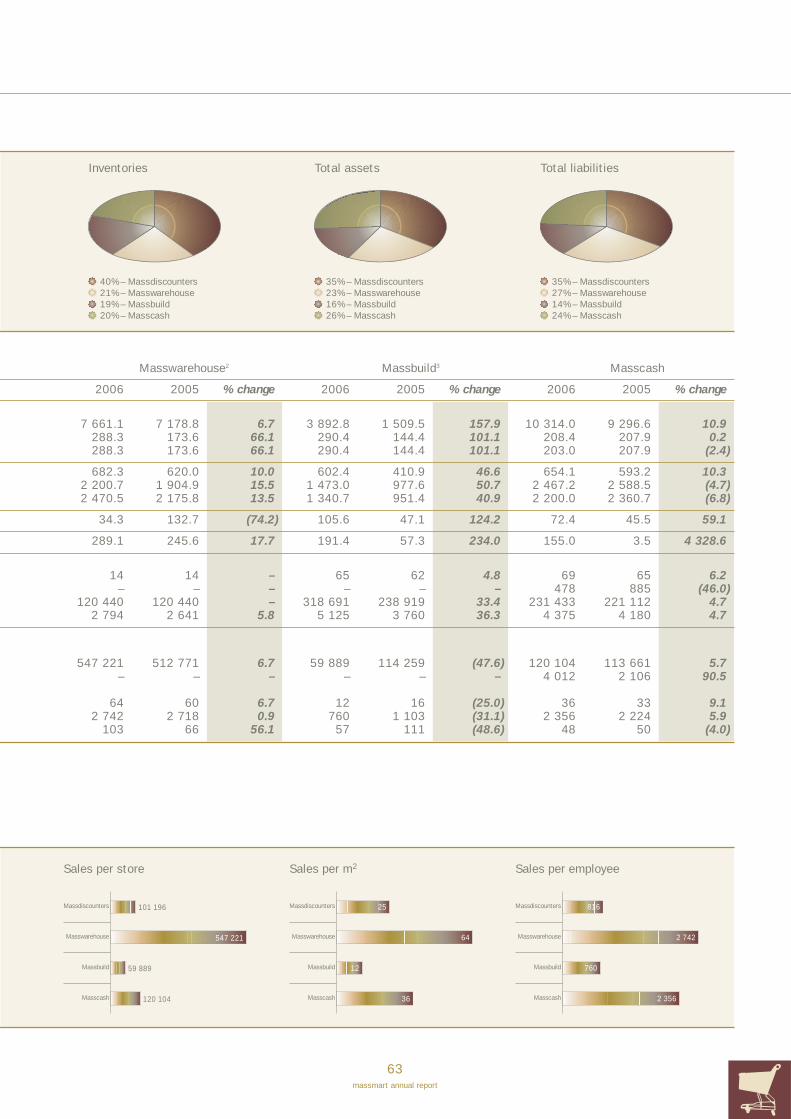
63massmart annual report
Sales per store
Massdiscounters
Masswarehouse
Massbuild
Masscash
101 196
547 221
59 889
120 104
Sales per m2
Massdiscounters
Masswarehouse
Massbuild
Masscash
25
64
12
36
Sales per employee
Massdiscounters
Masswarehouse
Massbuild
Masscash
816
2 742
760
2 356
Inventories
40% – Massdiscounters21% – Masswarehouse19% – Massbuild20% – Masscash
Total assets
35% – Massdiscounters23% – Masswarehouse16% – Massbuild26% – Masscash
Total liabilities
35% – Massdiscounters27% – Masswarehouse14% – Massbuild24% – Masscash
Masswarehouse2 Massbuild3 Masscash
2006 2005 % change 2006 2005 % change 2006 2005 % change
7 661.1 7 178.8 6.7 3 892.8 1 509.5 157.9 10 314.0 9 296.6 10.9288.3 173.6 66.1 290.4 144.4 101.1 208.4 207.9 0.2288.3 173.6 66.1 290.4 144.4 101.1 203.0 207.9 (2.4)
682.3 620.0 10.0 602.4 410.9 46.6 654.1 593.2 10.32 200.7 1 904.9 15.5 1 473.0 977.6 50.7 2 467.2 2 588.5 (4.7)2 470.5 2 175.8 13.5 1 340.7 951.4 40.9 2 200.0 2 360.7 (6.8)
34.3 132.7 (74.2) 105.6 47.1 124.2 72.4 45.5 59.1
289.1 245.6 17.7 191.4 57.3 234.0 155.0 3.5 4 328.6
14 14 – 65 62 4.8 69 65 6.2– – – – – – 478 885 (46.0)
120 440 120 440 – 318 691 238 919 33.4 231 433 221 112 4.72 794 2 641 5.8 5 125 3 760 36.3 4 375 4 180 4.7
547 221 512 771 6.7 59 889 114 259 (47.6) 120 104 113 661 5.7– – – – – – 4 012 2 106 90.5
64 60 6.7 12 16 (25.0) 36 33 9.12 742 2 718 0.9 760 1 103 (31.1) 2 356 2 224 5.9
103 66 56.1 57 111 (48.6) 48 50 (4.0)
Channel Collaboration Review
64massmart annual report
We believe that meaningful and extensive collaborationbetween the four divisions makes the value of the MassmartGroup greater than the sum of its parts. This collaboration,through our Forums, continues to gain momentum within theGroup and has recently been further emphasised with theappointment of a new executive to the Group ExecutiveCommittee to focus exclusively on further value creationthrough collaboration across the Divisions.
All Forums operate under four broad headings:
• Achieving synergies through shared profit opportunitiesand the reduction of costs;
• Peer reviews of performance and adherence to goodstandards across the divisions;
• Ensuring compliance to legislation and good standards;and lastly
• Shared learning through the measurement and review ofinternal performance, external market shares and thesharing of qualitative learnings between the divisions.
Trading ForumsThe trading Forums focus on the procurement and sale ofgoods through our divisions and stores. These currentlycomprise the Food & Liquor, General Merchandise, Cellularand Home Improvement Forums.
This year saw the participation in and contribution to theForums grow in maturity to make good progress in setting andachieving meaningful commercial objectives such as jointstrategic supplier reviews, internal product category reviewsand the implementation of shared private and exclusive labelstrategies across our Chains. The new Home ImprovementForum has seen the inclusion of the new Massbuildbusinesses in the collaborative Channel process to theadvantage of all involved.
The future focus is to tighten the objectives and measuredoutputs of these Forums within a common Massmart Channelframework and continue to drive the Forum activities withrespect to joint planning with our suppliers, better internalcoordination of product category strategies and theprofessional management of our private and exclusive labels.
Functional ForumsIn contrast to the trading Forums, the functional Forumsprimarily focus their attention on the procurement andmanagement of common essential resources and servicesrequired by the divisions in support of their trading activities.This activity occurs under the four main areas highlighted above.Contributing to this have been the Technology, Information andProcess (TIP) and the Human Resources Forums.
Important work has been done in both Forums this year. TheHuman Resources forum has facilitated a group-wide responseto Aids and HIV within Massmart. Group-wide voluntarycounselling and testing has been completed and is ongoing
with the business funding the appropriate treatment for HIV-positive employees, including the provision of antiretrovirals.
The Human Resources forum has also been an importantelement in the creation of a Group Training Service which willdeliver shared executive training and education focused onscarce retail skills, leadership development and the recruitmentand development of equity graduates into the Group.
The Technology, Information and Process forum implementedan aggressive peer review role this year to ensure thatIT projects above a certain level of cost and risk had anelement of Group oversight. This resulted in the halting of onelarge divisional project that showed early signs of impacting thebusiness negatively. This Forum has also driven negotiationswith Group telecommunications providers to substantiallyreduce the costs of these services as well as reducing the costof print consumables through joint procurement.
Shared service departmentsWhere it is possible to provide a service to the Chains at alower cost than they could obtain individually, directly orthrough a third party, a shared service structure is maintained.
We currently have nine shared services, being: Internal Audit;Supplier Contract Negotiation and Administration;International Commerce; Company Secretarial; EmployeeBenefits; Group Tax and Treasury; Corporate Affairs; BusinessIntelligence and Group Training.
Group Training is a new service which has been born out ofan overwhelming need for shared training and development inspecific areas of retail skills such as planning, buying, storemanagement and business process analysts. This functionwill also promote a joint approach to leadership developmentbelow the executive level and commit resources to therecruitment of high potential equity graduates into Massmartto develop them towards a career in retail.
We believe that meaningfuland extensivecollaboration betweenthe four divisions makesthe value of the MassmartGroup greater than the sumof its parts


About this Report
66massmart annual report
Mas
smar
tS
usta
inab
ilit
y R
epor
t 20
06
This is Massmart’s third sustainability report whichcontinues the established trend of improving the content,scope and structure of our reporting, utilising facilitatedinternal and external stakeholder feedback. A notableinnovation in deriving such feedback was the use of focusgroups to assess stakeholder responses to a full “mock-up” of this report prior to its publication.
We have extended the scope of our previous report,published in November 2005, by incorporating thefollowing new elements into the current report:
• Sustainability scorecard that provides a consolidated view of the Key Performance Areas (KPAs) that we track .............................68 – 72
• Internal Audit statement verifying the accuracy of the sustainability scorecard ................................68
• Sustainability risk assessment that provides a consolidated description of key sustainability risks and our response to those risks .............74 – 75
• Sustainability performance review that provides a consolidated assessment of the extent to which we achieved the objectives described in our previous report.....................................76 – 79
• Additional case studies that provide a “feel” for our operational approach to sustainability issues.........81, 86 – 87, 91, 93, 95, 97
We are hopeful that the incorporation of these elements hasresulted in the creation of a more informative and readerfriendly report that presents a fair perspective of Massmart’ssustainability practice for the year ended June 2006.
Should you, the reader, wish to provide Massmart withfeedback concerning this report then, forward your views [email protected].
Sustainability philosophy
Whilst our understanding of good sustainability practicehas, and continues to improve, our overall philosophyremains consistent with the view expressed in our lastsustainability report. This view defines sustainablebusiness practice as “A business approach to create long-term shareholder value by embracing opportunities andmanaging risks deriving from economic, environment andsocial developments”.
In practical terms we have first-hand experience of thepositive impact that considered sustainability practice hason stakeholder relationships. This is manifest throughfactors such as better staff productivity and greatercredibility in interactions with regulatory and governmentauthorities.
We are also appreciative of the operational efficiencies thatmay, for example, be achieved through reducing storeenergy consumption or eliminating packaging waste in thesupply chain.
This experience reinforces our belief that goodsustainability practice equates to responsible businesspractice, and that well-managed companies are motivatedto act responsibly.
Stakeholder engagement
Massmart is committed to engagement with ourstakeholders to promote constructive dialogue aboutissues of mutual interest.
These stakeholders include our customers, employees,investors and suppliers, as well as Government, communitygroups, media, non-governmental organisations (NGOs),the Consumer Goods Council of South Africa (CGCSA),legislators and regulators.
We prioritised stakeholder engagement as an importantsustainability area during the year in review. This resultedin a number of notable achievements that included:
• Appointing a public relations advisor to improve the quality and frequency of engagement with external and internal stakeholders
• Launching a quarterly group news magazine that is distributed to staff, strategic suppliers and other selected external stakeholders
• Launching quarterly “round table discussions” with primarily external stakeholders to discuss issues of mutual concern, such as the role andexpectations of corporates in job creation
• Simplifying and re-formulating the Massmart Supplier Perceptions survey to enable more frequent administration
• Establishing closer relationships with organisations representing black entrepreneurs such as the National Industrial Chamber (NIC)

67massmart annual report
• Participating in numerous workshops hosted by Empowerdex and designed to gauge the response of business to the codes of good practice on Broad-based Black Economic Empowerment (BBBEE)
• Establishing a collaborative relationship with the Gauteng Education Department’s Policy Planning Unit to improve our understanding of the educational needs that underpin Massmart’s Corporate Social Investment (CSI) focus
• Making formal submissions to the Department of Trade and Industry on the second draft codes of good practice on BBBEE and the Consumer Protection Bill
• Collaborating with the South African Institute of Ethics, at their request, to prepare an ethics case study for the United Nations
• Voluntary participation in various surveys designed to share knowledge about corporate practice in a variety of sustainability areas such as BBBEE
In all of these instances this engagement was motivated by acommitment to share more information about the Group orto improve our understanding of the expectations of othersin order to promote more regular and better informedstakeholder dialogue.
Stakeholder engagement activities
Our relationships with stakeholders are informed by ourendorsement of various externally developed guidelines thatinclude the:
• Global Reporting Initiatives (GRI) sustainability reporting guidelines
• Universal Declaration of Human Rights
• Charters of the International Labour Organisation
In most instances these guidelines are codified in therelevant Massmart policy documents.
Stakeholder Form ofgroup engagement
Investors and Regular local and international shareholders meetings and briefings, bi-annual
results announcements, threetrading updates, annual generalmeeting, annual report, SENSannouncements, Massmart web-site and compliance with statutorydisclosure requirements.
Employees Regular staff meetings andbriefings, performance review andcounselling process, “FiresideChats” for career planning of seniormanagement, adherence to opendoor policy, group-wide admini-stration of Deloitte Best Companyto Work For survey, administrationof chain specific surveys andMassmart Ethics Line.
Customers Print and electronic advertisingcampaigns, face-to-face inter-action in stores, landscape marketsurveys, customer focus groups,in-store customer satisfactionsurveys, chain specific customerservice toll free lines, MassmartCorporate and Chain websites.
Community Store-based and Massmart Grouplevel meetings with communityleaders and associations,Corporate Social Investmentpartnering and employeevolunteerism.
Suppliers Regular chain specific suppliermeetings, annual and bi-annualMassmart Group meetings,strategic planning workshops,one-on-one CEO and seniorexecutive meetings, SupplierRelationship Surveys andMassmart Ethics Line.
Industry and Active participation in organisationsbusiness groupings such as Consumer Goods Council
of South Africa,Retailers Association,Retail Liaison Committee andBusiness Against Crime.
Government Lodging formal submissions in response to draft and/orestablished legislation, meetingwith national, provincial and localgovernment representatives andquarterly round table discussions.
Non-governmental Direct engagement on issues of organisations mutual interest, social develop-
ment collaboration and support,meetings and conferenceattendance.
Media Participation in media surveys,interviews, press releases anddirect engagement on topical/public interest issues.
The following table provides a comprehensive profile ofMassmart’s stakeholder engagement activities.

Sustainability Scorecard
68massmart annual report
Mas
smar
tS
usta
inab
ilit
y R
epor
t 20
06
The Massmart Internal Audit department conducted areview of the data reported in the preliminary and finalSustainability Scorecards. The review was conducted interms of assurance standards and entailed theverification of the authenticity of data presented againstinternal and external source documents. All significantreported internal audit findings have been satisfactorilyaddressed through Scorecard amendments. On thisbasis we are satisfied to report that the data presentedin the reported Scorecard fairly represents the positionof Massmart’s Sustainability performance for thefinancial year ending June 2006.
JSE Limited socially responsibleinvestment index (SRI)scorecard
Sustainability report verificationstatement
Massmart’s SRI score of 181 points significantlyexceeds the JSE Limited’s baseline score of78 points. We are, as the result of changes to theSRI scoring protocols, unable to provide meaningfulcomparative data for the financial year endedJune 2005.
Score JSESustainability indicator 2006 baseline
Governance 44 16Social
sustainability 54 25Economic
sustainability 35 21Environmental
sustainability 48 16
Total 181 78

69massmart annual report
Economic value-added statement
Massmart’s economic value added contributionincreased by R1 330 million from R6 029 million for thefinancial year ended June 2005, to R7 359 millionfor the financial year ended June 2006.
Estimated broad-based blackeconomic empowerment (BBBEE)scorecard
Massmart’s estimated BBBEE score has improved by6% from 41.5% to 47.5%. This improvement isattributable to the Thuthukani staff empowermenttransaction. We anticipate a negative impact on ourBBBEE score if the Draft Codes of Good Practice aregazetted in their existing form.
Note: BBBEE score is, with the exception of ownership, derived from theFinancial Mail’s 2005 Top Empowerment Companies Survey.
Not
reported
in
2005
+ = comparative increase relative to 2005– = comparative decrease relative to 2005
2006June Comparison
Sustainability indicator Rm 2005
Sales, royalties,franchise fees, rentals,management, and administrationfees (inclusive of VAT) 34 196.2 +15.4%
Cost of sales (25 112.4) +13.5%Interest and
investment income 102.8 +3.4%Net costs of services
and other operating expenses (1 827.8) +15.6%
Value added 7 358.8 +22.1%
Applied as follows:
To employees as salaries, wages and other benefits 2 088.1 +24.9%
To Government astaxation 4 117.5 +16.2%
To shareholders as dividends 402.8 +82.2%
To lenders as interest 96.5 +32.6%Depreciation and
amortisation 203.5 +28.4%Minorities 24.7 +929.2%Net earnings retained 425.7 +18.6%
Total 7 358.8 +22.1%
Estimates ComparisonSustainability indicator 2006 2005
Ownership 6%Management control –Employment equity 6.5%Skills development 10%Preferential
procurement 5.1%Enterprise
development 10%Residual 9.9%
Total 47.5%
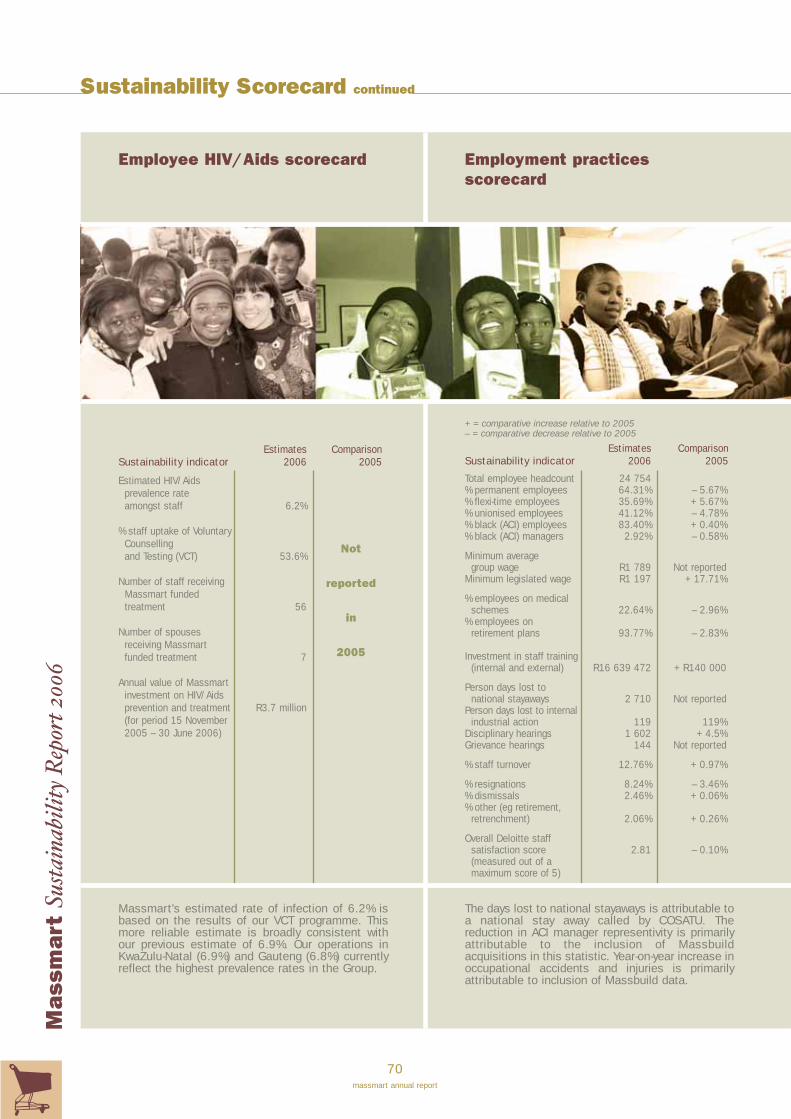
Sustainability Scorecard continued
70massmart annual report
Mas
smar
tS
usta
inab
ilit
y R
epor
t 20
06
Employee HIV/Aids scorecard Employment practicesscorecard
Massmart’s estimated rate of infection of 6.2% isbased on the results of our VCT programme. Thismore reliable estimate is broadly consistent withour previous estimate of 6.9%. Our operations inKwaZulu-Natal (6.9%) and Gauteng (6.8%) currentlyreflect the highest prevalence rates in the Group.
The days lost to national stayaways is attributable toa national stay away called by COSATU. Thereduction in ACI manager representivity is primarilyattributable to the inclusion of Massbuildacquisitions in this statistic. Year-on-year increase inoccupational accidents and injuries is primarilyattributable to inclusion of Massbuild data.
Not
reported
in
2005
Estimates ComparisonSustainability indicator 2006 2005
Estimated HIV/Aids prevalence rate amongst staff 6.2%
% staff uptake of Voluntary Counsellingand Testing (VCT) 53.6%
Number of staff receiving Massmart funded treatment 56
Number of spouses receiving Massmart funded treatment 7
Annual value of Massmart investment on HIV/Aids prevention and treatment R3.7 million(for period 15 November 2005 – 30 June 2006)
+ = comparative increase relative to 2005– = comparative decrease relative to 2005
Estimates ComparisonSustainability indicator 2006 2005
Total employee headcount 24 754% permanent employees 64.31% – 5.67%% flexi-time employees 35.69% + 5.67%% unionised employees 41.12% – 4.78%% black (ACI) employees 83.40% + 0.40%% black (ACI) managers 2.92% – 0.58%
Minimum averagegroup wage R1 789 Not reported
Minimum legislated wage R1 197 + 17.71%
% employees on medical schemes 22.64% – 2.96%
% employees onretirement plans 93.77% – 2.83%
Investment in staff training(internal and external) R16 639 472 + R140 000
Person days lost to national stayaways 2 710 Not reported
Person days lost to internal industrial action 119 119%
Disciplinary hearings 1 602 + 4.5%Grievance hearings 144 Not reported
% staff turnover 12.76% + 0.97%
% resignations 8.24% – 3.46%% dismissals 2.46% + 0.06%% other (eg retirement,
retrenchment) 2.06% + 0.26%
Overall Deloitte staff satisfaction score 2.81 – 0.10%(measured out of a maximum score of 5)

71massmart annual report
Customer satisfaction scorecard
Customer perceptions were derived from an interceptsurvey conducted with 2 000 shoppers at Massmartstores nationally. This is a reformulated survey forwhich there is no directly comparable data for the yearended June 2005.
Supplier satisfaction scorecard
Supplier perceptions were derived from a surveyadministered to a sample representing 15% of suppliersthat account for approximately 60% of procurementspending. This is a reformulated survey for which thereis no directly comparable data for the year endedJune 2005.
Not
reported
in
2005
Not
reported
in
2005
+ = comparative increase relative to 2005– = comparative decrease relative to 2005
ComparisonSustainability indicator 2006 2005
Total number of listed merchandise suppliers 5 074
% favourable supplier perceptions of Massmart distribution channel efficiency 100%
% favourable supplier perceptions of Massmart stewardship of their brands 91%
% favourable supplier perceptions of Massmart responsiveness to market opportunities 97%
% favourable supplier perceptions of Massmart fairness in procurement negotiations 94%
% favourable supplier perceptions of Massmart ethics 100%
+ = comparative increase relative to 2005– = comparative decrease relative to 2005
ComparisonSustainability indicator 2006 2005
Total number of customer transactions 69 498 472
% Massmart shoppers who were able to make their planned purchasein Massmart stores 86%
% shoppers who were totally or quite satisfied with the shopping experience in Massmart stores 93%
% shoppers who indicatedthat they would repeat shopping at Massmart stores 98%
% customers who did not experience a problem that required further contact with the store 94%
% customers who were satisfied with the resolution to problems raised with the store 73%
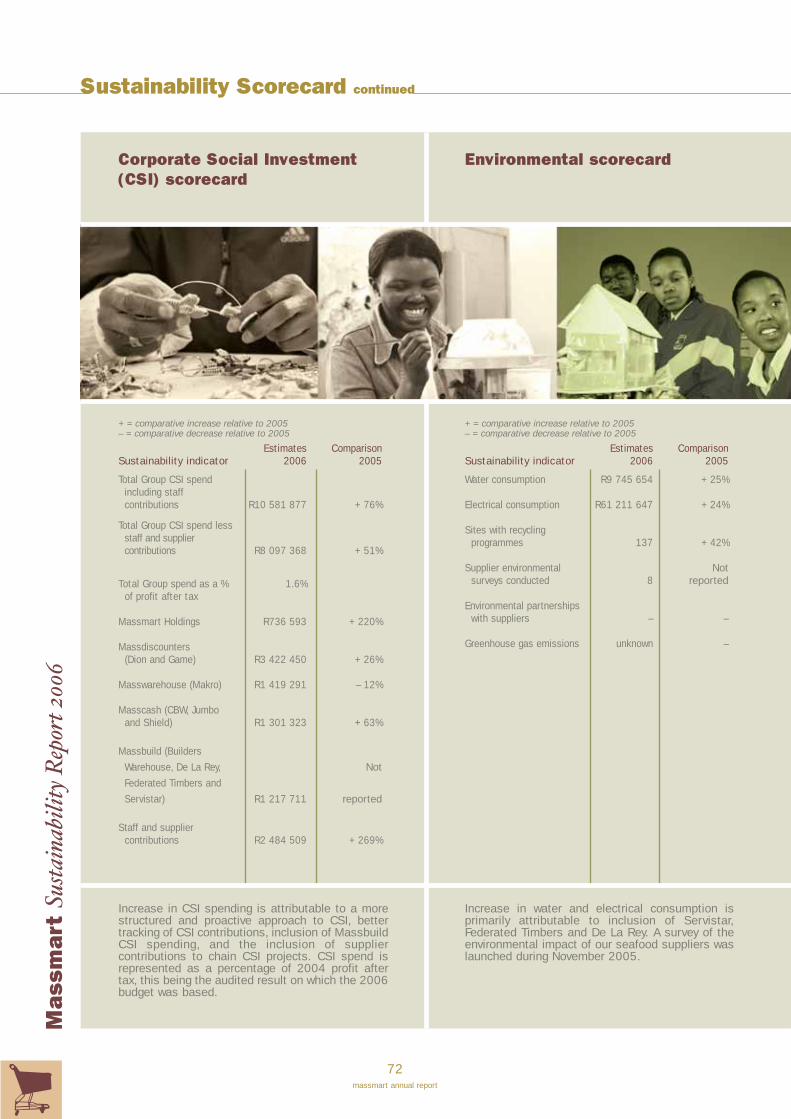
Sustainability Scorecard continued
72massmart annual report
Mas
smar
tS
usta
inab
ilit
y R
epor
t 20
06
Corporate Social Investment(CSI) scorecard
Environmental scorecard
Increase in CSI spending is attributable to a morestructured and proactive approach to CSI, bettertracking of CSI contributions, inclusion of MassbuildCSI spending, and the inclusion of suppliercontributions to chain CSI projects. CSI spend isrepresented as a percentage of 2004 profit aftertax, this being the audited result on which the 2006budget was based.
Increase in water and electrical consumption isprimarily attributable to inclusion of Servistar,Federated Timbers and De La Rey. A survey of theenvironmental impact of our seafood suppliers waslaunched during November 2005.
+ = comparative increase relative to 2005– = comparative decrease relative to 2005
Estimates ComparisonSustainability indicator 2006 2005
Water consumption R9 745 654 + 25%
Electrical consumption R61 211 647 + 24%
Sites with recycling programmes 137 + 42%
Supplier environmental Notsurveys conducted 8 reported
Environmental partnerships with suppliers – –
Greenhouse gas emissions unknown –
+ = comparative increase relative to 2005– = comparative decrease relative to 2005
Estimates ComparisonSustainability indicator 2006 2005
Total Group CSI spend including staff contributions R10 581 877 + 76%
Total Group CSI spend less staff and supplier contributions R8 097 368 + 51%
Total Group spend as a % 1.6%of profit after tax
Massmart Holdings R736 593 + 220%
Massdiscounters (Dion and Game) R3 422 450 + 26%
Masswarehouse (Makro) R1 419 291 – 12%
Masscash (CBW, Jumbo and Shield) R1 301 323 + 63%
Massbuild (Builders
Warehouse, De La Rey, Not
Federated Timbers and
Servistar) R1 217 711 reported
Staff and supplier contributions R2 484 509 + 269%

73massmart annual report
Massmart Internal Audit Service Verification Approach
Massmart Internal Audit Service (MIAS) responsibility
MIAS was asked to review the Massmart Sustainability information prior to its publication in the Massmart Annual Report in orderto provide assurance on its content. We are aware of the need to remain completely objective and understand that theSustainability Report contains various qualitative components that can be interpreted differently by the varying audiences andstakeholders. We have therefore only performed audit procedures on quantitative data presented to us on the MassmartSustainability Scorecard. The areas of review included:
• JSE Limited Socially Responsible Investment Index;• Economic Value Added Statement;• Estimated Broad-based Black Economic Empowerment Scorecard;• Employee HIV/Aids Scorecard;• Employment Practices Scorecard;• Customer Satisfaction Scorecard;• Supplier Satisfaction Scorecard;• Corporate Social Investment Scorecard; and • Environmental Scorecard.
Audit approachThere are no generally accepted auditing standards for the reporting or review process relating to sustainability performance.Recognising that both sustainability reporting and independent assurance of the reporting are continuously evolving, we developeda methodology that allowed us to comment on the accuracy of the quantitative data presented as at 23 July 2006. This informationwas subsequently amended, based upon MIAS feedback, during the week of 23 August 2006. Our verification sources by categorywere:
Scorecard category Primary data source
JSE Socially Responsible Index • JSE Limited and Trialogue
Economic value added statement • Audited financial statements
Estimated BBBEE Statement • Empowerdex Financial Mail Top Empowerment Companies• Survey and Cliffe Dekker legal opinion
Employee HIV/Aids • Alexander Forbes
Employment practices • Individual chain payroll downloads and audited chain• income statement• Manual records of chain information
Customer satisfaction • Douglas Parker and Associates Shopper Survey
Supplier satisfaction • Confirmation from chains• Massmart Supplier Perceptions Survey results
Corporate Social Investment • Confirmations from chains• Chain income statements
Environmental • SustBrands
Information generated was also evaluated for reasonableness based on Massmart Internal Audit’s knowledge and priorassessment of the varying operating systems.
Limitation of scopeThe following scope limitations were applicable:• Information such as disciplinary and grievance hearing statistics received from various operational sites were not subjected to
completeness testing;• Reliance has been placed on data provided by external sources such as Douglas Parker and Associates and Cliffe Dekker. No
work was performed in order to evaluate the accuracy of the information provided by external sources.
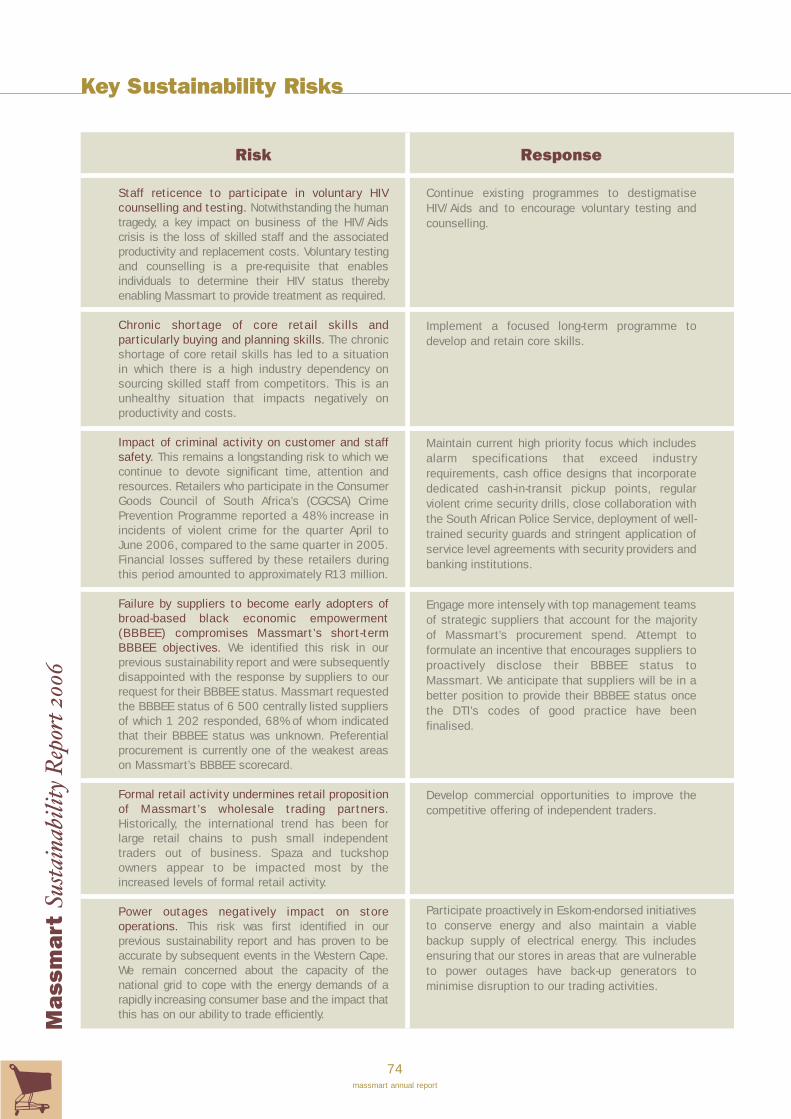
Key Sustainability Risks
74massmart annual report
Mas
smar
tS
usta
inab
ilit
y R
epor
t 20
06
Risk Response
Staff reticence to participate in voluntary HIVcounselling and testing. Notwithstanding the humantragedy, a key impact on business of the HIV/Aidscrisis is the loss of skilled staff and the associatedproductivity and replacement costs. Voluntary testingand counselling is a pre-requisite that enablesindividuals to determine their HIV status therebyenabling Massmart to provide treatment as required.
Chronic shortage of core retail skills andparticularly buying and planning skills. The chronicshortage of core retail skills has led to a situationin which there is a high industry dependency onsourcing skilled staff from competitors. This is anunhealthy situation that impacts negatively onproductivity and costs.
Impact of criminal activity on customer and staffsafety. This remains a longstanding risk to which wecontinue to devote significant time, attention andresources. Retailers who participate in the ConsumerGoods Council of South Africa’s (CGCSA) CrimePrevention Programme reported a 48% increase inincidents of violent crime for the quarter April toJune 2006, compared to the same quarter in 2005.Financial losses suffered by these retailers duringthis period amounted to approximately R13 million.
Failure by suppliers to become early adopters ofbroad-based black economic empowerment(BBBEE) compromises Massmart’s short-termBBBEE objectives. We identified this risk in ourprevious sustainability report and were subsequentlydisappointed with the response by suppliers to ourrequest for their BBBEE status. Massmart requestedthe BBBEE status of 6 500 centrally listed suppliersof which 1 202 responded, 68% of whom indicatedthat their BBBEE status was unknown. Preferentialprocurement is currently one of the weakest areason Massmart’s BBBEE scorecard.
Formal retail activity undermines retail propositionof Massmart’s wholesale trading partners.Historically, the international trend has been forlarge retail chains to push small independenttraders out of business. Spaza and tuckshopowners appear to be impacted most by theincreased levels of formal retail activity.
Power outages negatively impact on storeoperations. This risk was first identified in ourprevious sustainability report and has proven to beaccurate by subsequent events in the Western Cape.We remain concerned about the capacity of thenational grid to cope with the energy demands of arapidly increasing consumer base and the impact thatthis has on our ability to trade efficiently.
Continue existing programmes to destigmatiseHIV/Aids and to encourage voluntary testing andcounselling.
Implement a focused long-term programme todevelop and retain core skills.
Maintain current high priority focus which includesalarm specifications that exceed industryrequirements, cash office designs that incorporatededicated cash-in-transit pickup points, regularviolent crime security drills, close collaboration withthe South African Police Service, deployment of well-trained security guards and stringent application ofservice level agreements with security providers andbanking institutions.
Engage more intensely with top management teamsof strategic suppliers that account for the majorityof Massmart’s procurement spend. Attempt toformulate an incentive that encourages suppliers toproactively disclose their BBBEE status toMassmart. We anticipate that suppliers will be in abetter position to provide their BBBEE status oncethe DTI’s codes of good practice have beenfinalised.
Develop commercial opportunities to improve thecompetitive offering of independent traders.
Participate proactively in Eskom-endorsed initiativesto conserve energy and also maintain a viablebackup supply of electrical energy. This includesensuring that our stores in areas that are vulnerableto power outages have back-up generators tominimise disruption to our trading activities.

75massmart annual report
Disappointments
Whilst we are, in broad terms, satisfied with our sustainability performance, we are disappointed by insufficient progress in anumber of areas.
• We have devoted considerable attention to opening our procurement activities to emerging black start-up suppliers. This hasincluded attempts to establish collaborative relationships with the National African Federated Chamber of Commerce(NAFCOC), Ithala Development Finance Corporation Limited and National Industrial Chamber (NIC). Despite these efforts wehave made indifferent progress toward entering into meaningful supply transactions with emerging black start-up suppliers.
• We continue to increase our financial investment in human capital, which has included a recent decision to provide free anti-retroviral treatment to permanent staff and their spouses. We were therefore disappointed to note that the Group’s grand meanscore on the Deloitte Best Company to Work for Survey declined from 2.91 out of a maximum score of 5 in the 2004 calendaryear to 2.81 in the 2005 calendar year. Although the decline was relatively modest, it occurred at a time when we wereoptimistic of improving upon our previous score.
• Our efforts to increase representation of Previously Disadvantaged Individuals to transform our workforce, particularly at seniorand top management levels, have failed to meet our expectations.
• Corporate Social Investment activities are generally difficult to focus in a way that delivers both social development andorganisational benefits. Although Massmart’s CSI focus has undergone significant improvement we remain concerned aboutthe continued incidence of ad hoc CSI initiatives that deliver sub-optimal developmental and organisational benefits.
• Our environmental efforts have grown in scope and sophistication to include focusing on supply chain impacts. In addition theemphasis that the Group places on environmental issues has increased significantly. However, our progress in implementingidentified energy saving and waste recycling opportunities has been slower than anticipated.
Insufficient information about supply chain eco-efficiency and supplier ability to respondconstructively to environmental activism. It is ourperspective that we have insufficient understanding ofthe impact that our suppliers operational activitieshave on the environment. This includes their approachto water and energy conservation, waste reduction,responsible use of man-made chemicals andresponsible product packaging. We are mindful thatany non-compliant environmental activity by oursuppliers is harmful to the planet and potentiallydamaging to Massmart’s reputation.
Insufficient understanding of the potential impact ofincreasingly stressed water resources onMassmart’s supply chain. It is our perspective that wehave insufficient understanding of the impact oflimited water resources on socio-economicdevelopment. South Africa is a semi-arid country withstressed freshwater resources that are almost fullyutilised. There is a widely held view that factors suchas climate change, rapid population growth andeconomic development will result in insufficient waterresources to meet South Africa’s domestic,agricultural and industrial needs.
Appoint an environmental scientist to identify strategicsuppliers with high environmental impact andintroduce a process to reliably survey theirenvironmental practices. This will include initiatingappropriate action where supplier practices are foundto be wanting.
Access the comprehensive data that is alreadyavailable on this subject and develop an informedperspective of the potential implications forMassmart.
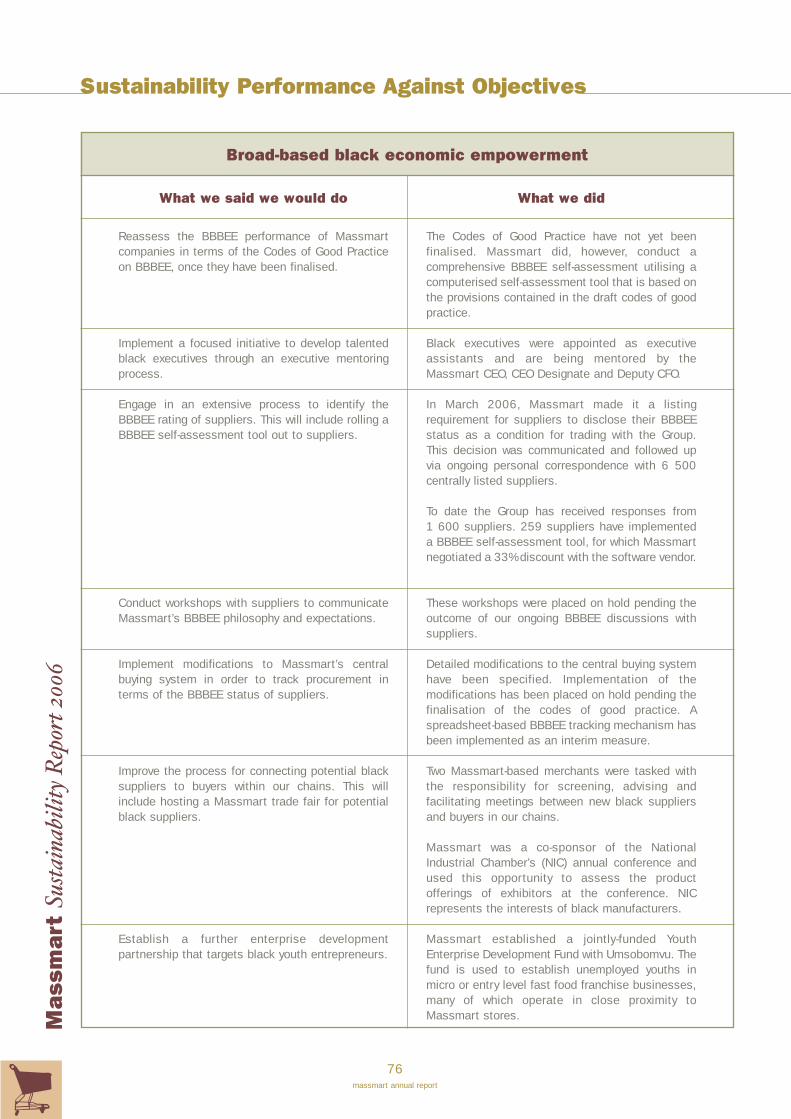
Sustainability Performance Against Objectives
76massmart annual report
Mas
smar
tS
usta
inab
ilit
y R
epor
t 20
06
What we said we would do What we did
Broad-based black economic empowerment
Reassess the BBBEE performance of Massmartcompanies in terms of the Codes of Good Practiceon BBBEE, once they have been finalised.
Implement a focused initiative to develop talentedblack executives through an executive mentoringprocess.
Engage in an extensive process to identify theBBBEE rating of suppliers. This will include rolling aBBBEE self-assessment tool out to suppliers.
Conduct workshops with suppliers to communicateMassmart’s BBBEE philosophy and expectations.
Implement modifications to Massmart’s centralbuying system in order to track procurement interms of the BBBEE status of suppliers.
Improve the process for connecting potential blacksuppliers to buyers within our chains. This willinclude hosting a Massmart trade fair for potentialblack suppliers.
Establish a further enterprise developmentpartnership that targets black youth entrepreneurs.
The Codes of Good Practice have not yet beenfinalised. Massmart did, however, conduct acomprehensive BBBEE self-assessment utilising acomputerised self-assessment tool that is based onthe provisions contained in the draft codes of goodpractice.
Black executives were appointed as executiveassistants and are being mentored by theMassmart CEO, CEO Designate and Deputy CFO.
In March 2006, Massmart made it a listingrequirement for suppliers to disclose their BBBEEstatus as a condition for trading with the Group.This decision was communicated and followed upvia ongoing personal correspondence with 6 500centrally listed suppliers.
To date the Group has received responses from1 600 suppliers. 259 suppliers have implementeda BBBEE self-assessment tool, for which Massmartnegotiated a 33% discount with the software vendor.
These workshops were placed on hold pending theoutcome of our ongoing BBBEE discussions withsuppliers.
Detailed modifications to the central buying systemhave been specified. Implementation of themodifications has been placed on hold pending thefinalisation of the codes of good practice. Aspreadsheet-based BBBEE tracking mechanism hasbeen implemented as an interim measure.
Two Massmart-based merchants were tasked withthe responsibility for screening, advising andfacilitating meetings between new black suppliersand buyers in our chains.
Massmart was a co-sponsor of the NationalIndustrial Chamber’s (NIC) annual conference andused this opportunity to assess the productofferings of exhibitors at the conference. NICrepresents the interests of black manufacturers.
Massmart established a jointly-funded YouthEnterprise Development Fund with Umsobomvu. Thefund is used to establish unemployed youths inmicro or entry level fast food franchise businesses,many of which operate in close proximity toMassmart stores.
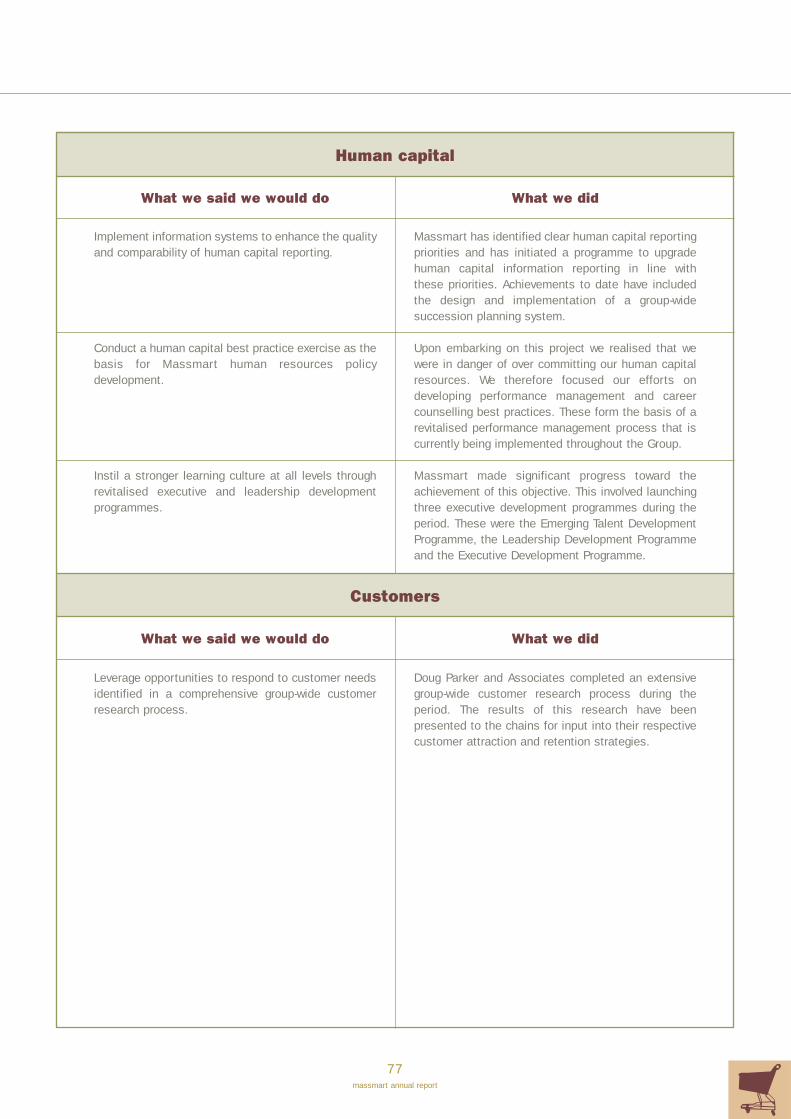
77massmart annual report
Implement information systems to enhance the qualityand comparability of human capital reporting.
Conduct a human capital best practice exercise as thebasis for Massmart human resources policydevelopment.
Instil a stronger learning culture at all levels throughrevitalised executive and leadership developmentprogrammes.
Massmart has identified clear human capital reportingpriorities and has initiated a programme to upgradehuman capital information reporting in line withthese priorities. Achievements to date have includedthe design and implementation of a group-widesuccession planning system.
Upon embarking on this project we realised that wewere in danger of over committing our human capitalresources. We therefore focused our efforts ondeveloping performance management and careercounselling best practices. These form the basis of arevitalised performance management process that iscurrently being implemented throughout the Group.
Massmart made significant progress toward theachievement of this objective. This involved launchingthree executive development programmes during theperiod. These were the Emerging Talent DevelopmentProgramme, the Leadership Development Programmeand the Executive Development Programme.
Human capital
What we said we would do What we did
Customers
What we said we would do What we did
Leverage opportunities to respond to customer needsidentified in a comprehensive group-wide customerresearch process.
Doug Parker and Associates completed an extensivegroup-wide customer research process during theperiod. The results of this research have beenpresented to the chains for input into their respectivecustomer attraction and retention strategies.

Sustainability Performance Against Objectives continued
78massmart annual report
Mas
smar
tS
usta
inab
ilit
y R
epor
t 20
06
What we said we would do What we did
Suppliers
Corporate social investment
What we said we would do What we did
Verify supplier perceptions of Massmart’sdistribution strategies and their associatedbenefits.
Engage more closely with our suppliers regardingtheir awareness of and commitment to BBBEE.
Improve our targeting of beneficiaries to providegreater support to the poorest of the poor.
Achieve better coordination of Group CSI activities.
Leverage existing expertise to meet those needswhere we can apply our core expertise in theinterests of social development.
Promote a spirit of volunteerism within theorganisation by providing employees withopportunity to contribute time, effort and money tosocial causes.
Although this topic was covered usefully in variouschain and Group-led meetings with key suppliers, wedid not implement the coordinated process that hadbeen envisaged.
Massmart sent three different notes to suppliersdescribing our perspective of BBBEE and alsorequesting clarity about their position on theissue. These notes were supplemented bythe establishment of an e-mail helpline,[email protected], to which suppliers coulddirect BBBEE enquiries.
Significant success was achieved in this area withthe majority of CSI support going to beneficiaries inthe poorest of the poor communities. The MakroExcellence in Education Award is an excellentexample of this refocused approach.
Progress against this objective has been modest.Game, Dion and Makro entered into joint CSI projectsat two schools. Whilst Game, Dion and Shieldcollaborated in a project at the Twilight Children’sshelter. Massmart Holdings and Jumbo Cash andCarry partnered on the Entuthukweni Training and JobCreation Project. These partnerships represent amarked improvement on the efforts of previous years.
Whilst we have explored opportunities to leverage ourcore expertise in the interests of social developmentwe have as yet been unable to conceptualise asuitable social development project in this area.
In July 2005 Massdiscounters launched aprogramme to facilitate and recognise employeevolunteerism. This programme served as a pilot forthe Group and provides the basis for group-widepolicy on employee volunteerism.
The Massdiscounters employee volunteerism policypack was rolled out to all chains in March 2006 forchain specific customisation and implementation.The policy has, to date, been implemented atMassmart Holdings and Feds.

79massmart annual report
Environmental
What we said we would do What we did
Further achievements
Further to our performance against the aforementioned objectives Massmart also delivered against a number of additionalobjectives. These included:
• Establishing a Sustainability Committee, which operates as a committee of the Massmart Board and has oversightresponsibility for sustainability practice in the Group;
• Launching a sustainability workshop programme with the objective of improving senior management’s understanding ofsustainability issues;
• Launching a group-wide news magazine to improve communication with staff, strategic suppliers and selected externalstakeholders; and
• Conducting a survey of the environmental practices of suppliers of fish and shellfish products.
A greater awareness of the need for environmentalreporting has been created and currently reported datais considerably easier to access. We have, however,made disappointing progress in extending the scope ofdata for environmental reporting purposes.
The Massmart Internal Audit department hasdeveloped a store Environmental Audit plan.
Whilst Massmart’s chains are sharing moreinformation, under Makro’s leadership, about theirenvironmental practices we have been unable toderive comparable eco-efficiency benchmarks.
Makro, which sets the pace in terms of environmentalpractice in the Group is currently trialling a process toidentify opportunities for assessing the eco-efficiency ofrefrigeration and air conditioning systems.
External consultants conducted lighting efficiency auditsat sites in these chains and at Massmart’s HoldingsHead Office.
The implementation of recycling programmes is anongoing initiative. Recycling programmes are active at153 Massmart sites versus the 96 sites with recyclingprogrammes that were reported in our 2005sustainability report.
Massmart engaged an environmental consultant toadvise the Group on opportunities to play a greaterenvironmental advocacy role with suppliers. Thisresulted in our conducting a survey of the marineharvesting and aqua-culture practices of Massmartfish and shellfish suppliers.
Enhance group-wide environmental reporting toincrease comparability across the Group.
Reinforce the environmental compliance focus in Auditplans.
Formulate group-wide eco-efficiency benchmarks.
Expand the energy efficiency opportunity assessmentto cover air conditioning and refrigeration systems.
Conduct an energy saving opportunity assessment atBuilders Warehouse, Jumbo Cash and Carry and theMassmart Corporate head office.
Implement recycling programmes at sites that do notcurrently have such programmes and extend recyclingreporting to cover glass and plastic.
Increase our understanding of supply-side environ-mental risks and explore environmental advocacyopportunities.

Broad-based Black Economic Empowerment
80massmart annual report
Mas
smar
tS
usta
inab
ilit
y R
epor
t 20
06
Overview
The Board and Executive Committee of Massmart aretotally supportive of BBBEE and believe it to be essentialto the transformation and normalisation of our society andour company.
Although there are no laws or charters defining BBBEE forretailers, the Massmart Board approved a policy, in early2004, to focus on every aspect of BBBEE, and we haveestablished programmes and objectives to do this. Eachoperating entity is required to maintain a BBBEE scorecardand to report progress to the Massmart Board on a bi-annual basis.
One of our BBBEE objectives was to enter into anempowerment transaction with previously disadvantagedpeople. In deciding on this, the Board felt that Massmart’spermanent employees were the people who most deserved tobe recognised for the part they played in Massmart’s progress.
After more than a year of preparation we were very pleasedto announce shareholder approval to enter into anempowerment transaction with our staff. The transactionwas one of the largest and most important in the history ofMassmart. It involved placing 18 million Massmart shares,with a value of R900 million into an EmployeeEmpowerment Trust called Thuthukani.
The beneficiaries of the Thuthukani Trust will be all SouthAfrican-based permanent employees who are employedby Massmart on 1 October 2006, 83% of whom arepreviously disadvantaged.
These employees will have rights that are very similar tothose of existing Massmart ordinary shareholders,including the right to earn dividends, the right to vote atshareholder meetings through trustees and the right toretain or sell Massmart shares to create wealth after acertain period.
Whilst the Thuthukani empowerment transaction wasundoubtedly the highlight of our BBBEE efforts we continue toalign our business to the elements described in theDepartment of Trade and Industry’s BBBEE scorecard. Oursuccess in these endeavours is demonstrated by our rating inthe Financial Mail’s 2006 Top Empowerment Companiessurvey, as the fourth most empowered South African retailer.
2007 objectives
• Engage an accredited BBBEE verification agency toconduct a review of Massmart’s BBBEE status once thecodes of good practice have been gazetted.
• Conduct a comprehensive communication campaign toensure that Thuthukani beneficiaries have a completeunderstanding of their rights as Massmart shareholders.
• Invest further capital in the Massmart UmsobomvuEnterprise Development Fund or establish a furtherEnterprise Development Fund that benefits blackentrepreneurs in the Massmart value chain.
• Engage with strategic suppliers to derive a betterunderstanding of their BBBEE status and intentions.This will include exploring sound commercially basedopportunities to incentivise suppliers to improve theirBBBEE status.
• Implement central buying system modifications to trackthe BBBEE status of suppliers, once the codes of goodpractice have been gazetted.
• Continue efforts to formulate competitive supplyagreements with emerging black start-up suppliers.Particular emphasis will be placed on the existingrelationship with the National Industrial Chamber (NIC).
• Host a workshop programme that aims at orientatingblack start-up enterprises to key considerations forentering into supply agreements with retailers.
Additional scorecard information
Thuthukani Empowerment Trust statistics
• 18 million “A” Preference Shares• 9% of issued share capital• R900 million transaction value• 14 400 staff beneficiaries• 83% of beneficiaries previously disadvantaged• 40% of beneficiaries previously disadvantaged
women• 6 BBBEE scorecard points
Supplier BBBEE score statistics
• 6 204 suppliers surveyed• 1 213 (20%) responded• 97 of our top 200 suppliers responded• 843 (69%) suppliers scores were unknown• 101 (8%) suppliers achieved scores lower than
30 points• 198 (16%) suppliers achieved scores from 30 to
64 points• 71 (5%) suppliers achieved scores from 65 to
100 points
Massmart BBBEE philosophy
• Massmart believes that authentic commitmentto BBBEE is a moral imperative that is essential forthe normalisation of South African society.
• Massmart believes that BBBEE is an essentialprocess for improving buying power amongst thewider South African demographic.
• Massmart believes that authentic commitment tothe BBBEE process is an important pre-condition for building trust based relationships with ourcustomers and staff.

81massmart annual report
Case study 1Massmart assists black youth entrepreneurs
Massmart has entered into a partnership with the Umsobomvu Youth Fund to create an Enterprise Development venture thatbenefits unemployed black youths. The venture, known as the Massmart Umsobomvu Youth Development Fund, was establishedwith an initial contribution of R1 million from Massmart and a matching contribution from Umsobomvu.
The money in the fund is used to establish unemployed youths in micro or entry-level fast food franchise businesses. One of thefunds first initiatives has been to help 11 youths purchase Hot Dog Café franchises, which operate outside Massmart stores. Theresult is that Massmart benefits by providing convenient fast foods to our customers and the youth entrepreneurs are able to makean income by selling quality products in a shopper-filled environment.
Case study 2Massmart assists rural women entrepreneurs
Massmart has entered into a partnership with Women’s Development Businesses (WDB) to help establish rural women in retail-related enterprises.
The decision to partner with WDB in this initiative is based to our understanding that rural development requires socialdevelopment and local knowledge that we do not possess.
In terms of the mechanics of the initiative Massmart has established an investment fund that is accessed at the discretion ofWDB to advance micro-loans to rural women entrepreneurs. The Group also funds the activities of two WDB field assistants whoprovide monetary and coaching support to loan recipients.
Case study 3Supporting black-owned and operated suppliers
Jumbo Cash and Carry has a focused approach to optimise procurement opportunities from black-owned and operated suppliers.They currently have ongoing procurement relationships with 121 black-owned and operated edible and non-edible grocerysuppliers. Jumbo estimates that their total procurement spend with these suppliers was R233 million for the financial yearended June 2006.
Case study 4Massmart focuses on facilitating black start-up business access to our markets
Massmart appreciates that we can, through our buying behaviour, exert significant influence on the growth potential of black start-up enterprises. We have, therefore, delegated responsibility for assisting start-up enterprises that have the potential to enter intosupply relationships with Group companies to Massmart Holdings-based merchandise specialists. Their key role is to advise andprepare the start-up entrepreneurs for negotiations with buyers in our chains. This includes providing advice about productspecification, pricing, logistics and merchandising options.
In terms of identifying and sourcing potential suppliers we have and continue to explore partnerships with organisations such asthe National Industrial Council (NIC), National Federated African Federated Chamber of Commerce (NAFCOC) and IthalaDevelopment Finance Corporation Limited.
Whilst these partnerships have resulted in numerous meetings with potential suppliers we have yet to enter into a significantsupply contract with black start-up enterprises. The process has, however, been useful in terms of identifying impediments to thistype of intervention, such as ensuring product compliance with SABS requirements. We are currently investigating options to assistsuppliers to overcome these obstacles.

82massmart annual report
Black Economic Empowerment Equity Transaction
BackgroundMassmart’s BEE Transaction has a value of approximatelyR1 billion based on the reference price of R49.98.
The Massmart Board believes that this BEE Transaction isboth a moral imperative and entirely appropriate at this timein the history of the Company and country. The Transactionbetter aligns the Massmart Group with: our staff, whoseefforts have been the origin of the value created over the past18 years; our customers, whose continued patronage ishighly valued; and with broader society whose respect westrive to earn.
Overview of the TransactionThe BEE Transaction includes the setting up of two trusts: theThuthukani Empowerment Trust and The Black ManagementTrust.
The Thuthukani Empowerment Trust has the followingcharacteristics:
• it has been created for the benefit of all of the MassmartGroup’s permanent employees in South Africa who wereemployed on 1 October 2006, regardless of race andgender and who are not beneficiaries of Massmart’sexisting share ownership scheme;
• approximately 14 500 employees who do not currentlyparticipate in any of Massmart’s existing share schemes(83% of whom are previously disadvantaged individuals)are beneficiaries of the trust;
• the beneficiaries have vested rights that are similar tothose of existing Massmart shareholders, including:– the right to dividends;– the right to vote at shareholder meetings through
elected trustees; and– the right to acquire, after a certain period, ordinary
shares, and thereafter to retain or sell them; and• these vested rights represent 9% of the issued shares of
Massmart (before the BEE Transaction).
The Black Management Trust has the followingcharacteristics:
• it has been created for the benefit of the MassmartGroup’s current and future previously disadvantagedmanagement in South Africa. Although approximately 30of the Massmart Group’s previously disadvantagedmanagement benefit, the trust is primarily applied toattracting and retaining previously disadvantagedmanagers in the future;
• the beneficiaries have vested rights including:– the right to vote at shareholder meetings through
elected trustees; and – the right to acquire, after a certain period, ordinary
shares, and thereafter to retain or sell them; • these vested rights represent 1% of the issued share of
Massmart (before this BEE Transaction).
Mechanics of the BEE TransactionThe BEE Transaction has different mechanics for the twotrusts and these are explained separately below.
At a high level, the Thuthukani Empowerment Trust operatesas follows:
• Massmart issued “A” Preference Shares to theThuthukani Empowerment Trust;
• the number of “A” Preference Shares allocated tobeneficiaries of the Thuthukani Empowerment Trust wasbased on length of service with the Group;
• to become beneficiaries, employees had to be employedat 1 October 2006;
• at the end of years four, five and six (being 1 October2010, 2011 and 2012, respectively) 33.3% of the“A” Preference Shares will become available to thebeneficiaries;
• the beneficiaries may then elect to receive the benefitsflowing from these newly available “A” Preference Shares.If the beneficiary makes no election, the “A” PreferenceShares will be held until the scheme comes to an end (atthe end of six years), when an automatic election will bedeemed to occur;
• when the employee elects to receive his benefit, then hewill receive ordinary shares with a value equal to thedifference between the price of an ordinary share at the

83massmart annual report
time of his election and the reference price (beingR49.98) multiplied by the size of his allocation;
• the “A” Preference Shares will get 25% of the dividend onordinary shares for the first year, 50% of the ordinaryshare dividend for the second year, 75% of the ordinaryshare dividend for the third year and 100% of the dividendfor the fourth year and thereafter. This amount will be paidin cash into the beneficiaries’ bank accounts within a fewweeks after the declaration of Massmart’s ordinarydividend; and
• this trust is once-off and will be wound up in or about2013. Any undistributed “A” Preference Shares will thenbe distributed to beneficiaries, while any forfeited orunallocated “A” Preference Shares will be redeemed.
At a high level, the Black Management Trust operates asfollows:
• the number of “B” Preference Shares allocated tobeneficiaries of the Black Management Trust was decidedupon by the Remuneration Committee;
• this is not a once-off transaction and it is envisaged that“B” Preference Shares will remain available for allocationto current and future beneficiaries, based upon a formulaapplied by the Remuneration Committee;
• at the end of years two, three, four and five from the dateof allocation, 25% of the “B” Preference Shares willbecome available to the beneficiaries;
• the beneficiaries may then elect to receive the benefitsflowing from these newly available “B” Preference Shares.If the beneficiary makes no election, the “B” PreferenceShares will be held until the end of six years from the dateof allocation, when an automatic election will be deemedto occur;
• when the employee elects to receive his benefit, thenhe will receive ordinary shares with a value equal to thedifference between the price of an ordinary share atthe time of his election and the reference price (which willvary from issue to issue but which was R49.98 for theinitial allocation); and
• the “B” Preference Shares in this trust do not get anydividends from the Company.
How much did the BEE Transaction cost?Massmart’s advisers and accountants have run detailedvaluation models and determined that the true cost of theBEE Transaction is R235 million. This estimate is based onthe best information available at the last practicable date.This amount will be spread over the six years the BEETransaction will be in operation. See Letter from ChiefFinancial Officer on page 25.
Who appoints the trustees?The beneficiaries in each trust are entitled to elect their ownTrustees.
The Thuthukani Empowerment Trust has nine trustees, ofwhich four are elected by the beneficiaries, four are appointedby Massmart and one person is an independent previouslydisadvantaged professional who may be elected by thetrustees to act as chairman of the trust. The majority of thetrustees shall be previously disadvantaged individuals.
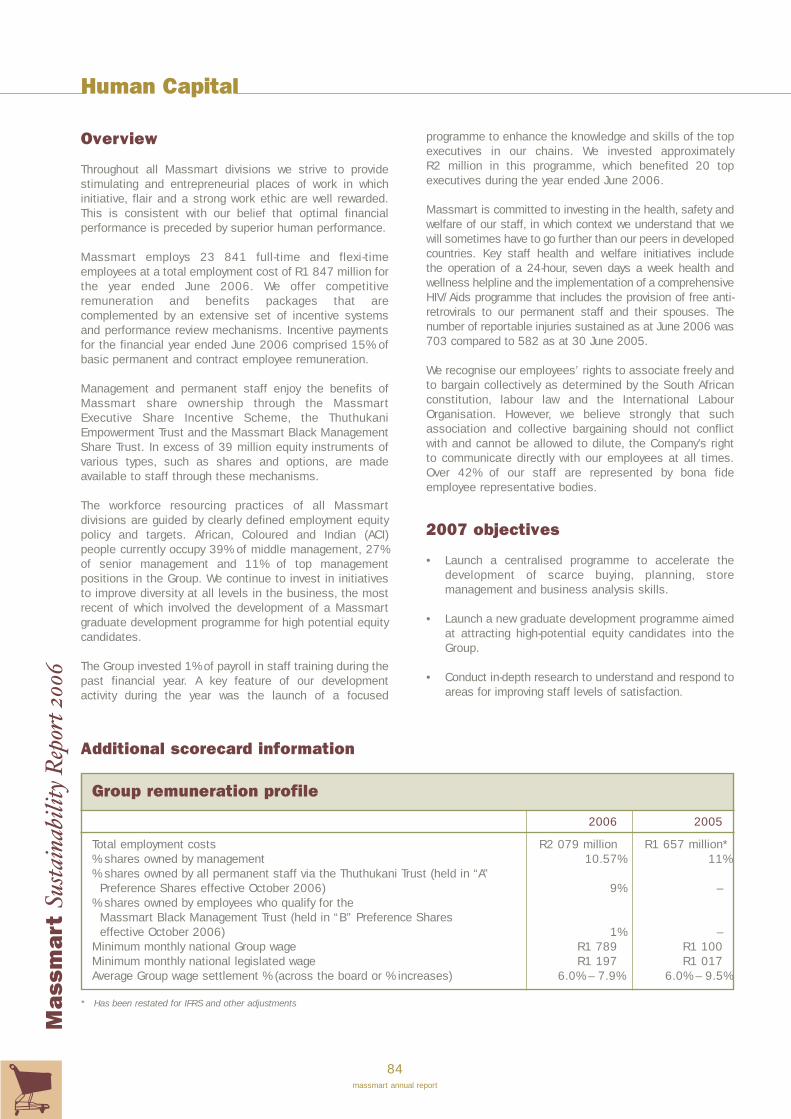
Human Capital
84massmart annual report
Mas
smar
tS
usta
inab
ilit
y R
epor
t 20
06
Overview
Throughout all Massmart divisions we strive to providestimulating and entrepreneurial places of work in whichinitiative, flair and a strong work ethic are well rewarded.This is consistent with our belief that optimal financialperformance is preceded by superior human performance.
Massmart employs 23 841 full-time and flexi-timeemployees at a total employment cost of R1 847 million forthe year ended June 2006. We offer competitiveremuneration and benefits packages that arecomplemented by an extensive set of incentive systemsand performance review mechanisms. Incentive paymentsfor the financial year ended June 2006 comprised 15% ofbasic permanent and contract employee remuneration.
Management and permanent staff enjoy the benefits ofMassmart share ownership through the MassmartExecutive Share Incentive Scheme, the ThuthukaniEmpowerment Trust and the Massmart Black ManagementShare Trust. In excess of 39 million equity instruments ofvarious types, such as shares and options, are madeavailable to staff through these mechanisms.
The workforce resourcing practices of all Massmartdivisions are guided by clearly defined employment equitypolicy and targets. African, Coloured and Indian (ACI)people currently occupy 39% of middle management, 27%of senior management and 11% of top managementpositions in the Group. We continue to invest in initiativesto improve diversity at all levels in the business, the mostrecent of which involved the development of a Massmartgraduate development programme for high potential equitycandidates.
The Group invested 1% of payroll in staff training during thepast financial year. A key feature of our developmentactivity during the year was the launch of a focused
programme to enhance the knowledge and skills of the topexecutives in our chains. We invested approximatelyR2 million in this programme, which benefited 20 topexecutives during the year ended June 2006.
Massmart is committed to investing in the health, safety andwelfare of our staff, in which context we understand that wewill sometimes have to go further than our peers in developedcountries. Key staff health and welfare initiatives includethe operation of a 24-hour, seven days a week health andwellness helpline and the implementation of a comprehensiveHIV/Aids programme that includes the provision of free anti-retrovirals to our permanent staff and their spouses. Thenumber of reportable injuries sustained as at June 2006 was703 compared to 582 as at 30 June 2005.
We recognise our employees’ rights to associate freely andto bargain collectively as determined by the South Africanconstitution, labour law and the International LabourOrganisation. However, we believe strongly that suchassociation and collective bargaining should not conflictwith and cannot be allowed to dilute, the Company’s rightto communicate directly with our employees at all times.Over 42% of our staff are represented by bona fideemployee representative bodies.
2007 objectives
• Launch a centralised programme to accelerate thedevelopment of scarce buying, planning, storemanagement and business analysis skills.
• Launch a new graduate development programme aimedat attracting high-potential equity candidates into theGroup.
• Conduct in-depth research to understand and respond toareas for improving staff levels of satisfaction.
Group remuneration profile
2006 2005
Total employment costs R2 079 million R1 657 million*% shares owned by management 10.57% 11%% shares owned by all permanent staff via the Thuthukani Trust (held in “A”
Preference Shares effective October 2006) 9% –% shares owned by employees who qualify for the
Massmart Black Management Trust (held in “B” Preference Shares effective October 2006) 1% –
Minimum monthly national Group wage R1 789 R1 100Minimum monthly national legislated wage R1 197 R1 017Average Group wage settlement % (across the board or % increases) 6.0% – 7.9% 6.0% – 9.5%
* Has been restated for IFRS and other adjustments
Additional scorecard information
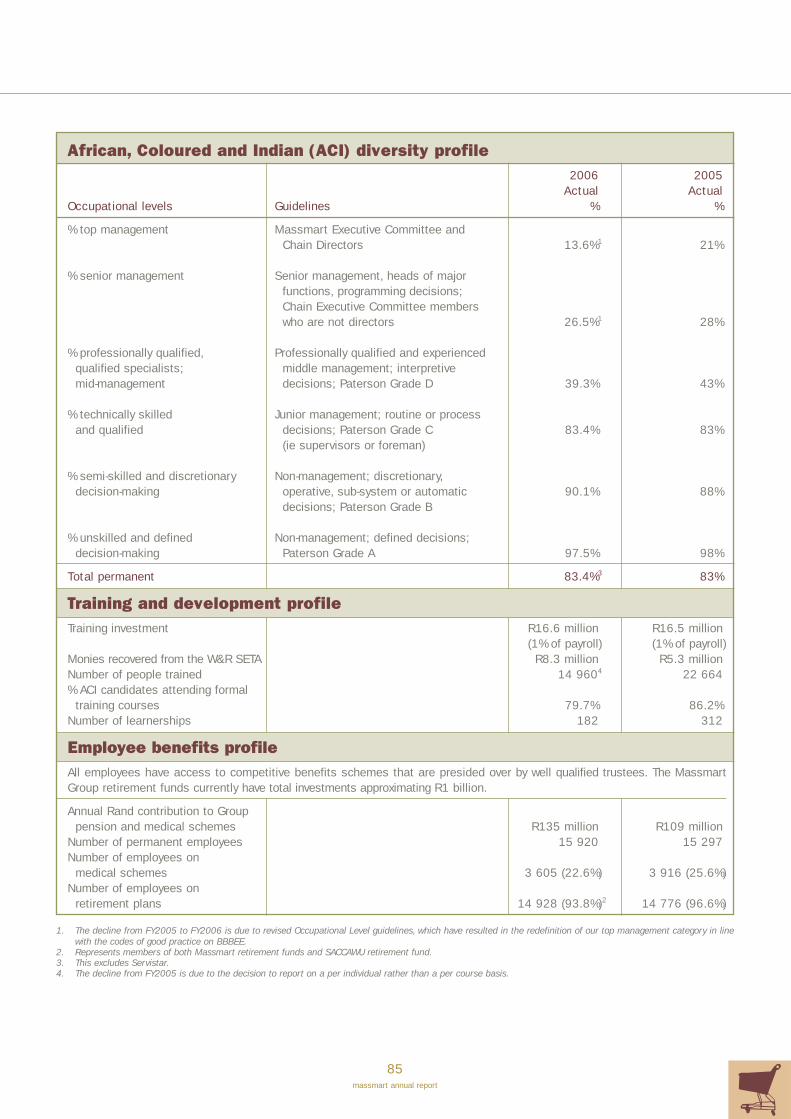
85massmart annual report
African, Coloured and Indian (ACI) diversity profile2006 2005
Actual ActualOccupational levels Guidelines % %
% top management Massmart Executive Committee andChain Directors 13.6%1 21%
% senior management Senior management, heads of major functions, programming decisions; Chain Executive Committee members who are not directors 26.5%1 28%
% professionally qualified, Professionally qualified and experienced qualified specialists; middle management; interpretive mid-management decisions; Paterson Grade D 39.3% 43%
% technically skilled Junior management; routine or processand qualified decisions; Paterson Grade C 83.4% 83%
(ie supervisors or foreman)
% semi-skilled and discretionary Non-management; discretionary,decision-making operative, sub-system or automatic 90.1% 88%
decisions; Paterson Grade B
% unskilled and defined Non-management; defined decisions; decision-making Paterson Grade A 97.5% 98%
Total permanent 83.4%3 83%
Training and development profileTraining investment R16.6 million R16.5 million
(1% of payroll) (1% of payroll)Monies recovered from the W&R SETA R8.3 million R5.3 millionNumber of people trained 14 9604 22 664% ACI candidates attending formal
training courses 79.7% 86.2%Number of learnerships 182 312
Employee benefits profileAll employees have access to competitive benefits schemes that are presided over by well qualified trustees. The MassmartGroup retirement funds currently have total investments approximating R1 billion.
Annual Rand contribution to Group pension and medical schemes R135 million R109 million
Number of permanent employees 15 920 15 297Number of employees on
medical schemes 3 605 (22.6%) 3 916 (25.6%)Number of employees on
retirement plans 14 928 (93.8%)2 14 776 (96.6%)
1. The decline from FY2005 to FY2006 is due to revised Occupational Level guidelines, which have resulted in the redefinition of our top management category in linewith the codes of good practice on BBBEE.
2. Represents members of both Massmart retirement funds and SACCAWU retirement fund.3. This excludes Servistar.4. The decline from FY2005 is due to the decision to report on a per individual rather than a per course basis.

Case study 1Nurturing emerging talent
With the objective of exposing high-potential managers to senior executive insights and advanced retail thinking, Massmartlaunched the Emerging Talent Development Programme (ETDP) in February 2006. The programme is structured utilisinginteractive workshops that are facilitated by Massmart Holdings executives and external specialists who are regarded asauthorities in their respective fields.
These workshops cover a wide array of retail and business focused subjects that include strategy, finance, sustainability, andmerchandising. Furthermore, the programme is designed to allow participants to gain insights into their personal leadershipand management capabilities through psychometric evaluations and one-on-one career discussions.
The goal of the programme is to enable ETDP participants to recognise opportunities for career growth across the MassmartGroup.
Case study 2Maintaining the succession pipeline
As part of our succession planning focus Massmart recently launched two new programmes, the Leadership DevelopmentProgramme (LDP) and the Executive Development Programme. These aim to develop the analytical and strategic leadership abilitiesof senior executives who have been earmarked as potential successors to members of Massmart’s top management team.
The programmes are presented in partnership with a number of South African and international business schools, includingthe Gordon Institute of Business Science (GIBS); University of Cape Town, Graduate School of Business (GSB) and INSEAD.The programme utilises sophisticated personal feedback techniques that enable participants to accurately assess andprioritise their development needs.
A key objective of the programmes is to expose participants to global leaders in retail and the management sciences. A recent10-day field trip by 20 executives to the University of Arkansas, Sam M. Walton College of Business, Centre for RetailExcellence, which incorporated regular contact with top management at Walmart is a good example of the type of developmentinterventions utilised on these programmes
Case study 3Managing executive careers
A key intervention that drives the development and succession planning of Massmart’s future executive talent is “the firesidechat”. Designed as a personal career and development discussion, this is a unique format in which every aspect of a seniormanager’s life at Massmart is reviewed.
Importantly, we emphasise that this is not a performance management discussion but a “chat” about those factors importantto the individual that will ensure his/her long-term commitment to the Group. “Fireside chats” are held with in excess of180 individuals across the Group.
Human Capital continued
86massmart annual report
Mas
smar
tS
usta
inab
ilit
y R
epor
t 20
06

87massmart annual report
Case study 4Attracting high-potential equity graduates
Realising the importance of personal perceptions in attracting the best graduate talent to the organisation, Massmart engagedMagnet Communications to survey student perceptions of the retail industry as a whole and the Massmart Group specifically.
Conducted amongst 9 611 commerce, engineering, science and law students on 19 campuses, the survey provided usefulinformation about the issues that need to be considered in developing an effective graduate recruitment programme. Importantfindings included low top-of-mind awareness of the Massmart Group as a prospective employer amongst graduates in relation toother top multinational companies, and low appeal of the retail industry relative to other industries such as financial services.
The survey also provided valuable insight into options for tailoring graduate recruitment communications to attract talented youngpeople to the Group. Massmart intends recruiting 22 graduates during the current financial year 2006/7.
Case study 5IMPILO staff wellness programme
In November 2005, Massmart launched the Impilo Wellness and HIV/Aids Management Programme, fully funded by the Companyand available to all permanent employees.
IMPILO is managed independently by external service providers and offers a voluntary and confidential professional counsellingservice through a dedicated helpline. This includes providing access to general health information, on-site or off-site HIV testing,and free comprehensive HIV/Aids medication for employees and their spouses.
The following is the view of a staff member who has participated in the programme: “It’s great that the programme is externalbecause the one key thing that prevents people from getting help is the fear that the confidentiality of their case will not be protected.”
Case study 6Responding to HIV/Aids in the workplace
In February 2006, HIV/Aids Voluntary Counselling and Testing (VCT) sessions were rolled out across the Group. This included Aidsawareness information sessions explaining the process; pre-HIV status test counselling; a voluntary HIV test; post-HIV testcounselling; and the opportunity for HIV positive employees and their spouses to register on the management programme.
Those registered on the Expert Treatment Programme (ETP) receive either Highly Active Anti-Retroviral Therapy (HAART) or pre-HAART depending on their condition. The goal with pre-HAART patients is to maintain their health, which involves a comprehensiveprogramme of education, vaccinations and vitamin and mineral supplements if required. Employees on HAART are monitored andtreated for Aids defining illnesses and opportunistic infections.
Case study 7Understanding employee perceptions
Massmart recognises the need to survey and understand employee perceptions of our organisation. We have, to this end,participated regularly in the Deloitte “Best Companies to Work For” process.
The decision was taken more recently to derive a fresh perspective of the perceptions of our employees. We have therefore engagedthe Hay Group to administer their Organisation Climate, Inventory of Leadership styles and Engaged Performance survey instrumentsacross the Group. We anticipate that the findings generated during this process will be presented during October 2006.

88massmart annual report
Creating Shareholder ValueAwarded to Makro in recognition of a 58% growth in Economic Value
Added amounting to R225 million in the year to June 2006.
Creating Channel ValueAwarded to The Human Capital Forum in recognition of their efforts inconceptualising, championing and implementing Impilo and the MassmartAntiretroviral Programme.
LeadershipAwarded to RobbieBarrell in recognition ofthe breadth and impactof his leadership on thestore operations andstore development ofMassdiscounters.
Human PotentialDevelopmentAwarded to Jane Bruynsin recognition of her rapidestablishment of thefundamental MassmartHuman Capital principlesand values in the Jumbochain.
TransformationAwarded to Norman
Gray in recognition of
the creation of an
Internal Audit function
comprising a greater
proportion of previously
disadvantaged South
Africans than any other
Massmart division or
function.
General ExcellenceAwarded to Carol Rimerin recognition of hertenacity, dedication andsuccess in themanagement of supplierrelations and theMassmart Rebatesdepartment.
89massmart annual report
General ExcellenceAwarded to Mike Marshall andBrad Evelyn in recognition oftheir tireless efforts, under themost testing circumstances, inleading the design andimplementation of the new Shielddebtors system and the capturingof all historic data.
General ExcellenceAwarded to Chris Lourensand Fred Cresswell inrecognition of the rapid andsuccessful refurbishment ofthe flagship Jumbo CrownMines store, while satisfyingthe demands of continuoustrading.
General ExcellenceAwarded to Sidney Newmanand Jacques Perie inrecognition of their leadershipof the Builders Warehousesales team, which dramaticallyincreased the quantum andprofitability of the externalsales to contractors.
General ExcellenceAwarded to CliffordKahanovitz in recognitionof his merchandise andmarketing expertise, whichis totally transforming thepaint category of BuildersWarehouse.
Massmart
Citation awards
Since 1991, Massmart has recognised internal excellence with an annual presentation of awards.This year, awards were presented for the following categories: general excellence, the creation ofChannel value, human potential development, leadership, transformation and the creationof shareholder value. The following were the 2006 award winners:
General ExcellenceAwarded to Brenda Shelly inrecognition of her leadership ofMassmart’s implementation ofInternational Financial ReportingStandards, and the creation of theGroup’s 2005 Annual Report.
General ExcellenceAwarded to Avi Mizrachiin recognition ofexceptional trading andmarketing performancein the turnaround of theprofit performance ofthe Phillipi CBW branch,during the 2006financial year.
General ExcellenceAwarded to Gwen Beck inrecognition of her selflessdedication to theadministration andcharitable work of theMassmart EducationTrust.
General ExcellenceAwarded to Brian Leroni inrecognition of his success insubstantially elevating thequality of Massmart’sperformance in all areasof sustainability, BlackEconomic Empowerment andCorporate Social Investment.

Customers
90massmart annual report
Mas
smar
tS
usta
inab
ilit
y R
epor
t 20
06
Overview
For all our chains, satisfying, retaining and growing ourcustomer base is the key to sustainable business. Ourprofitability depends on our brand equity and reputation inthe eyes of an extremely broad base of customers thatextends from Living Standard Measure (LSM) 5 through toLSM 10.
We make every reasonable effort to provide excellentcustomer service, to safeguard customers and theirpossessions at our operations and to remedyshortcomings if ever our products and services fail to meetthe standards that we and our suppliers represent.
Whilst our suppliers are ultimately accountable for ensuringthe quality and safety of the merchandise they supply to us– particularly in the case of branded goods – we recognisethat we, too, have a duty to safeguard our customers, andthat our reputation depends on the safety and quality of thegoods we sell.
We therefore require that our buyers include in theirprocurement decisions, issues such as quality, safety,legality, industry standards, honest feature and benefitcommunication, and ethical manufacture. We ensure thatour products comply with legislated labelling standardssuch as directions, registration numbers (whereapplicable), SABS certifications, weights and measures.
We are also keenly aware that customer attitudes towardenvironmental, health and related social issues are playingan increasingly important role in their buying behaviour. Weare, as a consequence, placing additional emphasis onunderstanding and responding constructively to theseissues.
2007 objectives
• Research the influence that socially responsible retailpractice exerts on the buying behaviour of South Africanconsumers.
• Continue to search for and procure low cost and highquality merchandise to reduce our customers’ cost ofliving.
• Invest in retail technologies and practices to educateand inform shoppers about merchandise and solutionsthat improve their lives.
Massmart retail shopper perceptions
The information described below was derived throughintercept interviews with 4 000 Massmart shoppersnationally.
• A significant majority of Massmart shoppersexpress high levels of satisfaction with the overallshopping experience.
• A significant majority of Massmart shoppersexpress high levels of satisfaction with the productrange in Massmart stores.
• The average shopper frequency at Massmartstores is two to three times per month.
• Seven in 10 shoppers make impulse purchases atMassmart stores.
Proposed legislative measures to protect consumers
The retail industry is currently confronted by two piecesof legislation that have important implications for theway that we transact with our customers.
These are the Consumer Protection Bill and theNational Credit Act. We have taken careful note ofthese, and are in agreement with the need forlegislation that offers consumers protection fromunscrupulous traders and unfair credit practices.
Because Massmart is primarily a cash business, theimpact of the National Credit Act is limited to a relativelysmall part of the business. We are comfortable with theprovisions of this Act.
Although very supportive, we are less comfortable withcertain provisions of the Consumer Protection Bill,which is likely to introduce significant administrationcosts for retailers.
We have made formal submissions to, and willcontinue to liaise constructively with the Department ofTrade and Industry in respect of this legislation.
Additional scorecard information

91massmart annual report
Case study 1Mentoring and growing small wholesale customers
Makro, CBW Wholesalers and Shield have a long history of helping their small wholesale customers build their businesses utilisingthe banner group concept. This involves the Massmart wholesaler investing in, and developing retail brand identities and makingthese available to carefully selected small traders. A key advantage to the small trader is that the banner group brand enjoys highlevels of customer awareness and confidence which contributes to significant increases in their turnover. This is achieved byoffering the banner group members ongoing and regular coaching, procurement and marketing support.
Coaching support includes providing the small trader with legal, financial and merchandising advice. In the case of marketing theMassmart chains plan and execute targeted marketing campaigns in close collaboration with banner group members, typically onthe basis of merchandise that is supplied to the trader at highly competitive preferential prices.
Case study 2Championing the cause of independent wholesalers
Shield was founded in 1973 by Ahmed Goondiwala, Syd McGlashen and Theo Muller with the aim of assisting independentwholesale outlets to compete effectively against recognised wholesale chains. This is achieved through a model that involvesShield operating as an outsourced buying department that consolidates the buying power of independent wholesalers and retailersin order to secure highly competitive prices that are of direct benefit to both its members and the end consumer.
This is a fine example of Enterprise Development, long before it had been contemplated as an option for stimulating transformationin the South African economy. Today Shield has over 500 active trading members, of which over half are from previouslydisadvantaged communities. Mr Baboo Abdulla, who is the owner of a highly competitive and successful retail chain whichcomprises 39 stores nationwide, provides a good example of the scale that can be achieved by independent traders that are inpartnership with Shield.
Case study 3Customer guarantees support peace of mind shopping
Game recognises that the purchasing decision is often a stressful process. Game therefore aspires to offer its customerscomplete peace of mind whenever the customer purchases a product in a Game store. This philosophy is based on Game’sunderstanding that stress is induced by three types of customer uncertainty; What if I can get the product cheaper elsewhere?What if the product doesn’t work properly? What if I change my mind?
To help their customers overcome this uncertainty Game makes three promises to their customers:
Service guarantee: “It’s not working? – We guarantee complete after-sales service satisfaction.”Price guarantee: “Found it cheaper? – Tell us and we will beat that price.”Satisfaction guarantee: “Changed your mind? – We will exchange your purchase or refund you.”

Suppliers
92massmart annual report
Mas
smar
tS
usta
inab
ilit
y R
epor
t 20
06
Overview
Massmart procured close to R26 billion worth ofmerchandise for resale from suppliers during the past year.In this context, we apply every effort to first procuremerchandise from South African manufacturers in so faras they satisfy our customer expectations of style, qualityand price.
Within the structure of the Group, the responsibility andauthority for all procurement decisions resides with thedivisions or chains, within approved budgets andstrategies. However, most trading contracts are negotiatedand administered at a group level.
Massmart’s procurement function is one of the key driversof our sustainability and profitability as a business.Massmart therefore relies on highly competent buyerswho collaborate closely with our suppliers with theobjective of entering into sound and mutually beneficialcommercial relationships.
While there will always be commercial tension in theserelationships, we recognise that our local and internationalsuppliers are partners in our drive to offer customers safe,high quality and competitively priced merchandise. Ourtrading relationships with suppliers are codified in theMassmart Trading Agreement that requires each supplier towarrant that they comply with prescribed legislative,product safety and quality, ethical trading and humanrights standards.
We also track the manufacturing practices of selectedsuppliers through environmental surveys and goodmanufacturing practices audits.
Our supplier relationship building practices are extensiveand include conducting Supplier Perceptions surveys,providing confidential access to the Massmart Ethics Lineand inviting suppliers to participate in our group-widemerchandise forums.
Group merchandise procurement profileStrategic Estimated supplier Number of procurement category suppliers spend
FY 2006Category 1 123 R12.4 billionCategory 2 188 R4.4 billionCategory 3 4 361 R7.9 billionDirect imports 402 R1.1 billion
Grand total 5 074 R25.8 billion
FY 2005Category 1 115 R10.8 billionCategory 2 176 R3.4 billionCategory 3 3 903 R6.9 billionDirect imports 341 R1.3 billion
Grand total 4 535 R22.4 billion
2007 objectives
• Improve the sharing of sales and forecast informationand the integration of electronic transactions withsuppliers.
• Increase the intensity and frequency of high level groupinteractions with strategic suppliers through theGroup’s trading forums.
• Extend the coverage of Massmart’s supplierperceptions survey.
Additional scorecard information

93massmart annual report
Case study 1Supplier trading warranties
The Massmart Trading Agreement requires suppliers to warrant that:
• they comply with VAT registration and other legislative and administrative requirements;• they observe applicable laws related to the manufacture and distribution of their goods;• they ensure that the goods they supply bear authentic country of origin markings;• their products are not manufactured using child labour or other exploitative labour practices that are considered an abuse of
basic human rights in South Africa;• their foodstuffs, cosmetics or disinfectants (where applicable) are not “prohibited goods” in terms of the Foodstuffs, Cosmetics
and Disinfectants Act, 1972; and• their electronic goods (where applicable) comply with the latest SABS requirements and standards.
The Massmart Trading Agreement also commits suppliers to provide independent verification of their Broad-based Black EconomicEmpowerment (BBBEE) status.
Case study 2Product safety update
Private label food safetyFood Consulting Services (FCS), an internationally accredited food safety and quality consulting laboratory, continues to ensure thesafety and quality of Massmart’s private label and confined label food products. In the 2006 year FCS conducted over 2 500product tests on Massmart’s private and confined label products. They also performed 17 Good Manufacturing Practices (GMP)audits of supplier manufacturing processes, on behalf of Massmart.
Lead-free painted toysThe Department of Health discovered that certain painted toys sold in some retail chains had high lead toxicity levels. No toyproducts sold by Massmart’s chains were impacted. However, in the interests of ongoing product safety, all toy suppliers wererequired to provide the Group with written assurance that their products were in full compliance with all relevant health and safetylegislation.
EnergadeBromor Foods removed a batch of their Energade drink from retailers’ shelves during March, 2006. This occurred after a pregnantwoman drank a contaminated energy drink bought in a Johannesburg supermarket. Massmart’s chains responded rapidly to theincident, removing all potentially affected Energade drinks from sale. A subsequent assessment, conducted by Bromor Foods,found no evidence of contamination of Energade’s product in Massmart’s stores.
Avian FluThe Department of Health and the Department of Agriculture have announced that South Africa is free of the H5N1 “bird flu virus”.Furthermore bi-annual studies of domestic and commercial chickens and ostriches are conducted to facilitate detection of thedisease in the local poultry industry. In February 2006, the World Health Organisation (WHO) confirmed that humans are not atrisk of acquiring H5N1 through poultry products that are safely handled and properly cooked.
Notwithstanding these facts, Massmart continues to collaborate with the Consumer Goods Council of South Africa’s Food SafetyInitiative and the major chicken suppliers in order to track the spread of the disease and to prepare contingency plans in the eventof an outbreak in South Africa.

Corporate Social Investment
94massmart annual report
Mas
smar
tS
usta
inab
ilit
y R
epor
t 20
06
Overview
Massmart’s overarching CSI objective is to contribute tothe country’s social development agenda and to nurture areputation amongst stakeholders as a responsibleorganisation that is playing a meaningful role in assistingpreviously disadvantaged South Africans.
As a basic minimum, trading entities are required to spend1% of after-tax profits on educationally focused CSIinitiatives that benefit the poorest of the poor. In the yearended June 2006 the Group exceeded this guidelineinvesting 1.6% of pat in CSI activities.
Specific CSI initiatives are selected by the trading entitiesin accordance with CSI Best Practices defined by MassmartHoldings.
The CSI educational initiatives supported during thefinancial year ended June 2006 were varied and includedproviding disadvantaged learners with school uniforms andstationery, participating in school refurbishment activities,grant-making to educationally focused non-profitorganisations and launching an Excellence in EducationAwards programme in collaboration with the GautengDepartment of Education.
In addition to the Group’s education focus MassmartHoldings also provides financial assistance to causes thatare able to add direct value to our operational activities. Inmost instances this financial assistance is reciprocated bythe exchange of information or services that are of directbenefit to the Group.
During the year ended June 2006 this involved makingfinancial contributions to The Free Market Foundation,Business Against Crime and the WWF. Massmart does notmake contributions to political parties and/or causes.
2007 objectives
• Facilitate the practical implementation of Massmart’sstaff volunteerism policy in the operating divisions.
• Commission an independent review of theeffectiveness of the Group’s CSI focus, placingparticular attention on the value of the educationalinitiatives that are being supported.
Additional scorecard information
Key beneficiaries of educational support for the yearended June 2006
Rally to Read Tools to TeachEbokodweni SchoolJoshua Youth Development ProgrammeSports TrustTomorrow TrustVula CollegeBuffelshoek Schools TrustStarfish FoundationKgosi Neighbourhood FoundationEkuthuleni Day CentreJFPM Entrepreneurs Development Project Twilight Children’s ShelterDiepsloot Combined SchoolAlexandra High SchoolEqinisweni High SchoolIvory Park Secondary SchoolKliptown Secondary SchoolKwabhekilanga High SchoolLethulwazi Comprehensive SchoolPrudens Secondary SchoolRealogile High SchoolTembisa Secondary SchoolThetha Secondary SchoolThuto-Lesedi Secondary SchoolUmqhele High School
Key beneficiaries of non-education related support forthe year ended June 2006Business Against CrimeFree Market FoundationWWF
The above listed causes represent a sample ofthe type of organisations that received CSI supportfrom the Massmart Group during the period endingJune 2006.The smallest contribution, in respect of theorganisations listed of R15 000, was made to WWFwhilst the remainder of the organisations receivedcontributions of R20 000 or more. The biggestcontribution of R477 000 was made to Rally to Read.

95massmart annual report
Case study 1Makro’s partnership with the Gauteng Department of Education
From Massmart CSI Best Practice “A key emphasis is on ensuring that CSI initiatives align intelligently to Government policy.”
Recognising the value to be derived from partnering closely with the public sector, Makro designed and launched its Excellence inEducation Award programme in close collaboration with the Gauteng Department of Education’s (GDE) Policy Planning Unit. Theprogramme involves awarding Makro stationery and sports equipment vouchers, with a face value of R20 000.00, to schools thathave achieved excellence in difficult circumstances.
The GDE plays a pivotal role in the programme by defining the criteria for judging schools, selecting qualifying schools and also byensuring that the vouchers are used to achieve optimal impact in the winning schools. Coinciding with National Youth Daycelebrations, the programme recognised the achievements of 12 schools, each of which received a R20 000.00 Excellence inEducation Voucher. A typical recipient of the award was the Eqinisweni Secondary School which improved its grade 12 pass ratefrom 56% in 1999 to 100% in 2005.
Case study 2Staff volunteerism at Massdiscounters
From Massmart CSI Best Practice “The organisation focuses on facilitating the creation of a powerful culture of volunteerism amongstemployees.”
Recognising the positive contribution that employees can make in their own communities, Massdiscounters has ensured thatemployee volunteerism occupies a central role in their approach to CSI. Their S.M.I.L.E. programme, which is an acronym for“serving mankind inspires love everywhere”, has been designed to encourage and recognise employee volunteerism in thecommunity. The programme enables employees to apply, individually or as a team, for one of ten monthly product-based grants insupport of a voluntary community intervention identified by themselves.
Grants, which are valued at R5 000.00 each, comprise products that have been requested by the employee volunteer. Successfulapplicants also receive one day’s additional leave to work in the community on their CSI project. An annual S.M.I.L.E. ChampionAward is presented to the individual or team that performs best on the programme. To date 38 employees have participated in theprogramme. Projects have ranged from community feeding schemes, old age homes, hospice, crèches, community employment,homes for the disabled and HIV/Aids education, to teaching sport to disadvantaged children.
Case study 3Builders Warehouse partnership with “Men on the Side of the Road”
From Massmart CSI Best Practice “The organisation views CSI activities as offering opportunities to complement its core businessactivities; a conscious attempt is made to establish synergies between CSI initiatives and business priorities.”
Recognising the opportunity to build relationships with its customers by providing improved in-store service and by facilitatingaccess to trained handymen, Builders Warehouse funds a skills development initiative that involves Men on the Side of the Roadand three technical training colleges. The intervention provides Builders Warehouse with the option of supplying its contractorcustomer base with skilled workmen, or of employing the workmen as skilled and experienced customer advisors.
“Men on the Side of the Road” is an initiative that works to improve the job accessibility and quality of life of roadside workseekers. Builders Warehouse has entered into a partnership with this organisation in terms of which they source suitablecandidates to attend Builders Warehouse funded training programmes at technical training colleges in Alexandra, Atteridgeville andSoweto. A total of 24 men and women have benefited from this CSI intervention since its launch in September 2005.

Environment
96massmart annual report
Mas
smar
tS
usta
inab
ilit
y R
epor
t 20
06
Overview
Massmart recognises that sound environmental managementis an essential element of good sustainability practice. Weare committed to ensuring that our operations comply in allrespects with the provisions of national, provincial and localenvironmental legislation and regulations.
Responsibility for tracking environmental compliance liesprimarily with risk managers in each of Massmart’soperating divisions. Their responsibilities includetracking compliance with environmental practices such asthe transportation and handling of dangerous chemicals,disposal of waste water and hazardous waste and storerecycling performance.
The risk managers activities are supplemented by those ofstore planning professionals who focus on issues such as theenergy efficiency of stores, specification of environmentallyfriendly refrigeration units and air conditioning plants andensuring that proper Environmental Impact Assessments areundertaken for store development projects.
We are also mindful that we play a pivotal role in the supplychain, the environmental impacts of which extend beyondour operations. Historically, we have relied on theconditions in the Massmart Trading Terms Agreement tocommit suppliers to good environmental practice.
Recently, however, the decision was taken to verify theextent of supplier environmental commitment byconducting focused surveys of our suppliers environmentalpractices. The first of these examined the environmentalpractices of our seafood suppliers.
Finally, we have noted global retail environmental trendsthat include placing increased emphasis on practices suchas building eco-efficient stores, improving product labellingstandards and reducing packaging waste in the supplychain. We have concluded that we need to improve ourunderstanding of these trends and have initiated a processto do this.
2007 objectives
• Appoint an environmental consultant with retailexpertise as an environmental advisor to Massmart.
• Conduct a critical review of the scope of Massmart’scurrent environmental agenda and commitment.
• Extend the scope of the supplier environmental reviewprocess to include our top 40 food suppliers.
• Continue the rollout of identified energy savinginitiatives and recycling opportunities.
Proposed supplier environmental survey
Given the decision to extend the scope of our review ofsupplier environmental practices the following are keyenvironmental focus areas that we propose examining.We are open to modifying or adding to these questionsbased upon the feedback of readers of this report, whocan send their input to [email protected].
• Does your company have a board-approvedenvironmental management policy?
• What are the key environmental concerns facingyour industry?
• How has your company responded to theseconcerns?
• What environmental KPIs does your companymonitor?
• Does your company have formalised environmentalmanagement systems based on ISO14001, orsimilar standards?
• Is your company fully compliant with Safety, Healthand Environmental (SHE) legislation and permitrequirements?
• Has your company had any material incidents, finesor other sanctions relating to non-compliance toenvironmental laws, regulations and permits duringthe past 12 months?
• Does your company have programmes in place toimprove environmental disclosure on productlabelling?
• Does your company have programmes in place toreduce/eliminate end-product packaging waste?
• Does your company have programmes in place toreduce water consumption in the productionprocess?
• Is hazardous waste disposed of by registeredwaste contractors, at licensed hazardous wastesites?
• Has your company received any awards orindependent recognition for its environmentalpractices?
• What opportunities exist for your company topartner with Massmart on environmentalinitiatives?
Additional scorecard information
97massmart annual report
Case study 1Identifying the environmental impacts of the products that we sell
Massmart’s commitment to environmental sustainability includes encouraging our suppliers to be sensitive to the impact that theiractivities have on the natural environment. Given the stress placed on the marine environment, this is particularly important in thecase of our seafood suppliers.
Massmart therefore conducted a survey of the fishing and aquaculture practices of our fish and shellfish suppliers. The results ofthe survey were generally positive, with the following selected highlights: Massmart chains do not stock any fish listed on theWWF’s “No Sale Species” list. We only stock dolphin-friendly tuna – primarily skipjack tuna, and I&J Limited and Oceana Brandswere the two suppliers that stood out in terms of the comprehensiveness of the information they supplied.
Case study 2Responding to the energy crisis in the Western Cape
As part of its efforts to overcome capacity constraints in the Western Cape, Eskom has developed an incentive scheme toencourage its customers to utilise their back-up generators. The objective of this initiative is to assist in reducing the amount ofpower drawn from the national grid during peak demand periods.
The Makro stores in Ottery and Milnerton are participants in this scheme. They are required to generate four mandatory hours ofelectricity per day and are paid R1 600 for each megawatt hour of electricity that is generated.
Case study 3Improving our environmental understanding of the products that we sell
If Massmart is to encourage suppliers to be sensitive to the environmental impacts of their operations then we realise that weneed to develop an improved understanding of environmental issues relevant to their operations. We have therefore started theprocess of educating ourselves about the environmental issues faced by our suppliers. The following is an abbreviated extract ofa report prepared for Massmart by a marine scientist:
South African pelagic species (ie midwater species) occur inshore, primarily along the Western Cape’s west and south coasts(anchovy and pilchard) and the Eastern Cape coast (pilchard). Pilchard and anchovy occupy similar ecological niches and tend tobe in dynamic equilibrium. The past few years have seen record catches, far exceeding those estimated by population estimatemodels.
There seems to be consensus amongst modellers, academics and fisheries management consultants that the South Africanpelagic fishery is well managed and stable. Short-term declines in yield, as experienced by Oceana in the year ended September2005, are considered to be seasonal fluctuations in population size and distribution.
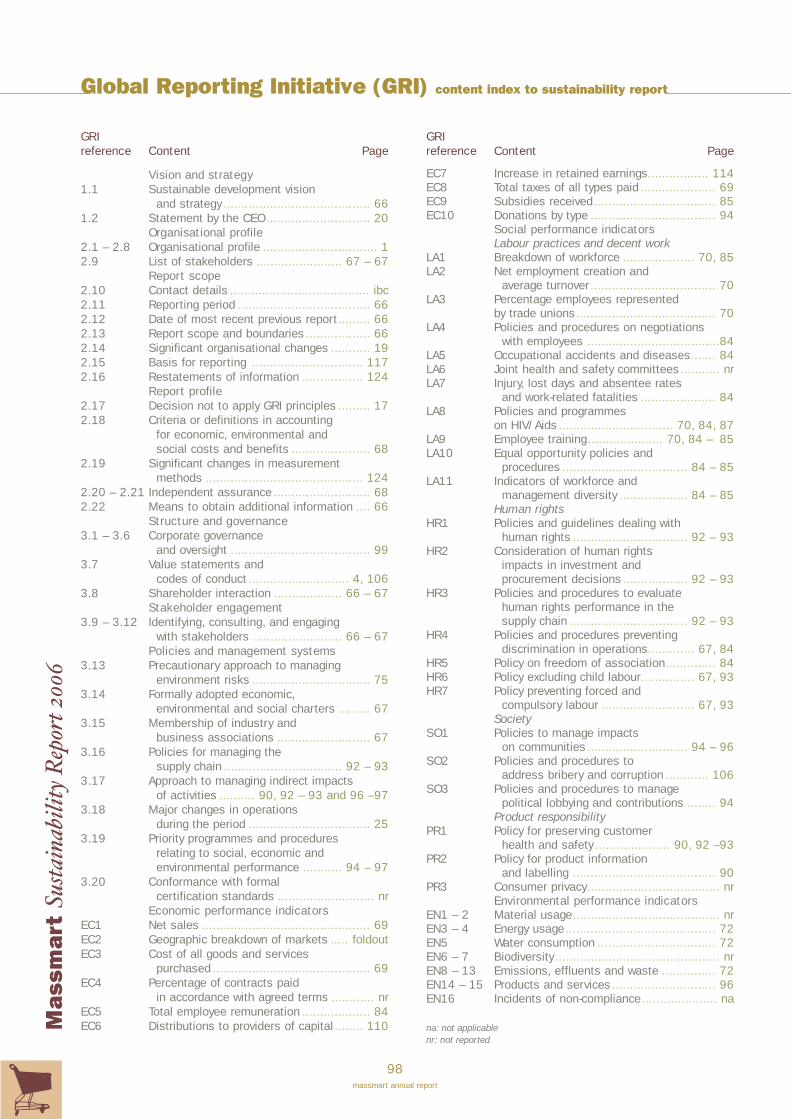
Global Reporting Initiative (GRI) content index to sustainability report
98massmart annual report
Mas
smar
tS
usta
inab
ilit
y R
epor
t 20
06
GRIreference Content Page
Vision and strategy1.1 Sustainable development vision
and strategy ......................................... 661.2 Statement by the CEO............................. 20
Organisational profile2.1 – 2.8 Organisational profile ................................ 12.9 List of stakeholders ........................ 67 – 67
Report scope2.10 Contact details ....................................... ibc2.11 Reporting period ..................................... 662.12 Date of most recent previous report......... 662.13 Report scope and boundaries .................. 662.14 Significant organisational changes ........... 192.15 Basis for reporting ............................... 1172.16 Restatements of information ................. 124
Report profile2.17 Decision not to apply GRI principles ......... 172.18 Criteria or definitions in accounting
for economic, environmental and social costs and benefits ...................... 68
2.19 Significant changes in measurement methods ............................................ 124
2.20 – 2.21 Independent assurance ........................... 682.22 Means to obtain additional information .... 66
Structure and governance3.1 – 3.6 Corporate governance
and oversight ....................................... 993.7 Value statements and
codes of conduct ............................ 4, 1063.8 Shareholder interaction ................... 66 – 67
Stakeholder engagement3.9 – 3.12 Identifying, consulting, and engaging
with stakeholders ......................... 66 – 67Policies and management systems
3.13 Precautionary approach to managing environment risks ................................. 75
3.14 Formally adopted economic,environmental and social charters ......... 67
3.15 Membership of industry and business associations .......................... 67
3.16 Policies for managing the supply chain ................................. 92 – 93
3.17 Approach to managing indirect impacts of activities .......... 90, 92 – 93 and 96 –97
3.18 Major changes in operations during the period .................................. 25
3.19 Priority programmes and procedures relating to social, economic and environmental performance ........... 94 – 97
3.20 Conformance with formal certification standards ........................... nr
Economic performance indicatorsEC1 Net sales ............................................... 69EC2 Geographic breakdown of markets ..... foldoutEC3 Cost of all goods and services
purchased ............................................ 69EC4 Percentage of contracts paid
in accordance with agreed terms ............ nrEC5 Total employee remuneration ................... 84EC6 Distributions to providers of capital ........ 110
GRIreference Content Page
EC7 Increase in retained earnings................. 114EC8 Total taxes of all types paid ..................... 69EC9 Subsidies received.................................. 85EC10 Donations by type ................................... 94
Social performance indicatorsLabour practices and decent work
LA1 Breakdown of workforce .................... 70, 85LA2 Net employment creation and
average turnover ................................... 70LA3 Percentage employees represented
by trade unions....................................... 70LA4 Policies and procedures on negotiations
with employees .....................................84LA5 Occupational accidents and diseases....... 84LA6 Joint health and safety committees........... nrLA7 Injury, lost days and absentee rates
and work-related fatalities ..................... 84LA8 Policies and programmes
on HIV/Aids ................................ 70, 84, 87LA9 Employee training..................... 70, 84 – 85LA10 Equal opportunity policies and
procedures ................................... 84 – 85LA11 Indicators of workforce and
management diversity ................... 84 – 85Human rights
HR1 Policies and guidelines dealing with human rights ................................ 92 – 93
HR2 Consideration of human rights impacts in investment and procurement decisions .................. 92 – 93
HR3 Policies and procedures to evaluate human rights performance in the supply chain ................................. 92 – 93
HR4 Policies and procedures preventing discrimination in operations............. 67, 84
HR5 Policy on freedom of association.............. 84HR6 Policy excluding child labour............... 67, 93HR7 Policy preventing forced and
compulsory labour .......................... 67, 93Society
SO1 Policies to manage impacts on communities ............................ 94 – 96
SO2 Policies and procedures to address bribery and corruption ............ 106
SO3 Policies and procedures to manage political lobbying and contributions ........ 94
Product responsibilityPR1 Policy for preserving customer
health and safety ..................... 90, 92 –93PR2 Policy for product information
and labelling ........................................ 90PR3 Consumer privacy..................................... nr
Environmental performance indicatorsEN1 – 2 Material usage......................................... nrEN3 – 4 Energy usage.......................................... 72EN5 Water consumption ................................. 72EN6 – 7 Biodiversity .............................................. nrEN8 – 13 Emissions, effluents and waste ............... 72EN14 – 15 Products and services............................. 96EN16 Incidents of non-compliance..................... na
na: not applicablenr: not reported

Corporate Governance
99massmart annual report
We will always ensure that we act in good faith, with care,diligence and skill in the way that we manage our business.
Codes and regulationsOur Group is committed to complying with all legislation,regulations and best practices relevant to the business.
For the period under review, the Board confirms that theGroup complied with almost every aspect of the Code ofCorporate Practices and Conduct as set out in the King IIReport on Corporate Governance. An index illustrating theGroup’s compliance to this code can be found on pages107 and 108.
The BoardThe Board of Massmart is responsible for directing the Grouptowards the achievement of the Massmart vision. The Boardis ultimately accountable for the development and executionof the Group’s strategy, operating performance and financialresults, practised within the Group’s formal governanceauthorities. The Board is responsible for its own composition,the appointment of the Chairman and Chief Executive Officer,and the constitution and composition of its committees.
The role of all directors is to bring independent judgementand experience to Board deliberations and decisions. At thefinancial year-end, the Massmart Board comprised fourexecutive directors and nine non-executive directors, all ofwhom are independent of Massmart and its shareholders.
Chris Seabrooke is Chairman of the Board and Mark Lambertiis Deputy Chairman and Chief Executive Officer. Briefbiographical details of each Board member are reported onpages 10 to 11.
All directors retire by rotation every three years. Unlessrequested to serve a further term by the Board, retiringdirectors are not proposed for re-election by the shareholders.In addition, shareholders must ratify the initial appointment ofeach director at the first annual general meeting ofshareholders following that director’s appointment.
Board process and evaluationThe Board meets five times a year and also on an ad hocbasis should a particular issue demand its attention. TheBoard’s authority is devolved sequentially through theMassmart Executive Committee, the Divisional Boards andthe Divisional Executive Committees as prescribed by theMassmart Governance Authorities. In addition, the Board hasdelegated certain specific responsibilities to BoardCommittees, as described more fully below.
Directors’ attendance at Board meetings:
Aug Nov Feb May2005 2005 2006 2006
CS Seabrooke
MJ Lamberti
MD Brand
ZL Combi
GRC Hayward
J Hodkinson x
P Langeni
IN Matthews
P Maw
DNM Mokhobo x x
S Nothnagel
GM Pattison
MJ Rubin x
The Board works to a formal agenda that covers strategy,structure, operating performance, growth initiatives and otherkey activities of the Group. To do so effectively, formaldocuments and minutes of all Board Committees are includedin the Board papers.
Directors are encouraged to take independent advice, atCompany cost, in the proper execution of their duties andresponsibilities. They have direct, unfettered access to theexternal auditors, professional advisers and to the advice andservices of the Company Secretary.
The Nomination and Remuneration Committee facilitates acomprehensive annual formal performance evaluation of theChief Executive Officer (CEO), comprising a self-evaluation; anevaluation of the CEO by every non-executive director by wayof a questionnaire which includes open-ended comments;and an appraisal of the CEO by each of his direct reportsusing a different questionnaire. The Chairman provides thesummary and feedback of the above to the CEO, and he isencouraged to probe and debate any aspect of the evaluationwith the full Board.
In addition, all Board members complete a detailed Boardself-assessment each year, probing the composition, duties,responsibilities, process and effectiveness of the Board. AllBoard Committee members complete a detailed self-assessment probing the composition, duties, responsibilities,process and effectiveness of their committees.
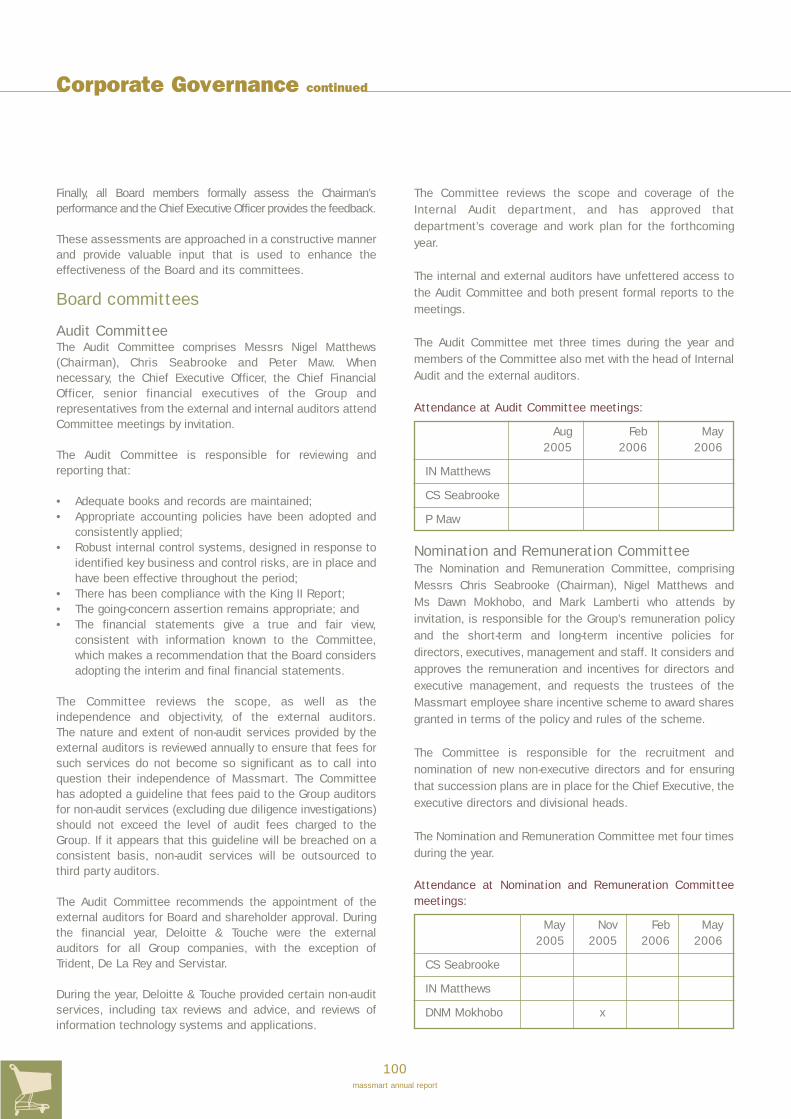
100massmart annual report
Finally, all Board members formally assess the Chairman’sperformance and the Chief Executive Officer provides the feedback.
These assessments are approached in a constructive mannerand provide valuable input that is used to enhance theeffectiveness of the Board and its committees.
Board committees
Audit CommitteeThe Audit Committee comprises Messrs Nigel Matthews(Chairman), Chris Seabrooke and Peter Maw. Whennecessary, the Chief Executive Officer, the Chief FinancialOfficer, senior financial executives of the Group andrepresentatives from the external and internal auditors attendCommittee meetings by invitation.
The Audit Committee is responsible for reviewing andreporting that:
• Adequate books and records are maintained;• Appropriate accounting policies have been adopted and
consistently applied;• Robust internal control systems, designed in response to
identified key business and control risks, are in place andhave been effective throughout the period;
• There has been compliance with the King II Report;• The going-concern assertion remains appropriate; and• The financial statements give a true and fair view,
consistent with information known to the Committee,which makes a recommendation that the Board considersadopting the interim and final financial statements.
The Committee reviews the scope, as well as theindependence and objectivity, of the external auditors.The nature and extent of non-audit services provided by theexternal auditors is reviewed annually to ensure that fees forsuch services do not become so significant as to call intoquestion their independence of Massmart. The Committeehas adopted a guideline that fees paid to the Group auditorsfor non-audit services (excluding due diligence investigations)should not exceed the level of audit fees charged to theGroup. If it appears that this guideline will be breached on aconsistent basis, non-audit services will be outsourced tothird party auditors.
The Audit Committee recommends the appointment of theexternal auditors for Board and shareholder approval. Duringthe financial year, Deloitte & Touche were the externalauditors for all Group companies, with the exception ofTrident, De La Rey and Servistar.
During the year, Deloitte & Touche provided certain non-auditservices, including tax reviews and advice, and reviews ofinformation technology systems and applications.
The Committee reviews the scope and coverage of theInternal Audit department, and has approved thatdepartment’s coverage and work plan for the forthcomingyear.
The internal and external auditors have unfettered access tothe Audit Committee and both present formal reports to themeetings.
The Audit Committee met three times during the year andmembers of the Committee also met with the head of InternalAudit and the external auditors.
Attendance at Audit Committee meetings:
Aug Feb May2005 2006 2006
IN Matthews
CS Seabrooke
P Maw
Nomination and Remuneration CommitteeThe Nomination and Remuneration Committee, comprisingMessrs Chris Seabrooke (Chairman), Nigel Matthews andMs Dawn Mokhobo, and Mark Lamberti who attends byinvitation, is responsible for the Group’s remuneration policyand the short-term and long-term incentive policies fordirectors, executives, management and staff. It considers andapproves the remuneration and incentives for directors andexecutive management, and requests the trustees of theMassmart employee share incentive scheme to award sharesgranted in terms of the policy and rules of the scheme.
The Committee is responsible for the recruitment andnomination of new non-executive directors and for ensuringthat succession plans are in place for the Chief Executive, theexecutive directors and divisional heads.
The Nomination and Remuneration Committee met four timesduring the year.
Attendance at Nomination and Remuneration Committeemeetings:
May Nov Feb May2005 2005 2006 2006
CS Seabrooke
IN Matthews
DNM Mokhobo x
Corporate Governance continued
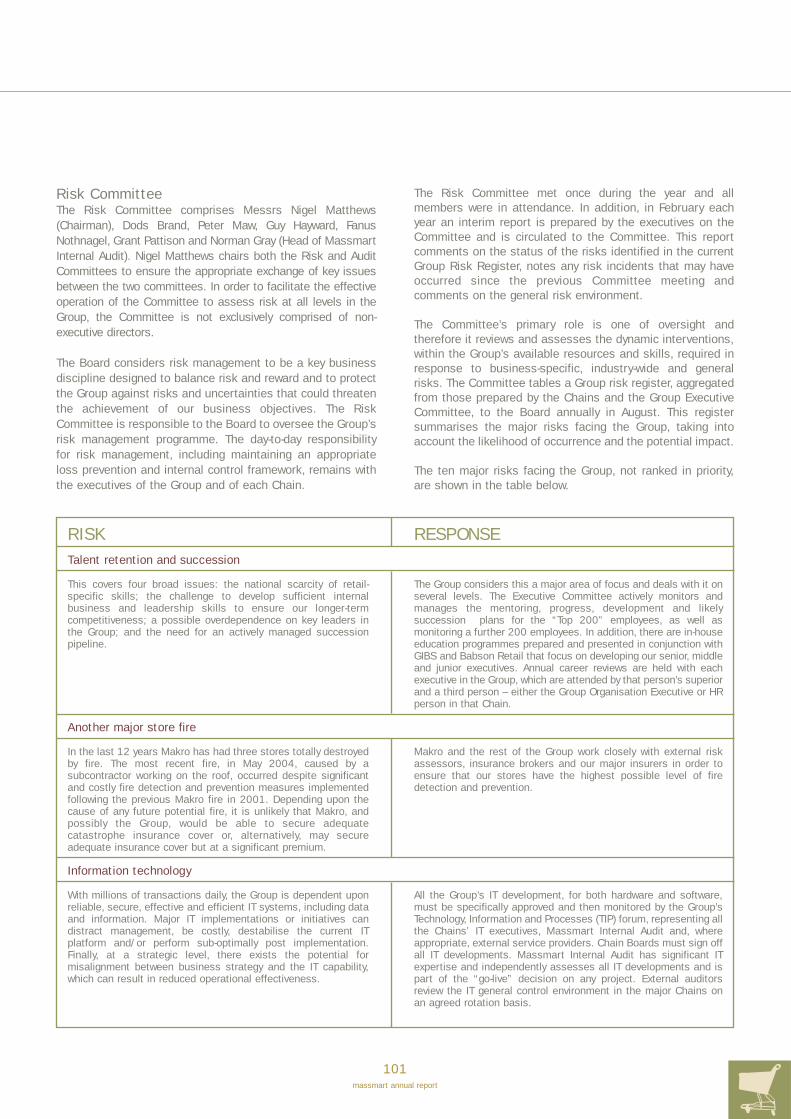
101massmart annual report
Risk CommitteeThe Risk Committee comprises Messrs Nigel Matthews(Chairman), Dods Brand, Peter Maw, Guy Hayward, FanusNothnagel, Grant Pattison and Norman Gray (Head of MassmartInternal Audit). Nigel Matthews chairs both the Risk and AuditCommittees to ensure the appropriate exchange of key issuesbetween the two committees. In order to facilitate the effectiveoperation of the Committee to assess risk at all levels in theGroup, the Committee is not exclusively comprised of non-executive directors.
The Board considers risk management to be a key businessdiscipline designed to balance risk and reward and to protectthe Group against risks and uncertainties that could threatenthe achievement of our business objectives. The RiskCommittee is responsible to the Board to oversee the Group’srisk management programme. The day-to-day responsibilityfor risk management, including maintaining an appropriateloss prevention and internal control framework, remains withthe executives of the Group and of each Chain.
The Risk Committee met once during the year and allmembers were in attendance. In addition, in February eachyear an interim report is prepared by the executives on theCommittee and is circulated to the Committee. This reportcomments on the status of the risks identified in the currentGroup Risk Register, notes any risk incidents that may haveoccurred since the previous Committee meeting andcomments on the general risk environment.
The Committee’s primary role is one of oversight andtherefore it reviews and assesses the dynamic interventions,within the Group’s available resources and skills, required inresponse to business-specific, industry-wide and generalrisks. The Committee tables a Group risk register, aggregatedfrom those prepared by the Chains and the Group ExecutiveCommittee, to the Board annually in August. This registersummarises the major risks facing the Group, taking intoaccount the likelihood of occurrence and the potential impact.
The ten major risks facing the Group, not ranked in priority,are shown in the table below.
RISKTalent retention and succession
This covers four broad issues: the national scarcity of retail-specific skills; the challenge to develop sufficient internalbusiness and leadership skills to ensure our longer-termcompetitiveness; a possible overdependence on key leaders inthe Group; and the need for an actively managed successionpipeline.
Another major store fire
In the last 12 years Makro has had three stores totally destroyedby fire. The most recent fire, in May 2004, caused by asubcontractor working on the roof, occurred despite significantand costly fire detection and prevention measures implementedfollowing the previous Makro fire in 2001. Depending upon thecause of any future potential fire, it is unlikely that Makro, andpossibly the Group, would be able to secure adequatecatastrophe insurance cover or, alternatively, may secureadequate insurance cover but at a significant premium.
Information technology
With millions of transactions daily, the Group is dependent uponreliable, secure, effective and efficient IT systems, including dataand information. Major IT implementations or initiatives candistract management, be costly, destabilise the current ITplatform and/or perform sub-optimally post implementation.Finally, at a strategic level, there exists the potential formisalignment between business strategy and the IT capability,which can result in reduced operational effectiveness.
RESPONSE
The Group considers this a major area of focus and deals with it onseveral levels. The Executive Committee actively monitors andmanages the mentoring, progress, development and likelysuccession plans for the “Top 200” employees, as well asmonitoring a further 200 employees. In addition, there are in-houseeducation programmes prepared and presented in conjunction withGIBS and Babson Retail that focus on developing our senior, middleand junior executives. Annual career reviews are held with eachexecutive in the Group, which are attended by that person’s superiorand a third person – either the Group Organisation Executive or HRperson in that Chain.
Makro and the rest of the Group work closely with external riskassessors, insurance brokers and our major insurers in order toensure that our stores have the highest possible level of firedetection and prevention.
All the Group’s IT development, for both hardware and software,must be specifically approved and then monitored by the Group’sTechnology, Information and Processes (TIP) forum, representing allthe Chains’ IT executives, Massmart Internal Audit and, whereappropriate, external service providers. Chain Boards must sign offall IT developments. Massmart Internal Audit has significant ITexpertise and independently assesses all IT developments and ispart of the “go-live” decision on any project. External auditorsreview the IT general control environment in the major Chains onan agreed rotation basis.

102massmart annual report
RISKIntegration of acquisitions
In the 2005 financial year, Massmart acquired three significantbusinesses. In the absence of compensating controls andinterventions, acquisitions raise the level of organisational risk.In addition, there is the need to ensure that the new businessesare readily integrated into the Group. This must occur withoutharming the acquired businesses’ strategies, management andorganisational culture. In addition, this integration will necessarilyoccupy significant time and focus from the relevant Group andChain executives in order to ensure the appropriate levels ofgrowth and profitability over the longer term.
HIV/Aids
This refers to the impact of the virus on Massmart and itsbroader community. Outside of the terrible human tragedy,potential business impacts include higher levels of employeedeaths, reduced available skills, lower productivity and higherabsenteeism, and higher direct and indirect costs of employment.
Slowing or low growth markets
There is the possibility of unnecessarily increasing the Group’smarket shares in potentially low or no-growth South Africanmarkets and/or the rate of market growth slowing dramatically inthe Group’s major categories. Both of these potential scenarioswould have adverse financial consequences over the longer term.
This concern focuses on two potential impacts, the first being thefinancial impact on the business’s trading and the second beingthe possible adverse effect on consumer expenditure.
With approximately 30% of all merchandise sales being imported,directly and indirectly, any sudden changes in the exchange ratewill affect inventory valuation, although there may be a lag wherethe Group has entered into forward exchange contracts on itsown direct imports to combat this eventuality. Furthermore,foreign currency fluctuations in those African countries whereGame operates stores can also affect the level of sales andearnings reported by those stores in South African currency, aswell as causing a potentially adverse balance sheet translationdifference.
RESPONSE
All acquisitions must meet Massmart’s strategic criteria. Thisensures that, once acquired, sustainable value-enhancing activitiesshould more readily flow between Massmart and the acquiredbusinesses. Group executives, assisted by Massmart InternalAudit, perform detailed due diligence investigations, includingthorough discussions with local executives. Integration does notnecessarily mean that IT platforms or common business functionsmust be combined – this is only done if it provides a longer-termbenefit to the acquired business.
Over the last three years, HIV prevalence has been measured in allthe Chains by an external agency. The recent acquisitions have notyet been tested. The Group’s estimated infection rate, usingstatistical methods, is 6.9% amongst permanent employees and12% amongst temporary employees. All the Chains are at variousstages of rolling out Aids support initiatives and offering voluntarycounselling and testing programmes. Massmart has alsoimplemented a comprehensive HIV/Aids Awareness and TreatmentProgramme which incudes the provision of free Anti-retrovirals to allpermanent staff and their spouses.
Massmart is careful to monitor and measure our own sales growth, perChain, and our growth relative to the market, i.e. market sharemovements. The Group reviews new product categories andbusinesses within strict strategic criteria, and only considersexpansion in those markets that offer good growth opportunities. Allstore opening decisions are approved at Group level after beingfinancially assessed against a 10-year view of the socio-demographicsof that particular market (this view is provided by external researchers).
All direct foreign exchange trading liabilities are covered forward,resulting in certainty about the expected landed cost ofmerchandise and also providing a four to six-month buffer againstchanging the cost of imported inventory should there be anysudden deterioration in the exchange rate. The value of inventoryin the supply chain between manufacturer and retailer has alsobeen actively managed lower by all industry participants. Thisreduces the extent of any imported inventory that is over- orundervalued following a sudden change in the exchange rate.
Interest rates on the Group’s medium-term debt is fixed to providecertainty as to the future cost of this funding, and this will keep theGroup immune to any adverse increases in corporate borrowingrates.
Volatility in exchange rates, local interest or inflation rates
Corporate Governance continued

103massmart annual report
RISK
Increases in interest rates will make South African corporatefunding more expensive, with an adverse impact on profitability.
Higher inflation rates may affect Group profitability where thesecost increases cannot be controlled or additional productivityassociated with those is not forthcoming.
Lower inflation rates may make long-term property leases, withhigher fixed escalation rates, appear expensive and potentiallyaffect profitability.
South African consumer behaviour appears to be more affectedby sudden changes in economic variables, including exchangerates and local interest and inflation rates, than by gradualchanges in these variables. It follows that a sudden deteriorationin one or several of these economic variables may dampen levelsof consumer expenditure, thereby reducing sales growth andpotentially Chain or Group profitability too.
Insufficient progress with transformation
There is the possibility of adverse or undue reputational exposuredue to the Chains or the Group not fulfilling, or underdeliveringon, BEE requirements. In the broader national context,inadequate transformation at all levels by us or other SouthAfrican businesses will curb the country’s longer-term growthpotential and maintain the current unacceptable andunsustainable levels of social and economic inequality.
This issue specifically includes insufficient black representationat Group and Chain executive level.
Fraud, security and crime
There is the risk of human, financial and reputational exposurethrough high levels of inventory shrinkage, armed robberies forcash or merchandise, and losses from fraud, both internal andexternal. The rate of armed and violent incidents of crime hasincreased to unacceptable levels. Unchecked, this can adverselyaffect employees, customers, the business and the overallbusiness environment.
Game stores in Africa
Game has nine stores in sub-Saharan Africa, and another threeto be opened in the next year. The level of complexity unavoidablyincreases with the greater distances involved, the associatedcommunication and logistical challenges and the multipleregulatory environments. There is also the increased exposure toforeign currencies and the related potential volatility of Rand-reported sales and earnings. There is the small andunpredictable risk that a store’s earnings, assets and/orinventory may be seized or prevented from being accessed byMassmart.
RESPONSE
Where possible, property lease escalation rates are negotiated aslow as possible, taking market conditions into account, and certainolder property leases have been renegotiated to be inflation-linked,within a cap (maximum rate) and collar (minimum rate).
Salary and wage increases are negotiated in the context of thecurrent South African socio-economic environment, and where anegotiated increase may be higher than is suitable, productivitymeasures may be introduced to reduce the net cost of the higherwages.
The Board-approved BEE strategy, dated February 2004 andcovering all the elements of the Code of Good Practice, has beeneffectively implemented group-wide and we believe that muchprogress has been achieved in little time.
A BEE share issue amounting to 10% of the pre-dilution shares ofMassmart was announced in May 2006 and is effective 1 October2006. All permanent Massmart employees, not alreadyparticipants in the current share trust, are beneficiaries. The rightsawarded to general staff have voting and dividend rights.
The Group is continually improving its procedures and controls toensure that the risk of potential losses or injury through criminalincidents is minimised. Massmart is also an active participant inthe Business Against Crime/ECR forum that shares information onall incidents of crime across the major retail chains. There is awhistle-blowing facility, Tipoffs Anonymous, through whichemployees, customers or suppliers can report unethical ordishonest acts. Staff fraud is dealt with severely.
A thorough country pre-evaluation, which must include transparentforeign exchange repatriation, before agreeing to enter eachcountry. There is a dedicated team, led by a senior executive,responsible for all Game’s African stores. The risk diversifiesslightly with multiple African stores.
Volatility in exchange rates, local interest or inflation rates (continued)

Sustainability CommitteeThe Sustainability Committee comprises Messrs KK Combi(Chairman), Dods Brand, Michael Rubin, Grant Pattison andBrian Leroni (Group Corporate Affairs Executive), and MmesPhumzile Langeni, Dawn Mokhobo.
The role of the Committee is to assist the Group to dischargeits business sustainability responsibility with respect to theimplementation of practices that are consistent with goodcorporate citizenship.
Executive CommitteeThe Massmart Executive Committee is the most seniorexecutive decision-making body in the Group. The Committeeis chaired by the Chief Executive Officer (Mark Lamberti)and comprises the Chief Financial Officer (Guy Hayward),the Chief Executive Officer Designate (Grant Pattison), theChief Operating Officer (Fanus Nothnagel), the Deputy ChiefFinancial Officer (Aubrey Cimring), the Group OrganisationalExecutive (Steve Glendinning) and the four Divisional ChiefExecutives (Robin Wright, Richard Potash, Joe Owens andKevin Vyvyan-Day).
The Committee deliberates, takes decisions or makesrecommendations on all matters of strategy and operations.Within the parameters described by the Board-approvedGovernance Authorities, the decisions or recommendationsare sometimes referred to the Board or its relevantcommittee for final approval, while in other cases the powerto take decisions is delegated to individual subsidiary boards,or subsidiary executive committees.
The Executive Committee has specific responsibility, interalia, for:• Monitoring and measuring the structures, trends and
performance of markets and competition;• Strategic planning;• Defining, configuring, financing and structuring the
Group’s portfolio of assets;• Shaping and approving the competitive strategies,
operating plans and budgets of the divisions andfunctional departments;
• Measuring, monitoring and taking proactive correctiveaction on divisional performance;
• Ensuring adequate risk management, controls andgovernance throughout the Group; and
• Shaping and approving succession plans and seniorexecutive management appointments.
In many respects, the relationship between the MassmartBoard and the Executive Committee is analogous to theSupervisory Board and Management Board relationship foundin the European governance model.
Remuneration of directors and executivesMassmart strives for remuneration policies that enable it torecruit, retain and motivate the executive talent neededto achieve superior performance. The Nomination andRemuneration Committee, with periodic advice from externalexecutive remuneration consultants, ensures the provision ofexecutive remuneration packages that are competitive withreference to other major South African retail companies, aswell as other companies similar to Massmart in their size,spread and complexity.
The Massmart remuneration policy strives for fixedremuneration at the median of comparable positions, butplaces particular emphasis on generous annual incentives forhigh performance for both executive directors and executivemanagement. This policy, communicated to and understoodby the Group’s executives, codifies a range of performanceincentives linked to annual earnings-per-share growth targetsfor the Group in excess of average CPIX plus 10%, or profitbefore tax targets for each division, as appropriate. Duringthe year, for the first time, an incentive bonus was institutedfor non-financial performance. Starting in 2006 Group andDivisional Executives will be incentivised on the achievementof employment equity targets approved by the Nomination andRemuneration Committee. This incentive will amount tobetween one and three months’ salary in addition to theearnings per share/ profit before tax growth bonuses, lessthan nine months salary. The Nomination and RemunerationCommittee also has the discretion to reward superiorindividual performance.
In addition, longer-term equity incentive plans ensure thealignment of executive reward with shareholders’ interests, inparticular the sustained creation of shareholder value. Newissues of annual allocations of shares or options are onlyallowed when Massmart’s growth in earnings per share in theprior year exceeds average CPIX plus 10%. The amountallocated is based upon a factor of the executive’s total prioryear remuneration plus incentive bonus.
With effect from July 2002, only members of the MassmartExecutive Committee can elect to receive scheme shares,whilst all other participants receive options.
Non-executive directors receive fees in the top quartile for theirrole as directors and members and for their roles on BoardCommittees.
Details of individual directors’ remuneration are provided onpages 152 to 156.
Shareholder communicationWe strive to provide generous and frequent disclosure to ourshareholders, regardless of how hard this may be in periodsof difficulty or underperformance.
Massmart reports formally to shareholders twice a year (inFebruary and August) when its half-year and full-year results,together with an Executive Review, are announced and issuedto shareholders and the media. On both occasions the ChiefExecutive Officer, Chief Financial Officer and selected seniormanagement give presentations to institutional investors,analysts and the media.
Early in January and July, shortly after the conclusion of thehalf-year and full-year trading periods, on release of theannual report and at the Group’s annual general meeting inNovember, Massmart releases trading statements reportingon the Group’s year-to-date sales performance.
During the year, apart from closed periods, the ChiefExecutive Officer, Chief Executive Officer Designate and ChiefFinancial Officer meet regularly, but never alone, withinstitutional shareholders and, in addition, are available formeetings with analysts and any existing or prospectiveMassmart shareholder.
104massmart annual report
Corporate Governance continued

105massmart annual report
Massmart’s website, www.massmart.co.za, provides financialand business information about the Group and includeselectronic copies of all recent formal announcements, publicstatements and presentations made by Massmart.
Share buy-back programmeIn the previous financial years, the shareholders in generalmeeting gave the Group the authority – valid until this year’sannual general meeting and subject to the ListingsRequirements of the JSE Limited (“the JSE”) – to purchase itsown shares up to a maximum of 15% of the issued shares, ata price not greater than 10% above the preceding five-dayweighted average. Shareholders have been asked to renewthis authority at the forthcoming November 2006 annualgeneral meeting.
No shares were repurchased in the year to June 2006. Theamount and timing of any future purchases will be determinedby the Board and are dependent on prevailing market conditionsand other factors. The share trust will acquire shares from timeto time to partially mitigate the dilution caused by the Companyissuing new shares when options are exercised.
Share dealingsNo director, executive or employee may deal, directly or indirectly,in Massmart shares where that person may be aware ofunpublished price-sensitive information. There are strict closedperiods during which all directors, executives and employees arenot allowed to deal in Massmart shares. The periods begin onemonth prior to the end of each reporting date (these reportingdates being 31 December and 30 June) and end on release ofthe Group results. A closed period also applies wheneverMassmart issues a cautionary announcement.
In addition, all directors, executives and employees are notallowed to deal in Massmart shares in the final hour oftrading on the JSE. All share dealings by a director, executiveor employee must be authorised by either the Chief ExecutiveOfficer or Chief Financial Officer. Any dealings by the ChiefExecutive Officer are authorised by the Chairman.
Accountability, risk and controlThe Board recognises its responsibility to report a balancedand accurate assessment of the Group’s financial results andposition, its business, operations and prospects. Aspects ofhow this is achieved are covered in the section below.
Internal control frameworkMassmart maintains clear principles and proceduresdesigned to achieve accountability and control across theGroup. These are codified in the Governance and ApprovalsFramework that describes the specific levels of authority andthe required approvals necessary for all major decisions atboth Group and divisional level. Through this framework,operational and financial responsibility is formally and clearlydelegated to the divisional and Chain boards. This isdesigned to maintain an appropriate control environmentwithin the constraints of Board-approved strategies andbudgets, while providing the necessary local autonomy forday-to-day operations.
Audit CommitteeThe Audit Committee receives regular reports on Groupcompanies’ financial performance, internal controls,
adherence to accounting policies and areas of significantrisk, amongst others. After considering these reports, theCommittee formally reports to the Board, twice each year,regarding the overall framework and effectiveness of controls.
Internal AuditMassmart Internal Audit comprises a dedicated team of30 staff that, although managed from Massmart Corporate, isdeployed group-wide. The responsibilities of Internal Audit aredefined and governed by a Charter approved by the AuditCommittee and Board. The Head of the Massmart InternalAudit department reports functionally to the Audit Committee,to ensure the department’s independence, and reports onlyadministratively to the Chief Financial Officer. Internal Audithas unfettered access to the Board and all information withinthe Massmart Group. All functions across all operatingdivisions are subject to review by Internal Audit and allemployees are required to cooperate positively. The InternalAudit team comprises appropriately qualified and experiencedpersonnel, including internal audit professionals andmanagers with retail experience, to ensure the delivery of arelevant and high quality service.
Massmart Internal Audit applies a risk-based audit approachthat aligns its audit methodology to the internal and, whereapplicable, external risks facing Massmart. The annual auditplan, which is pre-approved by the Audit Committee, isdetermined through a continuous assessment andunderstanding of risks facing the Group. Where necessarysome audit tasks are outsourced to consultants withappropriate skills, for example certain forensic work or highlyspecialised IT reviews. Internal Audit utilises auditprogrammes and technologies which are designed andselected after assessing the significant business, strategicand control risks. The results of these programmes provideaudit assurance regarding the adequacy and effectiveness ofcontrols. In addition to providing this assurance, MassmartInternal Audit applies its knowledge and understanding toadvise local and executive management on best practiceprocesses and controls that could be implemented toimprove overall effectiveness and efficiency.
The Internal Audit team, which has the unequivocal supportof the Board and the Audit Committee, on a quarterly basisformally reports any material findings and matters ofsignificance to the Divisional Boards and the AuditCommittee. The reports highlight whether actual or potentialrisks to business are being appropriately managed andcontrolled. Progress in addressing previous unsatisfactoryaudit findings is monitored until Internal Audit can report theproper resolution of the problem area. In addition, the Headof Internal Audit formally attends all Divisional Boardmeetings twice per annum and provides an advisory role toboth the Risk Committee and the Ethics Committee.
There is significant Internal Audit involvement in InformationTechnology throughout the Group in order to ensuresatisfactory IT governance and assurance. All new major ITsystems in the Group require specific Massmart InternalAudit sign off prior to implementation. The Internal Audit roleis twofold – to assess the process and controls around largeIT projects at significant phases of these projects; and toassess the control environment within existing IT systemsand the Group’s general computer control environment.

106massmart annual report
Massmart Internal Audit and External Audit scope and effortsare properly coordinated in order to provide efficient andeffective assurance to the Audit Committee.
RiskThe Board assesses the risks in the Group’s businessenvironment, with a view to eliminating or reducing them inthe context of the Group’s strategies and operations.
Litigation and legalIn the normal course of business, Massmart is subject tovarious legal proceedings, actions and claims. These mattersare subject to risks and uncertainties that cannot be reliablypredicted. The Board does not believe that there is anymaterial pending or threatened legal action.
Information technologyProtecting Massmart’s electronic assets is increasinglycomplex as networks, systems and electronic data expandand, in some cases, are shared with third parties andbusiness partnerships. Depending on the internet forcommunication brings additional risk. Ensuring proper systemsecurity, data integrity and business continuity is theresponsibility of the Board, but is given effect by the AuditCommittee, the Risk Committee, the Massmart Technology,Information and Process Forum and Massmart’s formallycontracted information technology business partners andproviders.
Financial risk and appraisalFinancial targets agreed in Group budgets and strategyprocesses are predicated on assumptions about the futurethat are uncertain and may prove incorrect or inaccurate. Themonitoring and management of this risk is the responsibilityof the Executive Committee. Monthly performance ismeasured and compared to the budget and prior year, andcorrective or remedial action taken as appropriate.
Despite extensive financial, accounting and managementcontrols and procedures, including reviews by internal andexternal auditors, there are risks arising from the Group’scash management and treasury operations, direct andindirect taxation, and employee or third-party fraud oreconomic crime.
Corporate ethics and complianceMassmart is committed to achieving the highest standards ofethical behaviour and continued its strong emphasis onpromoting awareness of, and compliance with, Massmart’sCode of Ethical Practice.
Massmart maintained its close relationship with the EthicsInstitute of South Africa and a further three employeesattended the Ethics Officers Certification course and twomore employees were accredited as ethics officers.Furthermore, the Institute requested that Massmart providematerial for an ethics case study that is to be included in abooklet that will be distributed by the United Nations tomultinational companies and governments around the world.
The appointment of ethics officers in all chains, including therecently acquired Massbuild division, and the formulation andregular meeting of the Group Ethics Forum have ensured thecontinued focus on the consistent application of ethicspractice and training in the organisation.
The Massmart Ethics Line provides an important indication ofthe status of the ethics climate in Massmart. The fullyindependent line, the operation of which is outsourced toDeloitte & Touche, provides employees and suppliers with theopportunity to report perceived cases of unethical practice.All reports received are thoroughly investigated and actedupon under the guidance of the Group Ethics Officer who isaccountable, from an ethics perspective, to the MassmartAudit Committee.
For the year under review it was pleasing that theawareness of the Ethics Line improved considerably withtotal calls for the year 93% higher than the previous yearand the increase in calls related to alleged criminal activityincreasing 85% on the previous year. All criminal calls wereinvestigated and ten of these led to the termination of theemployment of the individuals concerned. In certaincases, an independent forensic auditing company isretained to oversee investigations of crime related calls inorder to improve the likelihood of successful criminalconviction in a court of law.
Summary of calls to the Massmart Ethics Line from July 2005to June 2006
Period Total Crime HR Other Anony-calls related related calls mous
calls calls calls
July 26 1 5 20 40%
August 39 1 3 35 50%
September 29 6 3 20 67%
October 50 12 12 26 38%
November 47 0 22 25 64%
December 23 4 5 14 55%
January 18 2 7 9 89%
February 24 3 7 14 60%
March 33 3 13 17 50%
April 48 7 13 28 55%
May 45 6 13 26 58%
June 46 3 8 35 82%
Total 428 48 111 269 –
Corporate Governance continued

107massmart annual report
King IIreference Content Page2. Boards and directors2.1 The Board ............................................................102.1.1 Accountable and responsible for company
performance and affairs .....................................992.1.2 Unitary board structure of executive
and non-executive directors ................................992.1.3 Provide strategic direction, appoint CEO
and plan succession ..........................................162.1.4 Full and effective control over company..................992.1.5 Ensure compliance to laws, regulations
and codes of business practice ..........................992.1.6 Define levels of materiality.....................................nr2.1.7 Unrestricted access to all company information......992.1.8 Develop corporate code of conduct.........................nr2.1.9 Option of independent professional advice.............992.1.10 Consider effectiveness due to size,
diversity and demographics.................................682.1.11 Identify key risk areas and key
performance indicators.....................................1012.1.12 Identify and monitor non-financial aspects .............682.1.13 Record facts and assumptions
concluding going-concern status........................1002.1.14 Explain effect of proposed special
resolutions in notice.........................................1772.1.15 Encourage shareholders to attend AGM ...............1752.1.16 CV of director standing for election or
re-election at AGM to accompany notice in annual report .................................................10
2.1.17 Charter of responsibilities disclosed in annual report .................................................99
2.1.18 Balance corporate governance and entrepreneurship..............................................105
2.2 Board composition ................................................102.2.1 Balance of executive and
non-executive directors .......................................152.2.2 Procedures for appointments
to the Board ......................................................992.2.3 Programme ensuring staggered rotation
for Board continuity ............................................992.3 Chairperson and Chief Executive Officer ..................992.3.1 Clear division of responsibilities ......................16, 992.3.2 Chairperson preferably independent
and non-executive ..............................................102.3.3 Functions of CEO and Chairperson
to be separate ...................................................992.3.4 Requirements where role of CEO and
Chairperson are not separate..............................na2.3.5 Board to appraise performance of Chairperson ....1002.3.6 Chairperson to appraise performance of CEO.........992.4 Directors ..............................................................102.4.1 Appropriate balance of power and authority .............nr2.4.2 Quality of non-executive directors ..........................152.4.3 Capacity of directors categorised in
annual report .....................................................102.4.4 Shadow directors to be discouraged .......................nr2.4.5 Holding non-executive directorships
in other companies ............................................102.4.6 Formal orientation programme for
incoming directors...............................................nr2.4.7 New directors to receive development
and education.....................................................nr2.4.8 “Fit and proper” test for new directors....................nr2.5 Remuneration ....................................................1522.5.1 Sufficient for quality required by Board.................1522.5.2 Appoint Remuneration Committee .........................99
King IIreference Content Page2.5.3 Membership of Remuneration Committee
disclosed in annual report and chairperson to attend AGM .................................................100
2.5.4 Full disclosure of director remuneration on individual basis ...........................................153
2.5.5 Substantial part of remuneration to be performance-based..................................152
2.5.6 Shareholders to approve share options granted to non-executive directors .......................na
2.5.7 Factors to consider when issuing share options ....................................................84
2.5.8 Overriding principle of full disclosure by director applies to all share schemes................155
2.5.9 Executive directors’ fixed-term contracts should not exceed three years ..........................112
2.5.10 Statement of Remuneration Philosophy in annual report .................................................84
2.5.11 Remuneration Committee to play integral part in succession planning of CEO and Executive Committee .................................100
2.5.12 Remuneration Committee to determine non-executive director fees and approval to be obtained at AGM .............................100, 175
2.6 Board meetings ....................................................992.6.1 Meet at least quarterly and disclose
in annual report .................................................992.6.2 Efficient and timeous briefing of Board ...................nr2.6.3 Non-executive directors to have access
to management..................................................992.6.4 Regular review of effectiveness of
internal controls...............................................1002.6.5 Inclusion of relevant non-financial information ......1042.7 Board Committees ..............................................1002.7.1 Assist board ........................................................992.7.2 Formal delegation of duties and
responsibilities to committees ............................992.7.3 To have clear terms of reference, life span,
function, reporting process and scope of authority ............................................100
2.7.4 Transparency and full disclosure to the board.......1002.7.5 Minimum requirement: Audit and
Remuneration committees ................................1002.7.6 Non-executive directors to play important role ......1002.7.7 Preferably chaired by independent
non-executive director.......................................1002.7.8 Free to take independent outside advice................992.7.9 Disclose composition, objectives and meetings
held in annual report; and chairpersons to attend AGM .....................................................100
2.7.10 Subject to regular evaluation by Board...................992.8 Board and Director evaluation................................992.8.1 Board effectiveness to be assessed and 2.8.2 at least annually ................................................992.9 Dealings and securities .......................................1112.9.1 Formal policy concerning closed periods and 2.9.2 of trading.........................................................1052.10 Company secretary .............................................1102.10.1 Pivotal role in corporate governance .......................nr2.10.2 Empowered to fulfil duties......................................nr2.10.3 Provide guidance to directors with regard
to discharge of their duties.................................992.10.4 Induct new directors and assist CEO
with annual Board plan ........................................nr2.10.5 Central source of guidance and advice
on ethics and good governance...........................992.10.6 Subject to “fit and proper” test ...........................110
King II Report (2002) Index for Corporate GovernanceThe following index represents the Group’s compliance with the King II Report. More detail can be found on pages 99 to 106 ofthis report.

108massmart annual report
King IIreference Content Page3. Risk management3.1 Responsibility3.1.1 Board responsible for risk management process,
management accountable for execution.............1013.1.2 Set risk strategy policies and
communicate to employees ..............................1013.1.3 Determine company’s tolerance for risk ...............1013.1.4 Maintain sound system of risk management
and internal controls to provide assurance of organisational objectives ..............................101
3.1.5 Ensure documented assessment of key risks at least annually ......................................101
3.1.6 Board Committee to review risk management process and significant risks ............................101
3.1.7 Risk management and internal control to be embedded in company practice .........................101
3.1.8 Confidential reporting process to cover fraud and other risks........................................106
3.2 Application and reporting3.2.1 Comprehensive system of control
to be established .............................................1053.2.2 Risks to be assessed on on-going basis ..............1013.2.3 Develop system of risk management that
enhances stakeholders’ interests .....................1013.2.4 Board to identify and monitor key risk areas
and performance indicators ..............................1013.2.5 Reports from management to provide balanced
assessment of risks and effectiveness of system of control .............................................101
3.2.6 Board responsible for disclosure in annual report ...................................................101
3.2.7 Risk to be viewed from negative and positive perspective ...........................................66
4. Internal Audit (IA)4.1 Status and role4.1.1 Effective internal audit function ...........................1054.1.2 Board to formally define purpose,
authority and responsibility ...............................1054.1.3 Consistent with Institute of
Internal Auditors (IIA)...........................................nr4.1.4 Head of IA to report to CEO and have full
access to chairpersons of the Board and Audit Committee ..............................................105
4.1.5 Report at all Audit Committee meetings...............1054.1.6 Audit Committee involved with appointment/
dismissal of head of IA........................................nr4.1.7 Segregation of duties between internal
and external audit ............................................1054.2 Scope of internal audit4.2.1 Independent, objective assurance and
consulting activity.............................................1054.2.2 Provide assurance on processes and
confirmation of control systems ........................1054.2.3 IA plan based on risk assessment.......................1054.2.4 Audit Committee to approve IA work plan.............1054.2.5 Co-ordinate with internal and external
providers of assurance to ensure proper coverage of controls ..............................105
5. Integrated sustainability reporting5.1 Sustainability reporting5.1.1 Report at least annually........................................665.1.2 Report on adopted principles,to 5.1.4 implementation of practices and demonstration
of resulting changes and benefits............68 and 755.2 Organisational integrity/code of ethics5.2.1 Codify standards of ethical behaviour ..................1065.2.2 Demonstrate commitment to code.......................1065.2.3 Disclosure of adherence to code .........................1065.2.4 Dealings with individuals/entities
without same level of integrity...........................106
King IIreference Content Page6. Accounting and auditing6.1 Auditing and non-audit services6.1.1 Audit Committee to recommend external
auditors...........................................................1006.1.2 Auditors’ professional ethics and
independence ..................................................1006.1.3 External auditors to work in conjunction
with Internal Audit ............................................1066.1.4 Consultation between external and
internal auditors...............................................1066.1.5 Audit Committee to set principles for utilisation
of external auditors for non-audit services .........1006.2 Reporting of financial and non-financial
information6.2.1 Audit Committee to determine review
level of interim report .......................................1006.2.2 Reasons and auditors review tabled at
board meeting .................................................1056.2.3 Facts and assumptions used in going-concern
assessment to be minuted by the Board ...........1126.2.4 Review going-concern assessment at interim...........nr6.2.5 State where non-financial aspect subject
to external validation ...........................................nr6.2.6 Distribution via broad range of
communication channels ............................67, 1046.3 Audit Committee6.3.1 Board-appointed with majority
independent non-executive directors..................1006.3.2 Chairperson to be an independent
non-executive director and not the Chairperson of the Board..................................100
6.3.3 Written terms of reference with fact and 6.3.4 disclosed in annual report ................................1006.3.5 Membership disclosed in annual report
and Chairperson to attend AGM ........................1007. Relations with shareowners7.1 Constructive engagement with institutional and 7.2 investors ..........................................................1047.3 Effect of proposed special resolutions
to be included in notice of AGM .........................1757.4 Utilise poll for special business or
contentious issues ...............................................nr8. Communication8.1 Balanced and understandable report
to stakeholders ................................................1048.2 Transparency and accountability
concerning non-financial matters..........................668.3 Comprehensive and objective
assessment of company activities ..........................18.4 Directors to report on the following in
annual report:8.4.1 Directors’ responsibility to prepare
financial statements that fairly present thestate of affairs of the Company.........................105
8.4.2 Auditors’ responsibility to report on fair presentation of affairs ................................109
8.4.3 Maintenance of adequate accounting records,internal control and risk management................105
8.4.4 Consistent use of appropriate accounting policies...........................................105
8.4.5 Adherence to applicable accounting standards .....1178.4.6 Going-concern assumption ..................................1128.4.7 Adherence to the Code .........................................999. Implementation of the Code duty and
responsibility of Board and individual directors ...........................................................99
na: not applicablenr: not reported
King II Report (2002) Index for Corporate Governance continued
The following index represents the Group’s compliance with the King II Report. More detail can be found on pages 99 to 106 ofthis report.
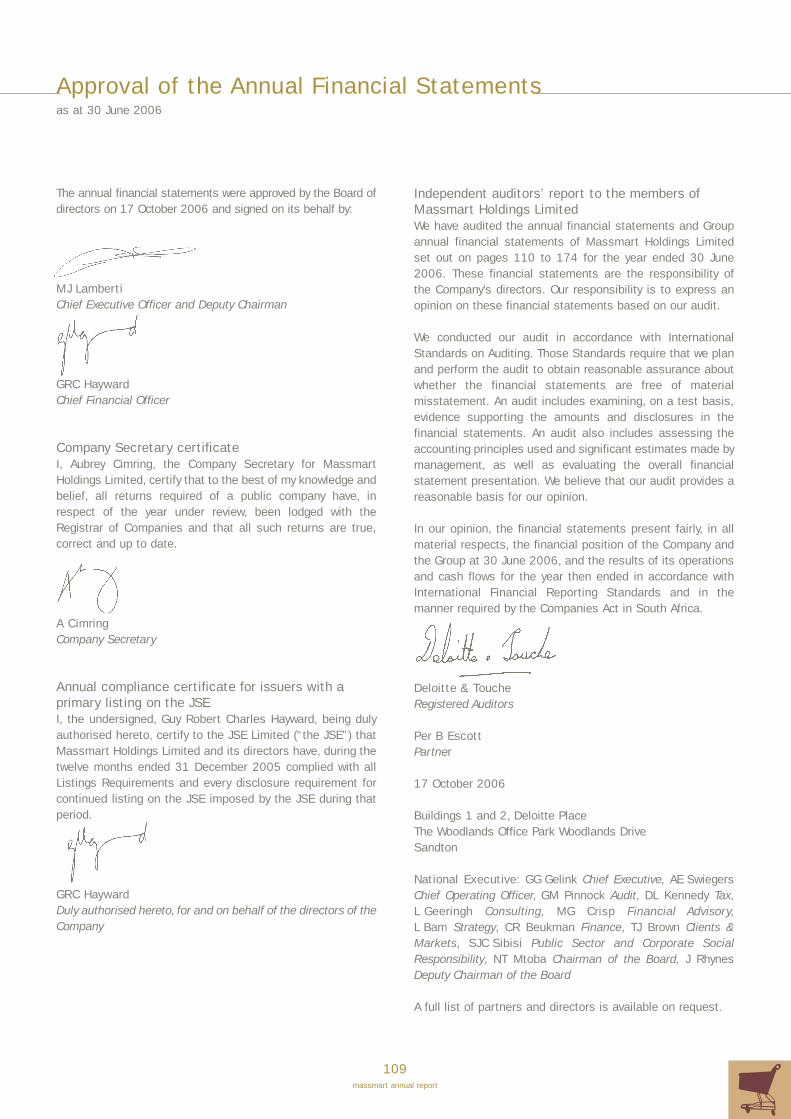
Approval of the Annual Financial Statements
109massmart annual report
The annual financial statements were approved by the Board ofdirectors on 17 October 2006 and signed on its behalf by:
MJ LambertiChief Executive Officer and Deputy Chairman
GRC HaywardChief Financial Officer
Company Secretary certificateI, Aubrey Cimring, the Company Secretary for MassmartHoldings Limited, certify that to the best of my knowledge andbelief, all returns required of a public company have, inrespect of the year under review, been lodged with theRegistrar of Companies and that all such returns are true,correct and up to date.
A CimringCompany Secretary
Annual compliance certificate for issuers with aprimary listing on the JSEI, the undersigned, Guy Robert Charles Hayward, being dulyauthorised hereto, certify to the JSE Limited (“the JSE”) thatMassmart Holdings Limited and its directors have, during thetwelve months ended 31 December 2005 complied with allListings Requirements and every disclosure requirement forcontinued listing on the JSE imposed by the JSE during thatperiod.
GRC HaywardDuly authorised hereto, for and on behalf of the directors of theCompany
Independent auditors’ report to the members ofMassmart Holdings LimitedWe have audited the annual financial statements and Groupannual financial statements of Massmart Holdings Limitedset out on pages 110 to 174 for the year ended 30 June2006. These financial statements are the responsibility ofthe Company’s directors. Our responsibility is to express anopinion on these financial statements based on our audit.
We conducted our audit in accordance with InternationalStandards on Auditing. Those Standards require that we planand perform the audit to obtain reasonable assurance aboutwhether the financial statements are free of materialmisstatement. An audit includes examining, on a test basis,evidence supporting the amounts and disclosures in thefinancial statements. An audit also includes assessing theaccounting principles used and significant estimates made bymanagement, as well as evaluating the overall financialstatement presentation. We believe that our audit provides areasonable basis for our opinion.
In our opinion, the financial statements present fairly, in allmaterial respects, the financial position of the Company andthe Group at 30 June 2006, and the results of its operationsand cash flows for the year then ended in accordance withInternational Financial Reporting Standards and in themanner required by the Companies Act in South Africa.
Deloitte & ToucheRegistered Auditors
Per B EscottPartner
17 October 2006
Buildings 1 and 2, Deloitte PlaceThe Woodlands Office Park Woodlands DriveSandton
National Executive: GG Gelink Chief Executive, AE SwiegersChief Operating Officer, GM Pinnock Audit, DL Kennedy Tax,L Geeringh Consulting, MG Crisp Financial Advisory,L Bam Strategy, CR Beukman Finance, TJ Brown Clients &Markets, SJC Sibisi Public Sector and Corporate SocialResponsibility, NT Mtoba Chairman of the Board, J RhynesDeputy Chairman of the Board
A full list of partners and directors is available on request.
as at 30 June 2006

110massmart annual report
Directors’ Report
Directors’ responsibilitiesThe directors acknowledge responsibility for the preparationof the annual financial statements, which, in their opinion,fairly present the results and cash flows for the financial yearand the state of affairs of Massmart Holdings Limited and itssubsidiaries at the end of the financial year.
The external auditors are responsible for reporting on the fairpresentation of these financial statements.
The Company and its subsidiaries have maintained adequateaccounting records and an effective system of internalcontrols to ensure the integrity of the underlying information.
Appropriate accounting policies, supported by sound andprudent managerial judgements and estimates, have beenconsistently applied except for the implementation of thestandards listed in the table below, the change in definitionfor segmental reporting for which comparatives have beenrestated and Circular 09/2006 Transactions Giving Rise toAdjustments to Revenue/ Purchases, for which comparativeshave been restated.
Standards implemented
IFRS 1 First-time Adoption of IFRSIFRS 2 Share-based PaymentIFRS 5 Non-current Assets Held For Sale and Discontinued
OperationsIAS 1 Presentation of Financial StatementsIAS 2 InventoriesIAS 7 Cash Flow StatementsIAS 8 Accounting Policies, Changes in Accounting
Estimates and ErrorsIAS 10 Events after Balance Sheet dateIAS 12 Income TaxesIAS 14 Segment ReportingIAS 16 Property, Plant and EquipmentIAS 17 LeasesIAS 18 Revenue IAS 19 Employee BenefitsIAS 21 The Effects of Changes in Foreign Exchange RatesIAS 24 Related Party DisclosuresIAS 27 Consolidated and Separate Financial StatementsIAS 29 Financial Reporting in Hyperinflationary EconomiesIAS 32 Financial Instruments: Disclosure and PresentationIAS 33 Earnings per ShareIAS 34 Interim Financial ReportingIAS 37 Provisions, Contingent Liabilities and Contingent
AssetsIAS 39 Financial Instruments: Recognition and MeasurementAC501 Accounting for “Secondary Tax on Companies (STC)”AC502 Substantively Enacted Tax Rates And Tax LawsAC503 Accounting For Black Economic Empowerment
(BEE) Transactions
The Audit Committee of the Board reviews the financialinformation presented and ensures that there has beenadherence to International Financial Reporting Standards.Internal and external auditors of Group companies haveunrestricted access to the Committee.
Group financial resultsThe financial results of the Group are set out in the incomestatement on page 113, the cash flow statement on page115 and the statement of changes in equity on page 116.The financial position of the Group is set out in the balancesheet on page 114.
Share capitalThe following ordinary shares were in issue during the yearunder review:
2006 2005Opening balance 199 640 697 199 190 697Shares issued 1 400 000 450 000
Closing balance 201 040 697 199 640 697
Dividend policyMassmart’s dividend policy is to declare and pay an interimand total annual dividend based on a two-times cover, unlesscircumstances dictate otherwise.
Dividends to shareholdersWith regard to the final distribution to shareholders, thedirectors resolved to distribute to shareholders registered inthe books of the Company on 15 September 2006, a finalcash dividend of 80 cents (2005: 72 cents) per share,bringing the total dividend for the year to 210 cents (2005:183 cents) per share.
Directorate and SecretaryThe current directorate of the Company is shown on pages10 and 11.
The Company Secretary is Mr A Cimring CA(SA). His businessand postal addresses are the same as those of the Company.
There were no changes in directorship during the year.
In accordance with the provisions of the Company’s Articlesof Association, Messrs MD Brand, ZL Combi, GRC Hayward,IN Matthews and P Maw retire by rotation at the annualgeneral meeting. Being eligible, Messrs MD Brand,ZL Combi, GRC Hayward, IN Matthews and P Maw offerthemselves for re-election.

111massmart annual report
Interests of directors in the Company’s sharesAt 30 June 2006, directors owned ordinary shares in the Company, or options over ordinary shares in the Company, directly orindirectly, aggregated as to beneficial and non-beneficial ownership, as follows:
2006 2005Shares Options Shares Options
Non- Non- Non- Non-Beneficial beneficial Beneficial beneficial Beneficial beneficial Beneficial beneficial
Non-executive directors
CS Seabrooke – 300 000 – – – 200 000 – –
P Langeni – – – – – – – –
JC Hodkinson 4 000 – – – 4 000 – – –
MD Brand – – – – – – – –
ZL Combi – – – – – – – –
IN Matthews – – – – – – – –
P Maw – – – – – – – –
DNM Mokhobo – – – – – – – –
MJ Rubin 100 000 2 000 – – 100 000 2 000 – –
Executive directors
MJ Lamberti – 5 034 537 – – – 6 587 026 – –
GRC Hayward 552 524 – 500 000 – 402 524 – 625 000 –
S Nothnagel – – 944 688 – – – 819 240 –
GM Pattison 1 185 919 – 605 219 – 435 919 – 605 219 –
At the date of this report, the directors’ holdings were as follows:
Shares OptionsNon- Non-
Beneficial beneficial Beneficial beneficial
Non-executive directors
CS Seabrooke – 400 000 – –
MD Brand – – – –
ZL Combi – – – –
JC Hodkinson 4 000 – – –
P Langeni – – – –
IN Matthews – – – –
P Maw – – – –
DNM Mokhobo – – – –
MJ Rubin 100 000 2 000 – –
Executive directors
MJ Lamberti – 5 034 537 – –
GRC Hayward 552 524 – 500 000 –
S Nothnagel – – 944 688 –
GM Pattison 1 185 919 – 605 219 –

Directors’ Report continued
112massmart annual report
Going concernThe directors are of the opinion that the business will be agoing concern in the year ahead. In reaching this opinion, thedirectors considered the following factors:• strong positive cash flows from trading;• no recurring operating losses;• well-controlled working capital and good quality inventory;• approved short- and long-term financing, with sufficient
additional short-term borrowing capacity if required;• key executive management is in place;• there have been no material changes that may effect the
Group in any of our customer, product or geographicmarkets; and
• budgets to June 2007 reflect a continuation of the abovepositive issues.
AddressThe Company’s registered office and postal address are shownon the inside back cover of this annual report.
Significant eventsThe Competition Tribunal/Commission prohibited the pendingacquisition of the Moresport sporting speciality group in April2006, and the parties determined not to appeal the decision.
Subsequent eventsPursuant to the 51% interest acquired in De La Rey in 2005,the parties brought forward the subsequent planned buy-outand the Company acquired the remaining 49%, effective 1 July 2006.
The Company’s Broad-based Empowerment Equity issue to allthe Massmart Group’s qualifying permanent staff, approvedby shareholders in July 2006, became effective on 1 October2006. Details of this BEE transaction were published in thecircular issued to shareholders dated 15 June 2006.
No other material facts or circumstances have occurredbetween 30 June 2006 and the date of this report.
On behalf of the Board
Aubrey CimringCompany Secretary17 October 2006
Details of shares issued and options granted by the Companyin terms of the rules of the Employee share incentive schemeare dealt with in note 25 on pages 147 and 148.
Director’s service contractAt the 2002 annual general meeting, the Company obtainedshareholders’ approval of a four-year service contract with Mr MJ Lamberti. This was effective from 1 July 2003 andcontains the following salient points:• The duration of the contract is until 30 June 2007.• There has been no change to his remuneration package as
a result of the new contract.• He has received an upfront allocation of one million shares
from the share trust, which will vest over the four-yearperiod of the contract, but he will not be eligible for futureannual allocations which would have been usual in terms ofthe Group’s incentive scheme.
• In the event of the Company wishing to terminate hiscontract early, his payout will be limited to one month foreach year of service to the Group or the remaining periodof the contract, whichever is the lesser.
SubsidiariesThe following companies are principal subsidiaries of theCompany:
CBW Holdings (Pty) Limited 1997/014716/07De La Rey 1001 Building Materials
(Pty) Limited 1994/000266/07Federated Timbers (Pty) Limited 2004/035206/07Jumbo Cash & Carry
(Pty) Limited 1996/012181/07Massmart International Holdings
Limited (incorporated in Mauritius) 47902 C1/GBLMassmart Management and Finance
Company (Pty) Limited 1992/004084/07Masstores (Pty) Limited 1991/006805/07Servistar (Pty) Limited 1984/031897/07Shield Buying and Distribution
(Pty) Limited 1984/011353/07
Details of the Company’s interests in material subsidiariesare set out in note 33 on page 157.
Borrowing powersIn terms of the Articles of Association, the Group hasunlimited borrowing powers. At 30 June 2006, borrowingswere R756.7 million (2005: R670.4 million).
LitigationThere are no current, pending or threatened legal or arbitrationproceedings that may have, or have had in the previous12 months, a material effect on the Group’s financial position.

113massmart annual report
Consolidated Income Statement
Group
20052005 As previously
2006 Restated reportedNotes Rm Rm Rm
Continuing operationsRevenue 5 30 080.6 25 517.1 25 764.8
Sales 29 963.6 25 381.5 25 632.8Cost of sales (24 650.0) (21 202.0) (21 988.7)
Gross profit 5 313.6 4 179.5 3 644.1Other income 5 117.0 135.6 132.0Depreciation and amortisation (202.9) (157.5) (155.9)Impairment of assets 12 (5.4) – –Employment costs (2 079.0) (1 656.7) (1 634.0)Occupancy costs (740.5) (644.0) (643.3)Net operating costs (1 074.7) (864.6) (321.7)
Operating profit 6 1 328.1 992.3 1 021.2
Finance costs (95.9) (69.1) (67.7)Finance income 63.7 48.9 48.5
Net interest paid (32.2) (20.2) (19.2)
Profit before taxation 1 295.9 972.1 1 002.0Taxation 7 (444.6) (307.5) (310.9)
Profit for the year from continuing operations 851.3 664.6 691.1Discontinued operation 3
Profit/(loss) for the year – Furnex 3.7 (82.1) (82.1)Loss on disposal of Furnex (1.8) – –
Profit for the year 853.2 582.5 609.0
Attributable to:Equity holders of the parent 828.5 580.1 606.8Minority interest 21 24.7 2.4 2.2
853.2 582.5 609.0
Earnings per share (cents)Basic 9 415.3 291.5 304.9
Basic EPS from continuing operations 414.3 332.8 346.2Basic EPS from discontinued operation 1.0 (41.3) (41.3)
Diluted basic 9 404.4 281.5 294.6
Diluted basic EPS from continuing operations 403.4 321.3 334.4Diluted basic EPS from discontinued operation 1.0 (39.8) (39.8)
Dividend/distribution per share (cents)
Interim 130.0 111.0 111.0Final 80.0 72.0 72.0
Total 8 210.0 183.0 183.0
Headline earnings 9 836.6 651.9 678.6Headline EPS (cents) 9 419.3 327.6 341.0Diluted headline EPS (cents) 9 408.3 316.4 329.3
2005 has been restated for IFRS and other adjustments. Details can be found in note 2 on pages 124 and 125.
for the year ended 30 June 2006

114massmart annual report
Consolidated Balance Sheet
Group
20052005 As previously
2006 Restated reportedNotes Rm Rm Rm
AssetsNon-current assets 3 034.1 2 769.6 2 741.7
Property, plant and equipment 10 944.3 802.6 918.9Goodwill 11 1 196.4 1 149.9 1 149.9Other intangibles 12 102.3 111.5 –Investments 13 190.9 155.4 159.0Other financial assets 14 190.7 119.7 119.7Deferred taxation 15 409.5 430.5 394.2
Current assets 6 584.3 5 363.6 5 347.5
Inventories 16 3 221.0 2 677.0 2 658.0Trade receivables and prepayments 17 1 770.0 1 836.9 1 840.6Taxation 151.7 7.8 7.8Cash and cash equivalents 1 441.6 841.9 841.1
Total assets 9 618.4 8 133.2 8 089.2
Equity and liabilitiesCapital and reserves 1 901.8 1 521.3 1 616.2
Share capital 18 2.0 2.0 2.0Share premium 19 262.6 209.4 209.4Non-distributable reserves 20 143.4 122.1 100.0Retained profit 1 493.8 1 187.8 1 304.8
Minority interest 21 50.6 37.7 36.5
Total equity 1 952.4 1 559.0 1 652.7
Non-current liabilities 1 133.8 744.5 741.7
Non-current liabilities:– Interest-bearing 22 519.7 140.0 139.8– Interest-free 22 474.7 471.0 471.0
Non-current provisions 23 42.2 33.4 33.4Deferred taxation 15 97.2 100.1 97.5
Current liabilities 6 532.2 5 829.7 5 694.8
Trade and other payables 5 875.7 5 001.7 4 872.5Provisions 24 5.3 6.5 6.5Taxation 410.9 287.7 287.0Current borrowings 22 175.0 96.7 96.7Cash and cash equivalents 65.3 437.1 432.1
Total equity and liabilities 9 618.4 8 133.2 8 089.2
2005 has been restated for IFRS and other adjustments. Details can be found in note 2 on pages 124 and 125.
as at 30 June 2006
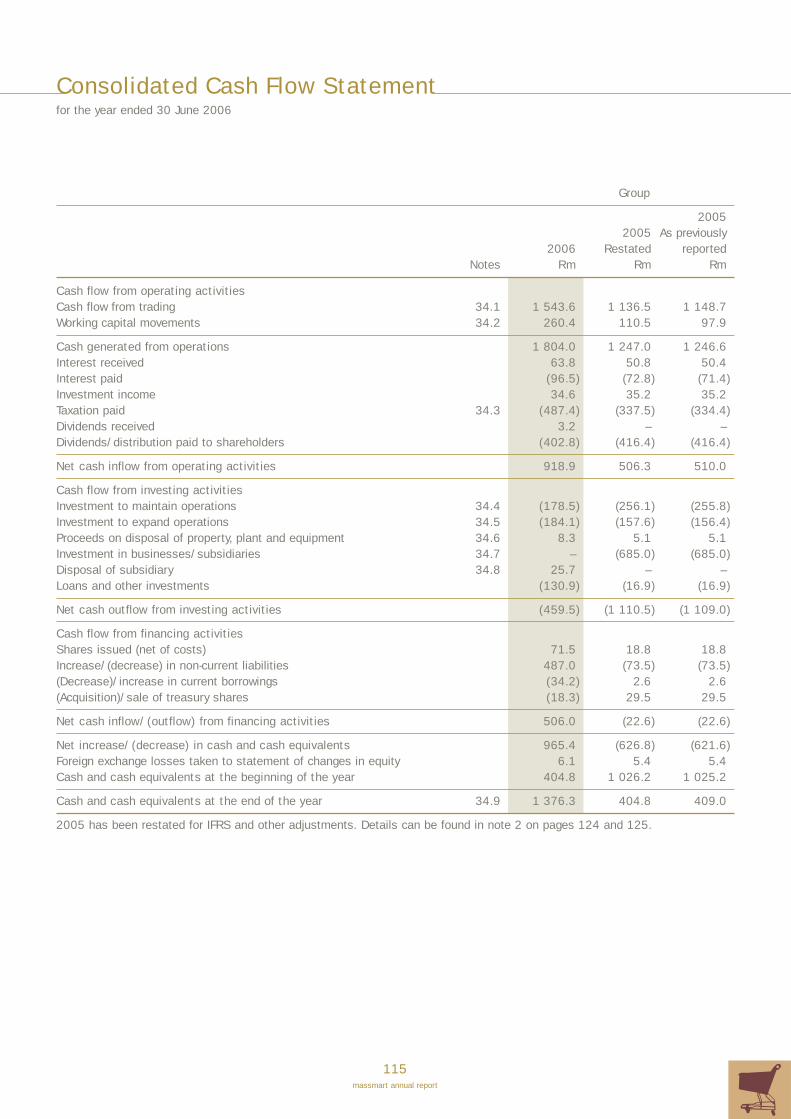
115massmart annual report
Consolidated Cash Flow Statement
Group
20052005 As previously
2006 Restated reportedNotes Rm Rm Rm
Cash flow from operating activitiesCash flow from trading 34.1 1 543.6 1 136.5 1 148.7Working capital movements 34.2 260.4 110.5 97.9
Cash generated from operations 1 804.0 1 247.0 1 246.6Interest received 63.8 50.8 50.4Interest paid (96.5) (72.8) (71.4)Investment income 34.6 35.2 35.2Taxation paid 34.3 (487.4) (337.5) (334.4)Dividends received 3.2 – –Dividends/distribution paid to shareholders (402.8) (416.4) (416.4)
Net cash inflow from operating activities 918.9 506.3 510.0
Cash flow from investing activitiesInvestment to maintain operations 34.4 (178.5) (256.1) (255.8)Investment to expand operations 34.5 (184.1) (157.6) (156.4)Proceeds on disposal of property, plant and equipment 34.6 8.3 5.1 5.1Investment in businesses/subsidiaries 34.7 – (685.0) (685.0)Disposal of subsidiary 34.8 25.7 – –Loans and other investments (130.9) (16.9) (16.9)
Net cash outflow from investing activities (459.5) (1 110.5) (1 109.0)
Cash flow from financing activitiesShares issued (net of costs) 71.5 18.8 18.8Increase/(decrease) in non-current liabilities 487.0 (73.5) (73.5)(Decrease)/increase in current borrowings (34.2) 2.6 2.6(Acquisition)/sale of treasury shares (18.3) 29.5 29.5
Net cash inflow/(outflow) from financing activities 506.0 (22.6) (22.6)
Net increase/(decrease) in cash and cash equivalents 965.4 (626.8) (621.6)Foreign exchange losses taken to statement of changes in equity 6.1 5.4 5.4Cash and cash equivalents at the beginning of the year 404.8 1 026.2 1 025.2
Cash and cash equivalents at the end of the year 34.9 1 376.3 404.8 409.0
2005 has been restated for IFRS and other adjustments. Details can be found in note 2 on pages 124 and 125.
for the year ended 30 June 2006
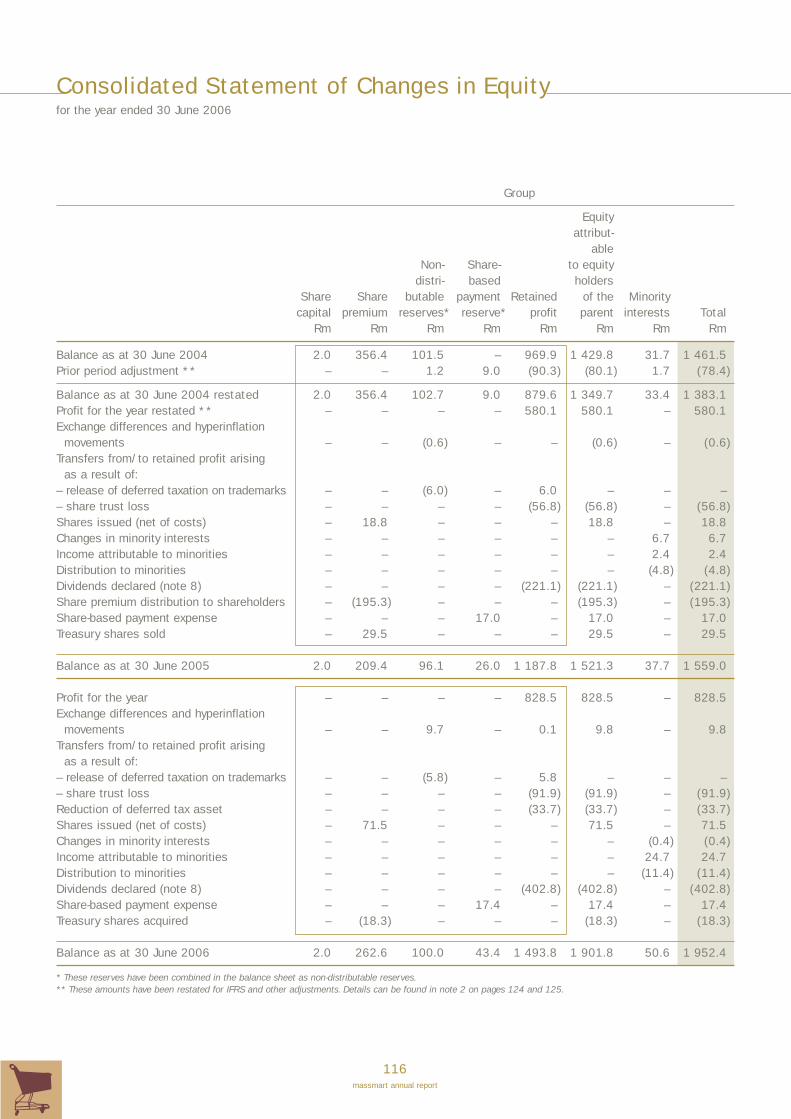
116massmart annual report
Consolidated Statement of Changes in Equity
Group
Equityattribut-
ableNon- Share- to equity
distri- based holdersShare Share butable payment Retained of the Minority
capital premium reserves* reserve* profit parent interests TotalRm Rm Rm Rm Rm Rm Rm Rm
Balance as at 30 June 2004 2.0 356.4 101.5 – 969.9 1 429.8 31.7 1 461.5Prior period adjustment ** – – 1.2 9.0 (90.3) (80.1) 1.7 (78.4)
Balance as at 30 June 2004 restated 2.0 356.4 102.7 9.0 879.6 1 349.7 33.4 1 383.1Profit for the year restated ** – – – – 580.1 580.1 – 580.1Exchange differences and hyperinflation
movements – – (0.6) – – (0.6) – (0.6)Transfers from/to retained profit arising
as a result of:– release of deferred taxation on trademarks – – (6.0) – 6.0 – – –– share trust loss – – – – (56.8) (56.8) – (56.8)Shares issued (net of costs) – 18.8 – – – 18.8 – 18.8Changes in minority interests – – – – – – 6.7 6.7Income attributable to minorities – – – – – – 2.4 2.4Distribution to minorities – – – – – – (4.8) (4.8)Dividends declared (note 8) – – – – (221.1) (221.1) – (221.1)Share premium distribution to shareholders – (195.3) – – – (195.3) – (195.3)Share-based payment expense – – – 17.0 – 17.0 – 17.0Treasury shares sold – 29.5 – – – 29.5 – 29.5
Balance as at 30 June 2005 2.0 209.4 96.1 26.0 1 187.8 1 521.3 37.7 1 559.0
Profit for the year – – – – 828.5 828.5 – 828.5Exchange differences and hyperinflation
movements – – 9.7 – 0.1 9.8 – 9.8Transfers from/to retained profit arising
as a result of:– release of deferred taxation on trademarks – – (5.8) – 5.8 – – –– share trust loss – – – – (91.9) (91.9) – (91.9)Reduction of deferred tax asset – – – – (33.7) (33.7) – (33.7)Shares issued (net of costs) – 71.5 – – – 71.5 – 71.5Changes in minority interests – – – – – – (0.4) (0.4)Income attributable to minorities – – – – – – 24.7 24.7Distribution to minorities – – – – – – (11.4) (11.4)Dividends declared (note 8) – – – – (402.8) (402.8) – (402.8)Share-based payment expense – – – 17.4 – 17.4 – 17.4Treasury shares acquired – (18.3) – – – (18.3) – (18.3)
Balance as at 30 June 2006 2.0 262.6 100.0 43.4 1 493.8 1 901.8 50.6 1 952.4
* These reserves have been combined in the balance sheet as non-distributable reserves.** These amounts have been restated for IFRS and other adjustments. Details can be found in note 2 on pages 124 and 125.
for the year ended 30 June 2006

117massmart annual report
Notes to the Consolidated Annual Financial Statements
1. Accounting policiesBasis of accountingThe financial statements have been prepared on thehistorical cost basis modified by the restatement offinancial instruments to fair value.
The financial statements have been prepared inaccordance with International Financial ReportingStandards (IFRS) for the first time. The principalaccounting policies adopted are set out below.
These policies have been consistently applied exceptas indicated in note 2 on pages 124 and 125.
Basis of consolidationThe Group annual financial statements incorporate theannual financial statements of the Company andthe entities it controls. Control is achieved where theCompany has the power to govern the financial andoperating policies of an investee entity so as to obtainbenefits from its activities. The operating results of thesubsidiaries are consolidated from the date on whicheffective control is transferred to the Group and up tothe effective date of disposal.
Separate disclosure is made of minority interestswhere the Group’s investment is less than 100%.Minority interests consist of the amount of thoseinterests at the date of the original businesscombination and the minority’s share of changes inequity since the date of the combination. Lossesapplicable to the minority’s interest in the subsidiary’sequity are allocated against the interest of the Groupexcept to the extent that the minority has a bindingobligation and is able to make an additional investmentto cover the losses.
Inter-company transactions and balances, income andexpenses have been eliminated on consolidation.
Business combinationsThe acquisition of subsidiaries is accounted for usingthe purchase method. The cost of the acquisition ismeasured at the aggregate of the fair values, at thedate of exchange, of assets given, liabilities incurred orassumed, and equity instruments issued by the Groupin exchange for control of the acquiree, plus any costsdirectly attributable to the business combination. Theacquiree’s identifiable assets, liabilities and contingentliabilities that meet the conditions for recognition underIFRS 3 Business Combinations are recognised at theirfair values at the acquisition date, except for non-current assets (or disposal groups) that are classified
as held for sale in accordance with IFRS 5 Non-CurrentAssets Held for Sale and Discontinued Operations, whichare recognised and measured at fair value less coststo sell.
The interest of minority shareholders in the acquiree isinitially measured at the minority’s proportion of the netfair value of the assets, liabilities and contingentliabilities recognised.
Where necessary, adjustments are made to thefinancial statements of subsidiaries to bring theaccounting policies used into line with those used bythe Group.
Segmental informationThe Group is organised into four divisions foroperational and management purposes. Massmartreports its primary business segment information onthis basis and on a secondary basis by significantgeographical region based on location of assets.
Comparative figuresWhen an accounting policy is altered, comparativefigures are restated if required by the applicableaccounting statement and where material. Details ofthese restatements have been included in the relevantnotes to the annual financial statements.
Interests in associatesAn associate is an enterprise over which the Group hassignificant influence, and that is neither a subsidiary noran interest in a joint venture. Significant influence is thepower to participate in the financial and operating policydecisions of the investee but is not control or jointcontrol over those policies.
The results, assets and liabilities of associates areincorporated in these financial statements using theequity method of accounting, except when theinvestment is classified as held for sale, in which caseit is accounted for under IFRS 5 Non-Current Assets Heldfor Sale and Discontinued Operations. The carryingamount of such interests is reduced to recognise anydecline, other than a temporary decline, in the value ofindividual investments. The carrying amount reflectsthe Group’s share of net assets of the associateand includes any goodwill on acquisition, less anyimpairment in the value of individual investments.
Any excess of the cost of acquisition over the Group’sshare of the fair values of the identifiable net assets ofthe associate at the date of acquisition is recognised
for the year ended 30 June 2006

118massmart annual report
Notes to the Consolidated Annual Financial Statements continued
for the year ended 30 June 2006
as goodwill. The goodwill is included within the carryingamount of the investment and is assessed forimpairment as part of the investment. Any deficiency ofthe cost of acquisition below the Group’s share of thefair values of the identifiable net assets of theassociate at the date of acquisition (i.e. discount onacquisition) is credited to profit and loss in the periodof acquisition.
Where a Group enterprise transacts with an associateof the Massmart Group, unrealised profits and lossesare eliminated to the extent of the Group’s interest inthe relevant associate, except where unrealisedlosses provide evidence of an impairment of the assettransferred.
GoodwillGoodwill arising on consolidation represents the excessof the cost of acquisition over the Group’s interest inthe net fair value of the identifiable assets, liabilitiesand contingent liabilities of a subsidiary, associate orjointly controlled entity at the date of acquisition.Any deficiency of the cost of acquisition below thefair values of the identifiable net assets acquired(i.e. discount on acquisition) is credited to profit andloss in the period of acquisition.
Goodwill is initially recognised as an asset at cost and issubsequently measured at cost less any accumulatedimpairment losses. For the purpose of impairmenttesting, goodwill is allocated to each of the Group’s cash-generating units expected to benefit from the synergiesof the combination. Cash-generating units to whichgoodwill has been allocated are tested for impairmentannually, or more frequently when there is an indicationthat the unit may be impaired. If the recoverable amountof the cash-generating unit is less than the carryingamount of the unit, the impairment loss is allocated firstto reduce the carrying amount of any goodwill allocatedto the unit and then to the other assets of the unit pro-rata on the basis of the carrying amount of each assetin the unit. An impairment loss recognised for goodwill isnot reversed in a subsequent period.
On disposal of a subsidiary, associate or jointlycontrolled entity, the attributable amount of goodwill isincluded in the determination of the profit or loss ondisposal.
The Group’s policy for goodwill arising on the acquisitionof an associate is described under “Interests inassociates” above.
Non-current assets held for saleNon-current assets and disposal groups are classifiedas held for sale if their carrying amount will berecovered through a sale transaction rather thanthrough continuing use. This condition is regarded asmet only when the sale is highly probable and the asset(or disposal group) is available for immediate sale in itspresent condition. Management must be committed tothe sale which should be expected to qualify forrecognition as a completed sale within one year fromthe date of classification.
Non-current assets (and disposal groups) classified asheld for sale are measured at the lower of the assets’previous carrying amount and fair value less coststo sell.
Property, plant and equipmentFreehold land is shown at cost and is not depreciated.Property, plant and equipment is shown at cost lessaccumulated depreciation, and reduced by anyaccumulated impairment losses.
Property cost includes professional fees and, forqualifying assets, borrowing costs capitalised inaccordance with the Group’s accounting policy.Depreciation of these assets, on the same basis asother property assets, commences when the assets areready for their intended use.
Where expenditure incurred on property, plant andequipment will lead to future economic benefitsaccruing to the Group, these costs are capitalised.Repairs and maintenance are expensed as and whenincurred.
Depreciation is charged so as to write off the cost ofassets, other than land, over their estimated usefullives, using the straight-line method, on the followingbases:• Buildings 50 years• Fixtures, fittings, plant, equipment
and motor vehicles 4 to 8 years• Computer equipment 3 to 8 years• Leasehold improvements Lease period
Useful life and residual value is reviewed annually andthe prospective depreciation is adjusted accordingly.
Assets held under finance leases are depreciated overtheir expected useful lives on the same basis as ownedassets or, where shorter, over the term of the relevantlease.

119massmart annual report
The gain or loss arising on the disposal or retirement ofan asset is determined as the difference between thesale proceeds and the carrying amount of the asset andis recognised in income.
Internally-generated intangible assets – research anddevelopment expenditureExpenditure on research activities is recognised as anexpense in the period in which it is incurred.
Internally-generated intangible assets are amortised ona straight-line basis over their estimated useful lives.Where no internally-generated intangible asset canbe recognised, development expenditure is charged toprofit or loss in the period in which it is incurred.
Intangible assetsTrademarks are measured initially at purchased costand are amortised on a straight-line basis over theirestimated useful lives.
Amortisation is charged so as to write off the cost ofassets over their estimated useful lives, using thestraight-line method, on the following bases:• Computer software 3 to 8 years
Useful life is reviewed annually and the prospectivedepreciation is adjusted accordingly.
Impairment of assets excluding goodwillAt each balance sheet date, the Group reviews thecarrying amounts of its tangible and intangible assetsto determine whether there is any indication that thoseassets may be impaired. If any such indication exists,the recoverable amount of the asset is estimated inorder to determine the extent of the impairment loss(if any). Where it is not possible to estimatethe recoverable amount for an individual asset, therecoverable amount is determined for the cash-generating unit to which the asset belongs.
The recoverable amount is the higher of fair value lesscosts to sell and value in use. In assessing value inuse, the estimated future cash flows are discounted totheir present value using a discount rate that reflectscurrent market assessments of the time value of moneyand the risks specific to the asset.
If the recoverable amount of an asset (or cash-generating unit) is estimated to be less than its carryingamount, the carrying amount of the asset (cash-generating unit) is reduced to its recoverable amount.Impairment losses are recognised as an expense
immediately, unless the relevant asset is carried at arevalued amount, in which case the impairment loss istreated as a revaluation decrease.
Where an impairment loss subsequently reverses, thecarrying amount of an asset (cash-generating unit) isincreased to the revised estimate of its recoverableamount. This is done so that the increased carryingamount does not exceed the carrying amount thatwould have been determined had no impairment lossbeen recognised for the asset (cash-generating unit) inprior years. A reversal of an impairment loss isrecognised immediately in profit or loss, unless therelevant asset is carried at a revalued amount, in whichcase the reversal of the impairment loss is treated as arevaluation increase.
Revenue recognitionRevenue of the Group comprises net sales, royalties,franchise fees, interest received, investment income,finance charges, property rentals, management andadministration fees and dividends and excludes ValueAdded Tax. Revenue is measured at the fair value of theconsideration received or receivable and representsamounts receivable for goods and services provided inthe normal course of business, net of discounts andsales related taxes.
Sales of goods are recognised when goods aredelivered and title has passed.
Interest income is accrued on a time basis, by referenceto the principal outstanding and the interest rateapplicable.
Dividend income from investments is recognised whenthe shareholders’ rights to receive payment have beenestablished.
Other revenue is recognised on the accrual basis inaccordance with the substance of the relevantagreements.
LeasingLeases are classified as finance leases wheneverthe terms of the lease transfer substantially all therisks and rewards of ownership to the lessee. All otherleases are classified as operating leases.
Assets held under finance leases are capitalised attheir fair value at the inception of the lease or, if lower,at the present value of the minimum lease payments.The corresponding liability to the lessor, net of finance

120massmart annual report
Notes to the Consolidated Annual Financial Statements continued
for the year ended 30 June 2006
charges, is included in the balance sheet as a financelease obligation. Lease payments are apportionedbetween finance charges and reduction of the leaseobligation so as to achieve a constant rate of intereston the remaining balance of the liability. Financecharges are charged to profit or loss, unless they aredirectly attributable to qualifying assets, in which casethey are capitalised in accordance with the Group’sgeneral policy on borrowing costs (see below).
Rentals payable under operating leases are charged toincome on a straight-line basis over the term of therelevant lease.
Foreign currenciesThe individual financial statements of each Group entityare presented in the currency of the primary economicenvironment in which the entity operates (i.e. itsfunctional currency). For the purpose of the consolidatedfinancial statements, the results and financial positionof each entity are expressed in the currency, which is thefunctional currency of the Group, and the presentationcurrency for the consolidated financial statements.
Transactions in currencies other than the Groupreporting currency (South African Rands) are initiallyrecorded at the rates of exchange prevailing on thedates of the transactions. In order to hedge itsexposure to certain foreign exchange risks, the Grouphas a policy of covering forward all its foreign exchangeliability transactions of a trading nature (see below fordetails of the Group’s accounting policies in respect ofsuch derivative financial instruments).
At each balance sheet date, monetary assets andliabilities that are denominated in foreign currencies areretranslated at the rates prevailing on the balancesheet date. Non-monetary items carried at fair valuethat are denominated in foreign currencies areretranslated at the rates prevailing on the date whenthe fair value was determined. Non-monetary items thatare measured in terms of historical cost in a foreigncurrency are not retranslated.
Exchange difference arising on the settlement andretranslation of monetary items are included in profit orloss for the period. Exchange differences arising on theretranslation of non-monetary items carried at fair valueare included in profit or loss for the period. However,where fair-value adjustments of non-monetary items arerecognised directly in equity, exchange differencesarising on the retranslation of these non-monetaryitems are also recognised directly in equity.
On consolidation, the assets and liabilities of theGroup’s overseas operations (including comparatives)are translated at exchange rates prevailing on thebalance sheet date. Income and expense items aretranslated at the average exchange rates for the periodunless exchange rates fluctuate significantly. Exchangedifferences arising, if any, are classified as equity andtransferred to the Group’s translation reserve. Suchtranslation differences are recognised as income or asexpenses in the period in which the operation isdisposed of.
The financial statements (including comparatives) offoreign subsidiaries and associates that report in thecurrency of a hyperinflationary economy are restated interms of the measuring unit current at the balancesheet date before they are translated into South AfricanRands.
Goodwill and fair value adjustments arising on theacquisition of a foreign entity are treated as assets andliabilities of the foreign entity and translated at theclosing rate.
Government grantsGovernment grants for staff training costs arerecognised in profit or loss over the periods necessaryto match them with the related costs and are deductedin reporting the related expense. Income is notrecognised until there is reasonable assurance that thegrants will be received.
Retirement benefit costsPayments to defined contribution plans are charged asan expense as they fall due. There are no definedretirement benefit plans in the Group.
Post-retirement healthcare benefitPost-retirement healthcare benefits are provided bycertain Group companies to qualifying employeesand pensioners. The healthcare benefit costs aredetermined through annual actuarial valuations byindependent consulting actuaries using the projected unitcredit method. Such gains or losses are recognised overthe expected remaining working lives of the participatingmembers. Adjustments are made annually through profitor loss for provisions held for members who have alreadyretired. Actuarial gains and losses are recognised in fullin the period in which they occur.
TaxationIncome tax expense represents the sum of the taxcurrently payable and deferred tax.
121massmart annual report
The tax charge payable is based on taxable profit for theyear. Taxable profit differs from profit as reported in theincome statement because it excludes items of incomeor expense that are taxable or deductible in other yearsand it further excludes items that are never taxable ordeductible. The Group’s liability for current tax iscalculated using tax rates that have been enacted orsubstantively enacted by the balance sheet date.
Deferred taxation is accounted for using the balancesheet liability method in respect of temporarydifferences arising from differences between thecarrying amounts of assets and liabilities in thefinancial statements and the corresponding tax basesused in the computation of taxable profit. In general,deferred tax liabilities are recognised for all taxabletemporary differences and deferred tax assets arerecognised to the extent that it is probable that taxableprofit will be available against which deductibletemporary differences can be utilised. Such assets andliabilities are not recognised if the temporary differencearises from goodwill or from the initial recognition (otherthan in a business combination) of other assets andliabilities, which affects neither the tax profit nor theaccounting profit at the time of the transaction.
Deferred tax liabilities are recognised for taxabletemporary differences arising on investments insubsidiaries and associates, and interests in jointventures, except where the Group is able to control thereversal of the temporary difference and it is probablethat the temporary difference will not reverse in theforeseeable future.
The carrying amount of deferred tax assets is reviewedat each balance sheet date and reduced to the extentthat it is no longer probable that sufficient taxableprofits will be available to allow all or part of the assetto be recovered.
Deferred tax is calculated at the tax rates that areexpected to apply to the period when the asset isrealised or the liability settled. Deferred tax is chargedor credited in the income statement, except when itrelates to items credited or charged directly to equity, inwhich case the deferred tax is also dealt with in equity.
Secondary Taxation on Companies (STC) is paid on netdividends paid and is recognised as a tax charge inprofit or loss in the year it is incurred.
Any tax on capital gains is deferred if the proceeds ofthe sale of the assets are invested in similar assets.
The tax will ultimately become payable on sale of thesimilar asset.
InventoriesInventories, which consist of merchandise, are valuedat the lower of cost and net realisable value. Cost iscalculated on the weighted-average method. Netrealisable value represents the estimated selling priceless all estimated costs of completion and direct coststo be incurred in marketing, selling and distribution.
Financial instrumentsFinancial assets and financial liabilities are recognisedon the Group’s balance sheet when the Group becomesa party to the contractual provisions of the instrument.
Trade receivablesTrade receivables are measured initially at fair value,and are subsequently measured at amortised costusing the effective interest rate method. Appropriateallowances for estimated irrecoverable amounts arerecognised in profit and loss when there is objectiveevidence that the asset is impaired.
Cash and cash equivalentsCash and cash equivalents are measured at fair value.For purposes of the cash flow statement, cash and cashequivalents comprise cash on hand, deposits held oncall with banks and investments in money-marketinstruments that are readily convertible to a knownamount of cash and are subject to an insignificant riskof change in value, net of bank overdrafts.
InvestmentsInvestments are recognised and derecognised on atrade date basis where the purchase or sale of aninvestment is under contract whose terms requiredelivery of the investment within the timeframeestablished by the market concerned, and are initiallymeasured at fair value, plus directly attributabletransactions costs.
At subsequent reporting dates, debt securities that theGroup has the express intention and ability to holdto maturity (held-to-maturity debts securities) aremeasured at amortised cost using the effective interestrate method, less any impairment loss recognised toreflect irrecoverable amounts. An impairment loss isrecognised in profit or loss when there is objectiveevidence that the asset is impaired, and is measuredas the difference between the investment’s carryingamount and the present value of estimated future cashflows discounted at the effective interest rate computed

122massmart annual report
Notes to the Consolidated Annual Financial Statements continued
for the year ended 30 June 2006
at initial recognition. Impairment losses are reversed insubsequent periods when an increase in theinvestment’s recoverable amount can be relatedobjectively to an event occurring after the impairmentwas recognised, subject to the restriction that thecarrying amount of the investment at the date theimpairment is reversed shall not exceed what theamortised cost would have been had the impairmentnot been recognised.
Investments other than held-to-maturity debt securitiesare classified as either investment held for trading or asavailable for sale, and are subsequently measured atfair value. Where securities are held for tradingpurposes, gains and losses arising from changes in fairvalue are included in profit or loss for the period.Unrealised gains and losses on available-for-saleinvestments are recognised directly in equity until thedisposal or impairment of the relevant investment, atwhich time the cumulative gain or loss previouslyrecognised in equity is included in the profit or loss forthe period. Impairment losses recognised in profit orloss for equity investments classified as available-for-sale are not subsequently reversed through profit orloss. Impairment losses recognised in profit or loss fordebt instruments classified as available-for-sale aresubsequently reversed if an increase in the fairvalue of the instrument can be objectively related toan event occurring after the recognition of theimpairment loss.
Listed investments are carried at market value, which iscalculated by reference to stock exchange quotedselling prices at the close of business on the balancesheet date.
Financial liabilities and equityFinancial liabilities are classified according to thesubstance of the contractual arrangements entered intoand the definitions of a financial liability and an equityinstrument. Debt instruments issued, which carry aright to convert to equity that is dependent on theoutcome of uncertainties beyond the control of both theGroup and the holder, are classified as liabilities exceptwhere conversion is certain. An equity instrument is anycontract that evidences a residual interest in the assetsof the Group after deducting all of its liabilities.
Financial liabilities, other than derivative instruments,are recognised at amortised cost, comprising originaldebt less principal payments and amortisations.
Financial liabilities include finance lease obligations,interest-bearing bank loans and overdrafts and trade
and other payables. The accounting policy for financelease obligations is outlined on page 121.
Bank borrowingsInterest-bearing bank loans and overdrafts are initiallymeasured at fair value, and are subsequently measuredat amortised cost, using the effective interest ratemethod. Any difference between the proceeds (net oftransaction costs) and the settlement or redemptionof borrowings is recognised over the term of theborrowings in accordance with the Group’s accountingpolicy for borrowing costs (see below).
Trade payablesTrade and other payables are initially measured at fairvalue, and are subsequently measured at amortisedcost, using the effective interest rate method.
Equity instrumentsEquity instruments are recorded at the proceedsreceived, net of direct issue costs.
Derivative financial instruments and hedge accountingThe Group’s activities expose it primarily to the financialrisks of changes in foreign exchange rates and interestrates.
The Group uses derivative financial instruments,including currency forward contracts and options, tohedge its exposure to interest rate and foreign currencyfluctuations relating to certain firm tradingcommitments and forecasted transactions. The use offinancial derivatives is governed by the Group’s policiesapproved by the Board of Directors, which providewritten principles on the use of financial derivativesconsistent with the Group’s risk management strategy.It is the policy of the Group not to trade in derivativefinancial instruments for speculative purposes.
Derivative financial instruments are initially measuredat fair value on the contract date, and are re-measuredto fair value at subsequent reporting dates.
Changes in fair value of derivative financial instrumentsthat are designated and effective as hedges of futurecash flows relating to firm commitments and forecastedtransactions are recognised directly in equity and theineffective portion is recognised immediately in profitand loss. The Group’s policy with respect to hedging theforeign currency risk of a firm commitment is todesignate it as a cash flow hedge. If the hedged firmcommitment or forecast transaction results in therecognition of an asset or liability, then, at the time the

asset or liability is recognised, the associated gains orlosses on the derivative that had previously beenrecognised in equity are included in the initialmeasurement of the asset or liability. For hedges thatdo not result in the recognition of an asset or a liability,amounts deferred in equity are recognised in profit orloss in the same period in which the hedged firmcommitment or forecast transaction affects net profit orloss, for example, when the future sale actually occurs.
Changes in the fair value of derivative financialinstruments that do not qualify for hedge accounting arerecognised in the income statement as they arise.
Hedge accounting is discontinued when the hedginginstrument expires or is sold, terminated, or exercised,or no longer qualifies for hedge accounting. At the time,any cumulative gain or loss on the hedging instrumentrecognised in equity is retained in equity until theforecast transaction occurs. If a hedged transaction isno longer expected to occur, the net cumulative gain orloss recognised in equity is transferred to net profit orloss for the period.
ProvisionsProvisions are recognised when the Group has apresent legal or constructive obligation as a result ofpast events, and it is probable that the Group willbe required to settle that obligation. Provisions aremeasured at the management’s best estimate of theexpenditure required to settle the obligation atthe balance sheet date, and are discounted to presentvalue where the effect is material.
Share-based paymentsThe Group issues equity-settled share-based paymentsto certain employees. Equity-settled share-basedpayments are measured at fair value (excluding theeffect of non-market-based vesting conditions) at thedate of grant. The fair value determined at the grantdate of the equity-settled share-based payments isexpensed on a straight-line basis over the vestingperiod, based on the Group’s estimate of shares thatwill eventually vest and adjusted for the effect of non-market-based vesting conditions.
Fair value is measured by use of a Binomial model. Theexpected life used in the model has been adjusted,based on management’s best estimate, for theeffects of non-transferability, exercise restrictions, andbehavioural considerations.
Borrowing costsAll other borrowing costs are recognised in profit or lossin the period in which they are incurred.
123massmart annual report
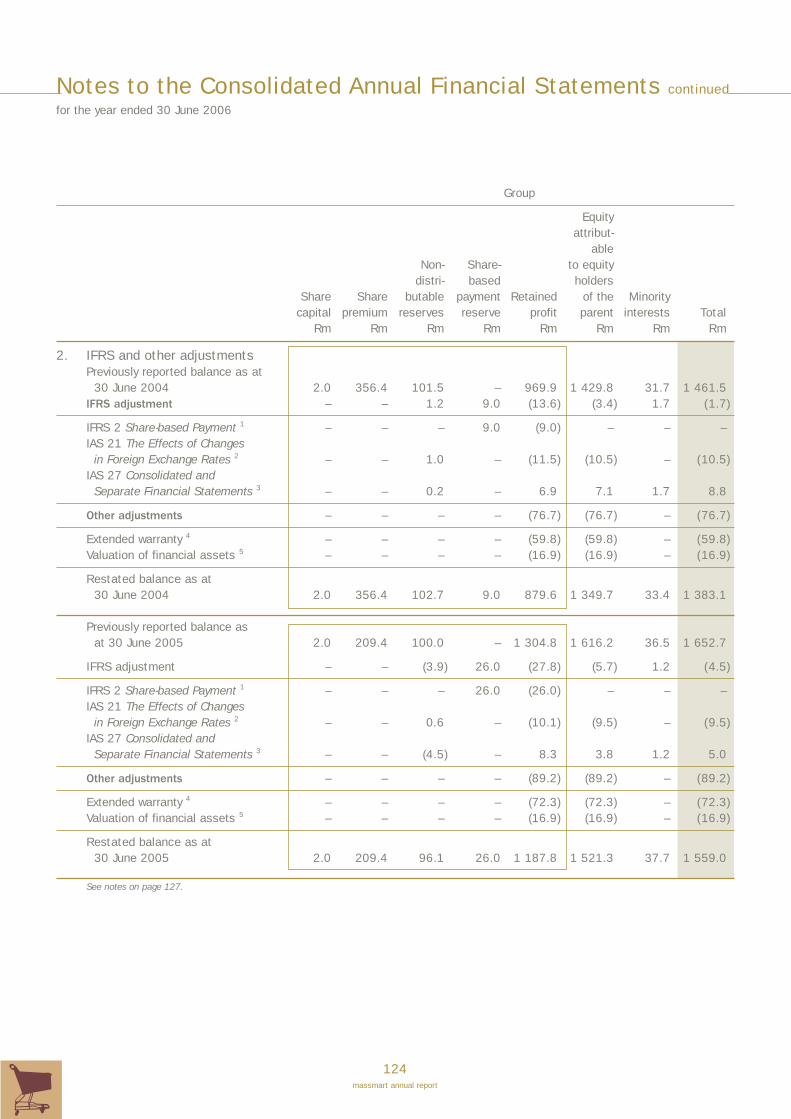
124massmart annual report
Notes to the Consolidated Annual Financial Statements continued
for the year ended 30 June 2006
Group
Equityattribut-
ableNon- Share- to equity
distri- based holdersShare Share butable payment Retained of the Minority
capital premium reserves reserve profit parent interests TotalRm Rm Rm Rm Rm Rm Rm Rm
2. IFRS and other adjustmentsPreviously reported balance as at
30 June 2004 2.0 356.4 101.5 – 969.9 1 429.8 31.7 1 461.5IFRS adjustment – – 1.2 9.0 (13.6) (3.4) 1.7 (1.7)
IFRS 2 Share-based Payment 1 – – – 9.0 (9.0) – – –IAS 21 The Effects of Changes
in Foreign Exchange Rates 2 – – 1.0 – (11.5) (10.5) – (10.5)IAS 27 Consolidated and
Separate Financial Statements 3 – – 0.2 – 6.9 7.1 1.7 8.8
Other adjustments – – – – (76.7) (76.7) – (76.7)
Extended warranty 4 – – – – (59.8) (59.8) – (59.8)Valuation of financial assets 5 – – – – (16.9) (16.9) – (16.9)
Restated balance as at 30 June 2004 2.0 356.4 102.7 9.0 879.6 1 349.7 33.4 1 383.1
Previously reported balance as at 30 June 2005 2.0 209.4 100.0 – 1 304.8 1 616.2 36.5 1 652.7
IFRS adjustment – – (3.9) 26.0 (27.8) (5.7) 1.2 (4.5)
IFRS 2 Share-based Payment 1 – – – 26.0 (26.0) – – –IAS 21 The Effects of Changes
in Foreign Exchange Rates 2 – – 0.6 – (10.1) (9.5) – (9.5)IAS 27 Consolidated and
Separate Financial Statements 3 – – (4.5) – 8.3 3.8 1.2 5.0
Other adjustments – – – – (89.2) (89.2) – (89.2)
Extended warranty 4 – – – – (72.3) (72.3) – (72.3)Valuation of financial assets 5 – – – – (16.9) (16.9) – (16.9)
Restated balance as at 30 June 2005 2.0 209.4 96.1 26.0 1 187.8 1 521.3 37.7 1 559.0
See notes on page 127.

125massmart annual report
Rm
2. IFRS and other adjustments continuedPreviously reported profit attributable to equity holders of the parent for the year ending June 2005 606.8IFRS adjustment (14.2)
IFRS 2 Share-based Payment 1 (17.0)IAS 21 The Effects of Changes in Foreign Exchange Rates 2 1.4IAS 27 Consolidated and Separate Financial Statements 3 1.4
Other adjustments (12.5)
Extended warranty 4 (12.5)Valuation of financial assets 5 –
Restated profit attributable to equity holders of the parent for the year ending June 2005 580.1
The Group adopted International Financial Reporting Standards (IFRS) effective for the reporting period ended 30 June 2006.Comparative results have been restated.
1 In accordance with IFRS 2 Share-based Payment, the Group has recognised an expense in the income statement for shareoptions granted to employees, with a corresponding credit to equity, representing the fair value of outstanding employeeshare options. The fair value at grant date is charged to profit or loss over the relevant vesting periods, adjusted to reflectactual and expected vesting levels. Fair value is determined using the binomial model. The IFRS 1 First-time Adoption ofInternational Financial Reporting Standards exemption was elected, resulting in the inclusion of equity instruments grantedafter 7 November 2002 that vested after 1 January 2005 in the valuation. The current year IFRS 2 charge is R17.4 million(2005: R17.0 million), with no tax relief.
2 International Accounting Standard (IAS) 21 The Effects of Changes in Foreign Exchange Rates introduced the conceptof “functional currency”. This change primarily affected the accounting for the African operations of Massdiscounters,where there was a reclassification of certain foreign exchange gains and losses from the income statement to the foreigncurrency translation reserve (FCTR) in the balance sheet. The IFRS 1 exemption was elected, which had the effect ofeliminating the FCTR on the date of transition to IFRS (being 1 July 2004).
3 IAS 27 Consolidated and Separate Financial Statements removed the exclusion of a subsidiary from consolidation whenthere are severe long-term restrictions that impair a subsidiary’s ability to transfer funds to the parent. As a result, MakroZimbabwe has been consolidated retrospectively. Makro Zimbabwe operates in a hyperinflationary environment, and thusthe principles of IAS 29 Financial Reporting in Hyperinflationary Economies have been applied. The financial impact on netprofit attributable to equity holders of the parent for June 2006 is a loss of R1.1 million (R1.4 million profit in 2005).
4 The Group amended its accounting policy for the treatment of extended warranty protection provided on the sale of goodsand products. This was done with guidance from Financial Accounting Standards Board (FASB) technical bulletin FTB 90-1Accounting for Separately Priced Extended Warranty and Product Maintenance Contracts which clarified that revenue fromseparately priced extended warranty contracts should be deferred and recognised in income on a straight-line basis overthe contract period.
5 In terms of IAS 39 Financial Instruments: Recognition and Measurement, certain financial assets have been present valuedusing the effective interest rate method.
The results have also been restated following Circular 9/2006 Transactions giving rise to Adjustments to Revenue/Purchases,issued by SAICA in May 2006. This circular provided clarity on the accounting treatment for cash discounts, settlementdiscounts, rebates and extended payment terms which are in line with the accounting treatment required by IAS 18 Revenueand IAS 2 Inventories. The effect on the Group has been a reallocation increasing other operating costs and reducing costof sales by R586.0 million (2005: R523.1 million).
The results have also been restated for the exclusion of Shield’s indirect sales. The effect on the Group has been a decreasein sales and cost of sales of R371.7 million (2005: R363.7 million).

126massmart annual report
Notes to the Consolidated Annual Financial Statements continued
for the year ended 30 June 2006
Group
2006 2005Rm Rm
3. Discontinued operationFurnex, a chain in the Masscash division, was disposed of during the financial year. This was done because the rapid roll-out of the smaller-store Game format was beginningto compete with Furnex members in regional towns. The effective date of sale was 28 February 2006.
The profit/(loss) for the period from the discontinued operation can be analysed as follows:
Profit/(loss) from Furnex for the period 3.7 (82.1)Loss on disposal of Furnex (1.8) –
1.9 (82.1)
The results of Furnex for the period from 1 July 2005 to 28 February 2006 were as follows:
Revenue 484.4 928.6
Sales 484.4 928.6Cost of sales (462.4) (923.7)
Gross profit 22.0 4.9Depreciation and amortisation (0.6) (1.0)Impairment – (72.4)Employment costs (9.1) (15.4)Occupancy costs (0.6) (0.9)Other operating costs (4.7) 0.6
Operating profit 7.0 (84.2)
Gross finance charges (0.6) (3.7)Finance income 0.1 1.9
Net interest paid (0.5) (1.8)
Profit before taxation 6.5 (86.0)Taxation (2.8) 3.9
Profit for year from discontinued operation 3.7 (82.1)
The Furnex cash flows for the year were as follows:
Cash outflow from operating activities (5.8) (116.5)Cash inflow/(outflow) from investing activities 22.1 (0.3)Cash inflow from financing activities – 34.0
The carrying amount of the assets and liabilities of Furnex at the date of disposal are disclosed in note 34.8 on page 160.
Furnex was not affected by any restatements and so only one set of results have been presented for 2005.
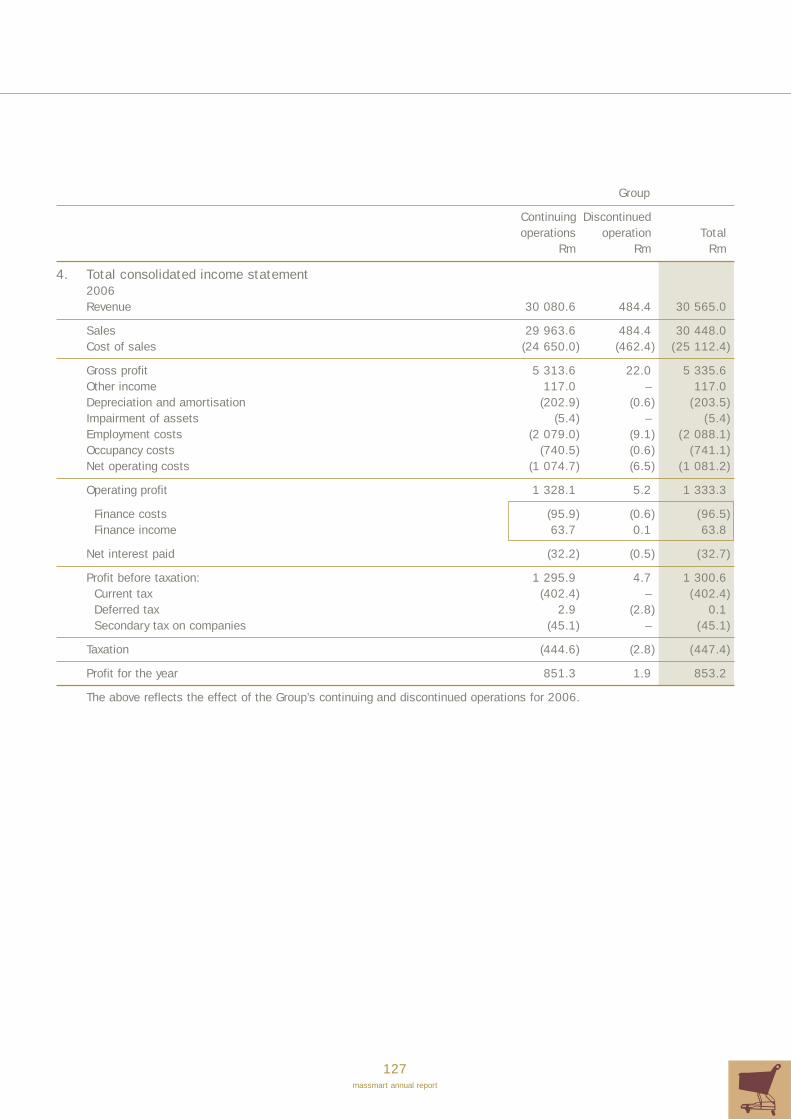
127massmart annual report
Group
Continuing Discontinuedoperations operation Total
Rm Rm Rm
4. Total consolidated income statement2006Revenue 30 080.6 484.4 30 565.0
Sales 29 963.6 484.4 30 448.0Cost of sales (24 650.0) (462.4) (25 112.4)
Gross profit 5 313.6 22.0 5 335.6Other income 117.0 – 117.0Depreciation and amortisation (202.9) (0.6) (203.5)Impairment of assets (5.4) – (5.4)Employment costs (2 079.0) (9.1) (2 088.1)Occupancy costs (740.5) (0.6) (741.1)Net operating costs (1 074.7) (6.5) (1 081.2)
Operating profit 1 328.1 5.2 1 333.3
Finance costs (95.9) (0.6) (96.5)Finance income 63.7 0.1 63.8
Net interest paid (32.2) (0.5) (32.7)
Profit before taxation: 1 295.9 4.7 1 300.6Current tax (402.4) – (402.4)Deferred tax 2.9 (2.8) 0.1Secondary tax on companies (45.1) – (45.1)
Taxation (444.6) (2.8) (447.4)
Profit for the year 851.3 1.9 853.2
The above reflects the effect of the Group’s continuing and discontinued operations for 2006.
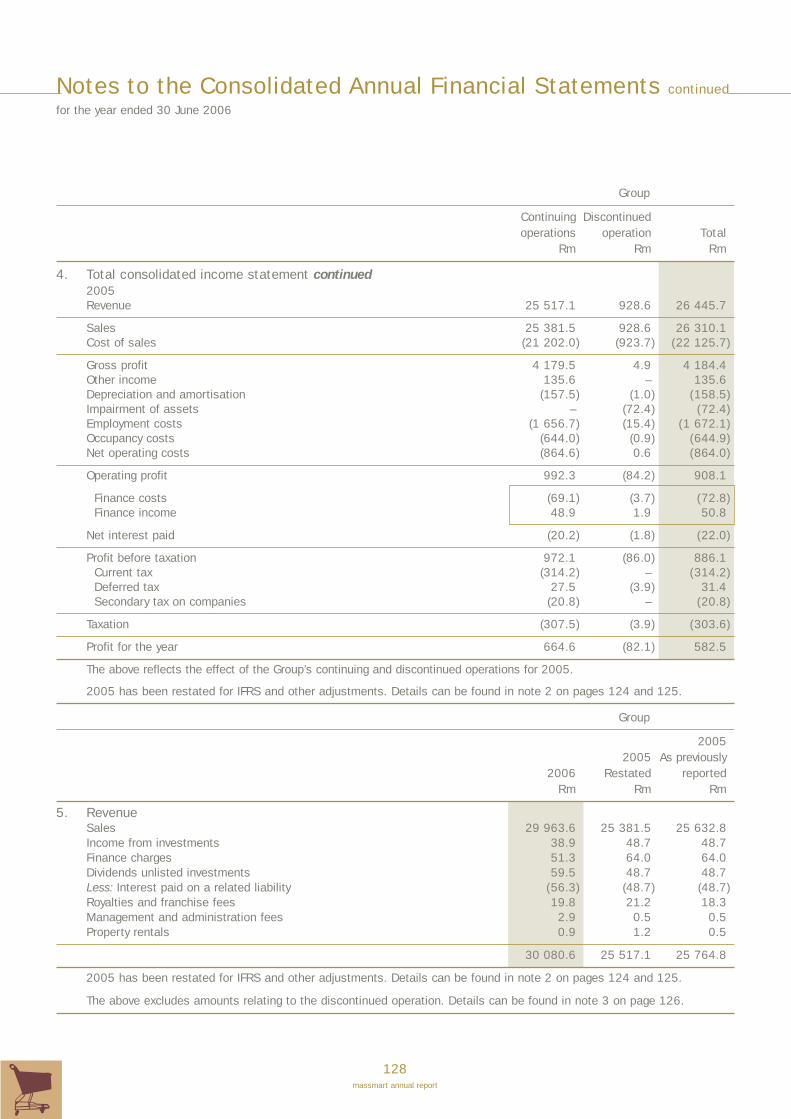
128massmart annual report
Notes to the Consolidated Annual Financial Statements continued
for the year ended 30 June 2006
Group
Continuing Discontinuedoperations operation Total
Rm Rm Rm
4. Total consolidated income statement continued2005Revenue 25 517.1 928.6 26 445.7
Sales 25 381.5 928.6 26 310.1Cost of sales (21 202.0) (923.7) (22 125.7)
Gross profit 4 179.5 4.9 4 184.4Other income 135.6 – 135.6Depreciation and amortisation (157.5) (1.0) (158.5)Impairment of assets – (72.4) (72.4)Employment costs (1 656.7) (15.4) (1 672.1)Occupancy costs (644.0) (0.9) (644.9)Net operating costs (864.6) 0.6 (864.0)
Operating profit 992.3 (84.2) 908.1
Finance costs (69.1) (3.7) (72.8)Finance income 48.9 1.9 50.8
Net interest paid (20.2) (1.8) (22.0)
Profit before taxation 972.1 (86.0) 886.1Current tax (314.2) – (314.2)Deferred tax 27.5 (3.9) 31.4Secondary tax on companies (20.8) – (20.8)
Taxation (307.5) (3.9) (303.6)
Profit for the year 664.6 (82.1) 582.5
The above reflects the effect of the Group’s continuing and discontinued operations for 2005.
2005 has been restated for IFRS and other adjustments. Details can be found in note 2 on pages 124 and 125.
Group
20052005 As previously
2006 Restated reportedRm Rm Rm
5. RevenueSales 29 963.6 25 381.5 25 632.8Income from investments 38.9 48.7 48.7Finance charges 51.3 64.0 64.0Dividends unlisted investments 59.5 48.7 48.7Less: Interest paid on a related liability (56.3) (48.7) (48.7)Royalties and franchise fees 19.8 21.2 18.3Management and administration fees 2.9 0.5 0.5Property rentals 0.9 1.2 0.5
30 080.6 25 517.1 25 764.8
2005 has been restated for IFRS and other adjustments. Details can be found in note 2 on pages 124 and 125.
The above excludes amounts relating to the discontinued operation. Details can be found in note 3 on page 126.

129massmart annual report
Group
20052005 As previously
2006 Restated reportedRm Rm Rm
6. Operating profitCredits to operating profit include:Foreign exchange profit 186.4 163.8 163.8Profit on disposal of property, plant and equipment 2.5 2.0 2.0Insurance gain – 7.6 7.6Net monetary gain on hyperinflation translation 22.2 7.4 –
Charges to operating profit include:Depreciation and amortisation (owned assets):
Buildings 3.6 2.6 2.6Fixtures, fittings, plant and equipment 105.3 91.9 91.4Computer hardware 37.7 19.0 38.8Computer software 21.1 20.5 –Leasehold improvements 14.3 10.2 10.0Motor vehicles 6.6 5.4 5.1
Depreciation and amortisation (leased assets):Buildings 1.9 1.3 1.3Fixtures, fittings, plant and equipment 1.1 0.4 0.4Computer hardware 0.5 1.1 1.1Motor vehicles 10.8 5.2 5.2
Foreign exchange loss 153.1 137.0 138.4Share-based payment expense 17.4 17.0 –Operating lease charges:
Land and buildings 587.4 560.9 560.2Plant and equipment 20.6 18.2 18.0Computer equipment 10.8 10.7 10.7Motor vehicles 6.8 6.4 6.4
Loss on disposal of property, plant and equipment 1.4 2.3 2.3Fees payable:
Administrative and outsourcing services 154.7 173.6 173.6Consulting 17.0 17.2 17.2
Auditors’ remuneration:Current year fee 10.0 8.3 7.7Prior year underprovision 0.3 0.4 0.4Tax advice 1.4 1.7 1.7Consulting and business reviews 1.1 1.8 1.8
2005 has been restated for IFRS and other adjustments. Details can be found in note 2 on pages 124 and 125.
The above excludes amounts relating to the discontinued operation. Details can be found in note 3 on page 126.

130massmart annual report
Notes to the Consolidated Annual Financial Statements continued
for the year ended 30 June 2006
Group
20052005 As previously
2006 Restated reportedRm Rm Rm
7. TaxationCurrent yearSouth African normal tax:
Current tax 376.5 286.2 286.2Deferred tax (3.5) (16.8) (11.7)
Foreign tax:Current tax 14.0 20.6 18.6Deferred tax (9.5) (10.9) (10.6)
Secondary tax on companies 45.1 19.8 19.8Tax effect of participation in export partnerships 2.1 3.0 3.0
Total 424.7 301.9 305.3
Prior years under/(over) provision:South African normal tax:
Current tax 8.8 3.8 3.8Deferred tax (9.4) 0.2 0.2
Foreign tax:Current tax 1.0 0.6 0.6Deferred tax (impairment of deferred tax assets) 19.5
Secondary tax on companies – 1.0 1.0
19.9 5.6 5.6
444.6 307.5 310.9
Two companies in the Group participate in export partnerships. As the companies are liable for the tax effect of theparticipation, the amount is classified as a tax charge.
Following the introduction of Capital Gains Tax, all significant assets (including business units) were valued for submissionto the authorities with the first tax return submitted after 30 September 2004. During the current reporting period nosignificant capital gains or losses, other than the Furnex disposal, were realised.
% % %
The rate of taxation is reconciled as follows:Standard corporate tax rate 29.0 29.0 29.0Exempt income (2.2) (3.5) (3.3)Disallowable expenditure 2.4 1.8 1.5Withholding taxation – 0.2 0.2Prior year under-provision (including impairment) 1.5 0.6 0.6Secondary tax on companies 3.2 2.2 2.2Other 0.4 1.3 0.8
Effective rate 34.3 31.6 31.0
2005 has been restated for IFRS and other adjustments. Details can be found in note 2 on pages 124 and 125.
The above excludes amounts relating to the discontinued operation. Details can be found in note 3 on page 126.
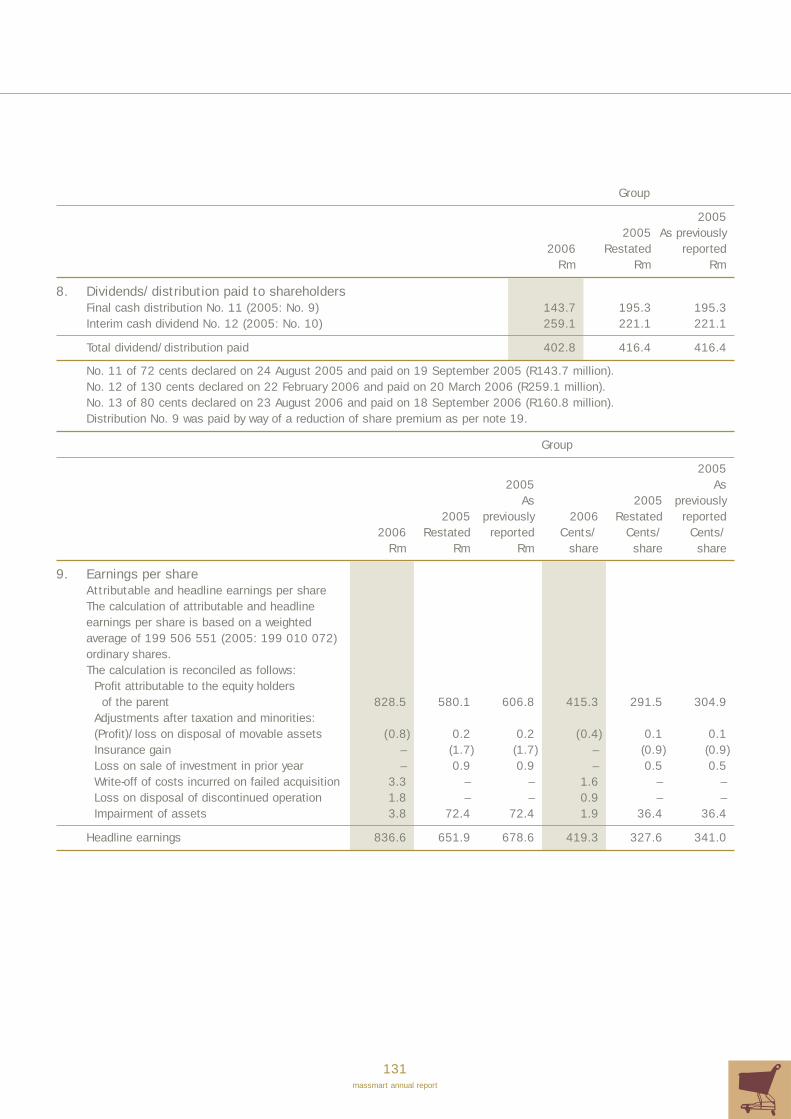
131massmart annual report
Group
20052005 As previously
2006 Restated reportedRm Rm Rm
8. Dividends/distribution paid to shareholdersFinal cash distribution No. 11 (2005: No. 9) 143.7 195.3 195.3Interim cash dividend No. 12 (2005: No. 10) 259.1 221.1 221.1
Total dividend/distribution paid 402.8 416.4 416.4
No. 11 of 72 cents declared on 24 August 2005 and paid on 19 September 2005 (R143.7 million).No. 12 of 130 cents declared on 22 February 2006 and paid on 20 March 2006 (R259.1 million).No. 13 of 80 cents declared on 23 August 2006 and paid on 18 September 2006 (R160.8 million).Distribution No. 9 was paid by way of a reduction of share premium as per note 19.
Group
20052005 As
As 2005 previously2005 previously 2006 Restated reported
2006 Restated reported Cents/ Cents/ Cents/Rm Rm Rm share share share
9. Earnings per shareAttributable and headline earnings per shareThe calculation of attributable and headline earnings per share is based on a weighted average of 199 506 551 (2005: 199 010 072) ordinary shares.The calculation is reconciled as follows:
Profit attributable to the equity holders of the parent 828.5 580.1 606.8 415.3 291.5 304.9
Adjustments after taxation and minorities:(Profit)/loss on disposal of movable assets (0.8) 0.2 0.2 (0.4) 0.1 0.1Insurance gain – (1.7) (1.7) – (0.9) (0.9)Loss on sale of investment in prior year – 0.9 0.9 – 0.5 0.5Write-off of costs incurred on failed acquisition 3.3 – – 1.6 – –Loss on disposal of discontinued operation 1.8 – – 0.9 – –Impairment of assets 3.8 72.4 72.4 1.9 36.4 36.4
Headline earnings 836.6 651.9 678.6 419.3 327.6 341.0
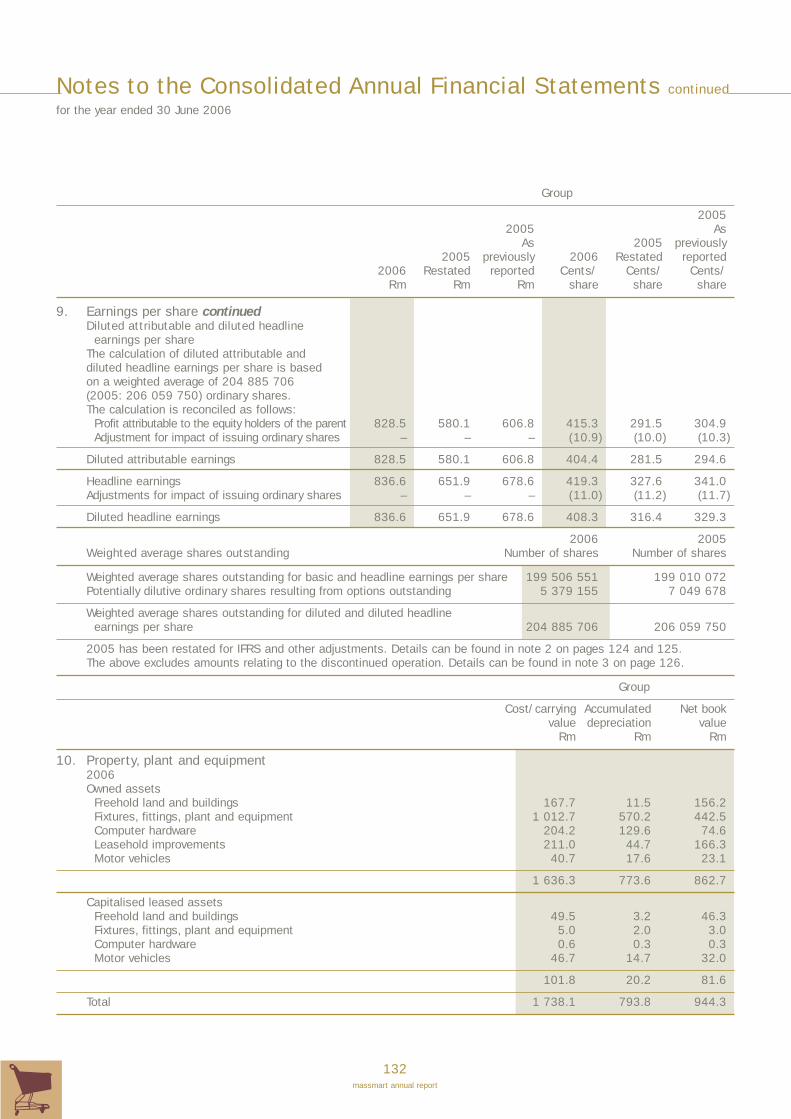
132massmart annual report
Notes to the Consolidated Annual Financial Statements continued
for the year ended 30 June 2006
Group
20052005 As
As 2005 previously2005 previously 2006 Restated reported
2006 Restated reported Cents/ Cents/ Cents/Rm Rm Rm share share share
9. Earnings per share continuedDiluted attributable and diluted headline
earnings per shareThe calculation of diluted attributable and diluted headline earnings per share is based on a weighted average of 204 885 706 (2005: 206 059 750) ordinary shares.The calculation is reconciled as follows:
Profit attributable to the equity holders of the parent 828.5 580.1 606.8 415.3 291.5 304.9Adjustment for impact of issuing ordinary shares – – – (10.9) (10.0) (10.3)
Diluted attributable earnings 828.5 580.1 606.8 404.4 281.5 294.6
Headline earnings 836.6 651.9 678.6 419.3 327.6 341.0Adjustments for impact of issuing ordinary shares – – – (11.0) (11.2) (11.7)
Diluted headline earnings 836.6 651.9 678.6 408.3 316.4 329.3
2006 2005Weighted average shares outstanding Number of shares Number of shares
Weighted average shares outstanding for basic and headline earnings per share 199 506 551 199 010 072Potentially dilutive ordinary shares resulting from options outstanding 5 379 155 7 049 678
Weighted average shares outstanding for diluted and diluted headline earnings per share 204 885 706 206 059 750
2005 has been restated for IFRS and other adjustments. Details can be found in note 2 on pages 124 and 125.The above excludes amounts relating to the discontinued operation. Details can be found in note 3 on page 126.
Group
Cost/carrying Accumulated Net bookvalue depreciation value
Rm Rm Rm
10. Property, plant and equipment2006Owned assets
Freehold land and buildings 167.7 11.5 156.2Fixtures, fittings, plant and equipment 1 012.7 570.2 442.5Computer hardware 204.2 129.6 74.6Leasehold improvements 211.0 44.7 166.3Motor vehicles 40.7 17.6 23.1
1 636.3 773.6 862.7
Capitalised leased assetsFreehold land and buildings 49.5 3.2 46.3Fixtures, fittings, plant and equipment 5.0 2.0 3.0Computer hardware 0.6 0.3 0.3Motor vehicles 46.7 14.7 32.0
101.8 20.2 81.6
Total 1 738.1 793.8 944.3
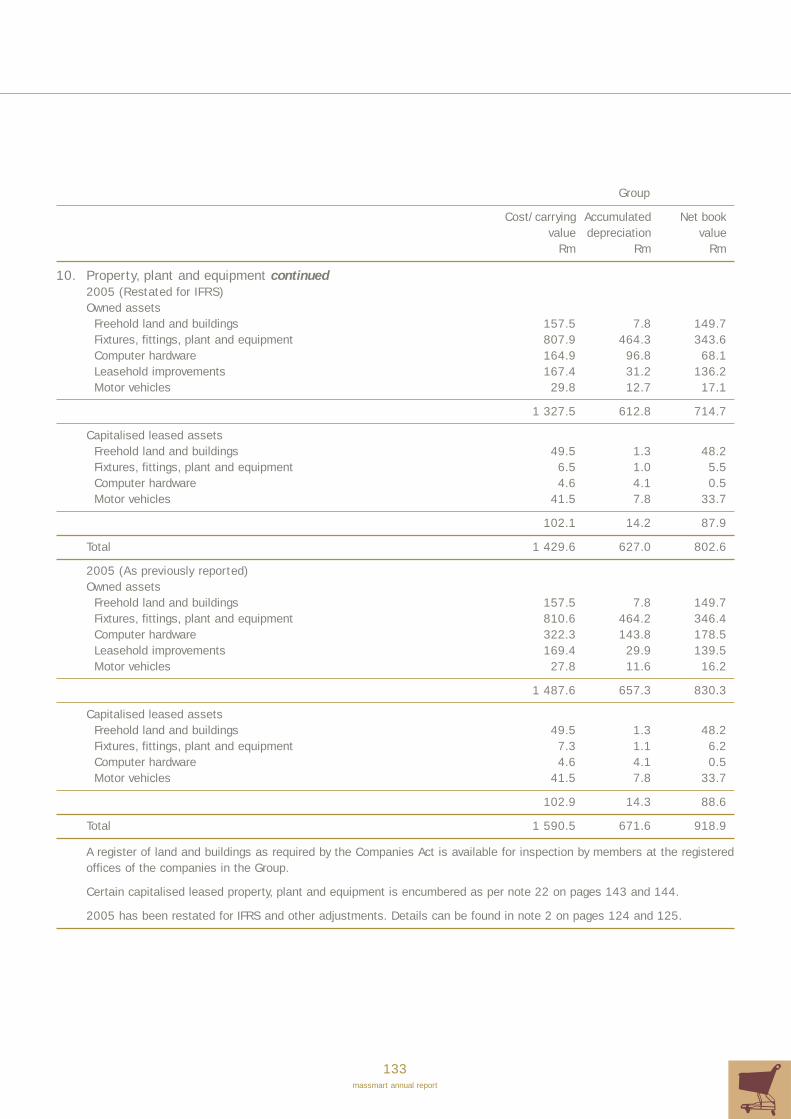
133massmart annual report
Group
Cost/carrying Accumulated Net bookvalue depreciation value
Rm Rm Rm
10. Property, plant and equipment continued2005 (Restated for IFRS)Owned assets
Freehold land and buildings 157.5 7.8 149.7Fixtures, fittings, plant and equipment 807.9 464.3 343.6Computer hardware 164.9 96.8 68.1Leasehold improvements 167.4 31.2 136.2Motor vehicles 29.8 12.7 17.1
1 327.5 612.8 714.7
Capitalised leased assetsFreehold land and buildings 49.5 1.3 48.2Fixtures, fittings, plant and equipment 6.5 1.0 5.5Computer hardware 4.6 4.1 0.5Motor vehicles 41.5 7.8 33.7
102.1 14.2 87.9
Total 1 429.6 627.0 802.6
2005 (As previously reported)Owned assets
Freehold land and buildings 157.5 7.8 149.7Fixtures, fittings, plant and equipment 810.6 464.2 346.4Computer hardware 322.3 143.8 178.5Leasehold improvements 169.4 29.9 139.5Motor vehicles 27.8 11.6 16.2
1 487.6 657.3 830.3
Capitalised leased assetsFreehold land and buildings 49.5 1.3 48.2Fixtures, fittings, plant and equipment 7.3 1.1 6.2Computer hardware 4.6 4.1 0.5Motor vehicles 41.5 7.8 33.7
102.9 14.3 88.6
Total 1 590.5 671.6 918.9
A register of land and buildings as required by the Companies Act is available for inspection by members at the registeredoffices of the companies in the Group.
Certain capitalised leased property, plant and equipment is encumbered as per note 22 on pages 143 and 144.
2005 has been restated for IFRS and other adjustments. Details can be found in note 2 on pages 124 and 125.

134massmart annual report
Notes to the Consolidated Annual Financial Statements continued
for the year ended 30 June 2006
Group
Opening De- De-
net book Opening Additions preciation preciation Foreign Closing
value as IFRS net book through continuing dis- exchange Re- net
previously restate- value Addi- acqui- opera- continued gain/ classifi- Write- book
reported ment restated tions sitions Disposals tions operation (loss) cations offs value
Rm Rm Rm Rm Rm Rm Rm Rm Rm Rm Rm Rm
10. Property, plant and equipment continuedReconciliation of property,
plant and equipment2006Owned assets
Freehold land and buildings 149.7 – 149.7 11.4 – (0.3) (3.6) – (1.0) – – 156.2Fixtures, fittings, plant
and equipment 346.4 (2.8) 343.6 199.2 – (1.6) (105.3) (0.1) 5.4 1.7 (0.4) 442.5Computer hardware 178.5 (110.4) 68.1 35.9 – – (37.7) – 8.2 0.2 (0.1) 74.6Leasehold improvements 139.5 (3.3) 136.2 42.2 – (2.2) (14.3) – 4.4 – – 166.3Motor vehicles 16.2 0.9 17.1 13.4 – (1.8) (6.6) (0.2) 0.2 1.2 (0.2) 23.1
830.3 (115.6) 714.7 302.1 – (5.9) (167.5) (0.3) 17.2 3.1 (0.7) 862.7
Capitalised leased assetsFreehold land and buildings 48.2 – 48.2 – – – (1.9) – – – – 46.3Fixtures, fittings, plant
and equipment 6.2 (0.7) 5.5 0.3 – – (1.1) – – (1.7) – 3.0Computer hardware 0.5 – 0.5 0.5 – – (0.5) – – (0.2) – 0.3Motor vehicles 33.7 – 33.7 11.4 – (1.3) (10.8) – 0.2 (1.2) – 32.0
88.6 (0.7) 87.9 12.2 – (1.3) (14.3) – 0.2 (3.1) – 81.6
Total 918.9 (116.3) 802.6 314.3 – (7.2) (181.8) (0.3) 17.4 – (0.7) 944.3
2005Owned assets
Freehold land and buildings 72.0 – 72.0 20.4 55.8 – (2.6) – (0.6) 4.7 – 149.7Fixtures, fittings, plant
and equipment 283.5 (0.9) 282.6 145.0 11.5 (1.0) (91.9) (0.1) (2.5) – – 343.6Computer hardware 104.8 (74.8) 30.0 52.9 6.0 (1.5) (19.0) (0.1) (0.2) – – 68.1Leasehold improvements 69.6 (0.8) 68.8 80.1 2.6 (1.3) (10.2) – (3.8) – – 136.2Motor vehicles 15.6 2.0 17.6 4.3 3.1 (1.1) (5.4) (0.3) (1.1) – – 17.1
545.5 (74.5) 471.0 302.7 79.0 (4.9) (129.1) (0.5) (8.2) 4.7 – 714.7
Capitalised leased assetsFreehold land and buildings 14.6 – 14.6 39.6 – – (1.3) – – (4.7) – 48.2Fixtures, fittings, plant
and equipment 2.3 (0.7) 1.6 – 4.3 – (0.4) – – – – 5.5Computer hardware 1.2 – 1.2 – 0.4 – (1.1) – – – – 0.5Motor vehicles 6.5 – 6.5 9.5 23.3 (0.4) (5.2) – – – – 33.7
24.6 (0.7) 23.9 49.1 28.0 (0.4) (8.0) – – (4.7) – 87.9
Total 570.1 (75.2) 494.9 351.8 107.0 (5.3) (137.1) (0.5) (8.2) – – 802.6
The write-off in the current period relates to the CBW Mkuze store which was destroyed by fire.
The Group has reviewed the residual values and useful lives of the assets for the purposes of depreciation. There were no materialadjustments in the current period.
There is no investment property in the Group and all assets are held at historical cost.
2005 has been restated for IFRS and other adjustments. Details can be found in note 2 on pages 124 and 125.
Depreciation has been split for continuing and discontinued operations. Details on the discontinued operation can be found in note 3 onpage 126.

135massmart annual report
Group
20052005 As previously
2006 Restated reportedRm Rm Rm
11. GoodwillCost/carrying value 1 441.5 1 395.0 1 395.0Accumulated impairment/amortisation (245.1) (245.1) (245.1)
Net book value 1 196.4 1 149.1 1 149.1
Reconciliation of goodwill:At the beginning of the year 1 149.9 616.7 616.7Additions 46.3 608.0 608.0Impairment on discontinued operation – (72.4) (72.4)Exchange differences 0.2 (2.4) (2.4)
At the end of the year 1 196.4 1 149.9 1 149.9
Goodwill acquired in a business combination is allocated, at acquisition,to the cash generating units (CGUs) that are expected to benefit from that business combination. Before recognition of impairment losses, the carrying amount of significant goodwill had been allocated as follows:
Jumbo Cash & Carry (Pty) Limited and Browns & Weirs Cash & Carry Holdings (Pty) Limited 248.2 248.2 248.2
CCW Wholesalers (Pty) Limited 168.5 158.2 158.2Builders Warehouse (a division of Masstores (Pty) Limited) 187.5 176.0 176.0Federated Timbers (Pty) Limited 336.9 336.9 336.9
The Group tests goodwill annually for impairment, or more frequently if there are indications that goodwill might be impaired.
When testing goodwill for impairment, the recoverable amounts of the CGUs are determined as the lower of value in use andfair value less costs to sell. The key assumptions for the value in use calculations are those regarding discount rates, growthrates and expected changes to selling prices and direct costs during the period. Management estimates discount rates usingrates that reflect current market assumptions of the time value of money and the risks specific to the CGUs. The growthrates are based on industry growth forecasts. Changes in selling prices and direct costs are based on past practices andexpectations of future changes in the market.
The Group prepares cash flow forecasts based on the CGUs June 2006 results for the next five years. A terminal value iscalculated based on an estimated growth rate of 3%. This rate does not exceed the average long-term growth rate for therelevant markets.
The rate used to discount the forecast cash flows is 14%.
An impairment loss of R72.4 million was recorded in Masscash in the prior year due to the reduced profitability of the Furnexbusiness model. No impairment was recognised in the current year.
The 2005 goodwill values were not restated for IFRS as IFRS 3 Business Combinations was already applicable to the June2005 annual report when these amounts where reported. Details on IFRS and other adjustments can be found in note 2 onpages 124 and 125.
Impairment has been split for continuing and discontinued operations. Details on the discontinued operation can be foundin note 3 on page 126.
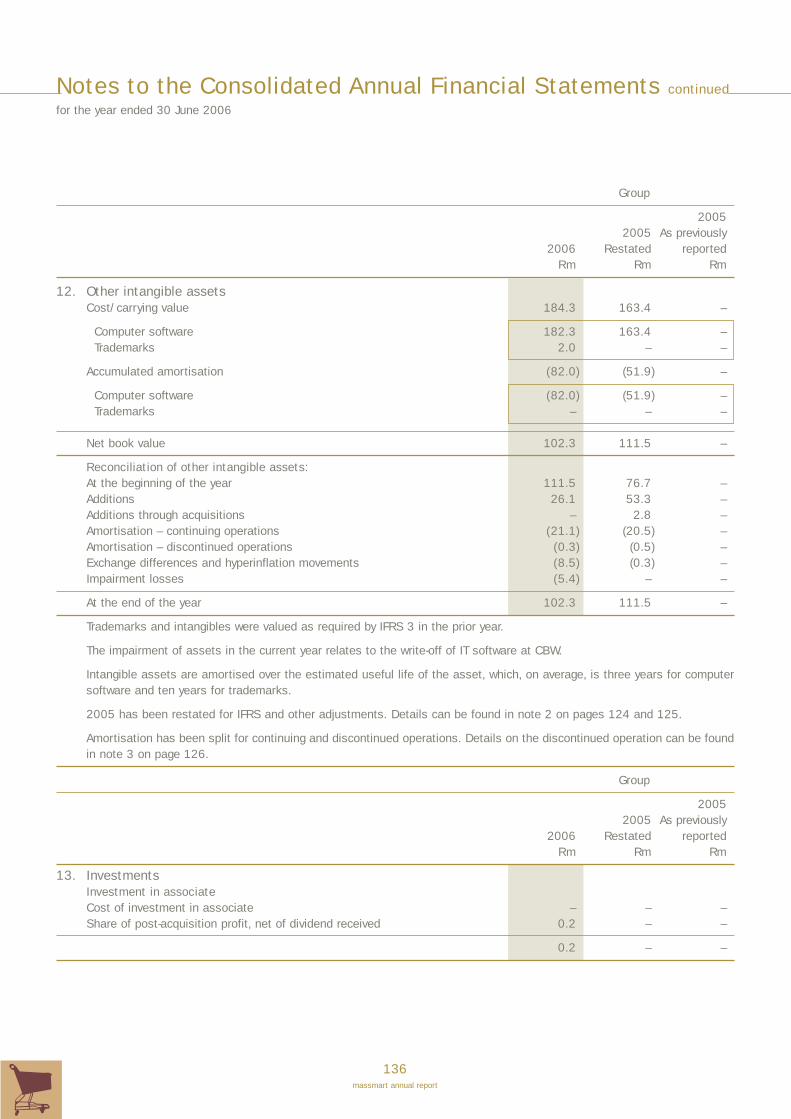
136massmart annual report
Notes to the Consolidated Annual Financial Statements continued
for the year ended 30 June 2006
Group
20052005 As previously
2006 Restated reportedRm Rm Rm
12. Other intangible assetsCost/carrying value 184.3 163.4 –
Computer software 182.3 163.4 –Trademarks 2.0 – –
Accumulated amortisation (82.0) (51.9) –
Computer software (82.0) (51.9) –Trademarks – – –
Net book value 102.3 111.5 –
Reconciliation of other intangible assets:At the beginning of the year 111.5 76.7 –Additions 26.1 53.3 –Additions through acquisitions – 2.8 –Amortisation – continuing operations (21.1) (20.5) –Amortisation – discontinued operations (0.3) (0.5) –Exchange differences and hyperinflation movements (8.5) (0.3) –Impairment losses (5.4) – –
At the end of the year 102.3 111.5 –
Trademarks and intangibles were valued as required by IFRS 3 in the prior year.
The impairment of assets in the current year relates to the write-off of IT software at CBW.
Intangible assets are amortised over the estimated useful life of the asset, which, on average, is three years for computersoftware and ten years for trademarks.
2005 has been restated for IFRS and other adjustments. Details can be found in note 2 on pages 124 and 125.
Amortisation has been split for continuing and discontinued operations. Details on the discontinued operation can be foundin note 3 on page 126.
Group
20052005 As previously
2006 Restated reportedRm Rm Rm
13. InvestmentsInvestment in associateCost of investment in associate – – –Share of post-acquisition profit, net of dividend received 0.2 – –
0.2 – –

137massmart annual report
13. Investments continuedDetails of the Group’s associate at 30 June 2006 are as follows:Name of associate Clidet No 484 (Pty) LimitedPlace of incorporation and operation South Africa Proportion of ownership interest 33.3%Proportion of voting power held 33.3%Principal activity Investment property
33.3% of the R100 share capital was purchased for R33. The financial reporting date for Clidet No 484 (Pty) Limited is 30 June.Group
20052005 As previously
2006 Restated reportedRm Rm Rm
Summarised financial information in respect of the Group’s associate is set out below:
Total assets 32.1 – –Total liabilities 31.6 – –
Net assets 0.5 – –
Group’s share of associate’s net assets 0.2 – –
Revenue 4.8 – –
Profit for the year 0.5 – –
Group’s share of associate’s profit for the year 0.2 – –
The Group’s share of associates’ profit for the year has been included in ‘net operating costs’ in the consolidated income statement.
Unlisted investmentsHeld for tradingInvestment opening balance 105.0 60.0 60.0Fair value adjustments taken to income statement 44.4 45.0 45.0
149.4 105.0 105.0
Loans and receivables
Opening balance 7.0 8.9 12.5Disposals (0.5) – –Amortisation taken to income statement (1.6) (1.9) (1.9)
4.9 7.0 10.6
Held to maturityPreference share investment 420.5 364.7 364.7Offset of related long-term liability (384.5) (321.7) (321.7)Other investments 0.3 0.3 0.3
36.3 43.3 43.3
190.6 155.3 158.9
Listed investmentsOther investments 0.1 0.1 0.1
0.1 0.1 0.1
Total investments 190.9 155.4 159.0
The directors’ value the unlisted investments, net of the offset of the related long-term liability, at R190.6 million (2005:R155.3 million). The preference share investment represents cumulative preference shares in Fullimput 65 (Pty) Limited.A long-term liability of the Group is secured by a cession of the preference shares and legal offset is permitted. For IAS 39 accounting treatment of these investments, see note 35, "Financial risk management". 2005 has been restated for IFRS and other adjustments. Details can be found in note 2 on pages 124 and 125.

138massmart annual report
Notes to the Consolidated Annual Financial Statements continued
for the year ended 30 June 2006
Group
20052005 As previously
2006 Restated reportedRm Rm Rm
14. Other financial assetsHousing loans to the directors and Executive Committee members
of Massmart Holdings Limited:
Balance at the beginning of the year 1.1 1.1 1.1Advanced during the year 0.8 – –
Balance at the end of the year 1.9 1.1 1.1
Employee share trust loans to the directors and Executive Committee members of Massmart Holdings Limited:
Balance at the beginning of the year 71.9 65.4 –Advanced during the year 83.8 22.3 –Repayments (11.2) (15.8) –
Balance at the end of the year 144.5 71.9 –
Other employee loans:Housing and staff loans 5.0 5.0 5.0Employee share trust loans 5.0 11.8 83.7
Finance lease deposit 34.3 29.9 29.9
44.3 46.7 118.6
190.7 119.7 119.7
These loans are classified as “Loans and receivables” for IAS 39 purposes. See note 35, “Financial risk management”, forIAS 39 accounting treatment.
2005 has been restated for IFRS and other adjustments. Details can be found in note 2 on pages 124 and 125.
All housing and staff loans, including loans to directors, bear interest at various rates below the prime interest rate. Theloans to the employee share trust participants, including executive directors, are interest-free and are secured by theunderlying shares. The finance lease deposit accrues interest at 13.6%.
Detailed housing and employee share trust loans to the directors and Executive Committee members of MassmartHoldings Limited:
Group
RemainingLamberti, Hayward, Pattison, Nothnagel, Executive
MJ GRC GM S Committee TotalRm Rm Rm Rm Rm Rm
2006Balance at the beginning of the year 37.4 12.1 5.1 – 18.4 73.0Advanced during the year 1.1 8.7 41.1 – 33.7 84.6Repayments (7.0) (0.8) (0.9) – (2.5) (11.2)
Balance at the end of the year 31.5 20.0 45.3 – 49.6 146.4
2005Balance at the beginning of the year 45.7 4.0 7.5 – 9.3 66.5Advanced during the year 1.4 8.5 0.2 – 12.2 22.3Repayments (9.7) (0.4) (2.6) – (3.1) (15.8)
Balance at the end of the year 37.4 12.1 5.1 – 18.4 73.0

139massmart annual report
Group
20052005 As previously
2006 Restated reportedRm Rm Rm
15. Deferred taxationThe major movements during the period are analysed as follows:Net asset at the beginning of the year 330.4 261.0 263.9Charge to profit and loss for the year 0.2 27.1 26.0(Credit)/debit to equity (16.7) 35.5 –Disposal of subsidiary (1.6) – –Arising from acquisitions – 6.8 6.8
Net asset at the end of the year 312.3 330.4 296.7
The major components of deferred taxation are analysed as follows:Trademarks 18.1 45.6 45.6Assessed loss unutilised 47.8 59.7 59.7Export partnerships (5.4) (5.8) (5.8)Debtors provisions 21.6 17.0 10.1Prepayments (75.3) (57.6) (57.6)Creditors provisions 63.0 48.6 48.6Property, plant and equipment (20.4) (23.3) (21.2)Finance leases 15.3 15.4 15.4Long-term provisions 1.8 9.9 9.9Income not accrued (0.2) (2.7) (2.2)Deferred income 45.5 31.2 1.8Operating lease adjustment 214.0 200.2 200.2Other temporary differences (13.5) (7.8) (7.8)
312.3 330.4 296.7
The net deferred tax position is reconciled as follows:Deferred taxation assets 409.5 430.5 394.2Deferred taxation liabilities (97.2) (100.1) (97.5)
312.3 330.4 296.7
2005 has been restated for IFRS and other adjustments. Details can be found in note 2 on pages 124 and 125.
16. InventoriesMerchandise 3 221.0 2 677.0 2 658.0Inventories are carried at the lower of cost or net realisable valueInventories carried at net realisable value included above 31.5 89.5 89.5
2005 has been restated for IFRS and other adjustments. Details can be found in note 2 on pages 124 and 125.
Group
20052005 As previously
2006 Restated reportedRm Rm Rm

140massmart annual report
Notes to the Consolidated Annual Financial Statements continued
for the year ended 30 June 2006
Group
2006 2005 2004Rm Rm Rm
17. Trade receivables and prepaymentsNet trade accounts receivable 860.8 1 025.7 1 048.7Net consumer accounts receivable 264.5 255.9 255.9Prepayments 51.8 41.5 41.4Other accounts receivable 592.9 513.8 494.6
1 770.0 1 836.9 1 840.6
Trade receivables and prepayments are classified as “Loans and receivables” for IAS 39 purposes. See note 35.“Financial risk management” for IAS 39 accounting treatment.
2005 has been restated for IFRS and other adjustments. Details can be found in note 2 on pages 124 and 125.
18. Share capitalAuthorised500 000 000 (2005: 500 000 000) ordinary shares of 1 cent each 5.0 5.0 5.020 000 000 (2005: nil) non-redeemable cumulative non-participating
preference shares of 1 cent each 0.2 – –18 000 000 (2005: nil) “A” Convertible redeemable non-cumulative
participating preference shares of 1 cent each 0.2 – –2 000 000 (2005: nil) “B” Convertible redeemable participating preference
shares of 1 cent each – – –
Issued201 040 697 (2005: 199 640 697) ordinary shares of 1 cent each 2.0 2.0 2.0
Except for the issue of 1 400 000 ordinary shares issued in terms of the Massmart share incentive scheme, there were noother movements in the share capital of the Company during the current reporting period.
Included in the issued share capital are 335 764 treasury shares at the end of the year. There were no treasury shares inthe prior year.
The directors have the authority, until the next annual general meeting, to issue the ordinary shares of the Company up to amaximum of 5% of the shares already issued.
The directors have the authority, until the next annual general meeting, to issue the preference shares of the Company.
2005 has been restated for IFRS and other adjustments. Details can be found in note 2 on pages 124 and 125.
19. Share premiumOpening balance 209.4 356.4 356.4Premium on shares issued during the year (net of costs) 71.5 18.8 18.8Distribution to shareholders – (195.3) (195.3)Treasury shares (18.3) 29.5 29.5
262.6 209.4 209.4
2005 has been restated for IFRS and other adjustments. Details can be found in note 2 on pages 124 and 125.
Group
2006 2005 2004Rm Rm Rm
Group
2006 2005 2004Rm Rm Rm

141massmart annual report
Group
20052005 As previously
2006 Restated reportedRm Rm Rm
20. Non-distributable reservesForeign currency translation reserve 9.1 (0.5) 3.4Share-based payment reserve 43.4 26.0 –Capital redemption reserve fund 0.2 0.2 0.2Deferred taxation on trademarks 12.2 18.0 18.0Amortisation of trademarks 77.7 77.7 77.7Change in minority interests 0.8 0.7 0.7
143.4 122.1 100.0
Reconciliation of the foreign currency translation reserve:Opening balance (0.5) – (1.0)Translation on consolidation 10.5 (0.5) 4.4Hyperinflation adjustment (0.9) – –
Closing balance 9.1 (0.5) 3.4
Reconciliation of the share-based payment reserve:Opening balance 26.0 9.0 –Share-based payment expense 17.4 17.0 –
Closing balance 43.4 26.0 –
2005 has been restated for IFRS and other adjustments. Details can be found in note 2 on pages 124 and 125.
At year-end, no preference shares had been issued for the Thuthukani trust. Details relating to the Thuthukani trust can befound on pages 82 and 83.
Details of the Employee share incentive scheme can be found in note 25 on pages 147 and 149. The share-based paymentvaluation was performed by Alexander Forbes for all periods.
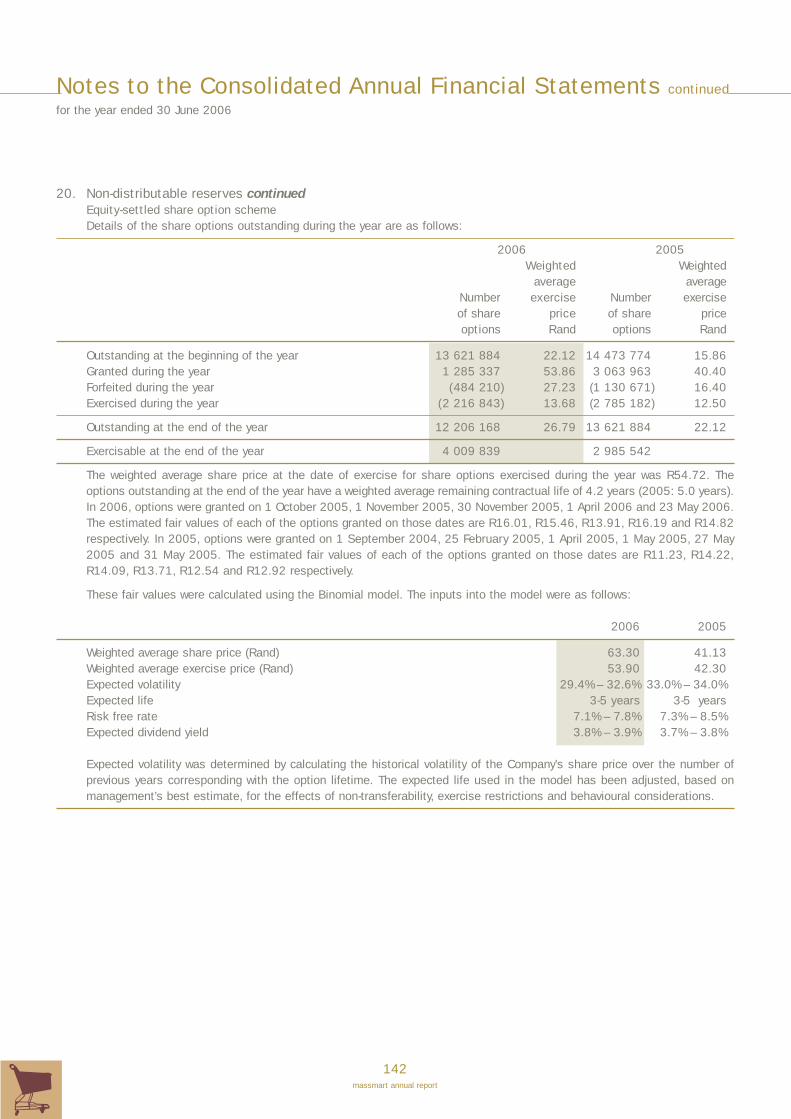
142massmart annual report
Notes to the Consolidated Annual Financial Statements continued
for the year ended 30 June 2006
20. Non-distributable reserves continuedEquity-settled share option schemeDetails of the share options outstanding during the year are as follows:
2006 2005Weighted Weighted
average averageNumber exercise Number exerciseof share price of share priceoptions Rand options Rand
Outstanding at the beginning of the year 13 621 884 22.12 14 473 774 15.86Granted during the year 1 285 337 53.86 3 063 963 40.40Forfeited during the year (484 210) 27.23 (1 130 671) 16.40Exercised during the year (2 216 843) 13.68 (2 785 182) 12.50
Outstanding at the end of the year 12 206 168 26.79 13 621 884 22.12
Exercisable at the end of the year 4 009 839 2 985 542
The weighted average share price at the date of exercise for share options exercised during the year was R54.72. Theoptions outstanding at the end of the year have a weighted average remaining contractual life of 4.2 years (2005: 5.0 years).In 2006, options were granted on 1 October 2005, 1 November 2005, 30 November 2005, 1 April 2006 and 23 May 2006.The estimated fair values of each of the options granted on those dates are R16.01, R15.46, R13.91, R16.19 and R14.82respectively. In 2005, options were granted on 1 September 2004, 25 February 2005, 1 April 2005, 1 May 2005, 27 May2005 and 31 May 2005. The estimated fair values of each of the options granted on those dates are R11.23, R14.22,R14.09, R13.71, R12.54 and R12.92 respectively.
These fair values were calculated using the Binomial model. The inputs into the model were as follows:
2006 2005
Weighted average share price (Rand) 63.30 41.13Weighted average exercise price (Rand) 53.90 42.30Expected volatility 29.4% – 32.6% 33.0% – 34.0%Expected life 3-5 years 3-5 yearsRisk free rate 7.1% – 7.8% 7.3% – 8.5%Expected dividend yield 3.8% – 3.9% 3.7% – 3.8%
Expected volatility was determined by calculating the historical volatility of the Company’s share price over the number ofprevious years corresponding with the option lifetime. The expected life used in the model has been adjusted, based onmanagement’s best estimate, for the effects of non-transferability, exercise restrictions and behavioural considerations.
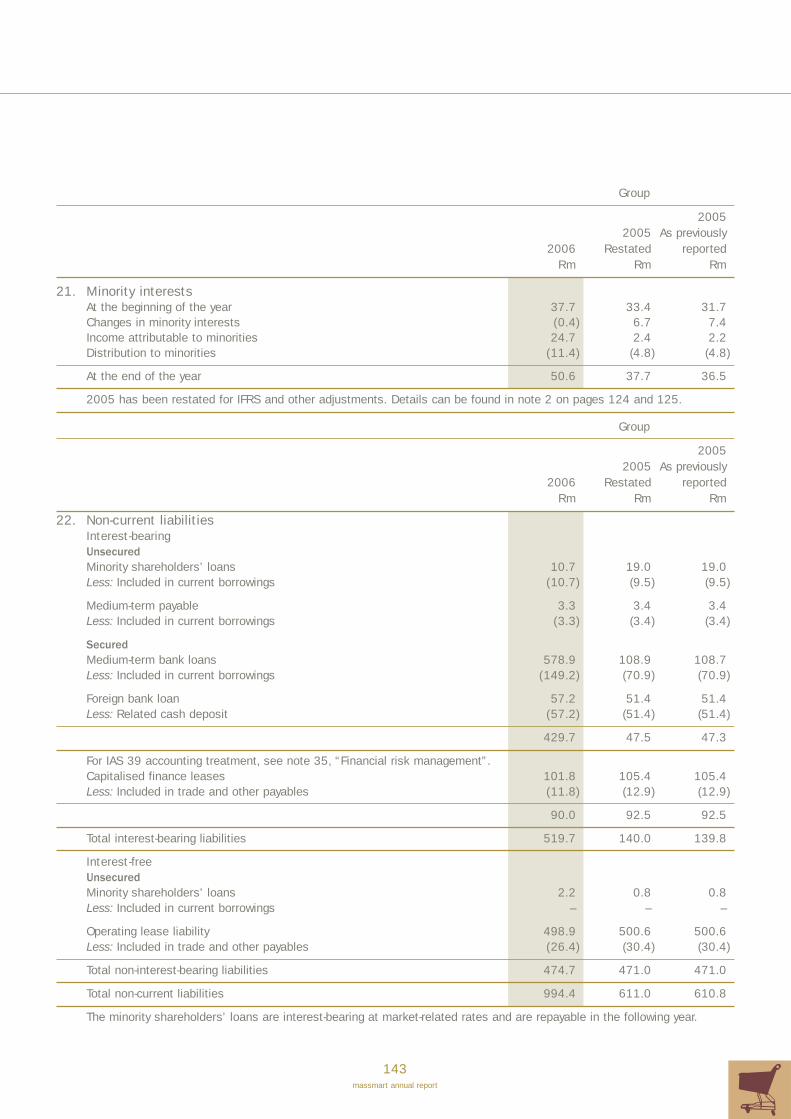
143massmart annual report
Group
20052005 As previously
2006 Restated reportedRm Rm Rm
21. Minority interestsAt the beginning of the year 37.7 33.4 31.7Changes in minority interests (0.4) 6.7 7.4Income attributable to minorities 24.7 2.4 2.2Distribution to minorities (11.4) (4.8) (4.8)
At the end of the year 50.6 37.7 36.5
2005 has been restated for IFRS and other adjustments. Details can be found in note 2 on pages 124 and 125.
22. Non-current liabilitiesInterest-bearingUnsecuredMinority shareholders’ loans 10.7 19.0 19.0Less: Included in current borrowings (10.7) (9.5) (9.5)
Medium-term payable 3.3 3.4 3.4Less: Included in current borrowings (3.3) (3.4) (3.4)
SecuredMedium-term bank loans 578.9 108.9 108.7Less: Included in current borrowings (149.2) (70.9) (70.9)
Foreign bank loan 57.2 51.4 51.4Less: Related cash deposit (57.2) (51.4) (51.4)
429.7 47.5 47.3
For IAS 39 accounting treatment, see note 35, “Financial risk management”.Capitalised finance leases 101.8 105.4 105.4Less: Included in trade and other payables (11.8) (12.9) (12.9)
90.0 92.5 92.5
Total interest-bearing liabilities 519.7 140.0 139.8
Interest-freeUnsecuredMinority shareholders’ loans 2.2 0.8 0.8Less: Included in current borrowings – – –
Operating lease liability 498.9 500.6 500.6Less: Included in trade and other payables (26.4) (30.4) (30.4)
Total non-interest-bearing liabilities 474.7 471.0 471.0
Total non-current liabilities 994.4 611.0 610.8
The minority shareholders’ loans are interest-bearing at market-related rates and are repayable in the following year.
Group
20052005 As previously
2006 Restated reportedRm Rm Rm

144massmart annual report
Notes to the Consolidated Annual Financial Statements continued
for the year ended 30 June 2006
22. Non-current liabilities continuedTwo medium-term bank loans, raised in 2001, are repayable in ten equal instalments over five years, One loan bears interestat a fixed rate of 6.6% and the other bears interest at a floating rate linked to the ninety-day JIBAR. The loans are securedby intra-group cross-suretyships.
A further two medium-term bank loans, raised in the current year to fund the Massbuild acquisitions, are repayable in nineequal instalments over five years. Both loans bear interest at a fixed rate of 8.8% and 8.7%. The loans are secured by intra-group cross-suretyships.
The foreign bank loan relates to a US Dollar denominated loan in one of Massdiscounter’s foreign operations which has alegal right of offset with a US Dollar denominated cash deposit. The interest rate is 0.5% below the US Dollar prime overdraftrate.
Capitalised finance leases include vehicle, fixtures, fittings, plant and computer equipment and property leases, repayablein monthly instalments varying from one to five years at varying interest rates, some linked to the prime overdraft rate andone fixed at 13.8%.
The capitalised finance leases are secured by moveable assets of R35.3 million (2005: R39.7 million) and the propertylease by the value of the underlying land.
Included in current borrowings is a medium-term payable of R3.3 million (2005: R3.4 million), which is an amount owing tothe Massmart Education Trust relating to cash held on its behalf.
The operating lease liability relates to the lease smoothing adjustment required by AC105 Leases.
2005 has been restated for IFRS and other adjustments. Details can be found in note 2 on pages 124 and 125.
The maturity profile of amounts payable under medium-term bank loans, short-term payables, minority shareholder loans andthe finance leases is as follows:
Repayable Repayable in Repayablewithin 1 year* 2 – 5 years after 5 years Total
Rm Rm Rm Rm
Medium-term bank loansAmount owing 189.7 489.5 – 679.2Less: Future finance charges (40.5) (59.8) – (100.3)
Present value of obligations 149.2 429.7 – 578.9
Medium-term payableAmount owing 3.3 – – 3.3Less: Future finance charges – – – –
Present value of obligations 3.3 – – 3.3
Minority shareholders’ loansAmount owing 10.7 1.4 0.8 12.9Less: Future finance charges – – – –
Present value of obligations 10.7 1.4 0.8 12.9
Capitalised finance leasesAmount owing 23.2 64.5 74.5 162.2Less: Future finance charges (11.4) (27.2) (21.8) (60.4)
Present value of obligations 11.8 37.3 52.7 101.8
Total 175.0 468.4 53.5 696.9
* Included in current borrowings on the balance sheet.
For IAS 39 accounting treatment, see note 35,“Financial risk management”.

145massmart annual report
Group
20052005 As previously
2006 Restated reportedRm Rm Rm
23. Non-current provisionsOnerous lease provision 4.2 4.4 4.4Less: Payable within one year included in current provisions (1.0) (0.8) (0.8)Provision for post-retirement medical aid contributions and other
medical aid provisions 39.0 29.8 29.8
42.2 33.4 33.4
Repayable Repayable in Repayable within 1 year* 2 – 5 years after 5 years Total
Rm Rm Rm Rm
2006 1.0 3.2 39.0 43.22005 0.8 2.9 30.5 34.2
* Included in current provisions in note 24.
Certain Group companies provide post-retirement healthcare benefits to their retirees. This fund is accounted for as adefined benefit plan and measured using the projected unit credit method. The liability is unfunded. The main assumptionused in calculating the costs and the provision is an “interest rate – medical inflation rate” gap of 1.5% (2005: 2.0%).
Group
20052005 As previously
2006 Restated reportedRm Rm Rm
The net expense recognised in the income statement is:Current service cost 1.6 1.7 1.7Interest cost 2.4 3.6 3.6Benefits paid against balance sheet held liability (1.8) (0.8) (0.8)Net actuarial loss/(gain) recognised in the year 7.0 (4.3) (4.3)
Net expense recognised as part of employment costs 9.2 0.2 0.2
Movements in the post-retirement medical aid net liability:Opening defined benefit obligation 29.8 29.6 29.6Expense as above 9.2 0.2 0.2
Closing defined benefit obligation 39.0 29.8 29.8
The last valuation of the liability for the post-retirement medical aid contributions was performed as at June 2006 byAlexander Forbes (2005: MS Corporate Solutions), Fellow of the Institute of Actuaries. The current year costs have beenassessed in accordance with the advice of independent actuaries.
The net actuarial loss in the current year arose as a result of a combination of the following factors:• A loss of R3.2 million arose as a result of a decrease in the real discount rate, i.e. the difference between the discount
rate and the healthcare cost inflation assumption, from 2.0% per annum to 1.5% per annum. This change was necessitatedin real bond yields underlying the discount rate.
• A loss of R0.5 million arose as a result of the use of updated pre-employment mortality tables.• Lower than expected inflation of medical scheme contributions resulted in a gain of R0.1 million.• Previously the date of joining the medical scheme was used as an approximation for in-service members’ date of
employment. Using the actual dates of employment for in-service members we could match to previous valuations resultedin a loss of R1.3 million. Other miscellaneous items including a higher than expected decrease in the number of in-servicemembers resulted in a net loss of R2.1 million.
Other than the changes listed above, the remaining assumptions are consistent with the assumptions applied in the prior year.
2005 has been restated for IFRS and other adjustments. Details can be found in note 2 on pages 124 and 125.

146massmart annual report
Notes to the Consolidated Annual Financial Statements continued
for the year ended 30 June 2006
Group
20052005 As previously
2006 Restated reportedRm Rm Rm
24. ProvisionsRestructuring costs raised on acquisition 4.3 5.7 5.7Onerous lease provision 1.0 0.8 0.8
5.3 6.5 6.5
Provisions raised against specific assets, for example inventories and accounts receivable, are offset against those assets.
Opening Amounts Amounts Closingbalance provided utilised balance
Rm Rm Rm Rm
Reconciliation of provisions2006Restructuring costs raised on acquisition 5.7 – (1.4) 4.3Onerous lease provision 0.8 1.0 (0.8) 1.0
6.5 1.0 (2.2) 5.3
2005 (restated for IFRS)
Restructuring costs raised on acquisition 6.8 – (1.1) 5.7Onerous lease provision 0.8 0.8 (0.8) 0.8
7.6 0.8 (1.9) 6.5
2005 (as previously reported)
Restructuring costs raised on acquisition 6.8 – (1.1) 5.7Onerous lease provision 0.8 0.8 (0.8) 0.8
7.6 0.8 (1.9) 6.5
2005 has been restated for IFRS and other adjustments. Details can be found in note 2 on pages 124 and 125.
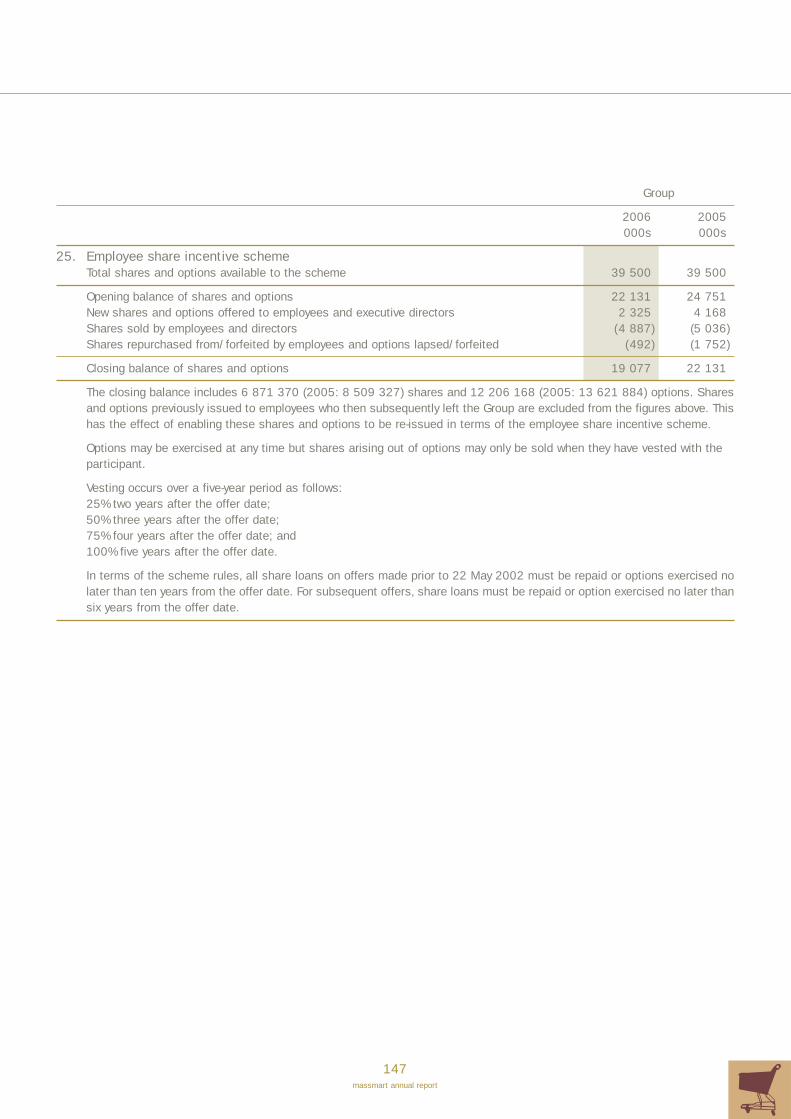
147massmart annual report
Group
2006 2005000s 000s
25. Employee share incentive schemeTotal shares and options available to the scheme 39 500 39 500
Opening balance of shares and options 22 131 24 751New shares and options offered to employees and executive directors 2 325 4 168Shares sold by employees and directors (4 887) (5 036)Shares repurchased from/forfeited by employees and options lapsed/forfeited (492) (1 752)
Closing balance of shares and options 19 077 22 131
The closing balance includes 6 871 370 (2005: 8 509 327) shares and 12 206 168 (2005: 13 621 884) options. Sharesand options previously issued to employees who then subsequently left the Group are excluded from the figures above. Thishas the effect of enabling these shares and options to be re-issued in terms of the employee share incentive scheme.
Options may be exercised at any time but shares arising out of options may only be sold when they have vested with theparticipant.
Vesting occurs over a five-year period as follows:25% two years after the offer date;50% three years after the offer date;75% four years after the offer date; and100% five years after the offer date.
In terms of the scheme rules, all share loans on offers made prior to 22 May 2002 must be repaid or options exercised nolater than ten years from the offer date. For subsequent offers, share loans must be repaid or option exercised no later thansix years from the offer date.
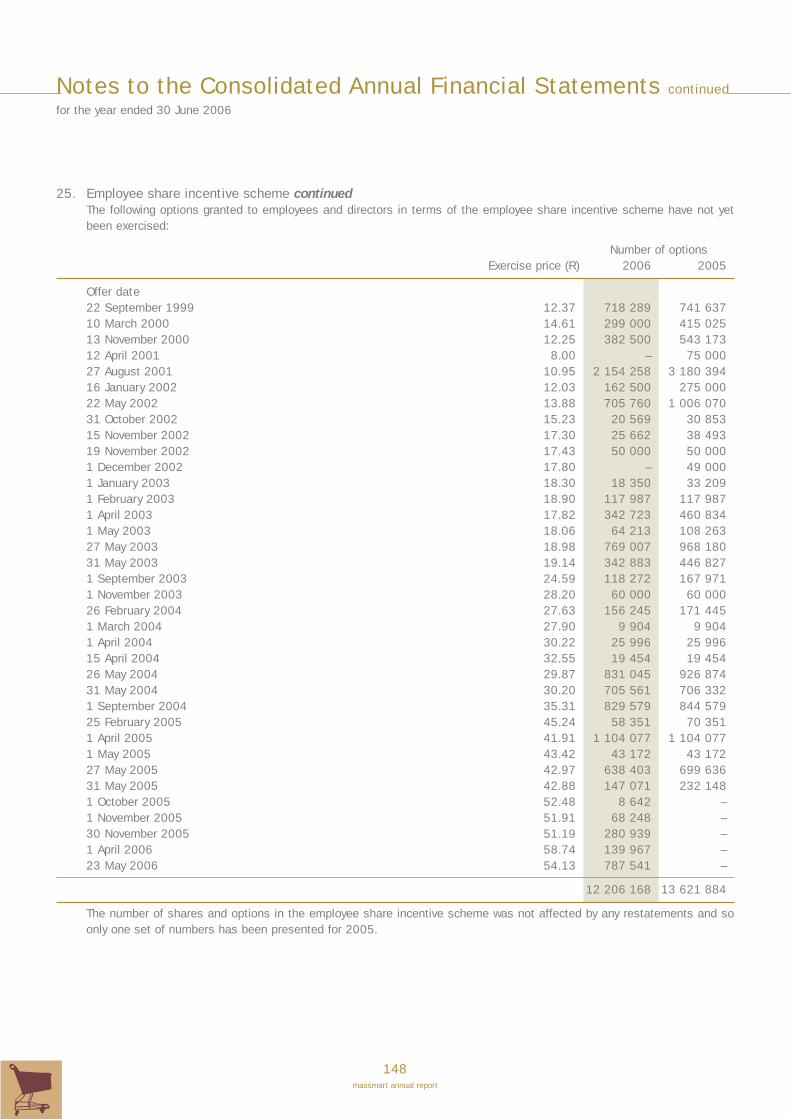
148massmart annual report
Notes to the Consolidated Annual Financial Statements continued
for the year ended 30 June 2006
25. Employee share incentive scheme continuedThe following options granted to employees and directors in terms of the employee share incentive scheme have not yetbeen exercised:
Number of optionsExercise price (R) 2006 2005
Offer date22 September 1999 12.37 718 289 741 63710 March 2000 14.61 299 000 415 02513 November 2000 12.25 382 500 543 17312 April 2001 8.00 – 75 00027 August 2001 10.95 2 154 258 3 180 39416 January 2002 12.03 162 500 275 00022 May 2002 13.88 705 760 1 006 07031 October 2002 15.23 20 569 30 85315 November 2002 17.30 25 662 38 49319 November 2002 17.43 50 000 50 0001 December 2002 17.80 – 49 0001 January 2003 18.30 18 350 33 2091 February 2003 18.90 117 987 117 9871 April 2003 17.82 342 723 460 8341 May 2003 18.06 64 213 108 26327 May 2003 18.98 769 007 968 18031 May 2003 19.14 342 883 446 8271 September 2003 24.59 118 272 167 9711 November 2003 28.20 60 000 60 00026 February 2004 27.63 156 245 171 4451 March 2004 27.90 9 904 9 9041 April 2004 30.22 25 996 25 99615 April 2004 32.55 19 454 19 45426 May 2004 29.87 831 045 926 87431 May 2004 30.20 705 561 706 3321 September 2004 35.31 829 579 844 57925 February 2005 45.24 58 351 70 3511 April 2005 41.91 1 104 077 1 104 0771 May 2005 43.42 43 172 43 17227 May 2005 42.97 638 403 699 63631 May 2005 42.88 147 071 232 1481 October 2005 52.48 8 642 –1 November 2005 51.91 68 248 –30 November 2005 51.19 280 939 –1 April 2006 58.74 139 967 –23 May 2006 54.13 787 541 –
12 206 168 13 621 884
The number of shares and options in the employee share incentive scheme was not affected by any restatements and soonly one set of numbers has been presented for 2005.

149massmart annual report
26. Retirement benefit informationAll full-time permanent Massmart staff are members of either the Massmart Pension Fund, the Massmart Provident Fund orthe SACCAWU National Provident Fund. These funds are defined contribution funds and are subject to the Pension FundsAct, 1956. Following the recent acquisitions, many of their staff are still members of the retirement funds of the previousbusiness owners. Projects are under way to transfer these employees to one of the above funds in future.
The Massmart Pension Fund and the Massmart Provident Fund are required to submit a statutory actuarial valuation to theFinancial Services Board every three years. The funds’ Valuator certified that the funds were financially sound at 28 February2005 and that the assets were suitable in nature, in terms of the liabilities as at valuation date.
Contributions received by the funds for the year ended 30 June 2006 amounted to R166 million (2005: R116 million). TheGroup’s contribution of R100 million (2005: R69 million) was included in the income statement for the year as part ofemployee costs.
Group
20052005 As previously
2006 Restated reportedRm Rm Rm
27. CommitmentsCommitments in respect of capital expenditure approved by directors:Contracted for 183.0 114.6 114.6Not contracted for 143.0 230.5 230.5Acquisition commitment – 480.0 480.0
326.0 825.1 825.1
Commitments contracted for include various new Massdiscounters stores to be opened in Africa and South Africa. They alsoinclude refurbishments at certain Makro and Massdiscounters stores.
Commitments not contracted for include the maintenance and refurbishment of certain CBW, Builders Warehouse, FederatedTimbers and Massdiscounters stores. These commitments also include the opening of a new Servistar store and therelocation of part of the Builders Warehouse and the entire CBW head offices.
The acquisition commitment in the prior year was for Moresport. During the year The Competition Tribunal prohibited theacquisition from taking place.
Massmart has the right of first refusal on the sale of any shares by the minority shareholders in various CBW stores.Historically Massmart has exercised this right. The amount to be paid in future, should Massmart exercise its right, totalsR42 million.

150massmart annual report
Notes to the Consolidated Annual Financial Statements continued
for the year ended 30 June 2006
Group
20052005 As previously
2006 Restated reportedRm Rm Rm
28. Operating lease commitmentsLand and buildings
Year 1 608.8 483.5 483.5Years 2 to 5 2 592.9 2 048.7 2 048.7Subsequent to year 5 2 679.4 2 250.5 2 250.5
5 881.1 4 782.7 4 782.7
Plant and equipmentYear 1 7.4 7.5 7.5Years 2 to 5 24.2 20.0 20.0Subsequent to year 5 2.5 2.6 2.6
34.1 30.1 30.1
OtherYear 1 16.3 17.2 17.2Years 2 to 5 16.9 32.1 32.1Subsequent to year 5 28.8 – –
62.0 49.3 49.3
Promissory notes that represent commitments under non-cancellable operating leases of R1 172 million (2005: R1 275 million)entered into by Masstores (Pty) Limited on behalf of Makro are included in operating lease commitments in landand buildings. These leases terminate in December 2020 and have a discounted present value of R703 million(2005: R716 million). In accordance with IAS 17 Leases, the rentals paid are amortised over the entire remaining leaseperiod on a straight-line basis.
29. Contingent liabilitiesGuarantees in respect of creditors of subsidiary company – 1.5 1.5
There are no legal or arbitration proceedings, of which the Group is aware, which would have a material effect on the Group’sfinancial position.
Group
20052005 As previously
2006 Restated reportedRm Rm Rm

151massmart annual report
30. Related party transactionsTransactions between the Company and its subsidiaries, which are related parties of the Company, have been eliminated onconsolidation and are not disclosed in this note. Details of transactions between the Group and other related parties aredisclosed below.
Compensation of key management personnelThe remuneration of directors and other key management (defined as the Massmart Executive Committee) during the year was as follows:
Group
2006 2005Rm Rm
Short-term benefits 56.5 30.0Post-employment benefits 1.5 1.1Other long-term benefits 6.0 –Gains on exercise of share options 16.3 7.0
80.3 38.1
The remuneration of directors and key executives is determined by the Remuneration Committee having regard to theperformance of individuals and market trends. In 2006 there were three more members of the Executive Committee thanin 2005.
Other related party transactionsCertain properties used by Servistar are leased from 152 Alexandra Road Properties (Pty) Limited owned by John Keil.John Keil is a director and the former owner of Servistar.
Certain properties used by CBW are leased from CCW Property Holdings in which Robin Wright has an 8.54% shareholding.Robin Wright is a director and a former owner of CBW.
Certain properties used by De La Rey are leased from the Carlos Gomez Family Trust. Carlos Gomez is a director ofDe La Rey. Robbie Best, also a director of De La Rey, and Carlos Gomez are minority shareholders in that company.
From time to time, in the normal course of business, Massmart and its divisions make use of private aircraft hired fromcompetitively selected charter companies, two of which operate aircraft indirectly beneficially owned by Mr MJ Lamberti.
Loans to directors have been disclosed in note 14 on page 138.
152massmart annual report
Notes to the Consolidated Annual Financial Statements continued
for the year ended 30 June 2006
31. Directors’ emolumentsExecutive directors’ remunerationThe comments below provide further background andcontext to the figures disclosed in Directors’ Emolumentsbelow and Interests of Directors (note 32).
MJ LambertiMark’s salary and allowances were unchanged from2005 at R2.4 million. In line with the Group’s Short-term Executive Incentive Scheme which rewardsexecutives based upon growth in HEPS, he received18 months salary as a bonus. In addition, in recognitionof his leadership and role in: acquiring the assets,formulating the strategy and defining the structure ofthe Massbuild division; formulating and implementingthe succession process; concluding the BEEtransaction and attracting and retaining executive talentduring the 2006 financial year, the RemunerationCommittee awarded a discretionary bonus ofR3.0 million, taking his total bonus to R6.7 million.
Mark has never owned any options, but in terms of theEmployee Share Scheme, he has received interest-bearing loans, subject to fringe benefit tax, for thepurchase of shares offered to him by the Company atmarket price from time to time.
He is currently the indirect non-beneficial owner of3 100 000 Massmart shares in the Employee ShareScheme. This includes 1 000 000 shares issued inMarch 2003 pursuant to him signing a four-year servicecontract (see details on page 112) which expires in June2007 and which includes a condition that relinquishedhis eligibility for any subsequent issues from the ShareScheme. The average length of time he has held all ofthese shares is 4.8 years and the average strike price isR13.79 per share. On 20 September 2005 the loansassociated with 1 532 791 shares in the EmployeeShare Trust were settled and these shares werereleased to, and are still held by, a company of whichMark is the indirect non-beneficial owner.
During the 2006 financial year, Mark sold1 552 492 Massmart shares which had been purchasedin the open market over four years ago. These shares,which had nothing to do with his Massmartremuneration, were sold for an average price of R60.78.The company referred to above is still the non-beneficialowner of a further 401 746 shares similarly purchased.
GM PattisonGrant received a 15.8% increase to his salary andallowances for the 2006 financial year, from R1.6 millionto R1.86 million. The reason for this exceeding aninflationary increase is that he received a salary increasein May 2006 upon his appointment as CEO Designate. Inline with the Group’s Short-term Executive IncentiveScheme, he received 18 months salary as bonus. Inaddition, in recognition of his leadership of: theMasscash turnaround; the creation of the “Vantage”store development decision making tool; theimplementation of the Groups broader BEE initiatives and
the structuring of Impilo, the staff antiretroviralprogramme during the 2006 financial year, theRemuneration Committee awarded a discretionary bonusof R0.5 million, taking his total bonus to R3.25 million.
Grant did not sell any Massmart shares or optionsduring the 2006 financial year.
Through the Share Scheme, Grant has purchased1 185 919 Massmart shares and has 605 219Massmart options. Included are 750 000 shares with astrike price of R54.13 that were issued to him in May2006 upon his appointment as CEO Designate.Excluding this recent issue, the average length of timethat he has held these shares and options is 3.6 yearsand the average strike price is R24.42 per share.
GRC HaywardGuy received a 6.67% increase to his salary andallowances for the 2006 financial year, fromR1.5 million to R1.6 million. In line with the Group’sShort-term Executive Incentive Scheme, he received18 months salary as bonus. In addition, in recognitionof his leadership of: the seamless implementation ofIFRS; the imposition of impeccable reporting andaccounting standards in the newly acquired businesses;and the structuring and legalities surrounding the BEEtransaction during the 2006 financial year, theRemuneration Committee awarded a discretionarybonus of R0.5 million, taking his total bonus toR2.7 million.
During the 2006 financial year, Guy converted and sold125 000 Massmart options which he had held for morethan four years, realising a taxable gain of R5.1 million.
Through the Share Scheme, Guy has 552 524Massmart shares and 500 000 Massmart options. Theaverage length of time that he has held these sharesand options is 3.6 years and the average strike price isR24.76 per share.
S NothnagelFanus received a 7.3% increase to his salary andallowances for the 2006 financial year, from R1.8 millionto R1.93 million. In line with the Group’s Short-termExecutive Incentive Scheme, he received 18 monthssalary as bonus. In addition, in recognition of his role inachieving exceptional trading and operational results inboth Massdiscounters and Masswarehouse which heran concurrently for the first three months of the 2006financial year, the Remuneration Committee awarded adiscretionary bonus of R0.5 million, taking his totalbonus to R2.6 million.
During the 2006 financial year, Fanus converted and sold74 552 Massmart options which he had held for almostthree years, realising a taxable gain of R3.2 million.
Through the Share Scheme, Fanus has 944 688Massmart options. The average length of time that hehas held these options is 1.5 years and the averagestrike price is R36.10 per share.

153massmart annual report
Other-wise in Fringeconnec- benefit
Services Bonuses tion ofas and with the interest- Gains
directors perfor- Retire- affairs free onof Salary mance- ment of loans exercise
Massmart and related and Massmart used to ofHoldings allow- pay- Other related Holdings Sub- finance shareLimited ances ments8 benefits benefits Limited total shares9 options Total
R000 R000 R000 R000 R000 R000 R000 R000 R000 R000
31. Directors’ emoluments continuedFor the year ended 30 June 2006Executive directorsLamberti, MJ 1 – 2 400 6 712 534 189 – 9 835 1 552 – 11 387Lamberti, MJ 2 – – – – – – – 1 189 – 1 189Pattison, GM 6 1 863 3 250 24 179 – 5 316 564 – 5 880Hayward, GRC – 1 600 2 731 198 168 – 4 697 1 112 5 123 10 932Nothnagel, S 7 – 1 931 2 633 15 184 – 4 763 – 3 203 7 966
– 7 794 15 326 771 720 – 24 611 4 417 8 326 37 354
Non-executive directorsSeabrooke, CS 4 660 – – – – – 660 – – 660Brand, MD 10 283 – – – – – 283 – – 283Combi, ZL 250 – – – – – 250 – – 250Hodkinson, J 5 166 – – – – – 166 – – 166Langeni, P 5 205 – – – – – 205 – – 205Matthews, IN 577 – – – – 30 607 – – 607Maw, P 322 – – – – – 322 – – 322Mokhobo, DNM 283 – – – – – 283 – – 283Rubin, MJ 205 – – – – – 205 – – 205
2 951 – – – – 30 2 981 – – 2 981
Total 2 951 7 794 15 326 771 720 30 27 592 4 417 8 326 40 335
1. MJ Lamberti’s salary will not be increased for the duration of his contract
2. Relates to the 1 000 000 shares issued pursuant to the signing in March 2003 of a four-year service contract. For information regarding MJ Lamberti’s service
contract see page 114 of the Directors’ report
3. Appointed as non-executive director 1 January 2004 and resigned 7 December 2004
4. Appointed Chairman 1 July 2003
5. Appointed 25 August 2004
6. Executive director from 7 December 2004
7. Executive director from 25 May 2005
8. In order to match incentive awards with the performance to which they relate, bonuses above reflect the amounts accrued in respect of each year and not
amounts paid in that year
9. Held in terms of the rules of the Company’s share scheme
10. Individual not recipient of fees – fees paid directly to company

154massmart annual report
Notes to the Consolidated Annual Financial Statements continued
for the year ended 30 June 2006
Other-wise in Fringeconnec- benefit
Services Bonuses tion ofas and with the interest- Gains
directors perfor- Retire- affairs free onof Salary mance- ment of loans exercise
Massmart and related and Massmart used to ofHoldings allow- pay- Other related Holdings Sub- finance shareLimited ances ments8 benefits benefits Limited total shares9 options Total
R000 R000 R000 R000 R000 R000 R000 R000 R000 R000
31. Directors’ emoluments continuedFor the year ended 30 June 2005Executive directorsLamberti, MJ 1 – 2 400 2 700 382 195 – 5 677 2 033 – 7 710Lamberti, MJ 2 – – – – – – – 1 399 – 1 399Pattison, GM 6 – 1 608 1 075 14 156 – 2 853 679 – 3 532Hayward, GRC – 1 500 1 750 173 161 – 3 584 302 5 324 9 210Nothnagel, S 7 – 1 799 2 285 14 172 – 4 270 – 787 5 057
– 7 307 7 810 583 684 – 16 384 4 413 6 111 26 908
Non-executive directorsSeabrooke, CS 4 635 – – – – – 635 – 3 059 3 694Barrett, DG 3 103 – – – – – 103 58 2 305 2 466Brand, MD 10 235 – – – – – 235 – – 235Combi, ZL 160 – – – – – 160 – – 160Hodkinson, J 5 137 – – – – 38 175 – – 175Langeni, P 5 137 – – – – – 137 – – 137Matthews, IN 555 – – – – 30 585 – – 585Maw, P 310 – – – – – 310 – – 310Mokhobo, DNM 235 – – – – – 235 – – 235Rubin, MJ 160 – – – – – 160 – – 160
2 667 – – – – 68 2 735 58 5 364 8 157
Total 2 667 7 307 7 810 583 684 68 19 119 4 471 11 475 35 065
1. MJ Lamberti’s salary will not be increased for the duration of his contract
2. Relates to the 1 000 000 shares issued pursuant to the signing in March 2003 of a four-year service contract. For information regarding MJ Lamberti’s service
contract see page 112 of the Directors’ report
3. Appointed as non-executive director 1 January 2004 and resigned 7 December 2004
4. Appointed Chairman 1 July 2003
5. Appointed 25 August 2004
6. Executive director from 7 December 2004
7. Executive director from 25 May 2005
8. In order to match incentive awards with the performance to which they relate, bonuses above reflect the amounts accrued in respect of each year and not
amounts paid in that year
9. Held in terms of the rules of the Company’s share scheme
10. Individual not recipient of fees – fees paid directly to company

155massmart annual report
32. Interests of directors in the Company’s share schemeOptions allocated to purchase shares/shares issued
Number of Shares/ Shares/shares/ options optionsoptions Issue Issue opening closingissued date price (R) Expiry date balance balance
For the year ended 30 June 2006Executive directorsLamberti, MJ 3 632 791 2 100 000Lamberti, MJ * 1 000 000 1 000 000Pattison, GM 750 000 23 May 2006 54.13 22 May 2012 1 041 138 1 791 138Hayward, GRC 150 000 23 May 2006 54.13 22 May 2012 1 027 524 1 052 524Nothnagel, S 200 000 23 May 2006 54.13 22 May 2012 819 240 944 688
For the year ended 30 June 2005Executive directorsLamberti, MJ 3 632 791 3 632 791Lamberti, MJ * 1 000 000 1 000 000Pattison, GM 400 000 1 April 2005 41.91 31 March 2011 791 138 1 041 138Hayward, GRC 200 000 1 April 2005 41.91 31 March 2011 1 027 524 1 027 524Nothnagel, S 400 000 1 April 2005 41.91 31 March 2011 449 240 819 240Non-executive directorsSeabrooke, CS 118 300 –Rubin, MJ ** 80 925 –
Gains on the exercise of share options or sale of sharesNumber of
shares/ Issue Issue Exercise/ Exercise/ Gain options date price (R) Sale date Sale price (R) R000
For the year ended30 June 2006Executive directorsHayward, GRC 75 000 27 August 2001 10.95 17 November 2005 52.56 3 121Hayward, GRC 50 000 27 August 2001 10.95 28 November 2005 51.00 2 002Nothnagel, S 74 552 1 April 2003 17.82 28 February 2006 60.78 3 203
For the year ended 30 June 2005Executive directorsPattison, GM 150 000 13 November 2000 12.25 21 September 2004 36.72 3 670Hayward, GRC 200 000 27 August 2001 10.95 22 September 2004 35.57 5 324Nothnagel, S 30 000 1 April 2003 17.82 28 April 2005 44.06 787Non-executive directorsBarrett, DG 72 500 27 August 2001 10.95 28 October 2004 42.74 2 305Seabrooke, CS 59 150 10 March 2000 14.61 10 September 2004 37.64 1 362Seabrooke, CS 29 575 10 March 2000 14.61 22 September 2004 37.57 679Seabrooke, CS 29 575 10 March 2000 14.61 10 March 2005 49.03 1 018
* Applicable to the issue of 1 000 000 shares pursuant to the signing of a four-year service contract in March 2003.
** Director settled his loan to the Massmart Limited Employee Share Trust and took transfer of the shares on 1 July 2004.

156massmart annual report
Notes to the Consolidated Annual Financial Statements continued
for the year ended 30 June 2006
32. Interests of directors in the Company’s share scheme continuedDetails of directors’ share options per executive director:
Movement Subscription Market Number of date price price shares/share
2005 options Expiry date
Lamberti, MJBalance at the beginning of
the year 4 632 791Shares transferred to
Ratelimb (Pty) Limited * (1 532 791)Options exercised –New options granted –Balance at the end of the year 3 100 000
Comprising: 4 July 2000 12.50 1 500 000 3 July 201027 August 2001 10.95 600 000 26 August 201113 March 2003 17.42 1 000 000 12 March 2009
Pattison, GMBalance at the beginning
of the year 1 041 138New shares granted 23 May 2006 54.13 750 000 22 May 2012Balance at the end of the year 1 791 138
Comprising: 13 November 2000 12.25 400 000 12 November 201027 August 2001 10.95 150 000 26 August 2011
27 May 2003 18.98 55 219 26 May 200926 May 2004 29.87 35 919 25 May 20101 April 2005 41.91 400 000 31 March 2011
23 May 2006 54.13 750 000 22 May 2012
Hayward, GRCBalance at the beginning
of the year 1 027 524Options exercised 17 November 2005 10.95 52.56 (75 000)
28 November 2005 10.95 51.00 (50 000)New shares granted 23 May 2006 54.13 150 000 22 May 2012Balance at the end of the year 1 052 524
Comprising: 10 March 2000 14.61 158 643 9 March 201013 November 2000 12.25 100 000 12 November 2010
27 August 2001 10.95 350 000 26 August 201119 November 2002 17.43 50 000 18 November 2008
26 May 2004 29.87 43 881 25 May 20101 April 2005 41.91 200 000 31 March 2011
23 May 2006 54.13 150 000 22 May 2012
Nothnagel, SBalance at the beginning
of the year 819 240Options exercised 28 February 2006 17.82 60.78 (74 552)New options granted 23 May 2006 54.13 200 000 22 May 2012Balance at the end of the year 944 688
Comprising: 1 April 2003 17.82 313 658 31 March 200926 May 2004 29.87 31 030 25 May 20101 April 2005 41.91 400 000 31 March 2011
23 May 2006 54.13 200 000 22 May 2012
* Ratelimb (Pty) Limited is a company indirectly and non-beneficially owned by Mr MJ Lamberti.
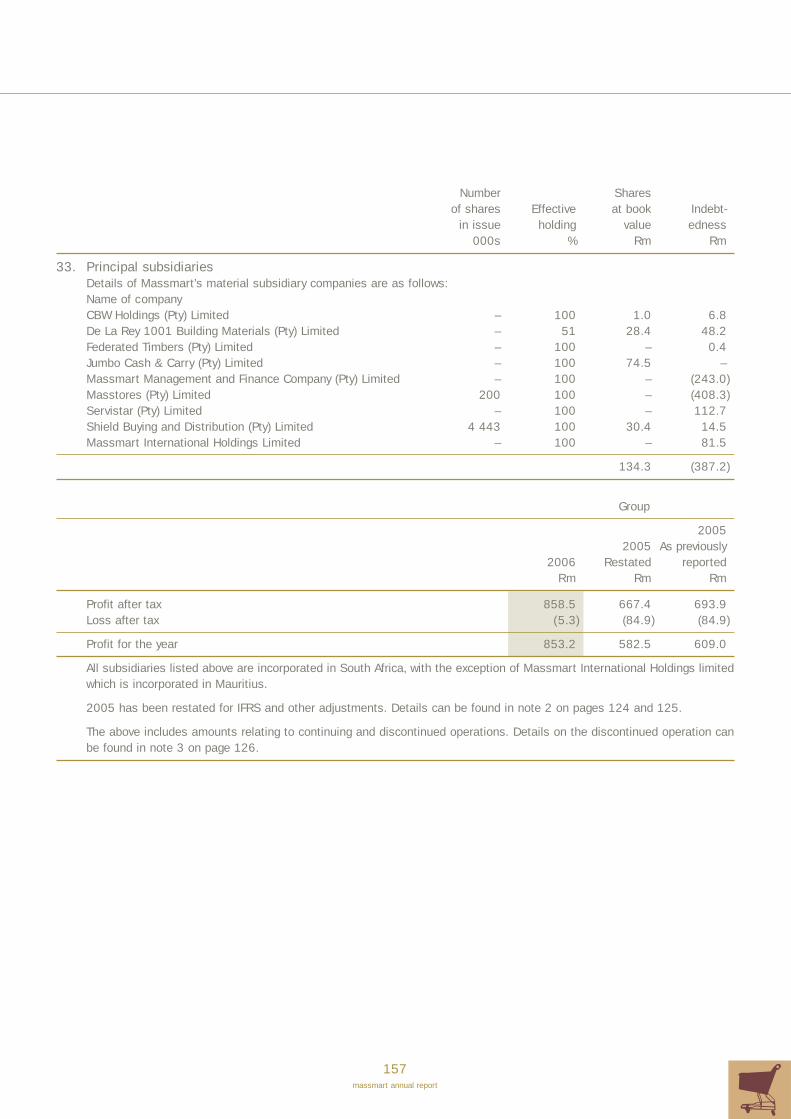
157massmart annual report
Number Sharesof shares Effective at book Indebt-
in issue holding value edness000s % Rm Rm
33. Principal subsidiariesDetails of Massmart’s material subsidiary companies are as follows:Name of companyCBW Holdings (Pty) Limited – 100 1.0 6.8De La Rey 1001 Building Materials (Pty) Limited – 51 28.4 48.2Federated Timbers (Pty) Limited – 100 – 0.4Jumbo Cash & Carry (Pty) Limited – 100 74.5 –Massmart Management and Finance Company (Pty) Limited – 100 – (243.0)Masstores (Pty) Limited 200 100 – (408.3)Servistar (Pty) Limited – 100 – 112.7Shield Buying and Distribution (Pty) Limited 4 443 100 30.4 14.5Massmart International Holdings Limited – 100 – 81.5
134.3 (387.2)
Group
20052005 As previously
2006 Restated reportedRm Rm Rm
Profit after tax 858.5 667.4 693.9Loss after tax (5.3) (84.9) (84.9)
Profit for the year 853.2 582.5 609.0
All subsidiaries listed above are incorporated in South Africa, with the exception of Massmart International Holdings limitedwhich is incorporated in Mauritius.
2005 has been restated for IFRS and other adjustments. Details can be found in note 2 on pages 124 and 125.
The above includes amounts relating to continuing and discontinued operations. Details on the discontinued operation canbe found in note 3 on page 126.

158massmart annual report
Notes to the Consolidated Annual Financial Statements continued
for the year ended 30 June 2006
Group
20052005 As previously
2006 Restated reportedRm Rm Rm
34. Notes to the cash flow statement34.1 Cash flow from trading
Profit before taxation 1 300.6 886.0 916.0Adjustment for:
Depreciation, amortisation and impairment 208.9 230.9 229.3Net (gain)/loss on disposal of property, plant and equipment (1.1) 0.3 0.3Interest income (63.8) (50.8) (50.4)Interest expense 96.5 72.8 71.4Investment income (34.6) (35.2) (35.2)Dividend income (3.2) – –Share-based payments 17.4 17.0 –Loss on discontinued operation 1.8 – –Unrealised foreign exchange loss 30.3 3.5 4.9Other non-cash movements (9.2) 12.0 12.4
1 543.6 1 136.5 1 148.7
34.2 Working capital movementsIncrease in inventories (560.8) (110.9) (107.8)(Increase)/decrease in accounts receivables and prepayments (91.1) 57.1 40.2Increase in accounts payable 913.9 167.7 169.9Decrease in provisions (1.6) (3.4) (4.4)
260.4 110.5 97.9
34.3 Taxation paidNormal taxation:
Amounts owing at the beginning of the year 279.9 266.7 264.8Amounts owing at the end of the year (259.2) (279.9) (279.1)
Amounts charged to the statement of changes in equity 17.0 – –Amounts on disposal of discontinued operation 2.2 – –Amounts acquired from purchase of subsidiary – 15.7 15.7Taxation charged to the income statement (excluding deferred taxation) 447.5 335.0 333.0
487.4 337.5 334.4
34.4 Investment to maintain operationsLand and buildings/leasehold improvements 35.5 76.6 76.6Vehicles 18.8 10.7 10.4Plant and equipment 100.5 81.0 81.0Computer hardware 18.3 43.7 87.8Computer software 5.4 44.1 –
178.5 256.1 255.8

159massmart annual report
Group
20052005 As previously
2006 Restated reportedRm Rm Rm
34. Notes to the cash flow statement continued34.5 Investment to expand operations
Land and buildings/leasehold improvements 18.1 63.4 63.4Vehicles 6.0 3.2 3.2Plant and equipment 99.0 63.8 63.6Computer hardware 18.1 9.3 17.7Computer software 18.7 9.4 –Trademarks and other 2.3 – –Goodwill 21.9 8.5 8.5
184.1 157.6 156.4
34.6 Proceeds on disposal of property, plant and equipmentLand and buildings/leasehold improvements 2.1 1.3 1.3Vehicles 4.6 2.0 2.0Plant and equipment 1.4 1.2 1.2Computer equipment 0.2 0.6 0.6
8.3 5.1 5.1
34.7 Investment in subsidiariesFair value of assets and liabilities acquired in subsidiaries:
Cash and cash equivalents – 13.9 13.9Inventories – 198.4 198.4Accounts receivable and prepayments – 92.8 92.8 Property, plant and equipment – 109.9 109.9Taxation – (15.7) (15.7)Trade payables – (232.4) (232.4)Provisions – (10.9) (10.9)Loans – (61.3) (61.3)Goodwill – 599.5 599.5Minorities – (2.3) (2.3)Other – 7.0 7.0
Total purchase price – 698.9 698.9Less: Cash and cash equivalents of subsidiary – (13.9) (13.9)
Cash impact of acquisition, net of cash and cash equivalents acquired – 685.0 685.0
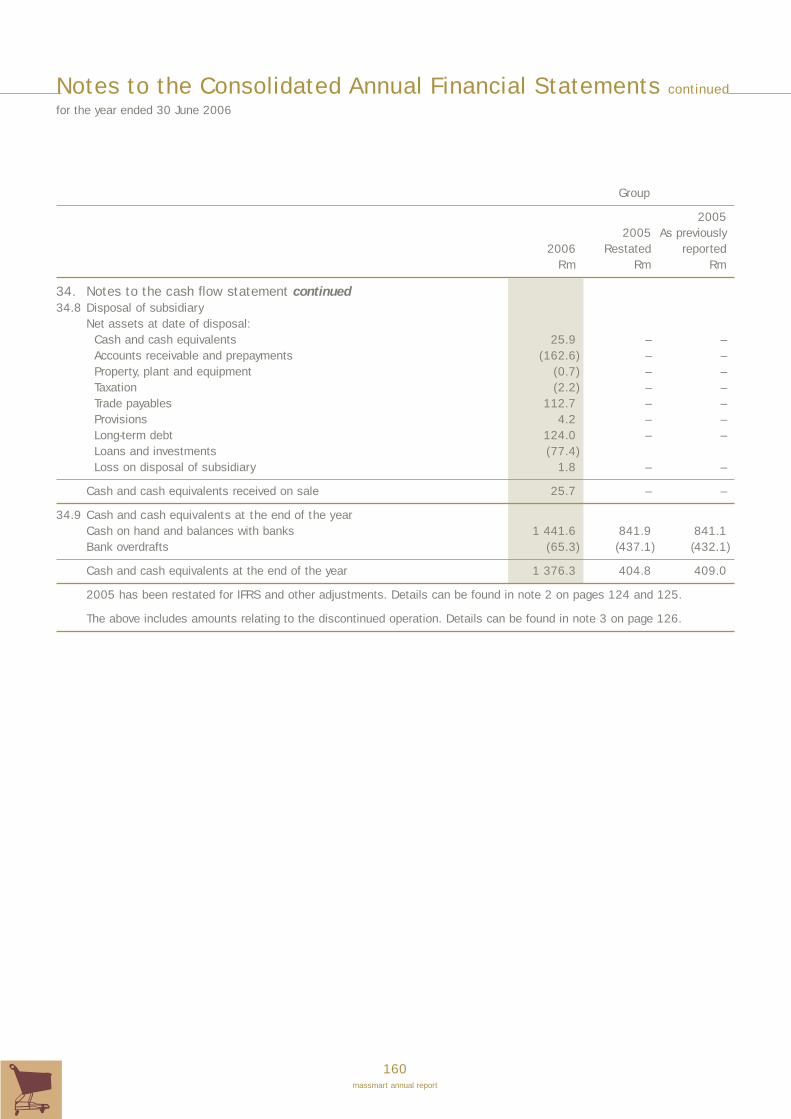
160massmart annual report
Notes to the Consolidated Annual Financial Statements continued
for the year ended 30 June 2006
Group
20052005 As previously
2006 Restated reportedRm Rm Rm
34. Notes to the cash flow statement continued34.8 Disposal of subsidiary
Net assets at date of disposal:Cash and cash equivalents 25.9 – –Accounts receivable and prepayments (162.6) – –Property, plant and equipment (0.7) – –Taxation (2.2) – –Trade payables 112.7 – –Provisions 4.2 – –Long-term debt 124.0 – –Loans and investments (77.4)Loss on disposal of subsidiary 1.8 – –
Cash and cash equivalents received on sale 25.7 – –
34.9 Cash and cash equivalents at the end of the yearCash on hand and balances with banks 1 441.6 841.9 841.1Bank overdrafts (65.3) (437.1) (432.1)
Cash and cash equivalents at the end of the year 1 376.3 404.8 409.0
2005 has been restated for IFRS and other adjustments. Details can be found in note 2 on pages 124 and 125.
The above includes amounts relating to the discontinued operation. Details can be found in note 3 on page 126.

161massmart annual report
35. Financial risk managementInterest rate managementThe funding requirements/investment of surplus funds are managed by Massmart through its own commercial bank facilities.
Liquidity risk managementThe Group’s liquidity requirements are assessed on an ongoing basis as part of the Group’s treasury function. No significantrisk exists as the Group is conservatively structured and the operations generate positive cash flows.
Group
20052005 As previously
2006 Restated reportedRm Rm Rm
Total banking and loan facilities 3 092.8 3 130.5 3 130.5Actual interest-bearing debt (756.7) (670.4) (665.2)
Unutilised banking facilities 2 336.1 2 460.1 2 465.3
Banking facilities incorporate, amongst others, letters of credit, forward exchange contracts and electronic fund transfers.These facilities have been secured by cross-suretyships between Group companies.
Credit risk managementPotential areas of credit risk include trade and consumer accounts receivable and short-term cash investments.
Trade accounts receivable consist primarily of a large, widespread customer base. Group companies regularly monitor thefinancial position of their customers. Where considered appropriate, credit guarantee insurance is used. The granting ofcredit is controlled by application and account limits. Provision is made for both specific and general bad debts, and at theyear-end management did not consider there to be any material credit risk exposure that was not already covered by creditguarantee insurance or bad debt provisions.
2005 has been restated for IFRS and other adjustments. Details can be found in note 2 on pages 124 and 125.
The following table shows the split of credit exposure:2005
2005 As previously2006 Restated reported
% % %
Trade accounts receivable 76 80 80Consumer accounts receivable 24 20 20
100 100 100
Currency risk managementAll foreign denominated trading liabilities are covered by forward exchange contracts. Foreign denominated assets are notcovered by forward exchange contracts.
Fair values of financial instrumentsAll financial instruments have been classified according to the relevant IAS 39 category. There is no difference between theirfair value and carrying value and they are accounted for as follows:
Financial assetsAvailable-for-sale investmentsThese are held at fair value and any adjustment to fair value is taken to equity. The total value taken to equity in the yearwas R nil.
Held-to-maturity investmentsThese are held at amortised cost less any impairment losses recognised to reflect irrecoverable amounts.
Held-for-tradingThese are held at fair value and any adjustment to fair value taken to the income statement. Listed investments are carriedat market value by reference to stock exchange quoted selling prices.

162massmart annual report
Notes to the Consolidated Annual Financial Statements continued
for the year ended 30 June 2006
35. Financial risk management continuedFinancial assets continued
Originated loansThese are held at cost less any impairment losses recognised to reflect irrecoverable amounts.
Financial liabilitiesAll financial liabilities are held as non-trading liabilities and are shown at amortised cost.
The cash flows expected from the Group’s participation in export partnerships over the next ten to fifteen years cannot, inthe opinion of the directors be accurately fair valued and therefore have not been discounted. For fair presentation purposes,it is noted that any fair value impairment in the amounts due to the Group by virtue of its participation in such partnershipswould result in a corresponding reduction in the fair value of the related deferred tax liability. Consequently such fair valueimpairment would have no impact on either cash flow statement or income statement of the Group.
Forward foreign exchange contractsForward exchange contracts are entered into to manage exposure to fluctuations in foreign currency exchange rates onspecific trading transactions. The Group’s policy is to enter into forward contracts for all committed foreign currencypurchases.
In the current year, forward foreign exchange contracts have been accounted for according to IAS 39. Fair value has beendetermined using money market derivative rates at 30 June 2006 and the net gain or exposure on the contracts has beenreflected in the financial statements.
At year-end, the open forward exchange contracts were as follows:
Foreign Fair value Contract currency adjustment equivalent Average(millions) Rm Rm rate
2006USD 49.6 35.7 303.1 6.1GBP 0.3 0.5 3.8 13.7Euro 3.5 4.7 32.5 9.4
40.9 339.4
2005USD 34.1 4.4 226.6 6.6GBP 0.2 0.1 2.4 12.0Euro 1.4 (0.1) 11.8 8.2
4.4 240.8
The latest maturity date on open forward foreign exchange contracts is 15 March 2007.
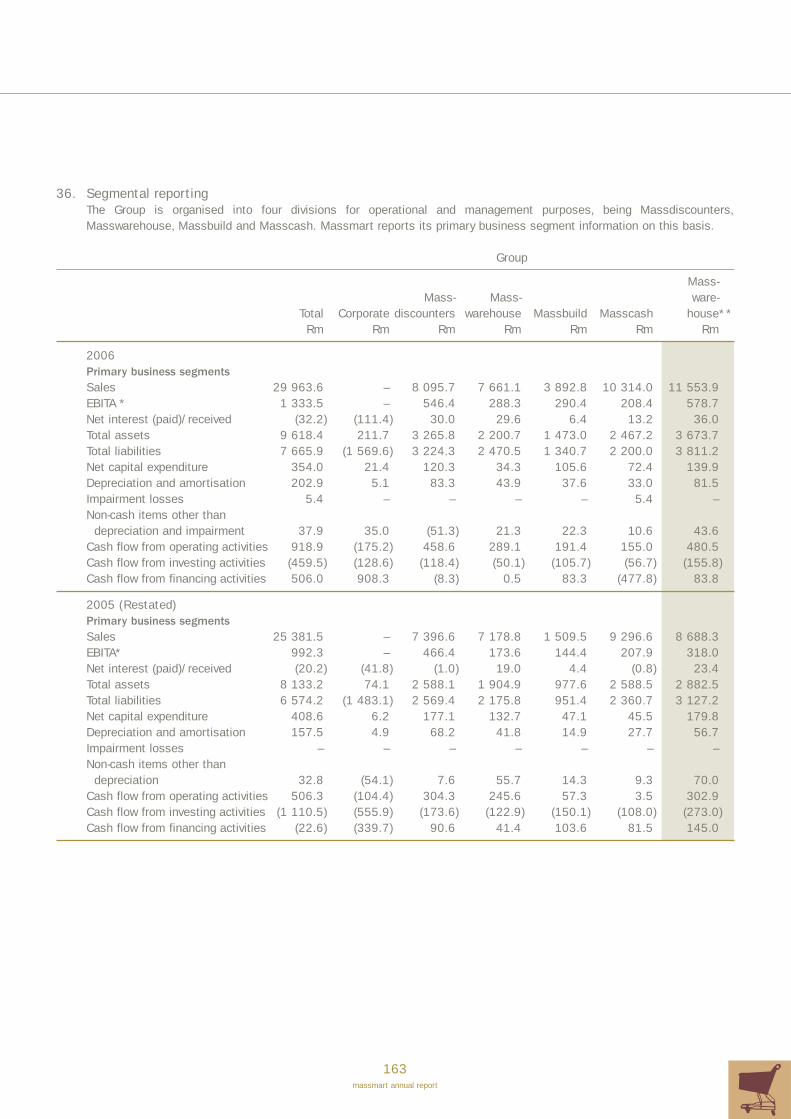
163massmart annual report
36. Segmental reportingThe Group is organised into four divisions for operational and management purposes, being Massdiscounters,Masswarehouse, Massbuild and Masscash. Massmart reports its primary business segment information on this basis.
Group
Mass-Mass- Mass- ware-
Total Corporate discounters warehouse Massbuild Masscash house**Rm Rm Rm Rm Rm Rm Rm
2006Primary business segmentsSales 29 963.6 – 8 095.7 7 661.1 3 892.8 10 314.0 11 553.9EBITA * 1 333.5 – 546.4 288.3 290.4 208.4 578.7Net interest (paid)/received (32.2) (111.4) 30.0 29.6 6.4 13.2 36.0Total assets 9 618.4 211.7 3 265.8 2 200.7 1 473.0 2 467.2 3 673.7Total liabilities 7 665.9 (1 569.6) 3 224.3 2 470.5 1 340.7 2 200.0 3 811.2Net capital expenditure 354.0 21.4 120.3 34.3 105.6 72.4 139.9Depreciation and amortisation 202.9 5.1 83.3 43.9 37.6 33.0 81.5Impairment losses 5.4 – – – – 5.4 –Non-cash items other than
depreciation and impairment 37.9 35.0 (51.3) 21.3 22.3 10.6 43.6Cash flow from operating activities 918.9 (175.2) 458.6 289.1 191.4 155.0 480.5Cash flow from investing activities (459.5) (128.6) (118.4) (50.1) (105.7) (56.7) (155.8)Cash flow from financing activities 506.0 908.3 (8.3) 0.5 83.3 (477.8) 83.8
2005 (Restated)Primary business segmentsSales 25 381.5 – 7 396.6 7 178.8 1 509.5 9 296.6 8 688.3EBITA* 992.3 – 466.4 173.6 144.4 207.9 318.0Net interest (paid)/received (20.2) (41.8) (1.0) 19.0 4.4 (0.8) 23.4Total assets 8 133.2 74.1 2 588.1 1 904.9 977.6 2 588.5 2 882.5Total liabilities 6 574.2 (1 483.1) 2 569.4 2 175.8 951.4 2 360.7 3 127.2Net capital expenditure 408.6 6.2 177.1 132.7 47.1 45.5 179.8Depreciation and amortisation 157.5 4.9 68.2 41.8 14.9 27.7 56.7Impairment losses – – – – – – –Non-cash items other than
depreciation 32.8 (54.1) 7.6 55.7 14.3 9.3 70.0Cash flow from operating activities 506.3 (104.4) 304.3 245.6 57.3 3.5 302.9Cash flow from investing activities (1 110.5) (555.9) (173.6) (122.9) (150.1) (108.0) (273.0)Cash flow from financing activities (22.6) (339.7) 90.6 41.4 103.6 81.5 145.0
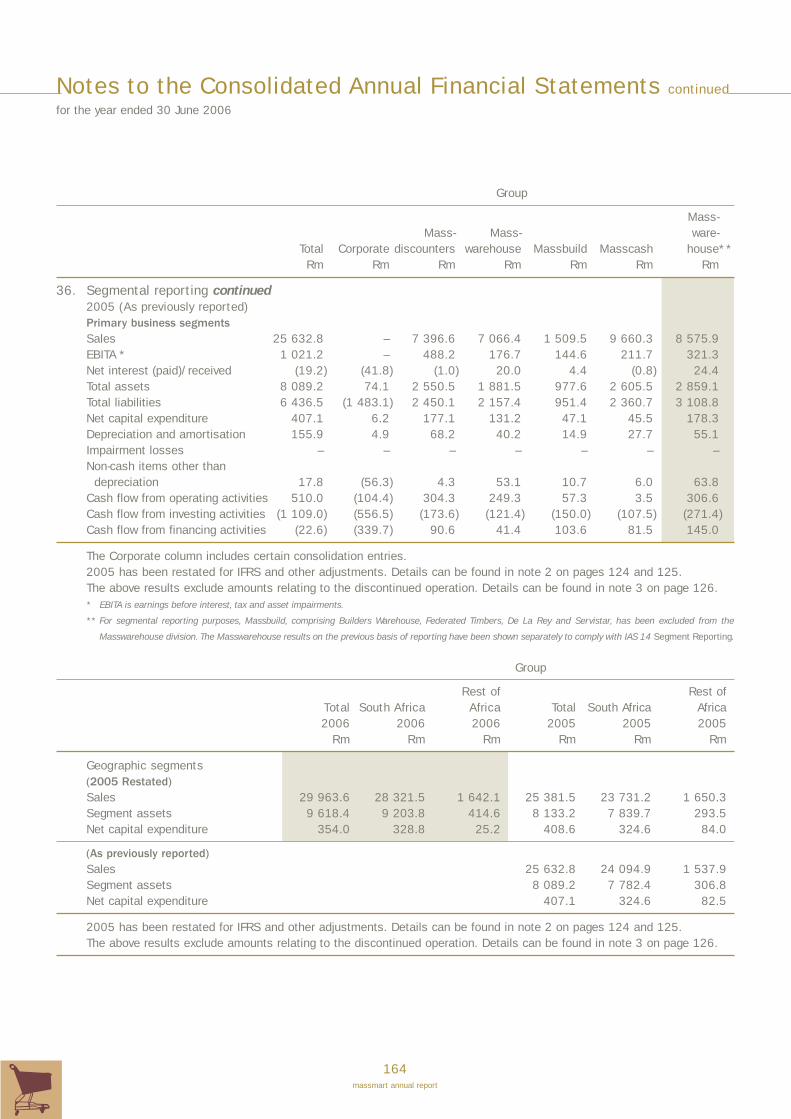
164massmart annual report
Notes to the Consolidated Annual Financial Statements continued
for the year ended 30 June 2006
Group
Mass-Mass- Mass- ware-
Total Corporate discounters warehouse Massbuild Masscash house**Rm Rm Rm Rm Rm Rm Rm
36. Segmental reporting continued2005 (As previously reported)Primary business segmentsSales 25 632.8 – 7 396.6 7 066.4 1 509.5 9 660.3 8 575.9EBITA * 1 021.2 – 488.2 176.7 144.6 211.7 321.3Net interest (paid)/received (19.2) (41.8) (1.0) 20.0 4.4 (0.8) 24.4Total assets 8 089.2 74.1 2 550.5 1 881.5 977.6 2 605.5 2 859.1Total liabilities 6 436.5 (1 483.1) 2 450.1 2 157.4 951.4 2 360.7 3 108.8Net capital expenditure 407.1 6.2 177.1 131.2 47.1 45.5 178.3Depreciation and amortisation 155.9 4.9 68.2 40.2 14.9 27.7 55.1Impairment losses – – – – – – –Non-cash items other than
depreciation 17.8 (56.3) 4.3 53.1 10.7 6.0 63.8Cash flow from operating activities 510.0 (104.4) 304.3 249.3 57.3 3.5 306.6Cash flow from investing activities (1 109.0) (556.5) (173.6) (121.4) (150.0) (107.5) (271.4)Cash flow from financing activities (22.6) (339.7) 90.6 41.4 103.6 81.5 145.0
The Corporate column includes certain consolidation entries.2005 has been restated for IFRS and other adjustments. Details can be found in note 2 on pages 124 and 125.The above results exclude amounts relating to the discontinued operation. Details can be found in note 3 on page 126.* EBITA is earnings before interest, tax and asset impairments.
** For segmental reporting purposes, Massbuild, comprising Builders Warehouse, Federated Timbers, De La Rey and Servistar, has been excluded from the
Masswarehouse division. The Masswarehouse results on the previous basis of reporting have been shown separately to comply with IAS 14 Segment Reporting.
Group
Rest of Rest of Total South Africa Africa Total South Africa Africa2006 2006 2006 2005 2005 2005
Rm Rm Rm Rm Rm Rm
Geographic segments(2005 Restated)Sales 29 963.6 28 321.5 1 642.1 25 381.5 23 731.2 1 650.3Segment assets 9 618.4 9 203.8 414.6 8 133.2 7 839.7 293.5Net capital expenditure 354.0 328.8 25.2 408.6 324.6 84.0
(As previously reported)Sales 25 632.8 24 094.9 1 537.9Segment assets 8 089.2 7 782.4 306.8Net capital expenditure 407.1 324.6 82.5
2005 has been restated for IFRS and other adjustments. Details can be found in note 2 on pages 124 and 125.The above results exclude amounts relating to the discontinued operation. Details can be found in note 3 on page 126.
165massmart annual report
37. Critical accounting judgements and key sources of estimation uncertainty
Critical judgements in applying the entity’s accounting policiesIn the process of applying the entity’s accounting policies, which are described in note 1, management has not made anycritical judgements that have a significant effect on the amounts recognised in the financial statements (apart from thoseinvolving estimations, which are dealt with below).
Key sources of estimation uncertaintyThe key assumptions concerning the future, and other key sources of estimation uncertainty at the balance sheet date, thathave a significant risk of causing a material adjustment to the carrying amounts of assets and liabilities within the nextfinancial year, are discussed below.
Impairment of goodwillDetermining whether goodwill is impaired requires an estimation of the value in use of the cash-generating units to whichgoodwill has been allocated. The value in use calculation requires the entity to estimate the future cash flows expected toarise from the cash-generating unit and a suitable discount rate in order to calculate present value. The carrying amount ofgoodwill at the balance sheet date was R1 196.4 (2005: R1 149.9). No impairment loss was recognised in the current yearand an amount of R72.4 million was recognised in the prior year. Details of the impairment loss calculation are provided innote 11.

166massmart annual report
Notes to the Consolidated Annual Financial Statements continued
for the year ended 30 June 2006
38. Shareholder analysisThe following analysis of shareholders was extracted from the shareholders register as at June 2006:
Number of Number % shares %
Shareholder spread1 – 1 000 shares 4 701 70.92 1 487 338 0.741 001 – 10 000 shares 1 457 21.98 4 278 030 2.1310 001 – 100 000 shares 283 4.27 10 604 626 5.27100 001 – 1000 000 shares 148 2.23 47 920 995 23.841 000 001 shares and over 40 0.60 136 749 708 68.02
6 629 100.00 201 040 697 100.00
Distribution of shareholdersBanks 186 2.81 125 901 966 62.63Close corporations 72 1.09 86 368 0.04Endowment funds 42 0.63 193 187 0.10Individuals 4 803 72.45 5 435 534 2.70Insurance companies 40 0.60 6 121 647 3.04Investment companies 18 0.27 8 296 763 4.13Medical aid schemes 7 0.11 151 531 0.08Mutual funds 177 2.67 16 189 113 8.05Nominees and trusts 826 12.46 2 510 658 1.25Other corporations 68 1.03 1 639 500 0.82Pension funds 174 2.62 22 837 935 11.36Private companies 184 2.78 4 283 707 2.13Public companies 30 0.45 185 654 0.09Share trusts 2 0.03 7 207 134 3.58
6 629 100.00 201 040 697 100.00
Public/non-public shareholdersNon-public shareholders:
Directors of the Company 7 0.11 7 178 980 3.57Share trust 2 0.03 2 368 691 1.18
Public shareholders 6 620 99.86 191 493 026 95.25
6 629 100.00 201 040 697 100.00
The following analysis of shareholders was extracted from the shareholders register as at June 2006:
Beneficial shareholders holding 5% or moreThe following shareholders held beneficially, directly or indirectly, more than 5% of the Company’s shares:Public Investment Commissioners 10 284 376 5.12
Foreign custodians holding of 5% or more
The following custodians held beneficially, directly or indirectly, more than 5% of the Company’s shares:JP Morgan Chase 38 067 229 18.94State Street Bank & Trust Co 26 814 953 13.34
For details of the directors’ shareholdings see page 111 of the Directors’ report.
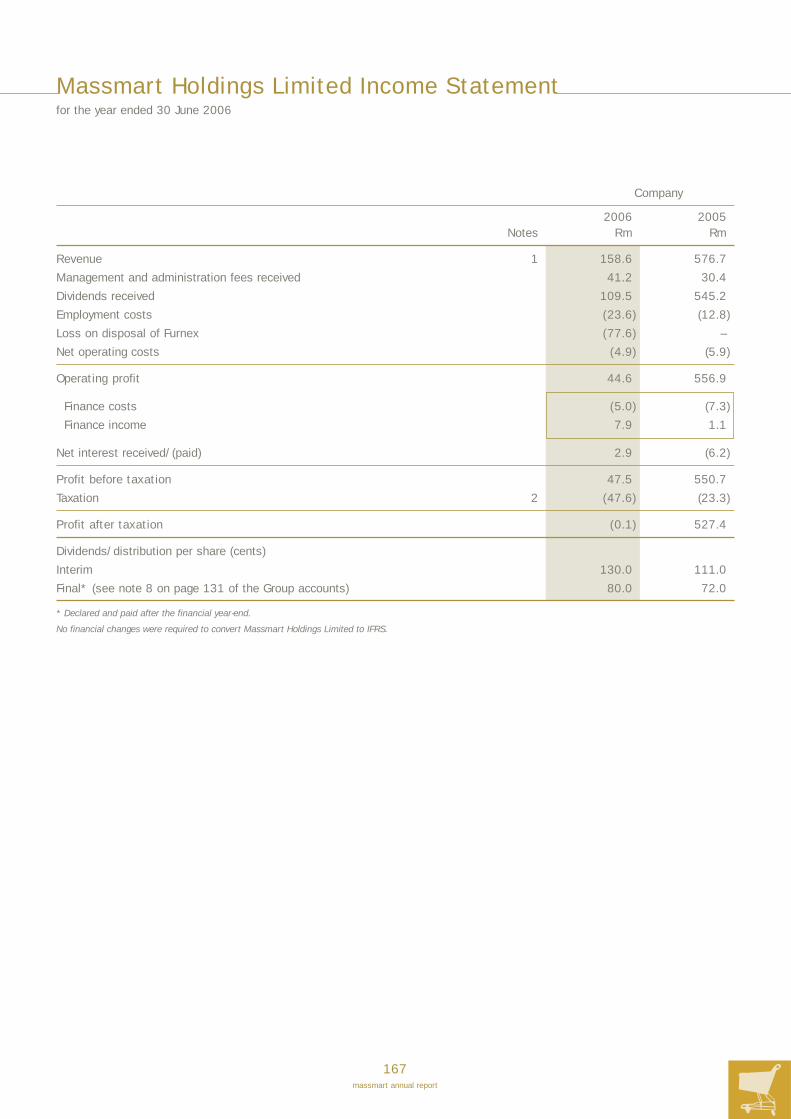
167massmart annual report
Company
2006 2005Notes Rm Rm
Revenue 1 158.6 576.7
Management and administration fees received 41.2 30.4
Dividends received 109.5 545.2
Employment costs (23.6) (12.8)
Loss on disposal of Furnex (77.6) –
Net operating costs (4.9) (5.9)
Operating profit 44.6 556.9
Finance costs (5.0) (7.3)
Finance income 7.9 1.1
Net interest received/(paid) 2.9 (6.2)
Profit before taxation 47.5 550.7
Taxation 2 (47.6) (23.3)
Profit after taxation (0.1) 527.4
Dividends/distribution per share (cents)
Interim 130.0 111.0
Final* (see note 8 on page 131 of the Group accounts) 80.0 72.0
* Declared and paid after the financial year-end.
No financial changes were required to convert Massmart Holdings Limited to IFRS.
Massmart Holdings Limited Income Statementfor the year ended 30 June 2006

168massmart annual report
Massmart Holdings Limited Balance Sheetas at 30 June 2006
Company
2006 2005Notes Rm Rm
AssetsNon-current assets 283.1 1 113.9
Interests in subsidiaries 3 (145.0) 745.5Other investments and loans 4 425.2 368.4Deferred taxation 5 2.9 –
Current assets 19.0 14.6
Trade receivable and prepayments 2.3 14.6Cash and cash equivalents 16.7 –
Total assets 302.1 1 128.5
Equity and liabilitiesCapital and reserves 212.5 654.8
Share capital 6 2.0 2.0Share premium 7 262.6 209.4Retained profit (52.1) 443.4
Total equity 212.5 654.8
Current liabilities 89.6 473.7
Trade and other payables 81.3 46.7Taxation 8.3 7.0Cash and cash equivalents – 420.0
Total equity and liabilities 302.1 1 128.5
No financial changes were required to convert Massmart Holdings Limited to IFRS.
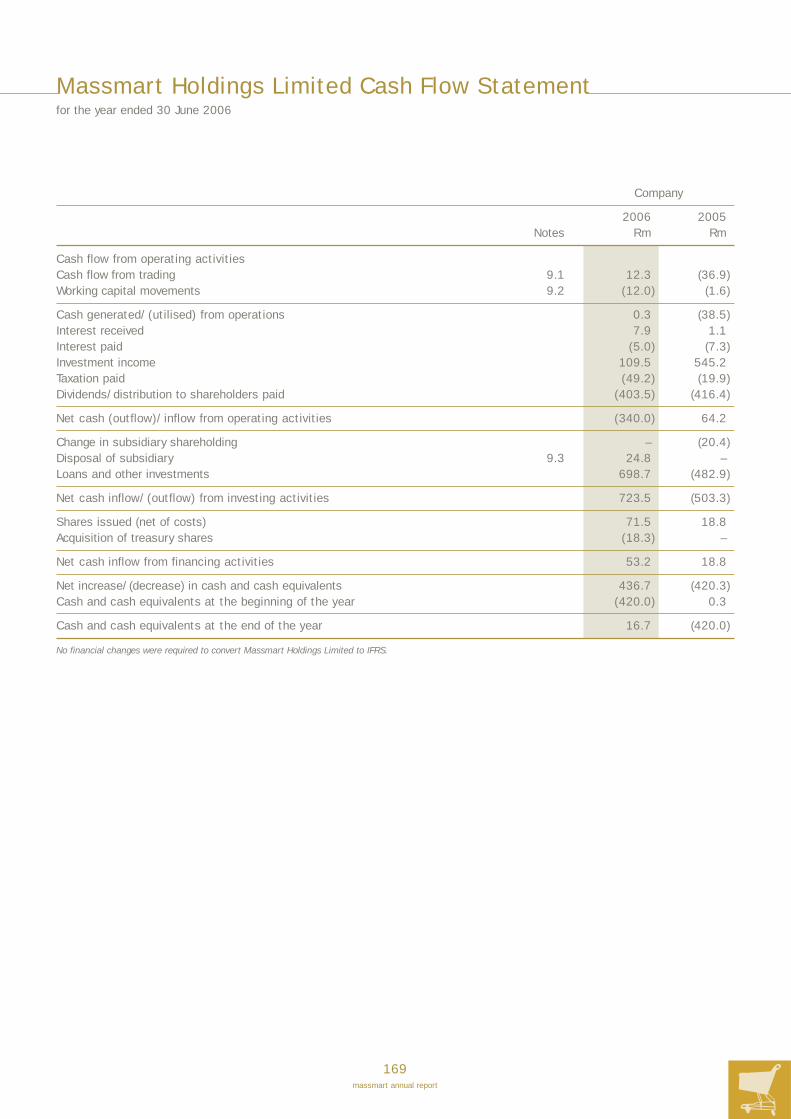
169massmart annual report
Company
2006 2005Notes Rm Rm
Cash flow from operating activitiesCash flow from trading 9.1 12.3 (36.9)Working capital movements 9.2 (12.0) (1.6)
Cash generated/(utilised) from operations 0.3 (38.5)Interest received 7.9 1.1Interest paid (5.0) (7.3)Investment income 109.5 545.2Taxation paid (49.2) (19.9)Dividends/distribution to shareholders paid (403.5) (416.4)
Net cash (outflow)/inflow from operating activities (340.0) 64.2
Change in subsidiary shareholding – (20.4)Disposal of subsidiary 9.3 24.8 –Loans and other investments 698.7 (482.9)
Net cash inflow/(outflow) from investing activities 723.5 (503.3)
Shares issued (net of costs) 71.5 18.8Acquisition of treasury shares (18.3) –
Net cash inflow from financing activities 53.2 18.8
Net increase/(decrease) in cash and cash equivalents 436.7 (420.3)Cash and cash equivalents at the beginning of the year (420.0) 0.3
Cash and cash equivalents at the end of the year 16.7 (420.0)
No financial changes were required to convert Massmart Holdings Limited to IFRS.
Massmart Holdings Limited Cash Flow Statementfor the year ended 30 June 2006

170massmart annual report
Massmart Holdings Limited Statement of Changes in Equityfor the year ended 30 June 2006
Company
Share Share Retainedcapital premium profit Total
Rm Rm Rm Rm
Balance as at 30 June 2004 2.0 356.4 193.9 552.3
Profit for the year – – 527.4 527.4
Share trust loss – – (56.8) (56.8)
Issue of shares (net of costs) – 18.8 – 18.8
Dividends paid – – (221.1) (221.1)
Treasury shares 29.5 29.5
Share premium distribution to shareholders – (195.3) – (195.3)
Balance as at 30 June 2005 2.0 209.4 443.4 654.8
Profit for the year – – (0.1) (0.1)
Share trust loss – – (91.9) (91.9)
Issue of shares (net of costs) – 71.5 – 71.5
Dividends paid – – (403.5) (403.5)
Treasury shares – (18.3) – (18.3)
Balance as at 30 June 2006 2.0 262.6 (52.1) 212.5
No financial changes were required to convert Massmart Holdings Limited to IFRS.

171massmart annual report
Company
2006 2005Rm Rm
1. RevenueDividends received 109.5 545.2Interest received 7.9 1.1Management and administration fees received 41.2 30.4
158.6 576.7
2. TaxationCurrent yearSouth African normal taxCurrent tax 5.8 3.9Deferred tax (2.9) 0.1Secondary tax on companies 43.4 19.2
46.3 23.2
Prior year under/(over) provision:South African normal tax
Current tax 1.3 0.1
1.3 0.1
Total 47.6 23.3
The rate of taxation is reconciled as follows: % %Standard corporate tax rate 29.0 29.0Exempt income (66.8) (28.7)Disallowable expenditure 1.2 0.4Prior year under provision 2.7 3.5Secondary tax on companies 84.9 –Loss on sale of Furnex Stores (Pty) Limited 47.3 –Other 1.8 0.0
Effective rate 100.1 4.2
2006 2005Rm Rm
3. Interest in subsidiariesShares at cost less amounts written off 134.3 134.3Amounts owing (to)/by subsidiaries (279.3) 611.2
(145.0) 745.5
Details of net shares at cost can be found note 33 on page 157 of the Group accounts.
4. Other investments and loansUnlisted investmentsPreference shares – Fullimput 65 (Pty) Limited1 420.5 364.3Investment in Imagegate Limited (UK)2 4.7 4.1
425.2 368.4
The directors’ valuation of the unlisted investments at 30 June 2006 is R425.2 million (2005: R368.4 million). Thepreference share investment represents cumulative preference shares in Fullimput 65 (Pty) Limited. A long-term liability ofthe Group is secured by a cession of the preference shares.
Notes
1. Classified as a “held-to-maturity” financial asset for IAS 39 purposes.
2. Classified as a “loan and receivable” financial asset for IAS 39 purposes.
For IAS 39 accounting treatment of these financial assets, see note 35 in the Group accounts.
Notes to the Annual Financial Statementsfor the year ended 30 June 2006
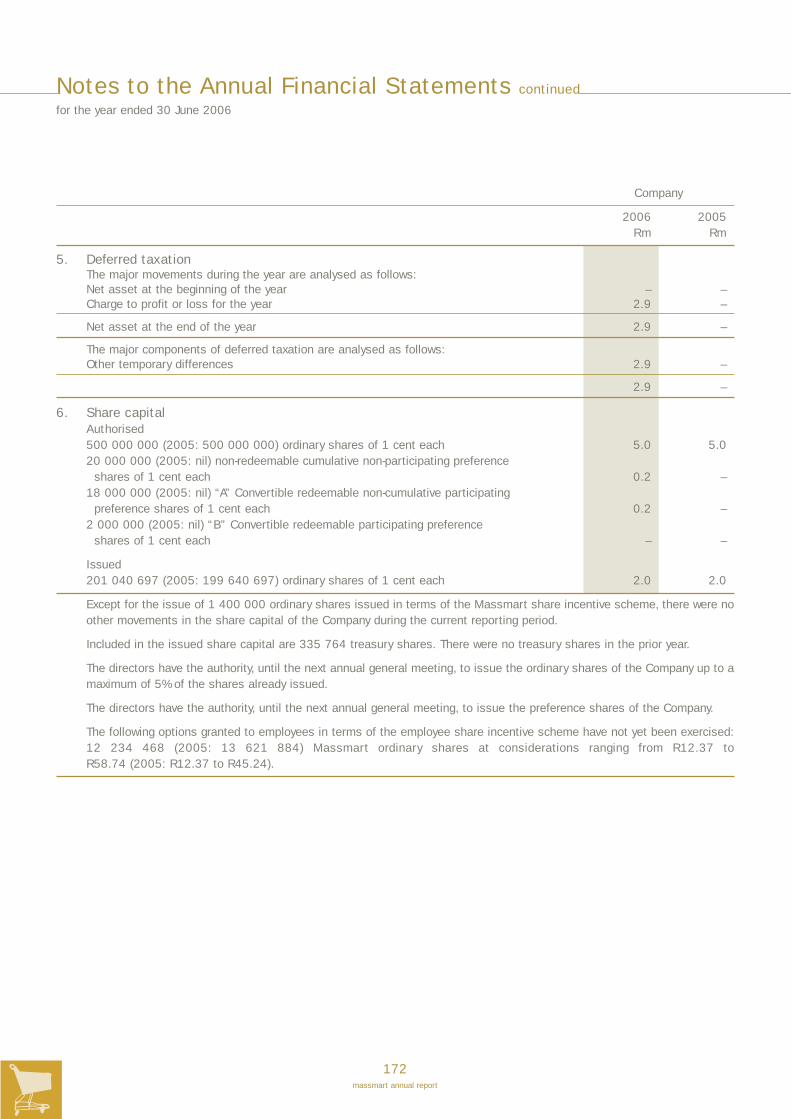
172massmart annual report
Notes to the Annual Financial Statements continued
for the year ended 30 June 2006
Company
2006 2005Rm Rm
5. Deferred taxationThe major movements during the year are analysed as follows:Net asset at the beginning of the year – –Charge to profit or loss for the year 2.9 –
Net asset at the end of the year 2.9 –
The major components of deferred taxation are analysed as follows:Other temporary differences 2.9 –
2.9 –
6. Share capitalAuthorised500 000 000 (2005: 500 000 000) ordinary shares of 1 cent each 5.0 5.020 000 000 (2005: nil) non-redeemable cumulative non-participating preference
shares of 1 cent each 0.2 –18 000 000 (2005: nil) “A” Convertible redeemable non-cumulative participating
preference shares of 1 cent each 0.2 –2 000 000 (2005: nil) “B” Convertible redeemable participating preference
shares of 1 cent each – –
Issued201 040 697 (2005: 199 640 697) ordinary shares of 1 cent each 2.0 2.0
Except for the issue of 1 400 000 ordinary shares issued in terms of the Massmart share incentive scheme, there were noother movements in the share capital of the Company during the current reporting period.
Included in the issued share capital are 335 764 treasury shares. There were no treasury shares in the prior year.
The directors have the authority, until the next annual general meeting, to issue the ordinary shares of the Company up to amaximum of 5% of the shares already issued.
The directors have the authority, until the next annual general meeting, to issue the preference shares of the Company.
The following options granted to employees in terms of the employee share incentive scheme have not yet been exercised:12 234 468 (2005: 13 621 884) Massmart ordinary shares at considerations ranging from R12.37 to R58.74 (2005: R12.37 to R45.24).
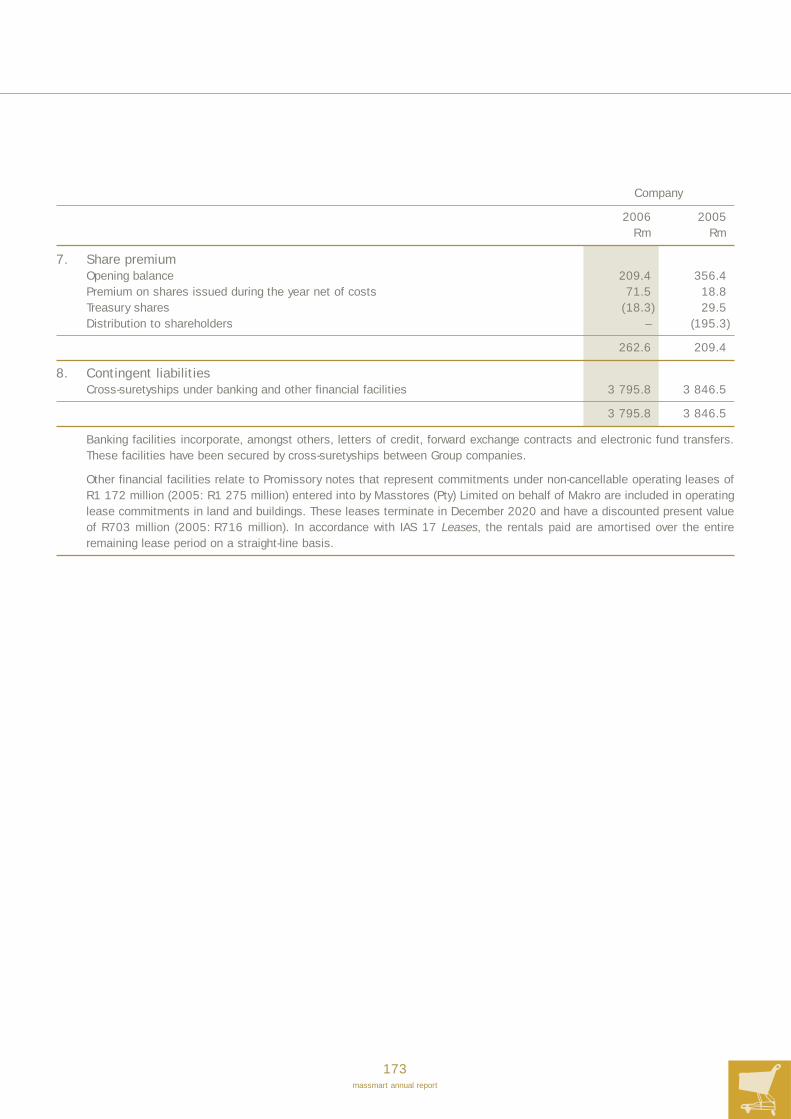
173massmart annual report
Company
2006 2005Rm Rm
7. Share premiumOpening balance 209.4 356.4Premium on shares issued during the year net of costs 71.5 18.8Treasury shares (18.3) 29.5Distribution to shareholders – (195.3)
262.6 209.4
8. Contingent liabilitiesCross-suretyships under banking and other financial facilities 3 795.8 3 846.5
3 795.8 3 846.5
Banking facilities incorporate, amongst others, letters of credit, forward exchange contracts and electronic fund transfers.These facilities have been secured by cross-suretyships between Group companies.
Other financial facilities relate to Promissory notes that represent commitments under non-cancellable operating leases ofR1 172 million (2005: R1 275 million) entered into by Masstores (Pty) Limited on behalf of Makro are included in operatinglease commitments in land and buildings. These leases terminate in December 2020 and have a discounted present valueof R703 million (2005: R716 million). In accordance with IAS 17 Leases, the rentals paid are amortised over the entireremaining lease period on a straight-line basis.
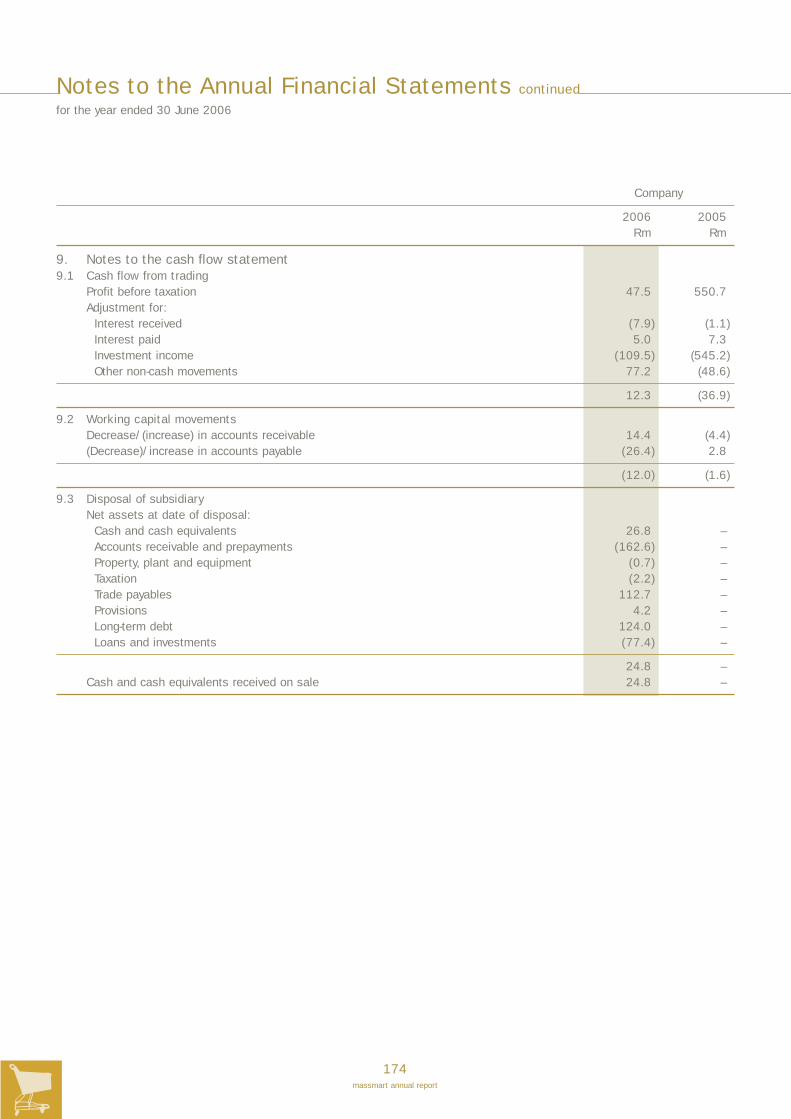
174massmart annual report
Notes to the Annual Financial Statements continued
for the year ended 30 June 2006
Company
2006 2005Rm Rm
9. Notes to the cash flow statement9.1 Cash flow from trading
Profit before taxation 47.5 550.7Adjustment for:
Interest received (7.9) (1.1)Interest paid 5.0 7.3Investment income (109.5) (545.2)Other non-cash movements 77.2 (48.6)
12.3 (36.9)
9.2 Working capital movementsDecrease/(increase) in accounts receivable 14.4 (4.4)(Decrease)/increase in accounts payable (26.4) 2.8
(12.0) (1.6)
9.3 Disposal of subsidiaryNet assets at date of disposal:
Cash and cash equivalents 26.8 –Accounts receivable and prepayments (162.6) –Property, plant and equipment (0.7) –Taxation (2.2) –Trade payables 112.7 –Provisions 4.2 –Long-term debt 124.0 –Loans and investments (77.4) –
24.8 –Cash and cash equivalents received on sale 24.8 –

175massmart annual report
Notice is hereby given that the annual general meeting ofthe Company will be held at 08:30 at Massmart House,16 Peltier Drive, Sunninghill Ext 6, Sandton on Wednesday,22 November 2006, for purposes of:
1. Transacting the following business:1.1 to receive and adopt the annual financial
statements of the Company and the Group for theyear ended 30 June 2006;
1.2 to elect directors in the place of those retiring inaccordance with the Company’s Articles ofAssociation; and
1.3 to transact such other business as may betransacted at an annual general meeting.
2. Considering and, if deemed fit, passing, with or withoutmodification, the following ordinary and specialresolutions:
Ordinary resolutions1. “Resolved that the annual financial statements of the
Company and the Group for the year ended 30 June2006, circulated together with this notice, be and arehereby adopted.”
2. “Resolved that Mr MD Brand, who now resigns by rotationand has offered himself for re-election, be and is herebyre-elected to the Board of directors of the Company.”
3. “Resolved that Mr ZL Combi, who now resigns by rotationand has offered himself for re-election, be and is herebyre-elected to the Board of directors of the Company.”
4. “Resolved that Mr GRC Hayward, who now resigns byrotation and has offered himself for re-election, be and ishereby re-elected to the Board of directors of theCompany.”
5. “Resolved that Mr IN Matthews, who now resigns byrotation and has offered himself for re-election, be and ishereby re-elected to the Board of directors of theCompany.”
6. “Resolved that Mr P Maw, who now resigns by rotationand has offered himself for re-election, be and is herebyre-elected to the Board of directors of the Company.”
7. “Resolved that the non-executive directors’ annualremuneration for the 2007 financial year be set asfollows:
Chairman R500 000Directors R175 000
Committee chairmen R175 000Committee members R82 000”
8. “Resolved that Messrs Deloitte & Touche be and arehereby re-elected as the Company’s auditors for theensuing financial year.”
9. “Resolved that all the ordinary shares in the authorised butunissued share capital of the Company be and are herebyplaced under the control of the directors in terms ofsection 221(2) of the Companies Act, 1973 (Act 61 of1973), as amended (“the Act”), who shall be authorised toallot and issue such shares to such person or persons onsuch terms and conditions as they may deem fit but notexceeding 5% of the number of shares already in issue.Such allotment will be in accordance with the Act and theListings Requirements of the JSE Limited (“the JSE”)”.
10. “Resolved that, subject to the JSE ListingsRequirements, the directors be and are herebyauthorised to issue the ordinary shares in the authorisedbut unissued share capital of the Company for cash tosuch person or persons on such terms and conditions asthey may deem fit, subject to the following:10.1 the shares shall be of a class already in issue; 10.2 the shares shall be issued to public shareholders
(as defined in the JSE Listings Requirements) andnot to related parties (as defined in the JSEListings Requirements);
10.3 the issues in the aggregate in any one financialyear shall not exceed 5% (five percent) of thenumber of shares already in issue;
10.4 the maximum discount at which the shares may beissued shall be 10% (ten percent) of the weightedaverage traded price of the shares over the 30(thirty) business days prior to the date that theprice of the issue is determined or agreed by thedirectors;
10.5 the authority hereby granted will be valid until theCompany’s next annual general meeting or for aperiod of 15 (fifteen) months, whichever period isshorter;
10.6 once the securities have been issued, the Companyshall publish an announcement in accordancewith paragraph 11.22 of the JSE ListingsRequirements.”
11. “Resolved that all the preference shares in theauthorised but unissued share capital of the Company beand are hereby placed under the control of the directorsin terms of section 221(2) of the Companies Act, 1973(Act 61 of 1973), as amended (“the Act”), who shall be
Notice of Annual General Meetingfor the year ended 30 June 2006
Notice of Annual General Meeting continued
176massmart annual report
for the year ended 30 June 2006
authorised to allot and issue such shares to such personor persons on such terms and conditions as they maydeem fit. Such allotment will be in accordance with theAct and the Listings Requirements of the JSE Limited.
12. “Resolved that, subject to the JSE ListingsRequirements, the directors be and are herebyauthorised to issue the preference shares in theauthorised but unissued share capital of the Company forcash to such person or persons on such terms andconditions as they may deem fit, subject to the following:12.1 the shares shall be issued to public shareholders
(as defined in the JSE Listings Requirements) andnot to related parties (as defined in the JSEListings Requirements);
12.2 the authority hereby granted will be valid until theCompany’s next annual general meeting or for aperiod of 15 (fifteen) months, whichever period isshorter;
12.3 once the securities have been issued, the Companyshall publish an announcement in accordance with paragraph 11.22 of the JSE ListingsRequirements.”
The approval of a 75% (seventy-five percent) majority of thevotes cast by shareholders present or represented by proxy atthe annual general meeting is required for this resolution tobecome effective:
Special resolution:1. “Resolved that the Company and its subsidiaries be and
are hereby authorised in terms of sections 85(2) and85(3) of the Act, and the JSE Listings Requirements, fromtime to time to acquire the ordinary and/or preferenceshares in the issued share capital of the Company fromsuch shareholder/s, at such price, in such manner andsubject to such terms and conditions as the directorsmay deem fit, but subject to the Articles of Association ofthe Company, the Act and the JSE Listings Requirements,and provided that: 1.1 the authority hereby granted will be valid until the
Company’s next annual general meeting, or for aperiod of 15 (fifteen) months from the date ofregistration of this special resolution, whicheverperiod is shorter;
1.2 acquisitions may not be made at a price greaterthan 10% (ten percent) above the weighted averageof the market value for the shares determined overthe 5 (five) business days prior to the date that theprice for the acquisition is effected;
1.3 acquisitions in aggregate in any one financial yearshall not exceed 15% (fifteen percent) of that classof the Company’s issued ordinary and preferenceshare capital;
1.4 the repurchase of securities will be effectedthrough the order book operated by the JSE tradingsystem and will be done without any priorunderstanding or arrangement between theCompany and the counter party;
1.5 the Company will only appoint one agent to effectthe repurchases on the Company’s behalf;
1.6 the Company will only undertake a repurchase ofsecurities if, after such repurchases, the Companycomplies with the JSE Listings Requirementsshareholder spread requirements;
1.7 neither the Company nor its subsidiaries willrepurchase securities during a prohibited period (asdefined in the JSE Listings Requirements);
1.8 an announcement complying with 11.27 of the JSEListings Requirements will be published by theCompany when the Company and/or itssubsidiaries have cumulatively repurchased 3%(three percent) of the Company’s issued ordinaryand/or preference share capital and for each 3%(three percent) in aggregate thereafter.”
Statement by the Board of DirectorsIn accordance with the JSE Listings Requirements, thedirectors state that:a) the intention of the directors is to utilise the authority at
a future date, provided that the cash resources of theCompany are in excess of its requirements. In thisregard, the directors will take into account, inter alia, anappropriate capitalisation structure for the Company andthe long-term cash needs of the Company, and willensure that any such utilisation is in the interests of theshareholders;
b) having considered the effect of the maximum number ofordinary and preference shares that may be acquiredpursuant to the authority and the date upon which suchacquisition/s will take place: – the Company and its subsidiaries will be able in the
ordinary course of business to pay their debts for aperiod of twelve months after the date of this noticeof annual general meeting;
– the assets of the Company and its subsidiaries willbe in excess of the liabilities of the Company and itssubsidiaries for a period of twelve months after thedate of this notice of annual general meeting, such

177massmart annual report
assets and liabilities being fairly valued in accordancewith International Financial Reporting Standards andin accordance with the accounting policies used inthe Company and the Group annual financialstatements for the year ended 30 June 2006;
– the issued share capital and reserves of theCompany and its subsidiaries will be adequatefor purposes of the business of the Company andits subsidiaries for a period of twelve monthsafter the date of this notice of annual generalmeeting;
– the working capital available to the Company andits subsidiaries will be adequate for purposes ofthe business of the Company and its subsidiariesfor a period of twelve months after the date of thisnotice of annual general meeting.
The Company will ensure that its sponsor provides thenecessary sponsor letter on the adequacy of the workingcapital in terms of the JSE Listings Requirements, prior to thecommencement of any purchase of the Company’s shares onthe open market.
Reason and effectThe reason for special resolution number 1 is to give amandate to the directors to repurchase ordinary andpreference shares in the Company.
The effect of special resolution number 1 will be that theCompany and its subsidiaries will be authorised to acquireordinary and preference shares in the Company.
Voting and proxiesAll holders of ordinary shares in the Company will be entitledto attend and vote at the annual general meeting. Subject toany rights or restrictions for the time being attached to anyordinary shares, on a show of hands, every shareholder whois present in person, or in the case of a company, therepresentative appointed in terms of section 188 of the Act,shall have one vote. On a poll, each shareholder shall haveso many votes for each share as is determined in accordancewith section 195 of the Act, read with the Company’s Articlesof Association.
In terms of the Listings Requirements, Massmart shares heldby and registered in the name of The Massmart HoldingsLimited Employees Share Trust will not have their votes at theannual general meeting taken into account for ListingsRequirements resolution approval purposes.
If you hold certificated shares (i.e. have not dematerialisedyour shares in the Company) or are registered as an ownname dematerialised shareholder, then:• you may attend and vote at the annual general meeting;
alternatively• you may appoint a proxy to represent you at the annual
general meeting by completing the attached form of proxyand returning it to the registered office of the Company tobe received by no later than 48 hours prior to the timeappointed for the holding of the meeting (excludingSaturdays, Sundays, and public holidays).
If you own dematerialised shares (i.e. have replaced thepaper share certificates representing the shares withelectronic records of ownership under the JSE’s electronicsettlement system, STRATE Limited (“STRATE”)) and are notregistered as an “own name dematerialised shareholder” (i.e.specifically instructed your Central Security DepositoryParticipant (“CSDP”) to hold your shares in your own name onthe Company’s sub-register), then, subject to the mandatebetween yourself and your CSDP or broker:• if you wish to attend the annual general meeting you
must contact your CSDP or broker, as the case may be,and obtain the relevant letter of representation from it;alternatively,
• if you are unable to attend the annual general meeting butwish to be represented at the meeting, you must contactyour CSDP or broker, as the case may be, and furnish itwith your voting instructions in respect of the annualgeneral meeting. You must not complete the attachedform of proxy. The instructions must be provided inaccordance with the mandate between yourself and yourCSDP or broker, as the case may be, within the time periodrequired by your CSDP or broker, as the case may be.
CSDPs, brokers or their nominees, as the case may be,recorded in the Company’s sub-register should, whenauthorised in terms of their mandate or instructed to do so bythe owner on behalf of whom they hold dematerialised sharesin the Company, vote by either appointing a duly authorisedrepresentative to attend and vote at the annual generalmeeting or by completing the attached form of proxy inaccordance with the instructions thereon and returning it tothe registered office of the Company to be received not lessthan 48 hours prior to the time appointed for the holding ofthe meeting.
In terms of the JSE Listing Requirements for specialresolution 1, general information is included in the annualreport attached, including: (i) Directors and management (pages 10 – 13);
178massmart annual report
(ii) Major shareholders (page 166); (iii) Material changes (page 110); (iv) Directors’ interest in securities (page 111);(v) Share capital of the Company (page 140); and (vi) Litigation (page 112)
The directors whose names appear on pages 10 and 11 ofthe annual report collectively and individually accept fullresponsibility for the accuracy of the information given andcertify that to the best of their knowledge and belief there areno facts that have been omitted which would make anystatement false or misleading, and that all reasonableenquiries to ascertain such facts have been made and thatthe circular (the notice to the annual general meeting)contains all information required by law and the JSE ListingsRequirements.
By order of the Board
Aubrey CimringCompany Secretary
Johannesburg17 October 2006
Notice of Annual General Meeting continued
for the year ended 30 June 2006

179massmart annual report
Massmart Holdings LimitedRegistration number 1940/014066/06JSE share code MSMISIN code ZAE000029534(“Massmart” or “the Company”)
Form of proxy for use at the annual general meeting of the Company to be held at 08:30 at Massmart House, 16 Peltier Drive,Sunninghill Extension 6, Sandton on Wednesday, 22 November 2006
Only certificated and own name dematerialised shareholders may complete a form of proxy or alternatively attend the annual generalmeeting.
I/We
of
being a member/members of the abovementioned company and holding shares in the Company
hereby appoint:
or failing him/her,or failing him/her, the chairman of the annual general meeting as my/our proxy to vote for me/us on my/our behalf at the annualgeneral meeting of the Company to be held at 08:30 on Wednesday, 22 November 2006 at Massmart House, 16 Peltier Drive,Sunninghill Extension 6, Sandton and at every adjournment of that meeting.
Signed at this day of 2006
Signature
Please indicate with an “X” in the appropriate space below how you wish your vote to be cast. If you return this form duly signed,without any specific directions, the proxy shall be entitled to vote as he/she thinks fit.
In favour of Against Abstain fromresolution resolution voting
Ordinary resolutions1. Adoption of the annual financial statements2. Re-election of Mr MD Brand to the Board of Directors3. Re-election of Mr ZL Combi to the Board of Directors4. Re-election of Mr GRC Hayward to the Board of Directors5. Re-election of Mr IN Matthews to the Board of Directors6. Re-election of Mr P Maw to the Board of Directors7. Approval of the non-executive directors’ annual remuneration8. Re-election of Messrs Deloitte & Touche as the Company’s auditors9. Placement of the unissued ordinary share capital under the
control of the directors10. Authorisation for the directors to issue ordinary shares for cash,
limited to 5% of the shares in issue11. Placement of the unissued preference share capital under the
control of the directors12. Authorisation for the directors to issue preference
shares for cashSpecial resolution1. Authority for the Company to buy back its own shares
A member entitled to attend and vote at this meeting is entitled to appoint one or more proxies to attend, speak and vote in his/herstead. A proxy need not be a member of the Company. Proxies must be lodged at the registered office of the Company not lessthan 48 (forty-eight) hours before the time for holding the meeting.
Form of Proxy
Notes to the Proxy
180massmart annual report
1. A form of proxy is only to be completed by those ordinary shareholders who are:1.1 holding ordinary shares in certified form; or1.2 recorded on sub-register electronic form in “own name”.
2. If you have already dematerialised your ordinary shares through a Central Securities Depository Participant (“CSDP”) or brokerand wish to attend the annual general meeting, you must request your CSDP or broker to provide you with a letter ofrepresentation or you must instruct your CSDP or broker to vote by proxy on your behalf in terms of the agreement enteredinto between yourself and your CSDP or broker.
3. A member may insert the name of a proxy or the names of two alternative proxies of the member’s choice in the spaceprovided. The person whose name stands first on the form of proxy and who is present at the annual general meeting ofshareholders will be entitled to act as proxy to the exclusion of those whose names follow.
4. A member’s instructions to the proxy must be indicated by the insertion of the relevant numbers of votes exercisable by themember in the space provided. Failure to comply with the above will be deemed to authorise the proxy to vote or to abstainfrom voting at the annual general meeting as he/she deems fit in respect of all the member’s votes exercisable thereat. Amember or the proxy is not obliged to use all the votes exercisable by the member or by the proxy, but the total of the votescast and in respect of which abstention is recorded may not exceed the total of the votes exercisable by the member or bythe proxy.
5. Forms of proxy must be lodged with or posted to the Company’s registered office, Massmart House, 16 Peltier Drive,Sunninghill, Extension 6, Sandton, 2196 (Private Bag X4, Sunninghill, 2157), to be received no later than 08:30 on Monday,20 November 2006.
6. The completion and lodging of this form of proxy will not preclude the relevant member from attending the annual generalmeeting and speaking and voting in person thereat to the exclusion of any proxy appointed in terms hereof.
7. Documentary evidence establishing the authority of a person signing this form of proxy in a representative capacity or otherlegal capacity must be attached to this form of proxy, unless previously recorded by the transfer secretaries or waived by thechairman of the annual general meeting.
8. Any alteration or correction made to this form of proxy must be initialled by the signatory/ies.
9. Notwithstanding the aforegoing, the chairman of the annual general meeting may waive any formalities that would otherwisebe a prerequisite for a valid proxy.
10. If any shares are jointly held, the first name appearing in the register shall, in the event of any dispute, be taken as a member.

G R A P H I C O R3 4 6 6 3
Administration
Company Secretary A Cimring, CA(SA)Registered office Massmart House, 16 Peltier Drive, Sunninghill Ext 6, Sandton, 2196Postal address Private Bag X4, Sunninghill, 2157Telephone number + 27 (0) 11 517 0000Fax number + 27 (0) 11 517 0020Website http://www.massmart.co.zaCompany registration number 1940/014066/06JSE share code MSMISIN code ZAE000029534Transfer secretaries Computershare Limited, Investor Services Division,
70 Marshall Street, Johannesburg, 2001Principal bankers Nedbank Group Limited, ABSA Bank Limited, The Standard Bank of Sou
Limited, First National Bank (A division of FirstRand Bank Limited)Auditors Deloitte & ToucheCorporate law advisors Edward Nathan (Pty) LimitedLead sponsor Deutsche Securities
Financial Calendar
Financial year-end JuneAnnual report OctoberAnnual general meeting NovemberInterim report FebruaryDividends:Declared interim February
final AugustPayable interim March
final September

www.massmart.co.za