Strength assessment during shallow penetration of a sphere in clay
6
Strength assessment during shallow penetration of a sphere in clay Morton, J. P., O'Loughlin, C., & White, D. (2014). Strength assessment during shallow penetration of a sphere in clay. Geotechnique Letters, 4(1st October 2014), 262 - 266. DOI: 10.1680/geolett.14.00049 Published in: Geotechnique Letters DOI: 10.1680/geolett.14.00049 Document Version Publisher's PDF, also known as Version of record Link to publication in the UWA Research Repository General rights Copyright owners retain the copyright for their material stored in the UWA Research Repository. The University grants no end-user rights beyond those which are provided by the Australian Copyright Act 1968. Users may make use of the material in the Repository providing due attribution is given and the use is in accordance with the Copyright Act 1968. Take down policy If you believe this document infringes copyright, raise a complaint by contacting [email protected]. The document will be immediately withdrawn from public access while the complaint is being investigated. Download date: 20. Feb. 2018
Transcript of Strength assessment during shallow penetration of a sphere in clay
Strength assessment during shallow penetration of a sphere inclayMorton, J. P., O'Loughlin, C., & White, D. (2014). Strength assessment during shallow penetration of asphere in clay. Geotechnique Letters, 4(1st October 2014), 262 - 266. DOI: 10.1680/geolett.14.00049
Published in:Geotechnique Letters
DOI:10.1680/geolett.14.00049
Document VersionPublisher's PDF, also known as Version of record
Link to publication in the UWA Research Repository
General rightsCopyright owners retain the copyright for their material stored in the UWA Research Repository. The University grants no end-userrights beyond those which are provided by the Australian Copyright Act 1968. Users may make use of the material in the Repositoryproviding due attribution is given and the use is in accordance with the Copyright Act 1968.
Take down policyIf you believe this document infringes copyright, raise a complaint by contacting [email protected]. The document will beimmediately withdrawn from public access while the complaint is being investigated.
Download date: 20. Feb. 2018

Strength assessment during shallow penetration of a sphere in clay
J. P. MORTON*, C. D. O’LOUGHLIN* and D. J. WHITE*
Strength interpretation from the measured penetration resistance of full-flow penetrometers, such asthe T-bar and ball, is generally based on a constant bearing capacity factor associated with a deepflow-round mechanism. This approach may underestimate the strength of near-surface sediments,which is becoming increasingly important for the design of offshore infrastructure such as pipelines,steel catenary risers and mudmats. This paper describes a series of centrifuge experiments designedto capture the change in the capacity factor of a ball penetrometer during shallow penetration. Arigorous consideration of soil buoyancy is provided. This is an important consideration in soils with ahigher strength to self-weight ratio because a cavity is formed by the passage of the ball and remainsopen to greater depths. The depth at which a full-flow mechanism develops is related to thedimensionless strength ratio, expressed as the ratio of the undrained shear strength to the effectiveunit weight and penetrometer diameter. This observation forms the basis for proposed formulationsthat describe the evolution of the bearing capacity factor with depth for different dimensionlessstrength ratios. These formulations can be used to determine more accurately the undrained shearstrength of near-surface soil over the range of dimensionless strength ratios that is of interest tooffshore applications.
KEYWORDS: bearing capacity; centrifuge modelling; penetrometers; shear strength; site investigation
ICE Publishing: all rights reserved
NOTATION
Ap projected area of the sphereAs shaft areacv coefficient of vertical consolidationD diameter of penetrometerFbuoy soil buoyancyFs evolving soil resistanceHc cavity depthk undrained shear strength gradientm plastic volumetric strain ratioNb bearing capacity factorNb-deep deep bearing capacity factorNb-shallow shallow bearing capacity factorqb buoyancy resistanceqm measured bearing pressureqnet net penetration resistanceQs soil resistancesu undrained shear strengthu0 hydrostatic pore pressurev penetration ratew ball invert depthw
‘
op normalised operative deptha net area ratio of the load cell core to the shaft areac9 effective unit weight of the soilsv overburden pressures9v vertical effective stress
INTRODUCTIONFor a deeply embedded ball penetrometer, a full-flowmechanism that is symmetrical above and below the ball isoperative and the undrained shear strength, su, can beinterpreted from the measured bearing pressure, qm,
according to su5qm/Nb-deep. However, at shallow penetra-tion depths, a full-flow mechanism does not develop and su
should be interpreted from the measured penetrationresistance using a bearing capacity factor Nb-shallow,Nb-deep.Adopting an appropriate Nb-shallow, and accounting for itsevolution to Nb-deep with depth, is an important aspect ofquantifying su over the upper 1–2 m of the seabed. This iscritical for the design of almost all shallowly embeddedoffshore infrastructure (Puech et al., 2010) including subseapipelines, steel catenary risers and mudmats.
Large-deformation finite-element (LDFE) analyses on aT-bar (White et al., 2010; Tho et al., 2012), spudcan(Hossain et al., 2005) and ball penetrometer (Zhou et al.,2013) have shown that the transition depth from Nb-shallow
to Nb-deep is dependent on the dimensionless strength ratiosu/c9D, where c9 is the effective unit weight of the soil and Dis the diameter of the penetrometer. Higher strength ratiosare associated with a delay in the transition to a steadyNb-deep. Correlations for the transition depth and Nb-shallow
have been derived and, in the case of the T-bar and ball, abasis for correcting penetration data within the shallowzone has been proposed (White et al., 2010; Zhou et al.,2013). However, from the perspective of a sphericalpenetrometer, which is the focus of this paper, the rangeof strength ratios previously examined (su/c9D52?95–44?25(Zhou et al., 2013)) is narrower than the range that is ofpractical interest for offshore problems. For example, a250 mm diameter freefall spherical penetrometer (for mea-suring the strength of the seabed (Morton & O’Loughlin,2012)) penetrating very soft soil is associated with low valuesof su/c9D approaching 0?1 at one diameter embedment,whereas an 80 mm piezoball penetrating the seabed witha crust strength of <20 kPa is associated with high values ofsu/c9D, approaching 40.
The motivation for this study was to experimentallycapture the variation in Nb-shallow with depth for a ballpenetrometer embedding into clay over a wide range ofsu/c9D. The experimental data are combined with reinterpreted
Manuscript received 4 July 2014; first decision 6 August 2014;accepted 5 September 2014.Published online at www.geotechniqueletters.com on 10October 2014.*Centre for Offshore Foundation Systems, University ofWestern Australia, Perth, WA, Australia
Morton, J. P. et al. (2014) Geotechnique Letters 4, 262–266, http://dx.doi.org/10.1680/geolett.14.00049
262
Downloaded by [ University Of Western Australia] on [23/11/15]. Copyright © ICE Publishing, all rights reserved.
LDFE results (Zhou et al., 2013) and form the basis of a newcorrelation that describes the evolution of Nb with depth.
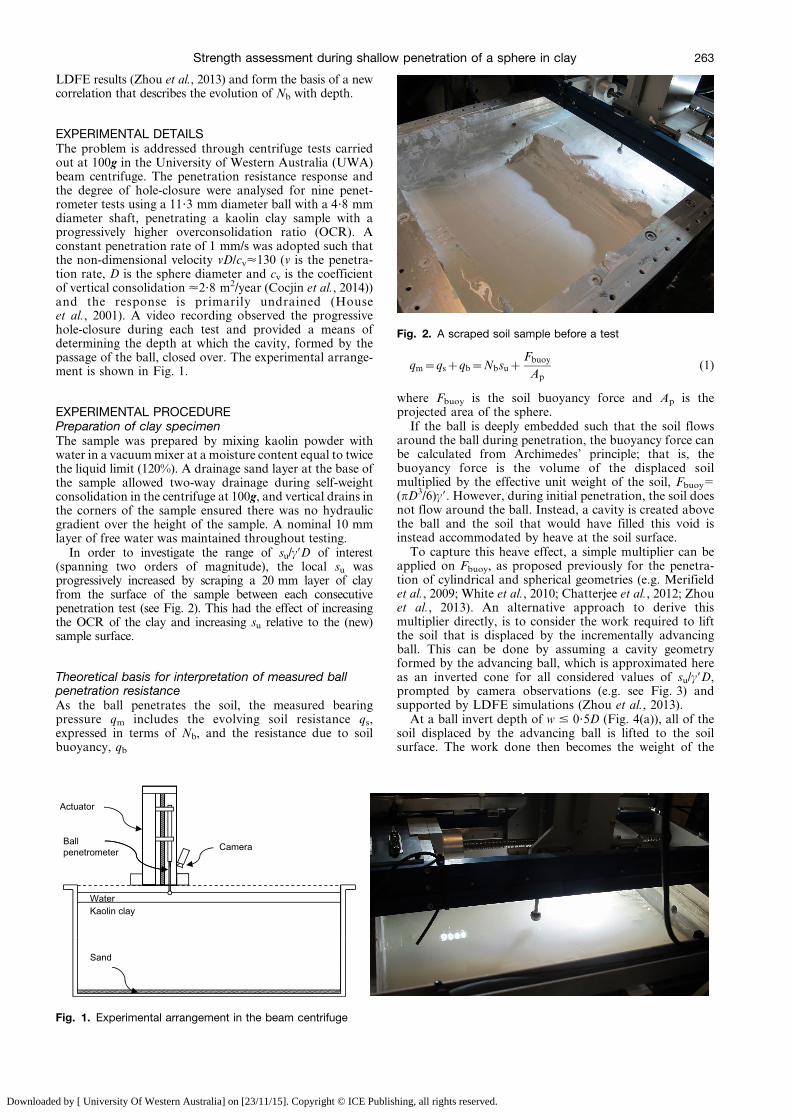
EXPERIMENTAL DETAILSThe problem is addressed through centrifuge tests carriedout at 100g in the University of Western Australia (UWA)beam centrifuge. The penetration resistance response andthe degree of hole-closure were analysed for nine penet-rometer tests using a 11?3 mm diameter ball with a 4?8 mmdiameter shaft, penetrating a kaolin clay sample with aprogressively higher overconsolidation ratio (OCR). Aconstant penetration rate of 1 mm/s was adopted such thatthe non-dimensional velocity vD/cv<130 (v is the penetra-tion rate, D is the sphere diameter and cv is the coefficientof vertical consolidation <2?8 m2/year (Cocjin et al., 2014))and the response is primarily undrained (Houseet al., 2001). A video recording observed the progressivehole-closure during each test and provided a means ofdetermining the depth at which the cavity, formed by thepassage of the ball, closed over. The experimental arrange-ment is shown in Fig. 1.
EXPERIMENTAL PROCEDUREPreparation of clay specimenThe sample was prepared by mixing kaolin powder withwater in a vacuum mixer at a moisture content equal to twicethe liquid limit (120%). A drainage sand layer at the base ofthe sample allowed two-way drainage during self-weightconsolidation in the centrifuge at 100g, and vertical drains inthe corners of the sample ensured there was no hydraulicgradient over the height of the sample. A nominal 10 mmlayer of free water was maintained throughout testing.
In order to investigate the range of su/c9D of interest(spanning two orders of magnitude), the local su wasprogressively increased by scraping a 20 mm layer of clayfrom the surface of the sample between each consecutivepenetration test (see Fig. 2). This had the effect of increasingthe OCR of the clay and increasing su relative to the (new)sample surface.
Theoretical basis for interpretation of measured ballpenetration resistanceAs the ball penetrates the soil, the measured bearingpressure qm includes the evolving soil resistance qs,expressed in terms of Nb, and the resistance due to soilbuoyancy, qb
qm~qszqb~NbsuzFbuoy
Ap(1)
where Fbuoy is the soil buoyancy force and Ap is theprojected area of the sphere.
If the ball is deeply embedded such that the soil flowsaround the ball during penetration, the buoyancy force canbe calculated from Archimedes’ principle; that is, thebuoyancy force is the volume of the displaced soilmultiplied by the effective unit weight of the soil, Fbuoy5(pD3/6)c9. However, during initial penetration, the soil doesnot flow around the ball. Instead, a cavity is created abovethe ball and the soil that would have filled this void isinstead accommodated by heave at the soil surface.
To capture this heave effect, a simple multiplier can beapplied on Fbuoy, as proposed previously for the penetra-tion of cylindrical and spherical geometries (e.g. Merifieldet al., 2009; White et al., 2010; Chatterjee et al., 2012; Zhouet al., 2013). An alternative approach to derive thismultiplier directly, is to consider the work required to liftthe soil that is displaced by the incrementally advancingball. This can be done by assuming a cavity geometryformed by the advancing ball, which is approximated hereas an inverted cone for all considered values of su/c9D,prompted by camera observations (e.g. see Fig. 3) andsupported by LDFE simulations (Zhou et al., 2013).
At a ball invert depth of w # 0?5D (Fig. 4(a)), all of thesoil displaced by the advancing ball is lifted to the soilsurface. The work done then becomes the weight of the
Actuator
Ballpenetrometer Camera
WaterKaolin clay
Sand
Fig. 1. Experimental arrangement in the beam centrifuge
Fig. 2. A scraped soil sample before a test
Strength assessment during shallow penetration of a sphere in clay 263
Downloaded by [ University Of Western Australia] on [23/11/15]. Copyright © ICE Publishing, all rights reserved.

displaced soil multiplied by the distance between thecentroidal height of the embedded ball (a spherical cap)and the soil surface. For 0?5D . w # Hc + D, where Hc isthe cavity depth, only some of the soil displaced by theadvancing ball is lifted to the surface. The remainder fillspart of the cavity created by the increment of ballpenetration, as shown in Fig. 4(b). In this case, the workdone is calculated by adding the gain in potential energy bythese two separate elements of soil, resulting in the profileof soil buoyancy with embedment given in Fig. 4(c).
The net penetration resistance qnet can be calculatedusing the measured resistance qm from equation (1) bycorrecting for the unequal pore pressure and overburdenpressure effects due to the shaft behind the ball (Chung &Randolph, 2004)
qnet~qm{½sv{u0(1{a)� As
Ap(2)
where sv is the overburden pressure, u0 is the hydrostaticpore pressure, As is the shaft area and the parameter a is thenet area ratio of the load cell core to the shaft area (a 5 0?8for the tests considered here).
For a deeply embedded ball, qnet – and hence the inferredsu – corresponds to the mid-height of the ball due to thedepth symmetry of the flow-round mechanism. For ashallowly embedded ball, where the full-flow mechanism isnot fully developed, the normalised operative depth wop isassumed to vary linearly up to the depth where a full flow-round mechanism occurs, in a similar manner to that
proposed for a shallowly embedded T-bar (White et al.,2010)
wop~w
D{0:5
w
HczD
� �§
w
D{0:5 (3)
Omitted from the above theoretical framework is anyconsideration of how Nb evolves during shallow to deeppenetration. This has been purposely excluded from thepreceding discussion and will be formulated later in thepaper to reflect the experimental results presented inthe following section.
RESULTS AND COMPARISONSIn-flight video camera observationsThe camera was synchronised with the data acquisitionsystem such that visual observations could be relayed to themeasured penetration response. For lower values of su/c9D,where the open cavity depth was lower and could becaptured by the camera, the instances when soil flowed overthe ball were consistent with the transitional depths inferredfrom the penetration profiles shown in Fig. 5 (and discussedin the next section). This observation is at variance with theLDFE results reported by Zhou et al. (2013), which indicatethat more penetration is required to establish a deep failuremechanism after full flow of soil over the top of the ball.
Fig. 3. Ball penetrometer and cavity after a penetration test
0
0.5
1.0
1.5
2.0
2.5
3.0
0 0.2 0.4 0.6 0.8
Nor
mal
ised
inve
rt de
pth,
w/D
Fbuoy/c'D3
(c)
Hc
Displaced soil
D'
Soil flowto surface
(a) (b)
Displaced soilPartialsoil flow
w
w
Change in elevationof soil mass centroid
Soil surface
Fig. 4. Schematic illustration of soil buoyancy due to (a) the sphere and (b) the sphere and conical cavity. (c) Buoyancy function fora typical cavity depth
0
2
4
6
8
10
12
14
16
18
20
0 5 10 15 20 25
Nor
mal
ised
dep
th, ŵ
op +
DZ s
crap
e
su, qnet/Nb-deep: kPa
Transition points
qnetNb-deep
Base sand drainage layer
su
Fig. 5. Comparison of strength profiles of Ladd et al. (1977)and qnet/Nb-deep profiles
264 Morton, O’Loughlin and White
Downloaded by [ University Of Western Australia] on [23/11/15]. Copyright © ICE Publishing, all rights reserved.

During shallow penetration, little or no heave wasobserved on the soil surface, particularly for tests withhigher values of su/c9D. This is considered to be due to theaxisymmetric flow mechanism of the ball, which reducesthe heave compared with plane strain flow for a cylindricalT-bar or pipeline (Stanier & White, 2014). In light of thisobservation, enhancement of Fbuoy in equation (1) toaccount for heave of the soil surface, as considered byMerifield et al. (2009), Randolph & White (2008) andStanier & White (2014), was not included.
Undrained shear strength profilesAs discussed earlier, the OCR of the sample was incremen-tally increased by scraping an additional 20 mm from thesample surface between penetration tests. The strength of thesample can then be assumed to vary with depth according toequation (4), proposed by Ladd et al. (1977)
su~s’vsu
s’v
� �nc
OCRm (4)
where s’v is the current vertical effective stress, determinedfrom the c9 profile with depth and the varying accelerationlevel within the centrifuge (93g to 105g over the depth ofpenetration), and m is the plastic volumetric strain ratio(Schofield & Wroth, 1968). The normally consolidatedundrained strength ratio (su=s’v)nc50?13, as determined fromball penetrometer tests before scraping the soil surface (i.e.OCR51) using the commonly adopted Nb-deep510?5 (Chung& Randolph, 2004). The ratio (su=s’v)ncincreases to 0?15 if themeasured resistance (which ignores shaft effects) is consid-ered, similar to (su=s’v)nc50?16 reported by Richardson et al.(2009) and Hu et al. (2014), and equivalent to an undrainedstrength gradient with prototype depth, k51 kPa/m, which istypical for UWA kaolin. The best agreement betweenequation (4) and the experimental qnet/Nb-deep profiles in theoverconsolidated samples was obtained using m51 (ratherthan the commonly reported m50?8), which reflects theminimal swelling time permitted between each soil scrape andthe subsequent penetration test.
Deep mechanism transition depthThe normalised transition depths wdeep-op are also shownin Fig. 5, and were selected as the depths where theqnet/Nb-deep experimental data were judged to have reachedsu predicted using equation (4). The final two profiles donot reach the predicted su profile due to the proximity ofthe base drainage sand layer and wdeep-op are approximatedin these instances on the basis of the Nb variation withdepth, discussed later. Values of wdeep-op are also shown inFig. 6 alongside previously reported T-bar (White et al.,2010), spudcan (Hossain et al., 2005) and ball (Zhou et al.,2013) data, but reinterpreted to account for the definition ofoperative depth adopted here. Further reinterpretation ofthe ball data of Zhou et al. (2013) was made to ascertainwdeep-op assessed as when Nb became effectively constant (towithin ,5% of the final value) rather than reaching the limit,which is difficult to judge and is approached asymptotically.The experimental ball data reported here, together with thereinterpreted Zhou et al. (2013) ball data, now form a uniquerelationship between wdeep-op and su/c9D for a ball penet-rometer (where su is the undrained strength at wdeep-op),which can be described using
wdeep-op~az bsu
c0D
� �c
zd{a
1z½(su=c0D)=e�f(5)
where the fitting constants a516?3, b50?12, c51?3,d50?52, e54?9 and f51?5.
Shallow bearing capacity factorsFigure 7 shows the experimental variation in Nb with depthfor each penetration test, obtained by dividing qnet by su
from equation (4). Each Nb profile follows the same trend,commencing at zero at the soil surface and reaching asteady Nb-deep at the transition depth, which is entirelydependent on su/c9D. This variation in Nb with depth canbe fitted using equation (6) (also shown on Fig. 7)
Nb-shallow~Nb-deep
wop
wdeep-op
!p
(6)
and
p~0:49su
c’D
� �{0:01
(7)
0.1
1
10
100
0.01 0.1 1 10 100
Nor
mal
ised
tran
sitio
n de
pth,
ŵde
ep-o
p
Normalised strength, su/c'D
Present study
Zhou et al. (2013), Ball reinterpreted
White et al. (2010), T-bar
Hossain et al. (2005), Spudcan
Equation (5)
Fig. 6. Effect of strength ratio su/c9D on transition depth
00 5 10 15
Nb
1
10.5
2
Equation (6)
Transition points
Nb variation3
4
Nor
mal
ised
ope
rativ
e d
epth
, ŵop
5
6
Fig. 7. Measured variation in normalised bearing factor withnormalised embedment depth and equation fit
Strength assessment during shallow penetration of a sphere in clay 265
Downloaded by [ University Of Western Australia] on [23/11/15]. Copyright © ICE Publishing, all rights reserved.

CONCLUSIONSThis paper reports on centrifuge tests in which a ballwas penetrated into clay under undrained conditions oversu/c9D50?07 to 2?70 (at the transition depth). The depth atwhich an open cavity, formed by the passage of the ball,closed over is considered to indicate the transitional depthwdeep-op where a full flow-round mechanism develops. Anovel analytical solution for the soil buoyancy in the case ofan open conical hole has been developed. This rigorousapproach is necessary to avoid significant errors in thedetermination of strength during shallow penetration in soilswith a low strength to self-weight ratio. For instance, in a claywith zero mudline strength and an undrained shear strengthratio of su=s’v50?25, the buoyancy resistance increases toalmost 70% of the geotechnical resistance during shallowpenetration, and is independent of the penetrometer diameterat all penetration depths. Data from centrifuge experiments,combined with reinterpreted data from LDFE analyses,show a unique relationship between wdeep-op and su/c9Dexamined over the range su/c9D<0?1 to 40. Equations thatdescribe the change in wdeep-op and the capacity factor Nb
with su/c9D are proposed. These equations offer a morerigorous and reliable means of assessing soil strength in theupper few metres of the seabed.
AcknowledgementsThis work forms part of the activities of the Centre forOffshore Foundation Systems (COFS), currently supportedas a node of the Australian Research Council Centre ofExcellence for Geotechnical Science and Engineering and asa Centre of Excellence by the Lloyd’s Register Foundation.The Lloyd’s Register Foundation invests in science,engineering and technology for public benefit, worldwide.
REFERENCESChatterjee, S., Randolph, M. F. & White, D. J. (2012). The effects of
penetration rate and strain softening on the vertical penetrationresistance of seabed pipelines. Geotechnique 62, No. 7, 573–582.
Chung, S. F. & Randolph, M. F. (2004). Penetration resistance insoft clay for different shaped penetrometers. Proc. 2nd Int.Conf. on Site Characterisation, Porto 2, No. 1, 671–678.
Cocjin, M. J., Gourvenec, S. M., White, D. J. & Randolph, M. F.(2014). Tolerably mobile subsea foundations – observations ofperformance. Geotechnique, in press.
Hossain, M. S., Hu, Y., Randolph, M. F. & White, D. J. (2005).Limiting cavity depth for spudcan foundations penetratingclay. Geotechnique 55, No. 9, 679–690.
House, A. R., Oliveria, J. R. M. S. & Randolph, M. F. (2001).Evaluating the coefficient of consolidation using penetrationtests. Int. J. Phys. Model. Geotech. 1, No. 3, 17–26.
Hu, P., Stainer, S. A., Cassidy, M. J. & Wang, D. (2014).Predicting peak resistance of spudcan penetrating sand over-lying clay. J. Geotech. Geoenviron. Engng ASCE 140, No. 204013009.
Ladd, C. C., Foot, R., Ishihara, K., Schlosser, F. & Poulos, H. G.(1977). Stress–deformation and strength characteristics. Proc.9th Int. Conf. Soil Mech. Found. Engng, Tokyo 2, 421–494.
Merifield, R., White, D. J. & Randolph, M. F. (2009). The effectof surface heave on the response of partially-embeddedpipelines on clay. J. Geotech. Geoenviron. Engng ASCE 135,No. 6, 819–829.
Morton, J. P. & O’Loughlin, C. D. (2012). Dynamic penetrationof a sphere in clay. Proc. 7th Int. Conf. on Offshore SiteInvestigation and Geotechnics, London 7, 223–230.
Puech, A., Orozco-Calderon, M. & Foray, P. (2010). Mini T-bartesting at shallow penetration. Proc. Frontiers in OffshoreGeotechnics, Perth, 305–310.
Randolph, M. F. & White, D. J. (2008). Pipeline embedment indeep water: processes and quantitative assessment. Proc.Offshore Tech. Conf., Houston 1, 1–16.
Richardson, M. D., O’Loughlin, C. D., Randolph, M. F. &Gaudin, C. (2009). Setup following installation of dynamicanchors in normally consolidated clay. J. Geotech. Geoenviron.Engng ASCE 135, No. 4, 487–496.
Schofield, A. N. & Wroth, C. P. (1968). Critical state soilmechanics. London: McGraw-Hill.
Stanier, S. A. & White, D. J. (2014). Shallow penetrometer penetrationresistance. J. Geotech. Geoenviron. Engng ASCE, in press.
Tho, K. K., Leung, C. F., Chow, Y. K. & Palmer, A. C. (2012).Deep cavity flow mechanism of pipe penetration in clay. Can.Geotech. J. 49, No. 1, 59–69.
White, D. J., Gaudin, C., Boylan, N. & Zhou, H. (2010).Interpretation of T-bar penetrometer tests at shallow embed-ment and in very soft soil. Can. Geotech. J. 47, No. 2, 218–229.
Zhou, H., Hossain, M. S., Hu, Y. & Liu, H. (2013). Behaviour of aball penetrometer in uniform single and double layer clays.Geotechnique 63, No. 8, 682–694.
WHAT DO YOU THINK?
To discuss this paper, please email up to 500 words tothe editor at [email protected]. Your contribution willbe forwarded to the author(s) for a reply and, ifconsidered appropriate by the editorial panel, will bepublished as a discussion.
266 Morton, O’Loughlin and White
Downloaded by [ University Of Western Australia] on [23/11/15]. Copyright © ICE Publishing, all rights reserved.