Streamflow Summary for Burnt Bridge Creek, 2008 (360) 407-6764 Washington State Department of...
38
Streamflow Summary for Burnt Bridge Creek (Clark County), 2008 December 2010 Publication No. 10-03-072
Transcript of Streamflow Summary for Burnt Bridge Creek, 2008 (360) 407-6764 Washington State Department of...

Streamflow Summary for Burnt Bridge Creek (Clark County), 2008
December 2010
Publication No. 10-03-072

Publication and Contact Information This report is available on the Department of Ecology’s website at www.ecy.wa.gov/biblio/1003072.html The Activity Tracker Code for this study is 01-710. For more information contact: Publications Coordinator Environmental Assessment Program P.O. Box 47600, Olympia, WA 98504-7600 Phone: (360) 407-6764
Washington State Department of Ecology - www.ecy.wa.gov/ o Headquarters, Olympia (360) 407-6000 o Northwest Regional Office, Bellevue (425) 649-7000 o Southwest Regional Office, Olympia (360) 407-6300 o Central Regional Office, Yakima (509) 575-2490 o Eastern Regional Office, Spokane (509) 329-3400 Cover photo: Burnt Bridge Creek at Kevanna Park.
Any use of product or firm names in this publication is for descriptive purposes only and does not imply endorsement by the author or the Department of Ecology.
To ask about the availability of this document in a format for the visually impaired,
call 360-407-6764. Persons with hearing loss can call 711 for Washington Relay Service.
Persons with a speech disability can call 877-833-6341.
Page 1
Streamflow Summary for Burnt Bridge Creek
(Clark County), 2008
by
Jason Myers
Freshwater Monitoring Unit Western Operations Section
Environmental Assessment Program Washington State Department of Ecology
Olympia, Washington 98504-7710
Waterbody Numbers: WA-28-1040

Page 2
This page is purposely left blank

Page 3
Table of Contents
Page
List of Figures ......................................................................................................................4
Abstract ................................................................................................................................5
Introduction ..........................................................................................................................6
Sampling Sites .....................................................................................................................7 Burnt Bridge Creek ........................................................................................................7
Methods................................................................................................................................9 Streamflow Measurements.............................................................................................9 Stage-Height Records ..................................................................................................10 Error Assessments ........................................................................................................11 High-Flow Modeling ...................................................................................................11
Quality Assurance ..............................................................................................................13 Stage-Height Records ..................................................................................................13 Streamflow Measurements...........................................................................................13
Results ................................................................................................................................15 Site 1: Burnt Bridge Creek at 2nd Avenue (28C080) ..................................................15 Site 2: Burnt Bridge Creek at Vancouver (28C110) ...................................................18 Site 3: Burnt Bridge Creek at Kevanna Park (28C150) ..............................................21
References ..........................................................................................................................25
Appendices .........................................................................................................................27
Appendix A. Average Daily Streamflows for Continuous Monitoring Stations ........29 Table A-1: Site 1, Burnt Bridge Creek at 2nd Avenue (28C080) ........................30 Table A-2: Site 2, Burnt Bridge Creek at Vancouver (28C110) ........................31 Table A-3: Site 3, Burnt Bridge Creek at Kevanna Park (28C150) ...................32
Appendix B. Discrete Streamflow Measurements ......................................................33 Table B-1: Site 1, Burnt Bridge Creek at 2nd Avenue (28C080). .......................33 Table B-2: Site 2, Burnt Bridge at Vancouver (28C110). ..................................33 Table B-3: Site 3, Burnt Bridge Creek at Kevanna Park (28C150). ..................34
Appendix C. Glossary, Acronyms, and Abbreviations ...............................................35

Page 4
List of Figures Page
Figure 1: Salmon-Washougal Water Resource Inventory Area (WRIA 28). .......................7
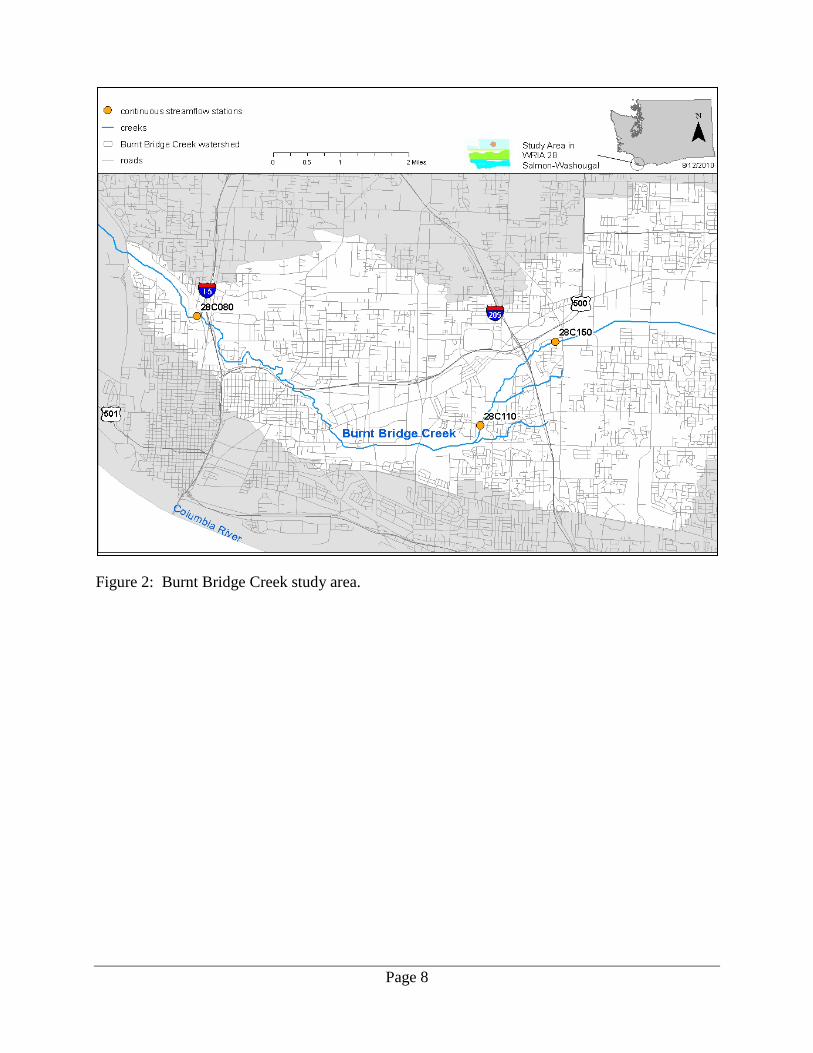
Figure 2: Burnt Bridge Creek study area. .............................................................................8
Figure 3: Streamflow hydrograph for Site 1. ........................................................................16
Figure 4: Discharge-rating curve for Site 1. .........................................................................16
Figure 5: Streamflow exceedance graph for Site 1. ..............................................................17
Figure 6: Linear regression of pre- versus post-adjusted streamflow data for Site 1. ..........17
Figure 7: Streamflow hydrograph for Site 2. ........................................................................19
Figure 8: Discharge-rating curve for Site 2. .........................................................................19
Figure 9: Streamflow exceedance graph for Site 2. ..............................................................20
Figure 10: Linear regression of pre- versus post-adjusted streamflow data for Site 2. ........20
Figure 11: Streamflow hydrograph for Site 3. ......................................................................22
Figure 12: Streamflow exceedance graph for Site 3. ............................................................22
Figure 13: Linear regression of pre- versus post-adjusted stage data for Site 3. ..................23

Page 5
Abstract From May 2008 to November 2009, the Washington State Department of Ecology (Ecology) conducted a streamflow assessment on Burnt Bridge Creek in Clark County. Ecology conducted this monitoring in support of a water quality Total Maximum Daily Load (TMDL) study. The purpose of the TMDL study was to characterize water quality, specifically fecal coliform, dissolved oxygen, and stream temperature, of Burnt Bridge Creek. Continuous stage-height (water surface elevation) data loggers were installed at three sites: Burnt Bridge Creek at 2nd Avenue, Burnt Bridge Creek at Vancouver, and Burnt Bridge Creek at Kevanna Park. Discrete stage-height readings and streamflow measurements were taken at these sites to develop stage-discharge relationships. Error assessments were conducted for each station for both the period of record and the low-flow period (July through September). Potential error for the streamflow data collected from these sites ranged from ±18.5% to ±51.7%.

Page 6
Introduction From May 2008 to November 2009, the Washington State Department of Ecology (Ecology) conducted a streamflow assessment on Burnt Bridge Creek. This monitoring was conducted in support of a bacteria, dissolved oxygen, and stream temperature Total Maximum Daily Load (TMDL) study. The purpose of the TMDL study was to ensure Burnt Bridge Creek attains compliance with water quality standards (Kardouni and Brock, 2008).

Page 7
Sampling Sites
Burnt Bridge Creek Burnt Bridge Creek is a highly modified, urban stream that flows westward 12.6 miles from its agricultural headwaters to the east, through the heart of Vancouver, Washington, to its terminus at Vancouver Lake. Burnt Bridge Creek’s watershed is approximately 27 square miles (PBS, 2006). The Burnt Bridge Creek basin is located in the Salmon-Washougal Water Resource Inventory Area (WRIA 28, Figure 1).
Figure 1: Salmon-Washougal Water Resource Inventory Area (WRIA 28).
The streamflow assessment took place from May 2008 to November 2009. The study consisted of three sites (Figure 2): • Site 1: Burnt Bridge Creek at NE 2nd Avenue (site ID 28C080), located 1.2 miles upstream
of Vancouver Lake at the 2nd Avenue bridge.
• Site 2: Burnt Bridge Creek at Vancouver (site ID 28C110), located at river mile 7.4 at the Burton Road bridge.
• Site 3: Burnt Bridge Creek at Kevanna Park (site ID 28C150), located at river mile 9.2 at the NE 110th Avenue bridge.
Page 8
Figure 2: Burnt Bridge Creek study area.

Page 9
Methods All three gaging sites were equipped with a submersible pressure transducer and data logger that recorded water surface elevation (stage height) and water temperature at 15-minute intervals throughout the 2008-09 study period. At all three study sites, between 15 and 17 streamflow measurements were taken to establish a discharge-rating curve, which plots the stage-discharge relationship. These rating curves were then used to predict average daily flow for Site 1 and 2. An accurate stage-discharge relationship could not be established at Site 3 due to extremely poor hydraulic site characteristics. Flow data from Site 1 were used to estimate continuous flow for Site 3.
Streamflow Measurements Ecology took flow measurements at all three sites using one of three methods: acoustic Doppler current profiler (ADCP), acoustic Doppler velocimeter (ADV), or a mechanical current meter. Appendix B provides a table detailing the measurements and methods used to measure instantaneous flows during each site visit. A majority of the flow measurements taken for this study were made using an ADCP mounted on a durable plastic trimaran vessel. ADCPs use sonar to measure the Doppler shift in acoustic frequency that occurs when sound waves reflect off particles suspended in the water column. The ADCP sends a signal from the surface downward into the water column once per second to determine a continuous profile of depth and velocity across the river channel. Four to eight measurements are made by towing or walking the ADCP vessel across the chosen transect, which must be between one and 15 feet deep and have moderate velocities (less than six feet per second). The result of these transects are then averaged (Shedd et al., 2008). The continuous profiling capability of ADCPs make them an extremely accurate instrument for measuring flow, since water-column velocities and cross-sectional areas are measured more thoroughly than can be done using mechanical current meters. ADCP measurements were used for this study whenever stream conditions permitted. When conditions were not appropriate to use an ADCP, a SonTek FlowTracker acoustic Doppler Velocimeter (ADV) was used. An ADV is a side-looking sonar sensor that is mounted on a top-set wading rod, similar to a mechanical current meter (Burks, 2009). Velocity measurements are taken at fixed points along a cross-section, and flow is calculated using the mid-section method (Shedd, 2009). Velocity measurements were taken at 60% of the stream depth when the total stream depth was less than 1.5 feet, and at 20% and 80% of the stream depth when the total depth was greater than 1.5 feet. In general, the cross-sections were divided so that no more than 10% of the total flow passed through any single cell. The width of the individual cells varied in keeping with the 10% streamflow criteria (Shedd, 2009).

Page 10
A small number of measurements were taken using mechanical meters. Ecology did flow measurements using mechanical current meters following the USGS mid-section method (Rantz et al., 1982a, 1982b). Ecology has made minor modifications to the USGS method to accommodate its measurement equipment (Butkus, 2005; Holt, 2009; Shedd, 2009). The instream velocity measurements were taken using a standard USGS top-set wading rod fitted for Swoffer-type optical sensors and propellers. Streamflow was calculated using the USGS mid-section method with a specialized flow calculation software program developed by Ecology (Butkus, 2005; Shedd, 2009). In general, the cross-sections were divided so that no more than 10% of the total flow passed through any single cell. The width of the individual cells varied in keeping with the 10% streamflow criteria (Shedd, 2009).
Stage-Height Records Continuous stage height was monitored at all three sites using a submersible pressure transducer connected to a data logger, which was calibrated to a primary gage index (PGI). Staff gages were installed as the PGI at all three locations. The stage heights observed from the PGI are used to develop the rating curve and to calibrate the data logger at sites where continuous data are collected (Shedd, 2008). The data loggers at each of the continuous monitoring sites were calibrated to the PGI at the time of installation and were subsequently recalibrated as necessary (Fisher and Holt, 2010; Myers, 2009). Secondary Gage Indexes (SGI) were also installed as a way to verify PGI readings and as a backup in the event of damage or inability to read the PGI. All three sites used tape-down reference points from over-passing bridges as the SGI. Pressure transducers are inherently prone to drift, with the degree varying from instrument to instrument. Drift is essentially a migration of the instrument from its original calibration, and materializes as a difference between observed and logged stage-height values (Freeman et al., 2004). This instrument drift results in erroneous stage-height values that, when applied to the discharge-rating curve for a station, produces erroneous flow values. These erroneous stage-height values are typically corrected by applying time-weighted adjustments to the continuous data set, which pivot on the stage-height values observed on the PGI by field staff. The adjusted stage-height values are then applied to the discharge-rating curve for the site, yielding a more accurate record of flow. The time-weighted adjustments are based on the assumption that instrument drift occurs gradually and evenly over time, which under conditions such as sedimentation and bio-fouling is generally true (Freeman et al., 2004). Occasionally gaps in the continuous stage record can occur. This is often due to equipment or battery failure. Data from a neighboring and similar site are compared to data before and after the data gap to develop a regression equation. Data for the missing period are copied from the neighboring site, run through the regression equation, and applied to the data gap. Time- weighted adjustments to a PGI are then made. In the case of the study sites, all were upstream or downstream of each other increasing the strength of the relationship. The strength of this relationship is due to close proximity, similarities in storm events, and diurnal flow patterns.
Page 11
Error Assessments Error estimates were calculated for each site for the two primary sources of error: pressure-transducer drift and the discharge-rating curve. The error estimates were calculated for each site for the period of record for that site and for the low-flow season separately. In the case of Site 3, due to a rating curve not being viable and a flow record being synthesized, error was calculated by comparing measured and regressed flows. Error introduced by pressure-transducer drift was quantified using the following calculation:
∑−n
obs
obsrec
QQQ
n 1)(1
where: Qrec is the corresponding flow for the recorded stage values. Qobs is the corresponding flow for the observed stage-height values. Error in the discharge-rating curve is quantified using the following calculation:
∑−n
pred
adjpred
QQQ
n 1)(1
where: Qpred is the flow predicted by the rating curve.
Qadj is the measured flow plus or minus the maximum potential error, based on the professional quality rating of each flow measurement. Error due to pressure-transducer drift and error inherent in the discharge-rating curve are mutually exclusive sources of error, and are thus treated as additive.
High-Flow Modeling High-flow conditions and the timing of high-flow events often preclude direct measurement of peak flows at any given station. Wherever feasible, these high flows are modeled using a slope-conveyance model. The slope-conveyance method of high-flow modeling is based on Manning’s velocity equation:
2/13/249.1 S
PA
nV
=

Page 12
where: V is average velocity across a given river cross-section in ft/sec. n is Manning’s roughness coefficient. A is the area of a given river cross-section in ft2. P is the wetted perimeter of a given river cross-section in ft. S is the energy slope of a given river segment. Existing high-flow measurements, in conjunction with cross-sectional and longitudinal surveys, are used to determine Manning’s roughness coefficient (n) and energy slope (S) for those measurements. In cases where survey results do not give an acceptable Manning’s roughness coefficient value, as was the case at Site 2, estimations are made considering streambed composition and the equation: n=(nb +n1 +n2 +n3 +n4)m where: nb is a base value of n for a straight, uniform, smooth channel in natural materials. n1 is a correction factor for the effect of surface irregularities. n2 is a value for variations in shape and size of the channel cross-section. n3 is a value for obstructions. n4 is a value for vegetation and flow conditions. m is a correction factor for meandering of the channel. These results can then be extrapolated to determine flow at stages above the measured range for a station. The extrapolated results are then calibrated to measured flows using linear regression. Modeled high flows are considered estimates of actual flow. For each model, potential error is calculated as the average difference between measured flow and calibrated modeled flow.

Page 13
Quality Assurance Quality assurance measures were taken during this study to address (1) error in stage-height record produced by the data logger at the continuous monitoring sites and (2) error inherent in the instream flow measurements at each site.
Stage-Height Records Based on manufacturer specifications, the theoretical precision of the pressure transducers is less than or equal to 0.02% of the full-scale output. For the transducers used by Ecology, this precision is considered linear from 0 to 15 pounds per square inch (psi), or 0 to 34.6 feet of water (Fletcher, 1994).
During the study period, the accuracy of pressure transducers at each site was addressed by using the PGI versus pressure-transducer regressions. The correlation coefficients (r) values for the regression of raw pressure-transducer readings against the final data set, which had been adjusted to the discrete observed stage-height values, had values ranging from 0.698 to 0.998. Further discussion of error calculated at each site is provided in the Results section. This correlation provides an indication of the severity of pressure-transducer drift (discussed in the Methods section) at each site.
Streamflow Measurements Because the largest potential source of error in a flow measurement is in the velocity measurement, site selection and equipment calibration are of high importance. In this study, the measured cross-sections were qualitatively rated from excellent to poor, based on physical conditions encountered during each measurement.
• An excellent cross-section, which lies in a straight channel segment with laminar flow and fairly fine-grained substrate, assumes an error of up to 2%.
• A good cross-section, which generally lies in a straight channel segment with predominantly laminar flow and courser-grained substrate, assumes an error of up to 5%.
• A fair cross-section, which may contain sections of angular flow, turbulence, or near-bank eddies, assumes an error of up to 8%.
• A poor cross-section, which lies in proximity to bends in the stream channel with predominantly turbulent flow and cobble or boulder substrate, assumes an error of over 8%.
Depending on the selected cross-section, a minimum of the assigned error is assumed and carried forward to the final flow calculation and rating curve development.
An additional source of error in velocity measurements made with mechanical current meters is the calibration of the Swoffer instruments. The ideal calibration setting of a Swoffer propeller is 186, which means that for every 186 revolutions of the propeller, 10 lineal feet of water has

Page 14
passed the measurement point. The Swoffer meters tend to be temperature sensitive, and the calibration setting of a meter can change over the course of a flow measurement. The calibration setting for the Swoffer meter used during this project was checked before and after each flow measurement, with values ranging from 187 to 188. A calibration value of 187 and 188 underestimates the flow measurement by 0.5% and 1.0% respectively.
A discharge-rating curve was established for Sites 1 and 2. Flow measurements were tracked by comparing the measured flow values to the flow values predicted by the rating curve at the same stage. Measured and predicted flow differences for individual flow measurements ranged from 0.5% to 15%. This range of differences between measured and predicted flow demonstrates the ability of the rating curves to predict streamflow at each site.
The measurements taken at Site 3 were not compared to a rating curve due to the poor stage-discharge relationship. These flows were compared to a synthesized flow record where the range between measured and predicted flow ranged from 0% to 40%, with an outlier of 300% that was the lowest measured flow at 0.4 cfs.
Page 15
Results
Site 1: Burnt Bridge Creek at 2nd Avenue (28C080) The average daily streamflow for Site 1 ranged from 2.5 cubic feet per second (cfs) in early August 2009, to 102.0 cfs in early January 2009. Peak flow during the study was 163.0 cfs during a rain event in early January 2009 (Figure 3). Daily flow averages are presented in Appendix A, Table A-1. The measured range of flow for this site encompassed 38% of the range of flow encountered, with flow measurements ranging from 3.7 to 73 cfs (Figure 4). However, flows exceeded the measured range only 5% of the time during the study. 4% of flows were less than the lowest measured flow, and 1% of flows were higher than the highest measured flow (Figure 5). The flow measurements taken at this site are listed in Appendix B, Table B-1. Within the measured range of flows, the fit of the rating curve was fair. Twenty-one flow measurements taken at Site 1 were used to develop the rating curve. Eleven of these measurements were within 5% of the flow predicted by the rating curve, five were within 10%, and all were within 15%. Flows greater than 73 cfs were modeled using a slope-conveyance model. The average percent error between modeled and scaled flow, which reflects model confidence, is 3.1%. Time-weighted adjustments were performed on the continuous data to correct for pressure-transducer drift. A linear regression of pre- versus post-adjusted continuous flow data showed a correlation coefficient (r) of 0.992 and a standard error of 1.3 cfs (12% of the mean flow for the study). This regression indicates slightly moderate and somewhat variable pressure-transducer drift at this site (Figure 6). The total potential error for calculated flow data at this site is ±18.5%. Of this, 5.7% of the potential error is from the continuous stage data, and 12.8% is from the rating curve. During the low-flow period (July through September), the potential error for flow data for this site is calculated to be ±19.1%. Of this, 4.7% of the potential error is from the continuous stage data, and 14.4% is from the rating curve.

Page 16
Figure 3: Streamflow hydrograph for Site 1.
Figure 4: Discharge-rating curve for Site 1.

Page 17
Figure 5: Streamflow exceedance graph for Site 1.
Figure 6: Linear regression of pre- versus post-adjusted streamflow data for Site 1. Deviations from the red regression line indicate pressure-transducer drift.
Raw
Dis
char
ge (c
fs)
Corr. Discharge (cfs)

Page 18
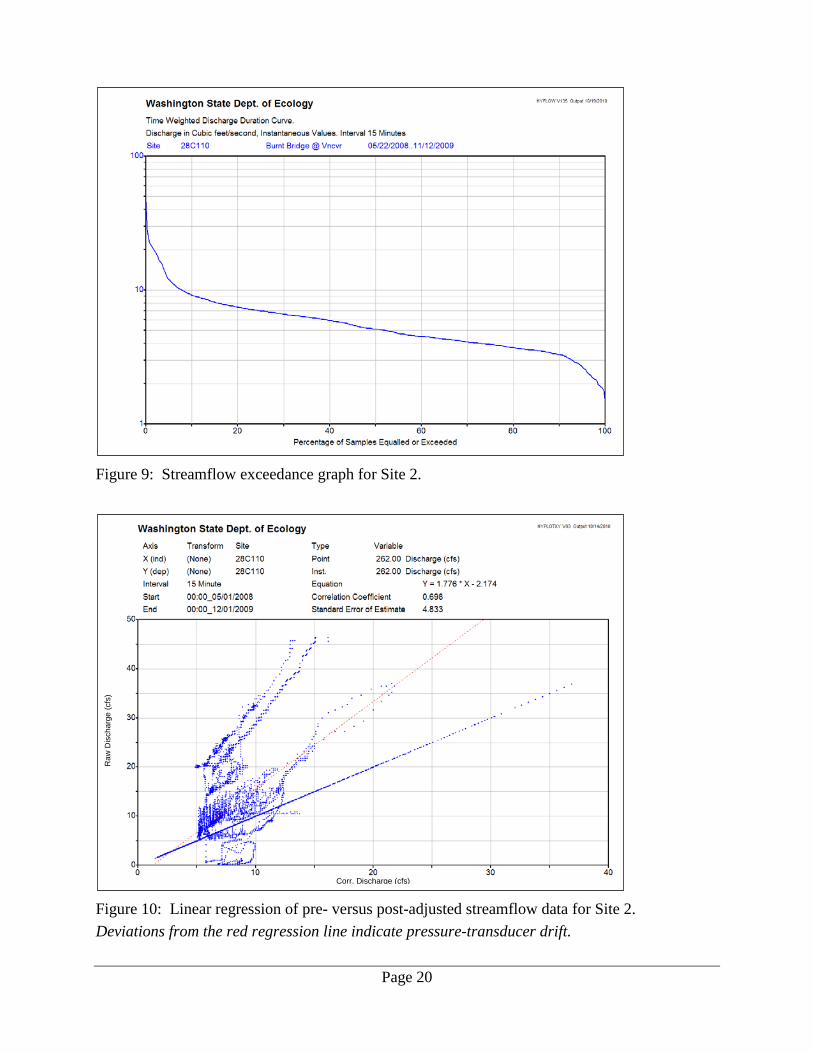
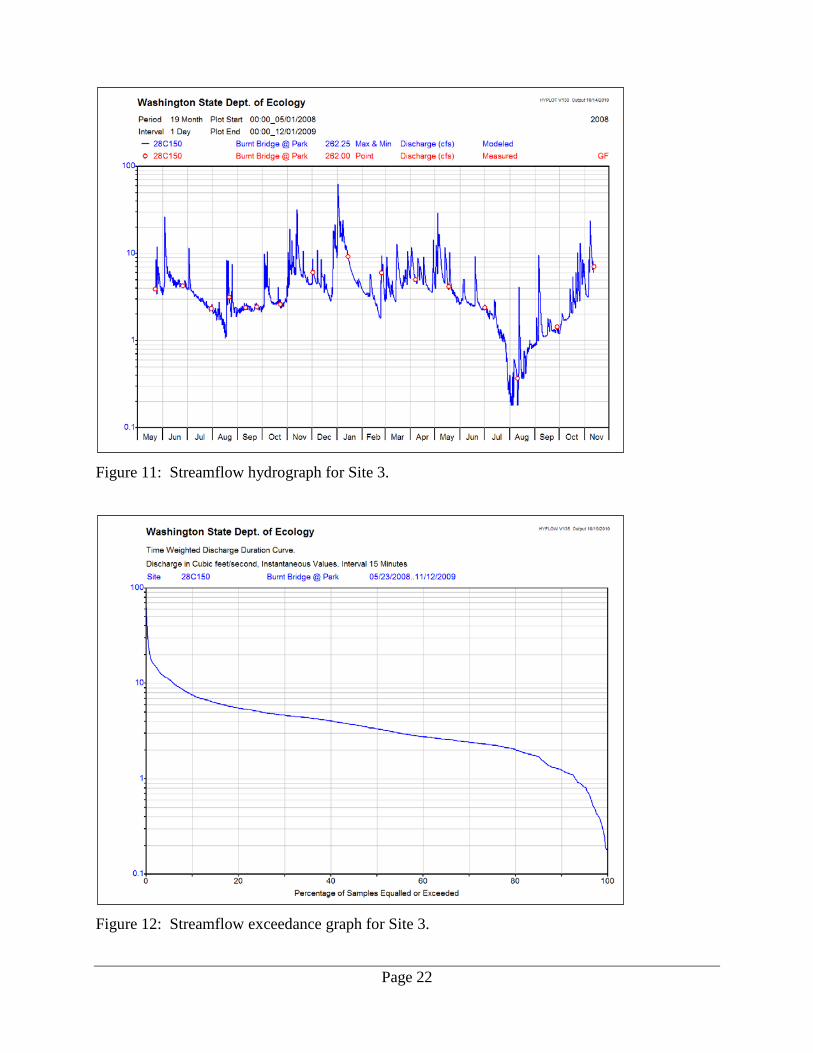
Site 2: Burnt Bridge Creek at Vancouver (28C110) The average daily streamflow for Site 2 ranged from 1.8 cfs in early August 2009, to 28.9 cfs in early January 2009. Peak flow during the study was 45.5 cfs during a rain event in early January 2009 (Figure 7). The day with the highest average daily and peak flow is qualified as an unreliable estimate due to a large difference between raw and adjusted flows. Therefore this site’s record does not coincide with the highest average daily and peak flow at Sites 1 and 2. Daily flow averages are presented in Appendix A, Table A-2. The measured range of flow for this site encompassed 25% of the range of flow encountered, with flow measurements ranging from 2.2 to 13 cfs (Figure 8). Flows exceeded the measured range 8% of the time during the study. 3% of flows were less than the lowest measured flow, and 5% of flows were higher than the highest measured flow (Figure 9). The flow measurements taken at this site are listed in Appendix B, Table B-2. Within the measured range of flows, the fit of the rating curve was fair. All 15 flow measurements taken at Site 2 were used to develop the rating curve. Seven of these measurements were within 5% of the flow predicted by the rating curve, seven were within 10%, and all were within 15%. Flows greater than 13.3 cfs were modeled using a slope-conveyance model. The average percent error between modeled and scaled flow, which reflects model confidence, is 7%. Time-weighted adjustments were performed on the continuous data to correct for pressure-transducer drift. A linear regression of pre- versus post-adjusted continuous flow data showed a correlation coefficient (r) of 0.698 and a standard error of 4.83 cfs (16% of the mean flow for the study). This regression indicates extreme and erratic pressure-transducer drift at this site (Figure 10). A large portion of data from December 14, 2008 to June 3, 2009 was replaced with data regressed from Site 1 due to equipment failure (r2=0.814). The total potential error during the period of record for calculated flow data at this site is ±51.7%. Of this, 41.5% of the potential error is from the continuous stage data, and 10.2% is from the rating curve. During the low-flow period (July through September), the potential error for flow data for this site is calculated to be ±40.2%. Of this, 30.5% of the potential error is from the continuous stage data, and 9.7% is from the rating curve.

Page 19
Figure 7: Streamflow hydrograph for Site 2.
Figure 8: Discharge-rating curve for Site 2.
Page 20
Figure 9: Streamflow exceedance graph for Site 2.
Figure 10: Linear regression of pre- versus post-adjusted streamflow data for Site 2. Deviations from the red regression line indicate pressure-transducer drift.
Raw
Dis
char
ge (c
fs)
Corr. Discharge (cfs)

Page 21
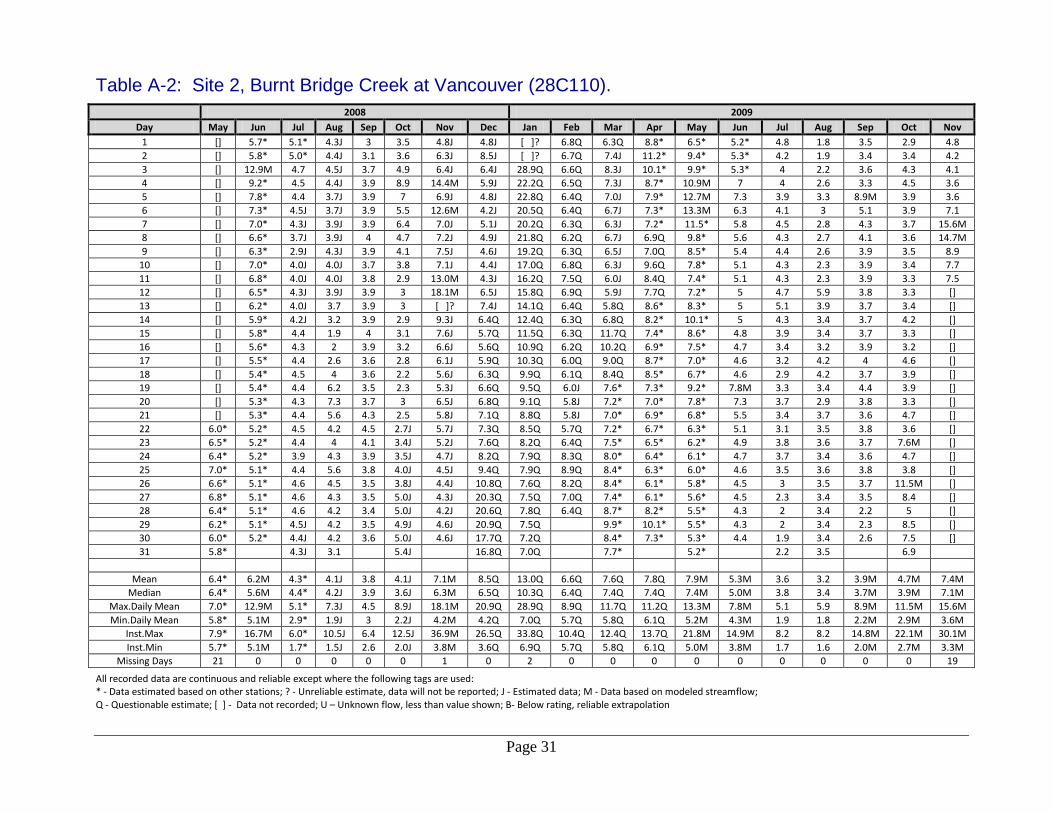
Site 3: Burnt Bridge Creek at Kevanna Park (28C150) Due to extremely poor site conditions and stage-discharge relationship, a rating for this site was not feasible. A flow record was synthesized by using stage data from Site 1. The stage data for Site 1 were converted to a continuous flow record. The flow record was regressed against the flow measurements taken at Site 3 (r2=0.953). This regression was applied to the flow record, and time-weighted adjustments were then made to adjust to the measured flows. Sixteen flow measurements were taken at Site 3. The average daily flow for Site 3 ranged from 0.2 cfs in early August 2009, to 45.2 cfs in early January 2009. Peak flow during the study was 62.9 cfs during a rain event in early January 2009 (Figure 11). Daily flow averages are presented in Appendix A, Table A-3. The measured range of flow for this site encompassed 11% of the range of flow encountered, with flow measurements ranging from 0.37 to 7.1 cfs (Figure 11). Flows exceeded the measured range 12% of the time during the study. 1% of flows were less than the lowest measured flow, and 11% of flows were higher than the highest measured flow (Figure 12). The flow measurements taken at this site are listed in Appendix B, Table B-3. Although the continuous stage record was not used to predict flow, it was kept for reference purposes. A linear regression of pre- versus post-adjusted continuous stage data showed a correlation coefficient (r) of 0.998 and a standard error of 0.03 ft. This regression indicates minor and consistent pressure-transducer drift at this site. (Figure 13) The average potential error for calculated flow data at this site is ±45.1%. The potential error was calculated by comparing the difference between the regressed flow record and the adjusted regressed flow record; the potential measurement error was included. During the low-flow period (July through September), the potential error for flow data for this site is calculated to be ±68.7%.
Page 22
Figure 11: Streamflow hydrograph for Site 3.
Figure 12: Streamflow exceedance graph for Site 3.

Page 23
Figure 13: Linear regression of pre- versus post-adjusted stage data for Site 3. Deviations from the red regression line indicate pressure-transducer drift.
Corrected Stage
Raw
Sta
ge

Page 24
This page is purposely left blank

Page 25
References Burks, T., 2009. Standard Operating Procedure for Operation of the SonTek® FlowTracker® Handheld ADV®, Version 1.0. Washington State Department of Ecology, Olympia, WA. SOP No. EAP058. www.ecy.wa.gov/programs/eap/quality.html Butkus, S., 2005. Quality Assurance Monitoring Plan: Streamflow Gaging Network. Washington State Department of Ecology, Olympia, WA. Publication No. 05-03-204. www.ecy.wa.gov/biblio/0503204.html Fisher, D. and Z. Holt, 2010. Standard Operating Procedure for Basic Use and Maintenance of Design Analysis® Data Loggers and Peripheral Equipment, Version 1.0. Washington State Department of Ecology, Olympia, WA. SOP No. EAP072. www.ecy.wa.gov/programs/eap/quality.html Fletcher, T., 1994. Waterlog Model H-310 Owner’s Manual. Revision 2.6. Design Analysis Associates, Logan, UT. Freeman, L.A. et al., 2004. Use of Submersible Pressure Transducers In Water-Resources Investigations. Techniques of Water-Resources Investigations 8-A3, U.S. Geological Survey, Reston, VA. Holt, Z., 2009. Standard Operating Procedure for Operation of Mechanical Velocity Indicators, Version 1.0. Washington State Department of Ecology, Olympia, WA. SOP No. EAP059. www.ecy.wa.gov/programs/eap/quality.html Holt, Z., 2010. Standard Operating Procedure for Measuring Stream Discharge From a Bridge, Version 1.0. Washington State Department of Ecology, Olympia, WA. SOP No. EAP060. www.ecy.wa.gov/programs/eap/quality.html Kardouni, J. and S. Brock, 2008. Quality Assurance Project Plan: Burnt Bridge Creek fecal Coliform Bacteria, Dissolved Oxygen, and Temperature Total Maximum Daily Load, Water Quality Study Design. Washington State Department of Ecology, Olympia, WA. Publication No. 08-03-110. www.ecy.wa.gov/biblio/0803110.html Myers, J., 2009. Standard Operating Procedure for Conducting Stream Hydrology Site Visits, Version 1.0. Washington State Department of Ecology, Olympia, WA. SOP No. EAP057. www.ecy.wa.gov/programs/eap/quality.html PBS, 2006. Water Quality Monitoring Report, Burnt Bridge Creek Vancouver, Washington. Project No. 70215.010. Prepared for the City of Vancouver by PBS. September 2006. Rantz, S.E. et al., 1982a. Measurement and Computation of Streamflow: Volume 1, Measurement of Stage and Discharge. U.S. Geological Survey Water-Supply Paper 2175. U.S. Government Printing Office, Washington D.C.

Page 26
Rantz, S.E. et al., 1982b. Measurement and Computation of Streamflow: Volume 2, Computation of Discharge. U.S. Geological Survey Water-Supply Paper 2175. U.S. Government Printing Office, Washington D.C. Shedd, J., 2008. Standard Operating Procedure for Measuring Gage Height of Streams, Version 1.0. Washington State Department of Ecology, Olympia, WA. SOP No. EAP042. www.ecy.wa.gov/programs/eap/quality.html Shedd, J., 2009. Standard Operating Procedure for Measuring and Calculating Stream Discharge, Version 1.0. Washington State Department of Ecology, Olympia, WA. SOP No. EAP056. www.ecy.wa.gov/programs/eap/quality.html Shedd, J., C. Springer, and C. Clishe, 2008. Standard Operating Procedure (SOP) for Operation of the Teledyne RD Instruments StreamPro® Acoustic Doppler Current Profiler, Version 1.0. Washington State Department of Ecology, Olympia, WA. SOP No. EAP055. www.ecy.wa.gov/programs/eap/quality.html

Page 27
Appendices

Page 28
This page is purposely left blank

Page 29
Appendix A. Average Daily Streamflows for Continuous Monitoring Stations

Page 30
Table A-1: Site 1, Burnt Bridge Creek at 2nd Avenue (28C080).
2008 2009 Day May Jun Jul Aug Sep Oct Nov Dec Jan Feb Mar Apr May Jun Jul Aug Sep
1 [] 8.9 7.2 5.2 5.4 5.3 8.4 8.1 60.4M 13.1 12.6 18.5J 10.2 6.4 6.3 2.8 3.9 2 [] 9.3 7.3 5.2 5.5 5.4 13.6 13.4 117M 12.8 17.1 28.1J 20.7 6.8 6.5 2.5 3.9 3 [] 35.7 13.6 5.4 5.3 10.3 17 11.8 70.0M 12.7 20.4 23.6J 22.5 7.2 5.9 2.6 4.8 4 [] 25.7 8.4 5.5 5.3 12.7 23.6 10.4 46.8 12.4 16.6 18.2J 27.3M 7.7 5.7 2.8 4.3 5 [] 20.7 7.4 5.2 5.2 11.7 15.2 9.4 49.8 12.4 15.5 15.2 34.3 10.9 5.5 3.1 14.2 6 [] 15.4 7.2 4.9 5.3 11.1 23.3 8.7 42.4 12.8 14.1 13.4 36.4 9.8 5.3 3.6 11.9 7 [] 13.7 7 5.5 5.2 12.5 16.1 11.3 42.2 12.7 12.7 12.2 28.7 8 5.7 3.8 8.3 8 [] 12.7 7 5.2 5.3 9.3 17.4 10.4 49.1 12.4 14 11.2Q 21.8 7.3 5.7 3.7 5.9 9 [] 12.8 6.5 5.6 5 8.6 14.3 9.5 40.2 12.9 13.6 11.3Q 16.4 6.9 5.7 3.6 4.8
10 [] 12.3 6.3 5.3 4.8 7.5 13.6 8.7 33.4 14.8 12.8 20.5J 13.9 6.7 5.6 3.2J 4.3 11 [] 12.2 6.5 5.3 5.1 6.9 20.8 8.2 31.3 17.6 11.6 15.9 12.4 6.6 5.3 2.2J 4.1 12 [] 11.3 6.3 5 5 6.3 36.1M 12 30.9 14.9 11 13.7 11.5 6.5 5.5 7.9J 4 13 [] 10.6 6.2 4.9 5 6.2 33.5 12 27.9 13.3 10.2 16.6J 15.7 6.4 7.7 5.2J 3.9 14 [] 9.8 6.1 4.9 5 6.1 26.3 11.9 25.2 12.6 13.6 15.3J 21.9 6.3 6.8 4.0J 3.9 15 [] 9.7 5.9 4.7 5 5.9 20 10.7 22.8 12.6 33.0* 12.5J 15.8 6.5 5.6 3.4J 3.9 16 [] 9.2 5.8 4.4 5 5.9 15.2 9.2 21.1 12.2 26.4J 11.2J 11.9 6.3 5 3.3J 4.2 17 [] 8.9 5.9 4.2 4.8 5.9 12.8 8.9 19.6 11.5 20.7 17.3J 10.5 6.3 4.6 3.3 5 18 [] 8.9 5.8 7.7 4.9 5.9 11.7 8.9 18.5 11.6 17.9 16.4J 9.8 6.2 4.3 3.7 4.4 19 [] 9.2 6.1 12.6 4.8 6 11.3 8.4 17.4 11.3 14.8 12.4 18.5 12 4.1 4 4.7 20 [] 9.3 5.8 14.3 4.7 6.7 15.2 7.8 16.5 10.7 13.3 10.9 13.6 12.5 4.3 3.7 4.8 21 [] 8.9 5.6 9.8 5.1 6.3 12.7 7.4 15.8 10.4 12.4 10.3 10.4 9 4.4 3.4 4.3 22 [] 8.1 5.4 7.9 5.5 6.2 11.6 7.0J 15.4 10.1 12.6 9.9 9.1 7.3 4.3 3.9 4.1 23 13.4 7.9 5.5 6.8 5.7 5.6 10.5 6.5J 14.8 12.8 13.5 9.4 8.7 6.7 4.1 4 4 24 12.2 7.7 5.7 7.8 5.7 5.3 9.5 6.7J 14.3 20.5 14.8 9.2 8.5 6.6 4.4 4 3.9 25 18.5 7.6 5.4 10.5 5.3 5.3 9.2 8.2J 14.7 22.7 16.4J 8.9 8.2 6.1 4.3 4.2 3.9 26 14.8 7.8 5.3 7.4 5.3 5.5 8.8 10.5J 14.3 20.3 16.3J 8.5 7.8 6.1 4 4.2 3.8 27 12.6 8.3 5.2 6.2 5.1 5.3 8.3 38.1J 14.2 15.5 13.1J 8.6 7.2 5.9 3.7 4.1 4.1 28 11.5 8.5 5.2 6.1 5.2 5.7 8.1 36.8J 15.3 13 17.9J 15.5 7.2 5.8 3.1 3.9 4 29 10.2 7.7 5.1 6.1 5.2 6.1 8 37.7J 14.7 22.4J 22.8 7.1 5.8 2.7 3.9 3.7 30 9.7 7.1 5.3 5.4 5 5.9 8.1 28.3J 13.9 16.6J 12.5 6.6 5.9 2.6 3.9 3.6 31 9.2 5.8 5.4 6.9 26.1J 13.4 14.3J 6.5 2.6 3.9
Mean 12.5 11.5 6.4 6.5 5.2 7.1 15.3M 13.3J 30.4M 13.7 15.9* 14.3Q 14.9M 7.3 4.9 3.7J 4.9
Median 12.2 9.2 5.9 5.4 5.1 6.1 13.6M 9.5J 21.1M 12.7 14.3* 13.0Q 11.9M 6.6 5 3.7J 4.1 Max.Daily Mean 18.5 35.7 13.6 14.3 5.7 12.7 36.1M 38.1J 117M 22.7 33.0* 28.1Q 36.4M 12.5 7.7 7.9J 14.2 Min.Daily Mean 9.2 7.1 5.1 4.2 4.7 5.3 8.0M 6.5J 13.4M 10.1 10.2* 8.5Q 6.5M 5.8 2.6 2.2J 3.6
Inst.Max 31.1 67.4 26.4 22.7 6.2 25.8 80.8M 56.5J 163M 29.5 36.0* 37.2Q 74.7M 23.3 8.3 13.1J 25.7 Inst.Min 8.1 6.8 4.7 3.8 4.5 5 6.7M 6.3J 13.3M 10.1 10.0* 8.5Q 6.1M 5.7 2.5 1.8J 3.3
Missing Days 22 0 0 0 0 0 0 0 0 0 0 0 0 0 0 0 0
Recorded data are continuous and reliable except where the following tags are used: * - Data estimated based on other stations; ? – Unreliable estimate, data will not be reported; J – Estimated data; M – Data based on modeled streamflow; Q – Questionable estimate; [ ] – Data not recorded; U – Unknown flow, less than value shown; B - Below rating, reliable extrapolation
Page 31
Table A-2: Site 2, Burnt Bridge Creek at Vancouver (28C110).
2008 2009 Day May Jun Jul Aug Sep Oct Nov Dec Jan Feb Mar Apr May Jun Jul Aug Sep Oct Nov
1 [] 5.7* 5.1* 4.3J 3 3.5 4.8J 4.8J [ ]? 6.8Q 6.3Q 8.8* 6.5* 5.2* 4.8 1.8 3.5 2.9 4.8 2 [] 5.8* 5.0* 4.4J 3.1 3.6 6.3J 8.5J [ ]? 6.7Q 7.4J 11.2* 9.4* 5.3* 4.2 1.9 3.4 3.4 4.2 3 [] 12.9M 4.7 4.5J 3.7 4.9 6.4J 6.4J 28.9Q 6.6Q 8.3J 10.1* 9.9* 5.3* 4 2.2 3.6 4.3 4.1 4 [] 9.2* 4.5 4.4J 3.9 8.9 14.4M 5.9J 22.2Q 6.5Q 7.3J 8.7* 10.9M 7 4 2.6 3.3 4.5 3.6 5 [] 7.8* 4.4 3.7J 3.9 7 6.9J 4.8J 22.8Q 6.4Q 7.0J 7.9* 12.7M 7.3 3.9 3.3 8.9M 3.9 3.6 6 [] 7.3* 4.5J 3.7J 3.9 5.5 12.6M 4.2J 20.5Q 6.4Q 6.7J 7.3* 13.3M 6.3 4.1 3 5.1 3.9 7.1 7 [] 7.0* 4.3J 3.9J 3.9 6.4 7.0J 5.1J 20.2Q 6.3Q 6.3J 7.2* 11.5* 5.8 4.5 2.8 4.3 3.7 15.6M 8 [] 6.6* 3.7J 3.9J 4 4.7 7.2J 4.9J 21.8Q 6.2Q 6.7J 6.9Q 9.8* 5.6 4.3 2.7 4.1 3.6 14.7M 9 [] 6.3* 2.9J 4.3J 3.9 4.1 7.5J 4.6J 19.2Q 6.3Q 6.5J 7.0Q 8.5* 5.4 4.4 2.6 3.9 3.5 8.9
10 [] 7.0* 4.0J 4.0J 3.7 3.8 7.1J 4.4J 17.0Q 6.8Q 6.3J 9.6Q 7.8* 5.1 4.3 2.3 3.9 3.4 7.7 11 [] 6.8* 4.0J 4.0J 3.8 2.9 13.0M 4.3J 16.2Q 7.5Q 6.0J 8.4Q 7.4* 5.1 4.3 2.3 3.9 3.3 7.5 12 [] 6.5* 4.3J 3.9J 3.9 3 18.1M 6.5J 15.8Q 6.9Q 5.9J 7.7Q 7.2* 5 4.7 5.9 3.8 3.3 [] 13 [] 6.2* 4.0J 3.7 3.9 3 [ ]? 7.4J 14.1Q 6.4Q 5.8Q 8.6* 8.3* 5 5.1 3.9 3.7 3.4 [] 14 [] 5.9* 4.2J 3.2 3.9 2.9 9.3J 6.4Q 12.4Q 6.3Q 6.8Q 8.2* 10.1* 5 4.3 3.4 3.7 4.2 [] 15 [] 5.8* 4.4 1.9 4 3.1 7.6J 5.7Q 11.5Q 6.3Q 11.7Q 7.4* 8.6* 4.8 3.9 3.4 3.7 3.3 [] 16 [] 5.6* 4.3 2 3.9 3.2 6.6J 5.6Q 10.9Q 6.2Q 10.2Q 6.9* 7.5* 4.7 3.4 3.2 3.9 3.2 [] 17 [] 5.5* 4.4 2.6 3.6 2.8 6.1J 5.9Q 10.3Q 6.0Q 9.0Q 8.7* 7.0* 4.6 3.2 4.2 4 4.6 [] 18 [] 5.4* 4.5 4 3.6 2.2 5.6J 6.3Q 9.9Q 6.1Q 8.4Q 8.5* 6.7* 4.6 2.9 4.2 3.7 3.9 [] 19 [] 5.4* 4.4 6.2 3.5 2.3 5.3J 6.6Q 9.5Q 6.0J 7.6* 7.3* 9.2* 7.8M 3.3 3.4 4.4 3.9 [] 20 [] 5.3* 4.3 7.3 3.7 3 6.5J 6.8Q 9.1Q 5.8J 7.2* 7.0* 7.8* 7.3 3.7 2.9 3.8 3.3 [] 21 [] 5.3* 4.4 5.6 4.3 2.5 5.8J 7.1Q 8.8Q 5.8J 7.0* 6.9* 6.8* 5.5 3.4 3.7 3.6 4.7 [] 22 6.0* 5.2* 4.5 4.2 4.5 2.7J 5.7J 7.3Q 8.5Q 5.7Q 7.2* 6.7* 6.3* 5.1 3.1 3.5 3.8 3.6 [] 23 6.5* 5.2* 4.4 4 4.1 3.4J 5.2J 7.6Q 8.2Q 6.4Q 7.5* 6.5* 6.2* 4.9 3.8 3.6 3.7 7.6M [] 24 6.4* 5.2* 3.9 4.3 3.9 3.5J 4.7J 8.2Q 7.9Q 8.3Q 8.0* 6.4* 6.1* 4.7 3.7 3.4 3.6 4.7 [] 25 7.0* 5.1* 4.4 5.6 3.8 4.0J 4.5J 9.4Q 7.9Q 8.9Q 8.4* 6.3* 6.0* 4.6 3.5 3.6 3.8 3.8 [] 26 6.6* 5.1* 4.6 4.5 3.5 3.8J 4.4J 10.8Q 7.6Q 8.2Q 8.4* 6.1* 5.8* 4.5 3 3.5 3.7 11.5M [] 27 6.8* 5.1* 4.6 4.3 3.5 5.0J 4.3J 20.3Q 7.5Q 7.0Q 7.4* 6.1* 5.6* 4.5 2.3 3.4 3.5 8.4 [] 28 6.4* 5.1* 4.6 4.2 3.4 5.0J 4.2J 20.6Q 7.8Q 6.4Q 8.7* 8.2* 5.5* 4.3 2 3.4 2.2 5 [] 29 6.2* 5.1* 4.5J 4.2 3.5 4.9J 4.6J 20.9Q 7.5Q 9.9* 10.1* 5.5* 4.3 2 3.4 2.3 8.5 [] 30 6.0* 5.2* 4.4J 4.2 3.6 5.0J 4.6J 17.7Q 7.2Q 8.4* 7.3* 5.3* 4.4 1.9 3.4 2.6 7.5 [] 31 5.8* 4.3J 3.1 5.4J 16.8Q 7.0Q 7.7* 5.2* 2.2 3.5 6.9
Mean 6.4* 6.2M 4.3* 4.1J 3.8 4.1J 7.1M 8.5Q 13.0Q 6.6Q 7.6Q 7.8Q 7.9M 5.3M 3.6 3.2 3.9M 4.7M 7.4M Median 6.4* 5.6M 4.4* 4.2J 3.9 3.6J 6.3M 6.5Q 10.3Q 6.4Q 7.4Q 7.4Q 7.4M 5.0M 3.8 3.4 3.7M 3.9M 7.1M
Max.Daily Mean 7.0* 12.9M 5.1* 7.3J 4.5 8.9J 18.1M 20.9Q 28.9Q 8.9Q 11.7Q 11.2Q 13.3M 7.8M 5.1 5.9 8.9M 11.5M 15.6M Min.Daily Mean 5.8* 5.1M 2.9* 1.9J 3 2.2J 4.2M 4.2Q 7.0Q 5.7Q 5.8Q 6.1Q 5.2M 4.3M 1.9 1.8 2.2M 2.9M 3.6M
Inst.Max 7.9* 16.7M 6.0* 10.5J 6.4 12.5J 36.9M 26.5Q 33.8Q 10.4Q 12.4Q 13.7Q 21.8M 14.9M 8.2 8.2 14.8M 22.1M 30.1M Inst.Min 5.7* 5.1M 1.7* 1.5J 2.6 2.0J 3.8M 3.6Q 6.9Q 5.7Q 5.8Q 6.1Q 5.0M 3.8M 1.7 1.6 2.0M 2.7M 3.3M
Missing Days 21 0 0 0 0 0 1 0 2 0 0 0 0 0 0 0 0 0 19
All recorded data are continuous and reliable except where the following tags are used: * - Data estimated based on other stations; ? - Unreliable estimate, data will not be reported; J - Estimated data; M - Data based on modeled streamflow;
Q - Questionable estimate; [ ] - Data not recorded; U – Unknown flow, less than value shown; B- Below rating, reliable extrapolation

Page 32
Table A-3: Site 3, Burnt Bridge Creek at Kevanna Park (28C150).
2008 2009 Day May Jun Jul Aug Sep Oct Nov Dec Jan Feb Mar Apr May Jun Jul Aug Sep Oct Nov
1 [] 3.7* 4.0* 2.2* 2.1* 2.4* 3.9* 4.6* 23.1* 3.8* 3.0* 7.1* 4.2* 2.7* 2.5* 0.3* 0.9* 1.3* 4.5* 2 [] 3.9* 3.9* 2.1* 2.2* 2.4* 5.9* 6.6* 45.2* 3.6* 4.8* 11.1* 8.3* 2.9* 2.5* 0.2U 0.9* 1.4* 3.6* 3 [] 14.0* 6.4* 2.2* 2.2* 4.3* 7.2* 5.9* 26.7* 3.6* 6.2* 9.3* 9.1* 3.0* 2.3* 0.2U 1.3* 1.6* 3.3* 4 [] 10.5* 4.3* 2.2* 2.3* 5.3* 9.7* 5.4* 17.4* 3.4* 4.7* 7.1* 10.8* 3.2* 2.2* 0.3U 1.1* 1.9* 3.3* 5 [] 8.5* 3.9* 2.0* 2.3* 4.9* 6.6* 4.9* 18.5* 3.4* 4.4* 6.0* 13.4* 4.4* 2.1* 0.3* 5.0* 1.8* 3.2* 6 [] 6.4* 3.8* 1.9* 2.3* 4.6* 9.8* 4.6* 15.8* 3.5* 3.9* 5.4* 14.2* 4.0* 2.0* 0.5* 4.1* 1.7* 6.9* 7 [] 5.8* 3.7* 2.1* 2.4* 5.2* 7.0* 5.6* 15.7* 3.4* 3.4* 5.0* 11.6* 3.3* 2.1* 0.6* 2.7* 1.7* 13.2* 8 [] 5.5* 3.6* 1.9* 2.5* 3.9* 7.5* 5.2* 18.2* 3.3* 4.0* 4.6Q 8.8* 3.0* 2.1* 0.5* 1.8* 1.8* 14.4* 9 [] 5.6* 3.4* 2.0* 2.4* 3.7* 6.4* 4.8* 14.8* 3.4* 3.9* 4.6Q 6.6* 2.8* 2.0* 0.4* 1.4* 1.7* 10.1*
10 [] 5.4* 3.3* 1.9* 2.4* 3.2* 6.1* 4.4* 12.4* 4.1* 3.6* 8.2* 5.7* 2.8* 2.0* 0.3U 1.2* 1.8* 7.4* 11 [] 5.4* 3.4* 1.9* 2.5* 3.0* 8.9* 4.2* 11.7* 5.1* 3.2* 6.4* 5.1* 2.7* 1.8* 0.2U 1.1* 1.8* 7.0* 12 [] 5.1* 3.3* 1.7* 2.4* 2.8* 14.8* 5.6* 11.5* 4.1* 3.0* 5.6* 4.8* 2.7* 1.9* 2.1* 1.1* 1.9* [] 13 [] 4.9* 3.2* 1.6* 2.4* 2.8* 13.9* 5.6* 10.5* 3.4* 2.8* 6.7* 6.4* 2.6* 2.7* 1.1* 1.1* 2.0* [] 14 [] 4.6* 3.1* 1.6* 2.4* 2.7* 11.4* 5.5* 9.3* 3.1* 4.2* 6.2* 8.8* 2.6* 2.3* 0.7* 1.1* 3.2* [] 15 [] 4.6* 3.0* 1.5* 2.4* 2.7* 8.7* 5.0* 8.3* 3.1* 11.7* 5.1* 6.4* 2.7* 1.9* 0.4* 1.1* 2.5* [] 16 [] 4.5* 2.9* 1.3* 2.4* 2.7* 6.9* 4.3* 7.5* 2.9* 9.4* 4.6* 4.9* 2.6* 1.6* 0.4* 1.3* 2.1* [] 17 [] 4.4* 2.9* 1.2* 2.3* 2.7* 6.0* 4.2* 6.9* 2.6* 7.1* 7.0* 4.4* 2.6* 1.4* 0.4* 1.6* 3.2* [] 18 [] 4.5* 2.9* 2.5* 2.3* 2.7* 5.6* 4.1* 6.4* 2.6* 6.0* 6.6* 4.1* 2.5* 1.3* 0.6* 1.4* 3.3* [] 19 [] 4.6* 2.9* 4.4* 2.3* 2.7* 5.5* 3.9* 5.9* 2.4* 4.9* 5.1* 7.5* 4.8* 1.2* 0.7* 1.5* 2.8* [] 20 [] 4.7* 2.8* 5.0* 2.2* 3.0* 7.0* 3.6* 5.6* 2.1* 4.4* 4.5* 5.5* 4.9* 1.2* 0.6* 1.6* 2.6* [] 21 [] 4.6* 2.7* 3.2* 2.3* 2.8* 6.1* 3.4* 5.3* 2.0* 4.1* 4.3* 4.3* 3.6* 1.2* 0.5* 1.4* 4.1* [] 22 [] 4.3* 2.6* 2.6* 2.5* 2.8* 5.7* 3.2* 5.0* 1.8* 4.2* 4.1* 3.8* 2.9* 1.1* 0.7* 1.3* 3.4* [] 23 5.0* 4.3* 2.6* 2.2* 2.5* 2.6* 5.3* 2.9* 4.8* 2.8* 4.6* 3.9* 3.6* 2.7* 1.0* 0.8* 1.3* 5.8* [] 24 4.6* 4.3* 2.6* 2.6* 2.5* 2.5* 4.9* 3.0* 4.6* 5.8* 5.2* 3.8* 3.5* 2.6* 1.2* 0.8* 1.3* 4.7* [] 25 7.1* 4.3* 2.5* 3.7* 2.4* 2.5* 4.8* 3.5* 4.7* 6.8* 5.9* 3.7* 3.4* 2.5* 1.1* 0.9* 1.3* 3.2* [] 26 5.7* 4.3* 2.4* 2.6* 2.4* 2.6* 4.7* 4.4* 4.5* 5.8* 5.9* 3.6* 3.3* 2.4* 1* 0.9* 1.3* 7.7* [] 27 4.9* 4.5* 2.4* 2.2* 2.3* 2.6* 4.5* 14.7* 4.4* 4.0* 4.7* 3.6* 3.0* 2.3* 0.8* 0.9* 1.4* 8.1* [] 28 4.5* 4.5* 2.4* 2.2* 2.3* 2.7* 4.5* 14.2* 4.8* 3.1* 6.7* 6.3* 3.0* 2.3* 0.6* 0.8* 1.4* 5.2* [] 29 4.0* 4.2* 2.3* 2.2* 2.3* 2.9* 4.4* 14.5* 4.5* 8.5* 9.1* 3.0* 2.3* 0.4* 0.8* 1.3* 6.6* [] 30 3.9* 3.9* 2.3* 2.0* 2.3* 2.9* 4.5* 11.3* 4.2* 6.2* 5.1* 2.8* 2.3* 0.3B 0.9* 1.3* 6.2* [] 31 3.8* 2.4* 2.1* 3.3* 10.3* 4.0* 5.4* 2.7* 0.3B 0.9* 6.2*
Mean 4.8* 5.3* 3.2* 2.3* 2.3* 3.2* 6.9* 5.9* 11.0* 3.5* 5.2* 5.8Q 6.0* 3.0* 1.5* 0.6U 1.5* 3.3* 7.0* Median 4.6* 4.6* 2.9* 2.1* 2.3* 2.8* 6.1* 4.8* 7.5* 3.4* 4.7* 5.3Q 4.9* 2.7* 1.6* 0.6U 1.3* 2.6* 6.9*
Max.Daily Mean 7.1* 14.0* 6.4* 5.0* 2.5* 5.3* 14.8* 14.7* 45.2* 6.8* 11.7* 11.1Q 14.2* 4.9* 2.7* 2.1U 5.0* 8.1* 14.4* Min.Daily Mean 3.8* 3.7* 2.3* 1.2* 2.1* 2.4* 3.9* 2.9* 4.0* 1.8* 2.8* 3.6Q 2.7* 2.3* 0.3* 0.2U 0.9* 1.3* 3.2*
Inst.Max 12.0* 26.1* 11.6* 8.3* 2.7* 10.5* 32.1* 21.4* 62.9* 9.4* 12.7* 14.4Q 29.1* 9.2* 3.0* 4.1U 9.6* 13.1* 23.7* Inst.Min 3.3* 3.4* 2.1* 1.1* 2.1* 2.3* 3.2* 2.8* 3.9* 1.8* 2.8* 3.6Q 2.6* 2.3* 0.2* 0.2U 0.9* 1.2* 3.1*
Missing Days 22 0 0 0 0 0 0 0 0 0 0 0 0 0 0 0 0 0 19
All recorded data are continuous and reliable except where the following tags are use: * - Data estimated based on other stations; ? – Unreliable estimate, data will not be reported; J – Estimated data; M – Data based on modeled streamflow; Q – Questionable estimate; [ ] – Data not recorded; U – Unknown flow, less than value shown; B - Below rating, reliable extrapolation.

Page 33
Appendix B. Discrete Streamflow Measurements Table B-1: Site 1, Burnt Bridge Creek at 2nd Avenue (28C080).
Date Time Stage (ft)
Flow (cfs)
Area (ft2)
Velocity (ft/sec.) Method Quality** %
Deviation 05/21/2008 1345 5.03 11.3 16.77 0.7 Current meter Good 4.7% 06/25/2008 1202 4.92 9.0 16.21 0.6 Current meter Fair 15.1% 07/30/2008 1025 4.82 5.2 14.78 0.4 ADCP Poor 5.3% 08/21/2008 838 5.00 12.3 16.74 0.7 ADCP Good 13.0% 09/10/2008 1220 4.80 5.2 13.70 0.4 ADCP Poor 2.3% 09/24/2008 1415 4.84 5.9 13.90 0.4 ADCP Poor 1.9% 10/23/2008 1202 4.82 4.9 13.49 0.4 ADCP Poor 10.5% 12/02/2008 1243 5.03 11.4 16.53 0.4 ADCP Good 5.3% 01/14/2009 1339 5.28 25.9 22.45 1.2 ADCP Poor 2.7% 02/24/2009 1445 5.18 19.9 23.24 0.9 ADCP Fair 2.9% 03/16/2009 906 5.31 27.7 22.90 1.2 ADCP Good 2.6% 04/07/2009 1200 5.04 11.0 18.21 0.6 ADCP Fair 11.9% 04/20/2009 1350 5.00 11.3 17.30 0.7 ADCP Fair 3.8% 05/18/2009 1340 4.98 10.6 17.60 0.6 ADCP Fair 4.7% 07/01/2009 1156 4.87 5.6 15.20 0.4 ADV Good 13.6% 08/10/2009 1142 4.71 3.7 13.67 0.3 ADV Good 6.1% 09/28/2009 1336 4.75 4.5 14.13 0.3 ADV Good 9.2% 11/12/2009 1310 5.07 13.1 17.72 0.7 ADCP Fair 5.1% 12/16/2009 1218 5.87 73.0 40.73 1.9 ADCP Poor 0.4% 01/28/2010 1022 5.26 24.6 22.37 1.1 ADCP Good 4.0% 01/28/2010 1045 5.26 24.4 22.37 1.1 ADCP Good 3.2%
*Quality ratings of measurements are discussed in the Quality Assurance section.
Table B-2: Site 2, Burnt Bridge at Vancouver (28C110).
Date Time Stage (ft)
Flow (cfs)
Area (ft2)
Velocity (ft/sec.) Method Quality** %
Deviation 07/02/2008 1500 4.38 5.3 4.3 1.22 Current meter Good 4.9% 07/30/2008 1343 4.34 4.4 4.3 1.04 ADV Good 2.7% 08/21/2008 1017 4.43 6.5 5.0 1.31 ADV Good 5.9% 09/10/2008 1033 4.31 4.0 3.9 1.05 ADV Fair 9.6% 09/24/2008 1144 4.32 3.7 3.5 1.05 ADV Fair 3.1% 10/23/2008 1013 4.30 3.5 4.0 0.87 ADV Good 4.1% 12/02/2008 1129 4.53 8.5 6.0 1.41 ADV Good 2.7% 01/14/2009 1204 4.65 13.3 7.6 1.74 ADV Good 6.9% 02/24/2009 1156 4.51 8.7 5.9 1.48 ADV Good 7.2% 04/07/2009 1017 4.48 6.9 5.5 1.24 ADV Good 7.3% 05/18/2009 1148 4.46 6.4 5.9 1.09 ADV Good 7.5% 07/01/2009 1014 4.37 4.5 4.5 1.01 ADV Good 7.1% 08/10/2009 953 4.25 2.2 3.7 0.60 ADV Good 6.2% 09/28/2009 1118 4.24 2.2 3.5 0.64 ADV Good 3.3% 11/12/2009 1111 4.54 8.4 6.6 1.26 ADV Good 6.7%
*Quality ratings of measurements are discussed in the Quality Assurance section.

Page 34
Table B-3: Site 3, Burnt Bridge Creek at Kevanna Park (28C150). Date Time Stage
(ft) Flow (cfs)
Area (ft2)
Velocity (ft/sec.) Method Quality** %
Deviation 05/22/2008 1205 4.79 3.9 18.6 0.21 Current meter Poor N/A* 06/25/2008 910 4.66 4.3 15.9 0.27 ADCP Poor N/A* 07/30/2008 840 4.48 2.3 14.4 0.16 ADCP Poor N/A* 08/21/2008 1126 4.72 3.2 17.1 0.19 ADCP Poor N/A* 09/10/2008 857 4.35 2.4 13.0 0.19 ADCP Good N/A* 09/24/2008 941 4.31 2.5 13.0 0.19 ADCP Poor N/A* 10/23/2008 905 4.20 2.6 11.3 0.23 ADCP Poor N/A* 12/02/2008 1011 4.66 6.1 17.7 0.34 ADCP Good N/A* 01/14/2009 1100 5.08 9.3 21.9 0.43 ADCP Poor N/A* 02/24/2009 1030 4.52 6.0 13.2 0.46 ADCP Estimate N/A* 04/07/2009 850 4.48 5.1 13.5 0.37 ADCP Poor N/A* 05/18/2009 950 4.62 4.2 16.5 0.25 ADCP Estimate N/A* 07/01/2009 859 4.34 2.4 14.3 0.17 ADV Good N/A* 08/10/2009 834 3.80 0.4 7.6 0.05 ADV Poor N/A* 09/28/2009 953 4.03 1.4 10.6 0.14 ADV Poor N/A* 11/12/2009 926 5.06 7.1 24.3 0.29 ADCP Poor N/A*
* No % Deviation calculated due to lack of rating. **Quality ratings of measurements are discussed in the Quality Assurance section.

Page 35
Appendix C. Glossary, Acronyms, and Abbreviations Glossary 303(d) list: Section 303(d) of the federal Clean Water Act requires Washington State to periodically prepare a list of all surface waters in the state for which designated uses of the water – such as for drinking, recreation, aquatic habitat, and industrial use – are impaired by pollutants. These are water quality limited estuaries, lakes, and streams that fall short of state surface water quality standards, and are not expected to improve within the next two years.
Clean Water Act: A federal act passed in 1972 that contains provisions to restore and maintain the quality of the nation’s waters. Section 303(d) of the Clean Water Act establishes the TMDL program.
Discharge: The rate of streamflow at a given instant in terms of volume per unit of time, typically cubic feet per second.
Discharge-rating curve: A mathematical model relating water surface elevation, or stage, to discharge at a given point on a river or stream. Stage and discharge typically form a logarithmic relationship.
Diurnal: Pertaining to the day or each day; daily.
Load allocation: The portion of a receiving waters’ loading capacity attributed to one or more of its existing or future sources of nonpoint pollution or to natural background sources.
Loading capacity: The greatest amount of a substance that a waterbody can receive and still meet water quality standards.
Reach: A specific portion or segment of a stream.
Stage height: Water surface elevation.
Total maximum daily load (TMDL): A distribution of a substance in a waterbody designed to protect it from exceeding water quality standards. A TMDL is equal to the sum of all of the following: (1) individual wasteload allocations for point sources, (2) the load allocations for nonpoint sources, (3) the contribution of natural sources, and (4) a margin of safety to allow for uncertainty in the wasteload determination. A reserve for future growth is also generally provided.
Wasteload allocation: The portion of a receiving water’s loading capacity allocated to existing or future point sources of pollution. Wasteload allocations constitute one type of water quality-based effluent limitation.
Acronyms and Abbreviations
ADCP Acoustic Doppler current profiler ADV Acoustic Doppler velocimeter

Page 36
cfs Cubic feet per second Ecology Washington State Department of Ecology ft Feet Inst. Instantaneous PGI Primary gage index SOP Standard operating procedures TMDL (See Glossary above) USGS U.S. Geological Survey WRIA Water Resource Inventory Area


![apps.des.wa.gov · Web viewTariq Ohab [Contractor address] 1500 Jefferson Street Olympia, WA 98504 Phone: Phone: 360-407-9427 Fax: Fax: 360-586-2426 E-mail: E-mail: tariq.ohab@des.wa.gov](https://static.fdocuments.in/doc/165x107/5ecc3392eef9c115173f8d60/appsdeswagov-web-view-tariq-ohab-contractor-address-1500-jefferson-street-olympia.jpg)