Stream Stability Assessment - mi-wea.org PPT.pdf5 “Stable” ... MI 0 0.01 0.02 0.03 0.04 0.05...
10
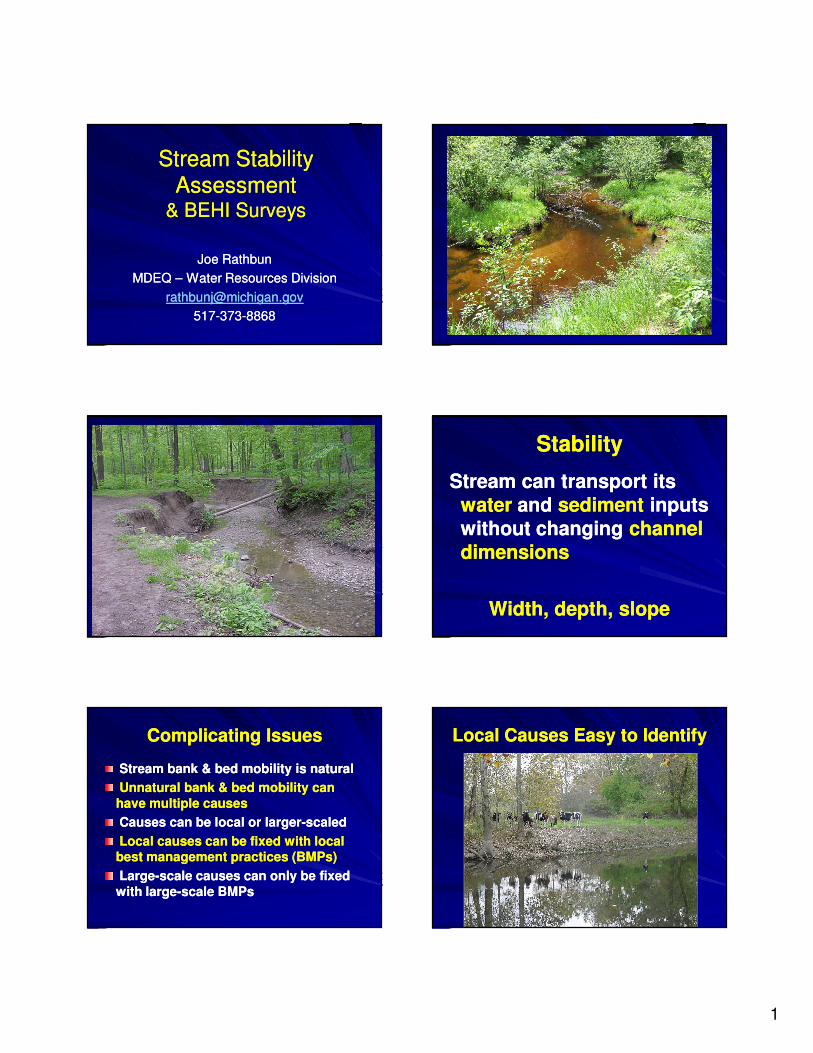
1 Stream Stability Stream Stability Assessment Assessment & BEHI Surveys & BEHI Surveys Joe Rathbun Joe Rathbun MDEQ MDEQ – Water Resources Division Water Resources Division [email protected] [email protected] 517 517-373 373-8868 8868 Stability Stability Stream can transport its Stream can transport its water water and and sediment sediment inputs inputs without changing without changing channel channel dimensions dimensions Width, depth, slope Width, depth, slope Complicating Issues Complicating Issues Stream bank & bed mobility is natural Stream bank & bed mobility is natural Unnatural bank & bed mobility can Unnatural bank & bed mobility can have multiple causes have multiple causes Causes can be local or larger Causes can be local or larger-scaled scaled Local causes can be fixed with local Local causes can be fixed with local best management practices (BMPs) best management practices (BMPs) Large Large-scale causes can only be fixed scale causes can only be fixed with large with large-scale BMPs scale BMPs Local Causes Easy to Identify Local Causes Easy to Identify
Transcript of Stream Stability Assessment - mi-wea.org PPT.pdf5 “Stable” ... MI 0 0.01 0.02 0.03 0.04 0.05...
1
Stream Stability Stream Stability AssessmentAssessment
& BEHI Surveys& BEHI Surveys
Joe RathbunJoe Rathbun
MDEQ MDEQ –– Water Resources DivisionWater Resources Division
[email protected]@michigan.gov
517517--373373--88688868
StabilityStability
Stream can transport its Stream can transport its waterwater and and sedimentsediment inputs inputs without changing without changing channel channel dimensionsdimensions
Width, depth, slopeWidth, depth, slope
Complicating IssuesComplicating Issues
Stream bank & bed mobility is naturalStream bank & bed mobility is natural
Unnatural bank & bed mobility can Unnatural bank & bed mobility can
have multiple causeshave multiple causes
Causes can be local or largerCauses can be local or larger--scaledscaled
Local causes can be fixed with local Local causes can be fixed with local best management practices (BMPs)best management practices (BMPs)
LargeLarge--scale causes can only be fixed scale causes can only be fixed
with largewith large--scale BMPsscale BMPs
Local Causes Easy to IdentifyLocal Causes Easy to Identify

2
LargeLarge--Scale Causes Harder to Scale Causes Harder to IdentifyIdentify Most common cause of Most common cause of
largelarge--scale channel scale channel degradation = degradation =
Hydrologic alterationHydrologic alteration and and increasing sediment loadsincreasing sediment loads
due to landuse changesdue to landuse changes
Causes of Hydrologic AlterationCauses of Hydrologic Alteration
Impervious surfaceImpervious surface
Soil compactionSoil compaction
Vegetation changeVegetation change
DamsDams
Tile drainageTile drainage
Water withdrawalWater withdrawal
Results of Hydrologic AlterationResults of Hydrologic Alteration
Changes in:Changes in:
Peak flows Peak flows
Stream “flashiness”Stream “flashiness”
Channel dimensionsChannel dimensions
–– WidthWidth
–– DepthDepth
–– SinuositySinuosity
–– SlopeSlope
Sources of Sources of Increased Sediment LoadsIncreased Sediment Loads
Upland erosionUpland erosion–– Agriculture, forestry, general developmentAgriculture, forestry, general development
Stream bank erosionStream bank erosion–– 10 to 90 % 10 to 90 % of total sediment loadof total sediment load
Dam failuresDam failures
Results of Increased Sediment Results of Increased Sediment LoadsLoads
Loss of macroinvertebrate & fish Loss of macroinvertebrate & fish
habitathabitat
Buried Buried rifflesriffles
Loss of Loss of poolspools
Channel filling (Channel filling (aggradationaggradation) = channel ) = channel wideningwidening

3
Indicators of Channel ConditionIndicators of Channel Condition
QualitativeQualitative
–– ObservationalObservational
QuantitativeQuantitative
–– Observational = Observational = BBank ank EErosion rosion HHazard azard
IIndex (BEHI)ndex (BEHI)
–– MeasurementMeasurement--based = several optionsbased = several options
Positive Qualitative Indicators: Positive Qualitative Indicators: Herbaceous VegetationHerbaceous Vegetation
Positive Qualitative Indicators: Positive Qualitative Indicators: Aquatic MossAquatic Moss
Positive Qualitative Indicators: Positive Qualitative Indicators: Sensitive Fish or MusselsSensitive Fish or Mussels
Negative Qualitative Indicators: Negative Qualitative Indicators: Unvegetated MidUnvegetated Mid--Channel Bar, Channel Bar,
or Braided Channelor Braided Channel
Negative Qualitative Indicators: Negative Qualitative Indicators: Leaning Trees on Both SidesLeaning Trees on Both Sides
4
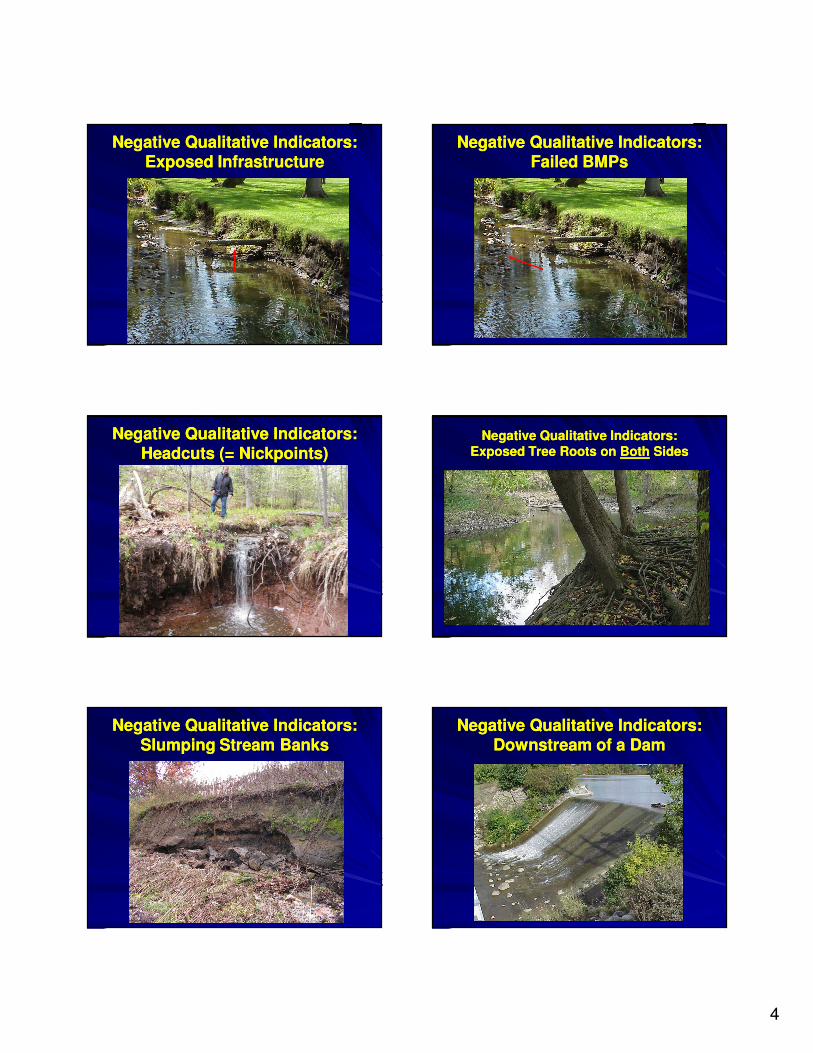
Negative Qualitative Indicators: Negative Qualitative Indicators: Exposed InfrastructureExposed Infrastructure
Negative Qualitative Indicators: Negative Qualitative Indicators: Failed BMPsFailed BMPs
Negative Qualitative Indicators: Negative Qualitative Indicators: Headcuts (= Nickpoints)Headcuts (= Nickpoints)
Negative Qualitative Indicators: Negative Qualitative Indicators:
Exposed Tree Roots on Exposed Tree Roots on BothBoth SidesSides
Negative Qualitative Indicators: Negative Qualitative Indicators: Slumping Stream BanksSlumping Stream Banks
Negative Qualitative Indicators: Negative Qualitative Indicators: Downstream of a DamDownstream of a Dam

5
“Stable” → → → → → → → → → → → → → → → → → → “Unstable”
Limitation to
qualitative
stability
indicators…
…the real world
is a continuum,
not a dichotomy
BBank ank EErosion rosion HHazard azard IIndexndex
““BEHI” BEHI” –– developed by Dr. Dave Rosgendeveloped by Dr. Dave Rosgen
Seven metrics:Seven metrics:
–– Plant root depthPlant root depth
–– Root densityRoot density
–– Bank angleBank angle
–– Surface protectionSurface protection
–– Bank compositionBank composition
–– Bank stratificationBank stratification
–– (Bank Ht./Bankfull Ht.)(Bank Ht./Bankfull Ht.)
BEHI ApplicabilityBEHI Applicability
Alluvial channels onlyAlluvial channels only –– those that form those that form
themselves through sediment transportthemselves through sediment transport
Alluvial Not alluvial
Also not alluvialAlso not alluvial
Root Depth = depth relative to Root Depth = depth relative to bank height, in %bank height, in %
~ 100 % ≤ 30 %
Values: < 5; 5-14; 15-29; 30-49; 50-89; 90-100
Scores: 10 8.5 7 5 3 1.5
Root Density = % of bank Root Density = % of bank surface covered by rootssurface covered by roots
~ 100 % ~ 40 %
Values: < 5; 5-14; 15-29; 30-49; 50-89; 90-100
Scores: 10 8.5 7 5 3 1.5
6
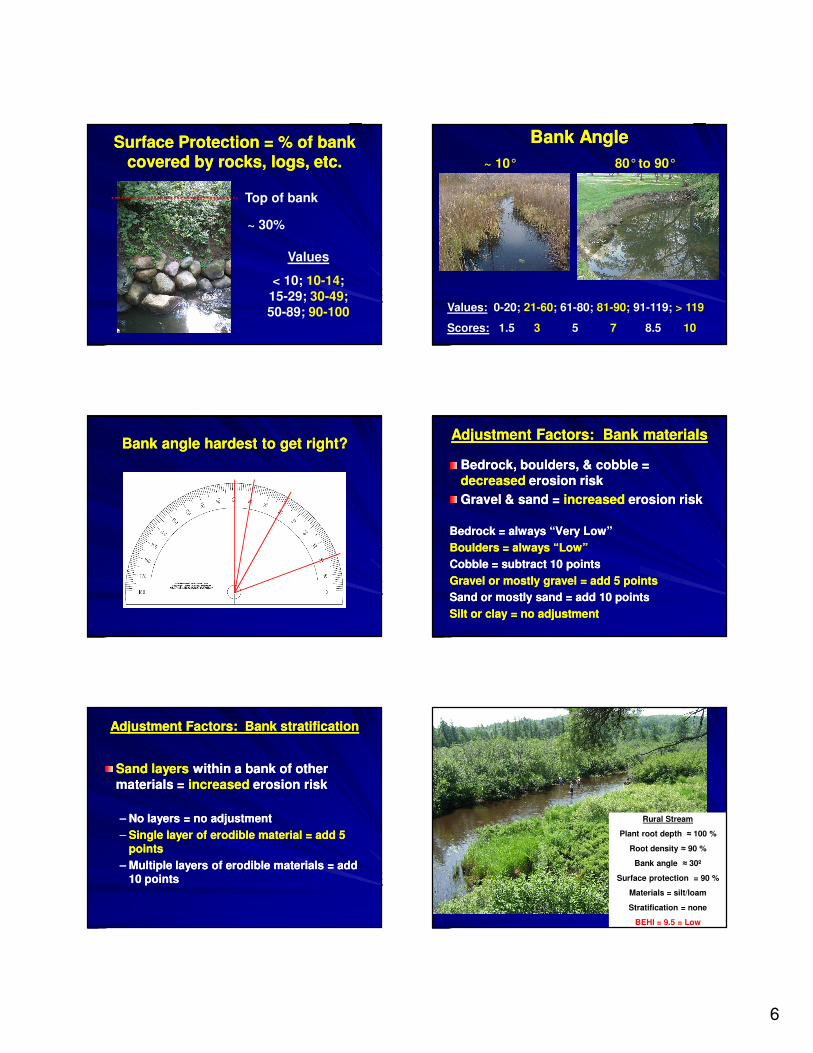
Surface Protection = % of bank Surface Protection = % of bank covered by rocks, logs, etc.covered by rocks, logs, etc.
~ 30%
Top of bank
Values
< 10; 10-14;
15-29; 30-49; 50-89; 90-100
Bank AngleBank Angle
80°to 90°~ 10°
Values: 0-20; 21-60; 61-80; 81-90; 91-119; > 119
Scores: 1.5 3 5 7 8.5 10
Bank angle hardest to get right?Bank angle hardest to get right?Adjustment Factors: Bank materialsAdjustment Factors: Bank materials
Bedrock, boulders, & cobble = Bedrock, boulders, & cobble =
decreaseddecreased erosion riskerosion risk
Gravel & sand = Gravel & sand = increasedincreased erosion riskerosion risk
Bedrock = always “Very Low”Bedrock = always “Very Low”
Boulders = always “Low”Boulders = always “Low”
Cobble = subtract 10 pointsCobble = subtract 10 points
Gravel or mostly gravel = add 5 pointsGravel or mostly gravel = add 5 points
Sand or mostly sand = add 10 pointsSand or mostly sand = add 10 points
Silt or clay = no adjustmentSilt or clay = no adjustment
Adjustment Factors: Bank stratificationAdjustment Factors: Bank stratification
Sand layersSand layers within a bank of other within a bank of other
materials = materials = increasedincreased erosion riskerosion risk
–– No layers = no adjustmentNo layers = no adjustment
–– Single layer of erodible material = add 5 Single layer of erodible material = add 5 pointspoints
–– Multiple layers of erodible materials = add Multiple layers of erodible materials = add 10 points10 points
Rural Stream
Plant root depth ≈ 100 %
Root density ≈ 90 %
Bank angle ≈ 30º
Surface protection = 90 %
Materials = silt/loam
Stratification = none
BEHI = 9.5 = Low
7
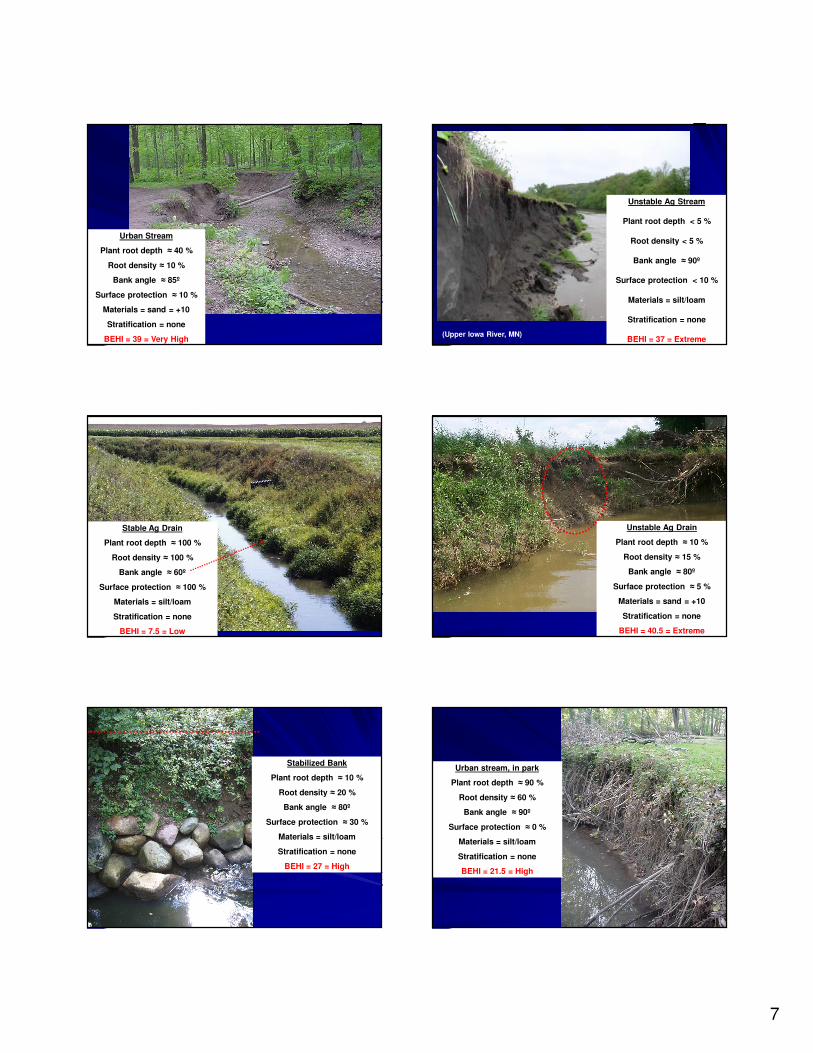
Urban Stream
Plant root depth ≈ 40 %
Root density ≈ 10 %
Bank angle ≈ 85º
Surface protection ≈ 10 %
Materials = sand = +10
Stratification = none
BEHI = 39 = Very High
Unstable Ag Stream
Plant root depth < 5 %
Root density < 5 %
Bank angle ≈ 90º
Surface protection < 10 %
Materials = silt/loam
Stratification = none
BEHI = 37 = Extreme(Upper Iowa River, MN)
Stable Ag Drain
Plant root depth ≈ 100 %
Root density ≈ 100 %
Bank angle ≈ 60º
Surface protection ≈ 100 %
Materials = silt/loam
Stratification = none
BEHI = 7.5 = Low
Unstable Ag Drain
Plant root depth ≈ 10 %
Root density ≈ 15 %
Bank angle ≈ 80º
Surface protection ≈ 5 %
Materials = sand = +10
Stratification = none
BEHI = 40.5 = Extreme
Stabilized Bank
Plant root depth ≈ 10 %
Root density ≈ 20 %
Bank angle ≈ 80º
Surface protection ≈ 30 %
Materials = silt/loam
Stratification = none
BEHI = 27 = High
Urban stream, in park
Plant root depth ≈ 90 %
Root density ≈ 60 %
Bank angle ≈ 90º
Surface protection ≈ 0 %
Materials = silt/loam
Stratification = none
BEHI = 21.5 = High

8
BEHI Application BEHI Application ––Local Problem = Local BMPLocal Problem = Local BMP
Low
Moderate
Extreme
Project site
BEHI Application BEHI Application ––
Widespread Problem = LargeWidespread Problem = Large--scale BMPsscale BMPs
Low
Moderate
Extreme
Project site
BEHIBEHI
ProsPros
Quantitative, & a continuum Quantitative, & a continuum
Minimal training requiredMinimal training required
Low level of effort; 1 day = Low level of effort; 1 day = multiple stationsmultiple stations
ConsCons
InterInter--person variation person variation
No estimate of No estimate of erosion rateerosion rate or or sediment loadingssediment loadings
OnOn--going Study to Calibrate going Study to Calibrate BEHIBEHI
BEHI + bank pin or toe pin BEHI + bank pin or toe pin
measurementsmeasurements
Quantify Quantify bank erosion ratesbank erosion rates and and
calculate sediment loadingscalculate sediment loadings for for different BEHI categoriesdifferent BEHI categories
Army Corps, DEQ, DNRArmy Corps, DEQ, DNR
Throughout Great Lakes statesThroughout Great Lakes states
Calibrating BEHI Calibrating BEHI –– Toe PinsToe Pins Calibrating BEHI Calibrating BEHI –– Toe PinsToe Pins
Eleventh St.
0
0.5
1
1.5
2
2.5
3
3.5
0 1 2 3 4
Feet
Feet
7/20/2010
7/13/2011
1.Square feet of soil lost x bank length = cubic feet of soil lost
2.Cubic feet x soil density = mass of soil lost
BEHI = 10
= Low

9
Another option: Another option: crosscross--channel transectschannel transects
86
87
88
89
90
91
92
93
94
95
96
0 20 40 60 80 100 120 140Station (ft)
Ele
vati
on
(ft
)
2010
2011
RichardsRichards--Baker Baker Stream Flashiness IndexStream Flashiness Index
““FlashyFlashy” stream = frequent, ” stream = frequent, rapid, shortrapid, short--term changes in term changes in
streamflowstreamflow
Due to impervious surfaces, Due to impervious surfaces, tile drainage, etc.tile drainage, etc.
Stream Flashiness IndexStream Flashiness Index
Calculate using USGS gage station Calculate using USGS gage station
datadata
Time
Dis
ch
arg
e (
m3/s
ec)
High Flashiness Index Low Flashiness Index
04135700 SOUTH BRANCH AU SABLE RIVER NEAR
LUZERNE, MI
0
0.01
0.02
0.03
0.04
0.05
0.06
1960 1970 1980 1990 2000 2010
Water Year
Ind
ex
Stable flashiness
04136500 AU SABLE RIVER AT MIO, MI
0
0.02
0.04
0.06
0.08
0.1
0.12
1950 1960 1970 1980 1990 2000 2010
Water Year
Ind
ex
Decreasing flashiness

10
04135500 AU SABLE RIVER AT GRAYLING, MI
0
0.01
0.02
0.03
0.04
0.05
0.06
0.07
0.08
0.09
0.1
1940 1950 1960 1970 1980 1990Water Year
Ind
ex
Complex flashiness
Flashiness Index Results Flashiness Index Results –– 308 sites308 sites
Thanks! Questions?Thanks! Questions?
![Myocardial injury is distinguished from stable angina by a ... Injury Is... · NSTEMI/MI s group (n=15) comprised patients withcoronary atherosclerosis on angiogram coronary ... [HAc])](https://static.fdocuments.in/doc/165x107/606ccaf34234095c265d66c7/myocardial-injury-is-distinguished-from-stable-angina-by-a-injury-is-nstemimi.jpg)