
Stray Magnetic Field Based Health Monitoring of Electrical ...
130
Stray Magnetic Field Based Health Monitoring of Electrical Machines Zheng Liu, BSc MSc School of Engineering Newcastle University A thesis submitted for the degree of Doctor of Philosophy February 2018
Transcript of Stray Magnetic Field Based Health Monitoring of Electrical ...

Stray Magnetic Field Based Health
Monitoring of Electrical Machines
Zheng Liu, BSc MSc
School of Engineering
Newcastle University
A thesis submitted for the degree of
Doctor of Philosophy
February 2018


Abstract
Electrical machines are widely used in industrial and transportation applications which
are essential to industrial processes. However, the lack of reliability and unpredictable life
cycles of these machines still present opportunities and challenges for condition monitoring
research. The breakdown of an electrical machine leads to expensive repairs and high losses
due to downtime. The motivation of this research is to improve the reliability of electrical
machines and to classify different kinds of failures via non-intrusive methods for condition-
based maintenance and early warning of failure. Major potential failure types in electrical
machines are winding and mechanical failures, which are caused by dynamic load state,
component ageing and harsh working environments. To monitor and characterise these
abnormal situations in the early stages, this thesis proposes stray magnetic field-based condition
monitoring allowing fault diagnosis with the help of finite element models and advanced signal
processing technology. By investigating the interaction between stray flux variations and
machine failure, different kinds of faults can be classified and distinguished via numerical and
experimental studies.
A non-intrusive stray flux monitoring system has been developed and can provide both
static and transient stray flux information and imaging. The designed monitoring system is
based on a giant magnetoresistance (GMR) sensor used to capture low stray flux fields outside
the electrical machine’s frame. Compared with other monitoring systems, its small size, low
cost, non-inventive and ease of setting up make the designed system more attractive for in many
long-term monitoring applications. Additionally, integration with the wireless sensor network
(WSN) means that the latter’s unique characteristics makes the proposed system suitable for
electrical machine monitoring in industrial applications replacing existing expensive wired
systems. The proposed system can achieve real-time data collection and on-line monitoring
with the help of spectrogram and independent component analysis.
Three cases studies are conducted to validate the proposed system with different failures
and loading states, using load fatigue, winding short-circuit failure and mechanical testing. In
these case studies, electrical and mechanical failures and dynamic loads are investigated,
collecting stray flux information with different kinds and sizes of electrical machines using both
simulation and experimental approaches. Stray flux information is collected for different
situations of winding failure, unbalanced load and bearing failures. Comprehensive transient
feature extraction using spectrogram is implemented with respect to multiple failures and load
variations. Spectrograms of stray flux can provide time-frequency information allowing the

discrimination of different failures and load states. Different faults can be distinguished through
independent component analysis of stray flux data. Compared with traditional and current
detection strategies, stray flux-based monitoring can not only provide failure indicator and
better resolution but also gives location information. Additionally, by applying different feature
extraction methods, different failure types can be separated based on stray flux information,
which is likely to be difficult to achieve using traditional monitoring approaches. However,
stray flux monitoring systems suffer from issue of noise and instability, and more case studies
and investigations are needed for further refinement.

Acknowledgment
I would like to take this opportunity to express my sincere gratitude to those who have
supported this project and helped me during my PhD study.
Firstly, special thanks go to Prof. Wenping Cao and Prof. Guiyun Tian, who supervised
me throughout this research with their time, patience and knowledge. It has been such a pleasant
and unforgettable experience to work with Prof. Tian and Prof. Cao, whose expertise in the
field of condition monitoring and electrical machines has helped me through all the tough days.
I would like to thank my colleagues Dr. Mohammed Alamin, Dr. Hong Zhang, Dr. Jun
Zhang, Dr. Min Zhang, Dr. Bin Ji, Dr. Chukwuma Junior Ifedi, Dr. Haimeng Wu, Dr. Zheng
Tan, Dr. Aijun Yin, Dr Danping Huang, Dr Jianping Peng, Mr Yunlai Gao, Mr Kongjing Li,
Mr Chen Wang, Mr Kaiwen Yu and all researchers in the Sensor Technology Research Team
and Electrical Power Research Group at Newcastle University, who have provided their help
and fruitful suggestions.
My deepest thanks go to my parents Hongxia and Dianxuan as well as my wife Jia. I
could not have done my PhD without their support, love and perseverance throughout all my
endeavours.


i
List of Publications:
[J1] Z. Liu, G. Tian, W. Cao, X. Dai, B. Shaw, “Non-invasive load monitoring of
induction motor drives using magnetic flux sensors,” IET Power Electronics, Accepted.
[J2] S. Gao, X. Dai, Z. Liu, G. Tian, “High-performance wireless piezoelectric sensor
network for distributed structural health monitoring,” International Journal of Distributed
Sensor Networks, vol. 12, no 3, Mar. 2016.
[J3] Z. Tan, X. Song, W. Cao, Z. Liu, Y. Tong, “DFIG machine design for maximizing
power output based on surrogate optimization algorithm,” IEEE Transactions on Energy
Conversion, vol. 30, issue 3, pp. 1154-1162, Sep. 2015.
[J4] Z. Tan, X. Song, B. Ji, Z. Liu, J. Ma, W. Cao, “3D thermal analysis of a permanent
magnet motor with cooling fans.” In Journal of Zhejiang University Science A, vol. 16, no 8,
pp. 616-621, Aug 2015.
[C1] Z. Liu, W. Cao, P. Huang, G. Tian, J.L. Kirtley, “Non-invasive winding fault
detection for induction machines based on stray flux magnetic sensors,” 2016 IEEE PES
General Meeting Conference, Boston, MA, 2016.
[C2] S. Gao, X. Dai, Z. Liu, G. Tian, S. Yuan, "A wireless piezoelectric sensor network
for distributed structural health monitoring," Wireless for Space and Extreme Environments
(WiSEE), 2015 IEEE International Conference on, Orlando, FL, pp. 1-6, 2015.
[C3] Z. Liu, W. Cao, Z. Tan, X. Song, B. Ji and G. Tian, "Electromagnetic and
temperature field analyses of winding short-circuits in DFIGs," Diagnostics for Electric
Machines, Power Electronics and Drives (SDEMPED), 2013 9th IEEE International
Symposium on, Valencia, pp. 269-273, 2013.
[C4] N. Yang, W. Cao, Z. Liu, Z. Tan, Y. Zhang, S. Yu, J. Morrow, "Novel
asymmetrical rotor design for easy assembly and repair of rotor windings in synchronous
generators," IEEE in Magnetics Conference (INTERMAG), Beijing, pp. 11-15, May 2015.
[C5] Z. Liu, W. Cao, Z. Tan, B. Ji, X. Song, G. Tian, “Condition monitoring of doubly-
fed induction generators in wind farms,” the Ninth International Symposium on Linear Drives
for Industry Applications (LDIA’13), Hangzhou, 2013.

ii
[C6] Z. Tan, W. Cao, Z. Liu, X. Song, B. Zahawi, “Optimization of doubly fed induction
generators (DFIGs) for wind power system,” the Ninth International Symposium on Linear
Drives for Industry Applications (LDIA’13), Hangzhou, 2013.

iii
Contents
CHAPTER 1 INTRODUCTION ............................................................................ 1
1.1 Research background .............................................................................................. 1
1.2 Aim and objectives ................................................................................................. 3
1.3 Main achievements ................................................................................................. 3
1.4 Thesis layout ........................................................................................................... 4
1.5 Chapter summary .................................................................................................... 6
CHAPTER 2 LITERATURE REVIEW ................................................................. 7
2.1 Failure models ........................................................................................................ 7
2.1.1 Stator failures .................................................................................................. 9
2.1.2 Rotor failures ................................................................................................ 11
2.1.3 Bearing failures............................................................................................. 12
2.2 Main reasons for faults ......................................................................................... 13
2.2.1 Environment ................................................................................................. 13
2.2.2 Voltage spikes of PWM control ................................................................... 13
2.2.3 Dynamic load ................................................................................................ 14
2.3 The state-of-the-art of condition monitoring technologies ................................... 14
2.3.1 Motor current ................................................................................................ 15
2.3.2 Flux signature analysis ................................................................................. 16
2.3.3 Surge test ...................................................................................................... 17
2.3.4 Temperature .................................................................................................. 17
2.3.5 Comparisons ................................................................................................. 18
2.4 Magnetic field imaging and stray flux detections ................................................ 20
2.5 Chapter summary .................................................................................................. 24
CHAPTER 3 METHODOLOGY ......................................................................... 26
iv
3.1 Theoretical background of stray flux in electrical machines ............................... 27
3.1.1 Attenuation of stray flux in the machine ...................................................... 29
3.1.2 Analytical model of stray flux ..................................................................... 30
3.2 Feature extraction and analysis of stray flux information.................................... 32
3.3 Chapter summary ................................................................................................. 33
CHAPTER 4 MONITORING SYSTEM DESIGN ............................................. 35
4.1 Choice of sensor ................................................................................................... 35
4.2 Sensor location for measuring stray flux ............................................................. 36
4.3 Wireless sensor network ...................................................................................... 39
4.3.1 Hardware architecture .................................................................................. 39
4.4 Chapter summary ................................................................................................. 43
CHAPTER 5 LOAD MONITORING SYSTEM ................................................. 44
5.1 Vsd induction motor drive ................................................................................... 44
5.1.1 Modelling of the VSD system ...................................................................... 45
5.2 Induction machine test benches ........................................................................... 49
5.3 Static test results and analysis .............................................................................. 52
5.4 Transient data and feature extraction for characterization ................................... 53
5.5 Chapter summary ................................................................................................. 58
CHAPTER 6 ELECTRICAL WINDING FAILURES ........................................ 60
6.1 Finite element model ............................................................................................ 60
6.1.1 Numerical results with winding faults ......................................................... 61
6.1.2 Thermal simulation ...................................................................................... 63
6.2 Experimental vilaidation ...................................................................................... 70
6.2.1 Experimented test bench set-up ................................................................... 70
6.2.2 Experimental Results ................................................................................... 72

v
6.3 Chapter summary .................................................................................................. 79
CHAPTER 7 MECHANICAL FAILURES ......................................................... 80
7.1 Bearing misalignment and unbalanced load ......................................................... 80
7.2 Finite element simulation ..................................................................................... 82
7.3 Experiment set up and validation ......................................................................... 85
7.4 Data analysis and feature extraction ..................................................................... 87
7.5 Chapter summary .................................................................................................. 93
CHAPTER 8 CONCLUSIONS AND FUTURE WORK ..................................... 95
8.1 Research conclusion ............................................................................................. 95
8.2 Future work .......................................................................................................... 97
REFERENCES ...................................................................................................... 100
APPENDIX ...................................................................................................... 111

vi
List of Figures
Figure 2.1 Failure rate of induction machines [3, 13, 15, 16] .................................................... 8
Figure 2.2 Catastrophic failure of a wind turbine generator due to faulty rotor winding [17]. . 8
Figure 2.3 Possible winding failures in the rotors and stators of the machines ......................... 9
Figure 2.4 Inter-turn short-circuit ............................................................................................ 11
Figure 2.5 Turn to turn winding fault in an induction machine [47]. ...................................... 14
Figure 2.6 Search coil (Emerson M-343F-1204) [7] ............................................................... 21
Figure 2.7 Search coil .............................................................................................................. 21
Figure 2.8 C shape magnet flux coil ........................................................................................ 22
Figure 2.9 Positions of the sensor placed ................................................................................. 22
Figure 2.10 Proposed sensor and detect position [12] ............................................................. 23
Figure 3.1 Research diagram of magnetic sensor based monitoring system ........................... 26
Figure 3.2 Schematic of stray flux in the machine .................................................................. 28
Figure 3.3 Decoupling of attenuation ...................................................................................... 29
Figure 3.4 STFT of a signal with a fixed window ................................................................... 33
Figure 4.1 Schematics of three different magnetic sensors ..................................................... 35
Figure 4.2 Simulation results of the target induction machine ................................................ 39
Figure 4.3Circuit prototype of: (a) radio board; (b) base board ............................................... 40
Figure 4.4 (a) Typical data sampling cycle of conventional wireless sensor node; (b) improved
sampling operation implemented in the designed wireless sensor node .......................... 42
Figure 5.1 System model of VSD behaviour ........................................................................... 47
Figure 5.2 Induction machine load monitoring test benches ................................................... 51
Figure 5.3 Stator current and peak values of the GMR output under different loads .............. 52
Figure 5.4 Results for motors 1 and 2 ...................................................................................... 54
Figure 5.5 Test bearing status .................................................................................................. 57
Figure 5.6 Data analysis using STFT in spectrogram with bearing test rig ............................. 58
Figure 5.7 Transient time during the experiment ..................................................................... 58
Figure 6.1 Magnetic flux distributions of FE model. ............................................................... 61
Figure 6.2 Stray flux density in the induction machine housing. ............................................ 62
Figure 6.3 Magnetic flux distribution with a phase-to-phase fault. ......................................... 63
Figure 6.4 Stray magnetic flux with a stator winding fault. .................................................... 63
Figure 6.5 3D model of an induction machine......................................................................... 65
Figure 6.6 3D temperature field with natural convection ........................................................ 66
Figure 6.7 3D temperature field with forced convection ......................................................... 67

vii
Figure 6.8 3D temperature field under healthy conditions ....................................................... 67
Figure 6.9 3D temperature field with rotor short-circuits ........................................................ 68
Figure 6.10 3D temperature field with rotor short-circuits ...................................................... 68
Figure 6.11 3D temperature field with short-circuits in both the rotor and stator windings .... 69
Figure 6.12 3D temperature field with short-circuits in both the rotor and stator windings .... 69
Figure 6.13 Experimental test rig ............................................................................................. 71
Figure 6.14 Stray flux baselines for the healthy induction machine. ....................................... 72
Figure 6.15 Stray flux spectrum of the healthy induction machine.......................................... 73
Figure 6.16 Stray flux of induction machine with a phase to phase fault. ............................... 74
Figure 6.17 Stray flux spectrum of induction machine with phase to phase failure. ............... 75
Figure 6.18 Stray flux with phase-to-ground winding failure in the induction machine ......... 75
Figure 6.19 Stray flux spectrum of induction machine with phase-to-ground failure ............. 76
Figure 6.20 Spectrograms of stray flux data in the winding failure experiments .................... 78
Figure 7.1 Rotor damage due to eccentricity ............................................................................ 81
Figure 7.2 Bearing misalignment ............................................................................................. 81
Figure 7.3 3D model of the tested machine .............................................................................. 83
Figure 7.4 FEA simulation diagrams of static and dynamic eccentricities .............................. 84
Figure 7.5 Simulation results for stray flux information in three different states .................... 85
Figure 7.6 Mechanical failure test bench and system diagram ................................................. 87
Figure 7.7 Output signals of magnetic sensors ......................................................................... 87
Figure 7.8 Stray flux spectrums of the test machine with different mechanical failures ......... 89
Figure 7.9 ICA analysis results of different mechanical failures ............................................. 92
Figure 7.10 Comparison of spectrograms between stray flux and stator current ..................... 92

viii
List of Tables
Table 2-1 Comparisons of different methods of condition monitoring ................................... 19
Table 4-1 General comparisons of three different sensors ...................................................... 36
Table 4-2 Signals transmitted through bus connections .......................................................... 41
Table 6-1 Specifications of the tested induction machine ....................................................... 60

ix
List of Symbols
𝐴 Magnetic vector potential
B Magnetic flux density
c Capacity
D Diameter
𝑓 Frequency
𝑖 Current
𝑗 The complex number
𝐾 Constant
𝑘 Constant
L Inductance
𝑀 Mature Inductance
m Constant
P Power
𝑝 Number of motor poles
r Resistance
𝑅 Radius
𝑠 Slip
𝑡 Time
𝑇 Torque
𝑉 Voltage
𝜔 Rotation an
Ψ Flux
𝜙 Angular position
𝜎 Electrical conductivity
𝜇 Magnetic permeability
𝜁 Damping factor
𝛼 Contact angle
𝜆 Constant
𝛽 Constant
𝑣 Velocity
𝜌 Density

x
List of Acronyms
GMR Giant magneto resistance
DSP Digital signal processing
MMFs Magnetic motive force
UMP Unbalanced magnetic pull
MSCA Motor current signature analysis
FFT Fast Fourier transform
AC Alternating current
DC Direct current
EMF Electrical magnetic force
STFT Short time fourier transform
AMR Anisotropic magnetoresistive
DMA Direct memory access
PWM Pulse-width modulators
ADC Analog-to-digital conversion
DAC Digital-to-analog conversion
SPI Serial peripheral interface
SRAM Static random access memory
VSD Variable speed drive
FOC Field-oriented controller
VSI And voltage-source inverter
FE Finite element
FEA Finite element analysis

1
Chapter 1 Introduction
This chapter provides the motivation for the research and illustrates the challenges and
opportunities of current condition monitoring technologies for electrical machines. The stray
flux detection method is then proposed for the characterisation and evaluation of the health state
and potential failures in electrical machines. The major achievements of the research are then
listed. Finally, the structure of this thesis is explained.
1.1 Research background
Electrical machines play an essential role in industrial drives and power generation
plants worldwide. They are found in use in motor drive systems from a few watts to several
megawatts. In recent years, electrical machine diagnosis and predictive maintenance research
has experienced spectacular dynamism. Condition monitoring technologies have been also
incorporated into many industrial systems and applications. However, failures in electrical
machines, may lead to severe repercussions in economic terms as well as other less tangible
costs, and this is a crucial issue for current industrial applications. In these circumstances, it is
essential to develop new monitoring techniques able to detect the early stage of failure
sufficiently in advance so that proper maintenance action can be planned and adopted.
Electrical machines typically operate in harsh environments, which leading to annual
failure rate of approximately 6%. Faulty motors and generators may cause whole electrical
systems to shut down or even catastrophic damage. Failures in Bearings and stator winding and
eccentricity-related faults are the most prevalent types and, thus, demand special attention.
These types of failure share several of the same symptoms, including unbalanced
voltage/current, decreased average torque, reductions in efficiency and excessive heating or
vibration. Therefore, it is important to develop reliable and accurate condition monitoring
systems to safeguard machine operation.
For the purpose of detecting and distinguishing failures inside machines, many
diagnostic methods and indicators have been developed so far. Electrical methods are based on
the measurement of electrical terminal quantities such as current. Motor current signature
analysis (MCSA) utilizes the results of spectral analysis of the current of an induction machine

2
(IM) to pinpoint existing or the predict failures in the motor [1]. As a result of abnormalities
occurring in the machine, additional frequency components will appear in the current spectrum
[2]. Meanwhile, diagnostic analysis has been reported in which current is sensed during the
normal operation and transient state, measuring variables such as the sequence components of
current, park vector, wavelet transform and zero crossing instants [3-5]. Vibration signals can
also be analysed to detect the possible development of a faulty condition in IMs. This technique
is generally used for detecting mechanical faults, such as bearing problems, gear mesh defects,
rotor misalignment and unbalanced mass [6, 7]. However, these methods shares a common
drawback, which is that due to their ‘global’ character they cannot provide sufficient ability to
discriminate between different kinds of faults and give location information, because of the
influence of changes in the power supply and dynamic load [8]. Additionally, detailed
information on the characteristics of motor design and geometry is required, such as knowledge
of frequency response functions [9]. This is because mechanical and electrical responses vary
at different accelerometer positions, which makes the quantification of faults difficult. Current
monitoring technologies may require sensors to be placed inside of machines and cables, which
may lead to possible damage, and in any case these locations are not always accessible.
To address the aforementioned problems, this research concentrates on how magnetic
flux detection can be applied to estimate and monitor the health of electrical machines.
Magnetic flux is one of the most important parameters of a machine and is related to the
magnetic state of the machine. Once a tiny abnormality occurs in a machine, its magnetic flux
will change depending on different situations and types of faults.
Stray flux is magnetic flux that radiates from the outside of the machine frame and is
inherently and strictly connected to the magnetic state of the machine. Stray flux is induced by
stator and rotor currents, both of which produce magnetic flux with different spectral
components. Depending on the physical location around the motor body where measurement is
performed, the magnetic field can contain information on stator and rotor states together, which
reflects on different spectrum and harmonics.
Three specific challenges have arisen for the condition monitoring of electrical
machines. Firstly, methods should be non-invasive approach and easy to implement. Secondly,
the detection and classification of different types of failures outside the machines is necessary.
Thirdly, quantitative non-destructive evaluation is required to distinguish between different
types of faults. To address these issues, a novel condition monitoring system is developed in
this study based on GMR sensors which can capture stray flux escaping outside the machine’s

3
frame. In term of distinguishing different failures, spectrogram and ICA are used to obtain time-
frequency information and provide failure separation.
1.2 Aim and objectives
The overall aim of this research is the design and development of a new generation of
non-invasive evaluation health monitoring system to detect different faults in the electrical
machines.
The objectives of this research can be summarized as follows:
1) To undertake a literature survey and investigation of the application of different
parameters based condition monitoring system for electrical machine monitoring including the
challenges for failure detection and diagnostics.
2) To design and develop a stray flux-based sensing system for machine monitoring
diagnosis and to validate the proposed system in different case studies, which includes the
elements listed below:
a) To develop a magnetic sensor system for stray magnetic field capture with wired and
wireless network which is suitable for the applications of electrical machine condition
monitoring.
b) To develop and have a deep understanding of finite element models concentrating on
stray flux distribution in electrical machines with different types of faults;
c) To monitor the load variation of electrical machines during both the steady-state and
transient states by using the designed stray flux-based sensing system.
d) To investigate the relationship between stray magnetic/thermal field and stator winding
short-circuits in electrical machines; to identify and evaluate the health state of the
machine in different situations of stator winding failures.
e) To understand and classify different mechanical failures based on the proposed stray
flux sensing system for machine health monitoring in order demonstrate the system’s
capability and merits, to compare traditional detection technology with stray flux
monitoring and identify the suitable approach for monitoring and diagnosis of electrical
machines.
1.3 Main achievements
The main achievements of this research are shown below:

4
1. A comprehensive review of condition monitoring technologies of electrical machines
is undertaken. To provide a non-invasive approach, the design of a GMR sensor-based system
for monitoring failures and the healthy state of electrical machines is proposed. The designed
stray magnetic sensor system is able to capture stray flux and is integrated with wired and
wireless monitoring systems via several experimental case studies.
2. Finite element models concentrating on the distribution of stray flux in electrical
machines with different stator winding and mechanical failures are built. Additionally,
depending on the simulation results, the optimal location of the GMR sensor is determined,
which is at the centre of the machine’s external frame. The z-direction of the stray flux provides
the strongest signal among the three directions.
3. Real-time load monitoring is achieved through the application of the designed stray
flux system. By analysing the static and dynamic feature extraction using spectrograms, the
time-frequency information of stray flux and load variation can be illustrated. The transient
time of stray flux can be an indicator of load variation, which provides better performance than
amplitude measurements during the steady state.
4. Different stator winding failures are investigated through numerical and experimental
studies using stray flux information. The link between the stray flux signal and winding failures
is demonstrated. Phase-to-phase and phase-to-ground stator short-circuit failures are tested in
the experiments. By referencing different harmonic components, especially those at half of the
fundamental frequency, different winding failures can be separated using the designed stray
flux monitoring system and feature extraction approach.
5. The inspection of electrical machines for mechanical failures including unbalanced
load and bearing misalignment, is investigated using simulation and experimental studies. By
using independent component analysis, different mechanical failures can be separated due to
the different failure harmonic indicator. Compared with the measurement current, stray flux-
based monitoring provides better performance in defect detection and classification through
spectrogram.
1.4 Thesis layout
Chapter 1 gives a brief introduction of the study, including the research background,
aim and objectives, main achievements and an outline of the thesis.

5
Chapter 2 presents a comprehensive survey of possible failures inside electrical
machines. Meanwhile, state-of-the-art condition monitoring technologies for machines are
analysed and compared. The advantage and disadvantages of current methods are discussed.
Additionally, previous stray flux monitoring methods are also reviewed.
Chapter 3 shows the methodologies and the overall process of this research to elaborate
different case studies and milestones. This chapter provides the theoretical background of stray
flux condition monitoring in electrical machines, followed by a brief description of the stray
flux monitoring system. The signal processing methods for collecting stray flux information
and feature extraction in the frequency domain using spectrograms are also mentioned in this
chapter.
Chapter 4 presents the design and set-up of a novel stray flux condition monitoring
system. Depending on FEA simulation results, the choice of sensors, optimized sensor location
and direction can be determined. In this research, the giant magnetoresistance (GMR) sensor is
chosen as the magnetic flux sensor to capture low magnetic flux field. This chapter also
explained the data acquisition system and wired/wireless communication system design which
based on an NI data acquisition card and DSP board. The proposed system provides a non-
invasive method to inspect the health state inside of electrical machines.
Chapter 5 focuses on one of the case studies investigating load monitoring using the
proposed stray flux monitoring system. Experimental validation including two case studies is
also carried out via static and transient magnetic field measurements. In steady-state operation,
the static features from a GMR sensor are applied for load monitoring and characterization.
Loading can also be measured by using the feature extraction of different transients. Firstly,
when induction motors start up with different loads, the first peak value of the output voltage
of the magnetic sensor is an indicator of variable loads. Secondly, a spectrogram is used to
provide patterns over time with varying harmonics. By referencing the transient time
information of the spectrogram patterns of the external magnetic flux, load variations can be
illustrated during experiments. Compared with static analysis and results, the transient response
time can provide more effective and better results for dynamic load states. Load monitoring
experiments are carried out in two different test benches. The results show that the proposed
load monitoring system can be suitable for different machines with differing ranges of power.
Chapter 6 shows the second case study based on the detection and separation of different
kinds of stator winding failures. The proposed stray flux method offers wide range spectrum
response, and high resolution of low-level magnetic field detection. Simulation results from

6
different stator winding short-circuits can provide information about changes in the stray flux.
Based on this information, GMR sensors and arrays can be chosen and developed to meet the
test requirements. Experimental results have confirmed that the proposed condition monitoring
system is capable of capturing stray magnetic flux even though the leaking flux signal is quite
weak. By studying the measured stray flux in the time domain and especially in the frequency
domain, several significant harmonic components can be used as the indicators of stator
winding faults. The time-frequency spectrogram can provide better harmonic patterns and
information compared with the frequency spectrum.
Chapter 7 considers presents two different mechanical failures of unbalanced load and
bearing misalignment in an experimental case study. A theoretical analysis illustrates the
relevant harmonics once these mechanical failures happen inside of the electrical machines. By
implemented the proposed GMR sensor system outside the tested machine, stray flux
information can be collected. Combining the measured stray flux data and spectrograms,
unbalanced loads and bearing misalignments can be detected by the proposed system. In this
chapter, stray flux detection is also compared with a current-based monitoring system, and is
shown to offer richer information and higher efficiency.
Chapter 8 summarizes all of the studies. Additionally, it presents the conclusions of the
research so far and gives recommendations for future work. The research has proposed and
validated a novel non-invasive condition monitoring system for electrical machines. With the
help of spectrograms, stray flux information can be an effective indicator of load monitoring,
stator winding failures and mechanical failures.
1.5 Chapter summary
This chapter introduces the PhD research work which focuses on the condition
monitoring of electrical machines using stray flux information. The research background is
shown, and the aim and objective of this research are presented. The major contributions of the
research are listed as well. Following this, an outline of the thesis is given and the contents of
each chapter are described.

7
Chapter 2 Literature Review
A comprehensive literature review is given in this chapter. To determine the aims and
objectives of the condition monitoring system, types of failure are explained, which include
winding, bearing and rotor failure. By analysing failures in electrical machines, it is possible to
assess the importance and priority of different types of failure which need to be monitored.
Different kinds of condition monitoring technologies are then illustrated and their advantages
and disadvantages are discussed. Compared with other approaches, the stray flux monitoring
approach provides rich information and is non-destructive. Additionally, by reviewing current
monitoring technologies, the challenges and problems arising are also summarized.
2.1 Failure models
Induction machines typically operate in harsh environments leading to failure rates of
approximately 6% each year [10-12]. Faulty induction machines may cause whole drive
systems to shut down or even catastrophic damage. Several surveys have investigated and
illustrated in detail types and rates of failure in these machines [13]. Common failures in
induction machines include those due to stator winding faults, bearing faults, rotor bar/ring
faults and shaft faults. Stator winding faults are one of the most frequent types of failures in
drive systems [14]. Fig 2.1 shows the failures rates of typical motor drive applications. From
this, it is very important to develop reliable and accurate condition monitoring systems to
safeguard machine operation.

8
Figure 2.1 Failure rate of induction machines [3, 13, 15, 16]
From the data above, winding faults in the rotors and stators are a major type of failures,
and are extremely common in electrical machine systems. Once winding failure occurs,
generators cannot supply stable and high quality electric power. Moreover, if a short-circuit in
the windings is not detected until a very late stage, it can lead to the catastrophic failure of
generators or even the breakdown of whole systems. An example of a rotor winding fault is
shown in Fig. 2.2.
Figure 2.2 Catastrophic failure of a wind turbine generator due to faulty rotor winding
[17].

9
2.1.1 Stator failures
Industrial surveys and other research have shown that a large percentage of failures in
electrical machines result from a fault related to the stator winding and core. Many studies have
indicated that the majority of motor stator winding failures result from the destruction of the
turn insulation [6, 18-20]. Typically, winding faults are divided into open circuits and short-
circuits in machines. Winding short-circuits are the major and most common types of winding
faults. Possible winding faults in generators may be turn-to-turn, coil-to-coil, phase-to-phase,
phase-to-ground and winding-to-iron faults. Fig. 2.3 shows the positions and patterns of the
different winding short-circuit faults in electrical machines.
Figure 2.3 Possible winding failures in the rotors and stators of the machines
Shorted turns in the stator winding belong to a class of faults that may often have a
negligible effect on the performance of the machine, but the presence of which may eventually
lead to catastrophic failure. Therefore, stringent demands are made for means to minimise the
occurrence and mitigate the effects of turn insulation breakdown [8, 21, 22].
In electrical machines, the stator and rotor winding insulation is exposed to a
combination of thermal, electrical, vibrational, thermo-mechanical, and environmental stresses
during operation. In the long term, these multiple stresses cause ageing, which finally leads to
insulation breakdown [18, 23-25]. For this reason, it is important to estimate the integrity of the
remaining insulation in winding after a period of operating time. Deterioration of the winding
insulation usually begins as an inter-turn fault involving a few turns of the winding. A turn fault
in the stator winding of an electrical machine causes a large circulating current to flow in the
shorted turns. Such a circulating current is of the magnitude of twice the locked rotor current,

10
and it causes severe localised heating and sustains favourable conditions for the fault to rapidly
spread to a larger section of the winding. If left undetected, turn faults can propagate, leading
to catastrophic phase-ground or phase-phase faults. Excessive heating caused by turn-to-turn
shorts is the reason why motors in this condition will almost always fail in a matter of minutes,
if not seconds. A basic rule of thumb to consider is that every additional 10°C causes the
winding to deteriorate twice as fast as when operation takes place in the allowable temperature
range [26, 27]. Failure of the insulation between the winding and ground can cause a large
ground current, which would result in irreversible damage to the core of the machine. This fault
may be so severe that the machine might even have to be removed from service. If the fault is
detected at an early stage, however, the machine can be put back into service by just re-winding
the stator; while, on the other hand, replacing the whole motor means increased downtime [28].
Regular monitoring provides the opportunity for the early detection of problems and
possible remedial action, thereby prolonging the life of the machine. For smaller machines, the
development of a time delay between a direct turn-to-turn short-circuit and ground insulation
failure can be from some minutes up to as much as hours, depending on the severity of the fault
and the loading of the motor. Another types of fault associated with the stator winding is called
“single-phasing” [22, 29]. In this case, one supply line or phase winding becomes open-
circuited. The resulting motor connection has a line voltage directly across two phases
(assuming a “star” connected machine) which is equivalent to a single-phase circuit. The effect
of an insulation fault between turns is to eliminate a turn or group of turns from the stator
winding [30]. This will be of little direct consequence, but will be quantifiable in the flux
distribution in the air-gap. Fig. 2.4 shows an inter-turn short-circuit between two points, a and
b, of a complete stator winding. The path to the circulating current between these points is
closed and the path A–A’ can be expanded into two independent circuits [19, 23]. Fig. 2.4
shows that the two currents, the phase current and the current which flows in the short-circuited
part, produce opposite MMFs. Therefore, inter-turn short-circuits have a cumulative effect in
decreasing the MMF in the vicinity of the short-circuited turn(s). Firstly, when a short-circuit
occurs, the phase winding has fewer turns and, therefore, lower MMF. Secondly, the short-
circuit current MMF is opposite to the MMF of the phase winding. The circulating current Ic is
a result of the galvanic contact between points a and b, but also due to the contribution brought
about by the transformer effect or mutual induction.

11
Figure 2.4 Inter-turn short-circuit
2.1.2 Rotor failures
Unlike with stator design, rotor design and manufacturing has undergone little change
over the years. As a result, rotor failures now account for around 20% of total induction motor
failures [13, 31, 32]. However, in the field of fault diagnosis and the condition monitoring of
electrical machines, most of the research presented in the literature deals with induction motor
rotor failures, while bearing-related failures, which account for 50-60% of failures, are not so
widely discussed [12, 17]. Rotor cage-related faults have perhaps received so much attention in
the literature as a result of their well-defined associated fault frequency components.
Under normal operating conditions, large mechanical and thermal stresses are present,
especially if the machine is being continually stopped and restarted or if it is heavily loaded
[33]. It is well known that the rotor current during starting can be as much as ten times the
normal full load current and that the effects of these large currents are represented by very large
thermal stresses in the rotor circuit. The starting period is also characterised by minimal cooling
and maximum mechanical forces, which over-stress the rotor bars.
The sequence of events following the cracking of a rotor bar can be described as follows
[13]. The cracked bar will increase in resistance and will overheat at the crack. The bar will
break completely and arcing will occur across the break. This arcing will then damage the rotor
laminations around the faulty bar [34, 35]. The neighbouring bars will carry an increased current
and will be subject to increased stresses, eventually causing these bars to fail. Finally, the
broken bars may lift outwards because of centrifugal forces and could catastrophically damage
the stator windings.
Machine eccentricity is defined as a condition of the asymmetric air-gap that exists
between the stator and rotor [1, 36, 37]. The presence of a certain level of eccentricity is

12
common in rotating electrical machines. Some manufacturers and users specify a maximum
permissible level of 5 per cent, whereas in other cases, a maximum level of 10 per cent of the
air-gap length may be allowed by the user. However, manufacturers normally try to keep total
eccentricity at even lower levels in order to reduce vibration and noise and minimise unbalanced
magnetic pull (UMP) [38]. Since the air-gap in an induction machine is considerably smaller
than in other types of machines with a similar size and performance, this type of machine is
more sensitive to changes in the length of the air-gap. There are two types of air-gap eccentricity:
static air-gap eccentricity and dynamic air-gap eccentricity. In the case of static air-gap
eccentricity, the position of the minimal radial air-gap length is fixed in space, while in the case
of dynamic eccentricity, the centre of the rotor is not at the centre of rotation and the position
of the minimum air-gap rotates with the rotor [34, 39]. However, static and dynamic
eccentricities are only a basic classification, since further varieties and modifications, such as
unilateral eccentricities as well as angular and radial misalignments, are also possible.
In reality, both static and dynamic eccentricities tend to co-exist. An inherent level of
static eccentricity exists even in newly manufactured machines as a result of the manufacturing
and assembly method used. This causes a steady UMP in one direction, and with usage this
may lead to a bent rotor shaft and bearing wear and tear, resulting in some degree of dynamic
eccentricity [35]. Unless detected early, this eccentricity becomes large enough so that high
unbalanced radial forces develop that may cause stator-to-rotor rub, leading to a major
breakdown of the machine.
2.1.3 Bearing failures
Because of the close relationship between motor system development and bearing
assembly performance, it is difficult to imagine the progress of modern rotating machinery
without considering the wide application of bearings. Bearing faults may account for 42%-50%
of all motor failures [31, 40-42]. Motor bearings may cost between 3 and 10% of the actual cost
of the motor, but the hidden costs involved in downtime and lost production combine to make
bearing failure a rather expensive abnormality [43]. Bearing faults might manifest themselves
as rotor asymmetry faults, which are usually included in the category of eccentricity-related
faults. Otherwise, ball bearing-related defects can be categorised as outer bearing race defects,
inner bearing race defects, ball defects, and train defects [42, 44, 45].
Different stresses acting upon a bearing may lead to excessive audible noise, uneven
running, reduced working accuracy, and the development of mechanical vibrations and, as a
result, increased wear [9, 46]. As long as these stresses are kept within the design capabilities

13
of the bearing, premature failure should not occur. However, if any combination of them
exceeds the capacity of the bearing, then its lifetime may be drastically diminished and a
catastrophic failure could occur.
2.2 Main reasons for faults
There are many reasons leading to faults in electrical machines. This section presents
the major causes of these faults showing three main reasons for faults in electrical machines.
By understanding and investigating the causes of faults, the development of failure can be
traced and this helps in the design of condition monitoring system and in predicting the progress
of the fault process. The major reasons for faults in electrical machines can be important
parameters to monitor during machine operation.
2.2.1 Environment
The environment of electrical machines may be extremely harsh and complicated. Due
to the special environments, moisture, dust and salt can corrode machines parts. Adverse
environment all conditions easily lead to insulation faults in windings. The working
environments of electrical machines often include aggressive chemicals, and high humidity,
contamination and radiation, which lead to not only corrosion but also contamination. Corrosion
and contamination can accelerate the thermal deterioration of electrical machines, increasing
thermal stress in every component. Additionally, unexpected corrosion can generate surface
currents and electrical tracking during machine service, which increase the degradation of the
winding insulations and bearings.
2.2.2 Voltage spikes of PWM control
In a drive system, a PWM power converter is linked to the windings directly to control
the whole machine. Generally speaking, the operating voltage of the stator windings is 690
volts; however, there will be almost 2500 volts peak voltage spikes with very high switching
frequency, which are generated by the power converter and sent to the winding [27, 47]. This
high voltage can damage and break down the insulation of the rotor windings, and result in a
turn-to-turn short-circuit. Fig. 2.5 shows an example of a turn-to-turn winding fault in an
induction machine.

14
Figure 2.5 Turn to turn winding fault in an induction machine [47].
2.2.3 Dynamic load
Wind speed in an offshore wind farm is not a constant parameter. The generator is
directly affected by wind speed, and its speed is also changing all the time. By controlling the
excitation current in the rotor windings, the generators can create satisfactory electric input.
The rotor windings are twisted all the time by electromagnetic force, which is the same situation
as in broken rotor bars in the squirrel cage induction motors [22, 48]. Moreover, given the
dynamic wind speed, the rotor windings are unstable all the time. Meanwhile, there will be an
excessive minor movements between windings [18], which may lead to rubbing against the
insulation and then to short-circuit situations. Subsequently, due to the dynamic load, the rotor
windings create lots of heat, and most of the heat will be conducted to the air through the main
machine body which depends on a cooling system [47]. But the end windings are directly
connected to the air, and moreover the thermal conductivity coefficient of the air is much higher
than that inside the generator body [49]. In this case, the insulation of the end windings and the
generators will be damaged and break down due to the high temperature.
2.3 The state-of-the-art of condition monitoring technologies
From the review above of the modes of failure and their causes in electrical machines,
it is clearly necessary to develop condition monitoring technologies for these drive systems. To
reduce maintenance and operating costs, much condition monitoring research has been
conducted in recent 10 years. The following review of monitoring methods includes motor
current detection, stray flux monitoring, surge testing and temperature monitoring. The merits

15
and drawbacks of different condition monitoring technologies are then compared. An overall
perspective on recent advanced condition monitoring technologies is then provided.
2.3.1 Motor current
The current is the most important characteristics in machines and is easy to measure.
Due to its low cost and simplicity, motor current signature analysis (MSCA) is the most widely
used condition monitoring technology in commercial applications. The main idea of this
technology is the use of spectral analysis to detect winding faults in both rotors and stators [10-
12, 17].
In the recent years, researchers have proposed several ways to conduct spectral analysis.
Firstly, the application of Fast Fourier transform (FFT) analysis is able to determine the
amplitude of each different harmonic component [50]. During winding faults in rotors and
stators, the harmonics at even numbers or specific frequencies are quite different compared with
those in healthy machines. The advantage of using the FFT is that accurate results can be
obtained to detect winding fault in machines. Furthermore, it is also able to detect bearing faults,
eccentricity and other faults in an entire wind turbine system [31, 51]. However, due to the
characteristics of this diagnostic approach, it is only suitable for cases of fixed frequency [52].
Given a variable wind speed load, the slip and the frequency are changing all the time, and this
is the main drawback for the use of the Fast Fourier transform in MSCA.
Alternatively, the wavelet transform is also able to be used in this condition monitoring
technology. The wavelet transform is an approach which provides the necessary information in
the time-frequency domain for non-stationary signals [53]. In recent years, this approach has
been applied by various researchers to failure detection in the doubly-fed induction generators
[54-58]. The advantage of the wavelet transform is that there is no influence on the results if a
machine is running with variable speed, which is the most significant difference comparing
with other kinds of power generations [55, 56]. Although the wavelet transform seems to be
appropriate for monitoring wind generators, it does not yield very satisfactory results when the
generator suffers from an unbalanced load or a poor excitation current [50, 54].
Additionally, the Park’s vector approach is an alternative way to detect faults, and has
been widely used to identify turn-to-turn winding fault in rotors and stators and rotor
eccentricity [55, 59]. The Park’s vector approach is able to use 2-D representation for three-
phase induction generators. The relevant equations are shown below [24]:

16
{𝑖𝑑 = √
2
3𝑖𝑎 −
1
√6𝑖𝑏 −
1
√6𝑖𝑏
𝑖𝑞 =1
√2𝑖𝑏 −
1
√2𝑖𝑐
(2.1)
In equation 1.1, the (𝑖𝑎, 𝑖𝑏 , 𝑖𝑐) are the currents of the three phases in the induction
generator, and the(𝑖𝑞 , 𝑖𝑑) are the current Park’s vector components. In this case, the Park’s
vector can be expressed as the following equations:
{𝑖𝑑 =
√6
2𝑖𝑀 sin 𝜔𝑡
𝑖𝑞 =√6
2𝑖𝑀 sin(𝜔𝑡 −
𝜋
2) (2.2)
where 𝑖𝑀 is the maximum value of the phase current; and 𝜔 is the frequency. From equation
2.2, the healthy generators can provide a perfect circle, in which √id2+iq
2 is constant. On the
other hand, if there are some winding faults in the generators, the circle will instead be elliptical,
and in this case the fault can be detected. Besides this, the frequency of the Park’s vector is
twice the fundamental frequency, and its amplitude also shows how serious the fault is [24, 59].
The advantage of the Park’s vector approach is that it can give very good results at a certain
frequency or steady state, and is sensitive to winding failures. Its drawbacks are that, using this
method, the location of winding faults cannot be determined; moreover, it cannot be used when
there are rapid changing in wind speed or the transient states [10].
2.3.2 Flux signature analysis
Flux is one of the most important characteristics in a machine. Firstly, in healthy
machines, no axial homo-polar flux is created as the current flowing in the rotor and stator
circuits is balanced. However, if winding faults occur in the electrical machine, a measurable
axial leakage flux will be created which can be detected by search coils [60, 61]. By referencing
the harmonic of the axial leakage flux, turn-to-turn winding faults in the machine can be
detected.
Additionally, air-gap flux is one of the most important parameters, and any changes in
machines are reflected in the air-gap flux and the distribution of the MMF, which can be
detected by flux sensors [62]. By using FFT, the harmonics of the air-gap flux density can be
obtained which can then be used to detect winding faults.
The flux signature analysis is able to detect failures rapidly. Furthermore, it also shows
the locations of winding faults, which reduces the repair time once technicians arrive. In this

17
case, it can be a very good online methods for condition monitoring. However, its disadvantage
is that flux sensors or search coils are required to be installed in the machine, which makes it
an invasive method [62]. Moreover, in the special environment of an offshore wind farm, flux
sensors might be damaged as well, which would be obviously reduces the reliability and
accuracy of flux signature analysis.
2.3.3 Surge test
The surge test is an established and predictive method for detecting winding faults in
both the rotors and stators, and it can also provide early warnings if weak insulation between
winding turns before short-circuit faults occur. During the test, two high frequency pulses are
injected into two phase windings of the generator with the third phase grounded. By comparing
the reflected signals, winding faults or weak insulation between turns can be detected directly
[63]. With the development of system identification technologies, surge tests can provide not
only information about insulation ageing, but can also show other parameters of machines such
as the inductance of the stator and rotor windings.
During a real experimental test, the surge test is based on offline measurement data
using a locked rotor test with DC voltage step response, AC sinusoidal voltage or a multi-
sinusoidal signal as the injected signal. By controlling the average phase voltage and injecting
the test signal, the motor can be represented in an analytical model as an RLC circuit. If there
is anything wrong with the insulation or windings, changes in the magnitude and frequency of
the reflected signal can be observed. In this way, the machine impedance can also be measured
for different DC values of the quadrature and direct-current components, which allows an
analysis to be carried out of the influence of saturation and magnetic interaction on machine
impedance. Thus the health state of an electrical machine can be monitored.
The advantage of the surge test is that it can accurately determine the location of winding
failures, and predictions can be made prior to the occurrences of faults, making it attractive for
reducing maintenance costs [64]. The drawback is that the surge test cannot set as an online
condition monitoring method for machines; moreover, it requires the machines to be stopped
which is not suitable for in-service machines. Furthermore, the surge test voltage signal is likely
to reduce the lifetime of the testing winding.
2.3.4 Temperature
All winding faults will create hotspots and excessive heat inside the machine, which
gives rise to the increasing temperature of the machine. From the knowledge of mechanisms of
winding faults, data of the heat flow and distribution of the temperature field can be used to

18
directly illustrate the progress of the failure from the initial turn-to-turn winding faults to
catastrophic damage [65]. In this case, a focus on thermal performance and the temperature in
the machine can provide an effective method of condition monitoring.
The general arrangement for monitoring winding temperatures is to use thermal sensors
or cameras. Additionally, temperature monitoring can also be accomplished by using a method
which analyses the thermal mode or a motor parameter-based method.
Firstly, a lumped thermal circuit model has been reported for the estimation of the
thermal performance of machines, which includes variables of parameters such as the thermal
resistance, capacitance and the heat source [19]. The thermal resistors provide the performance
of the heat conduction and convection inside and outside the machines. The thermal capacitors
give temperature rise of the machines, and the heat source is equated to the power losses in the
machines. By building a lumped thermal model, the temperatures of stator and rotor, and even
the windings are able to be predicted [26]. Hence, temperature condition monitoring systems
can be applied in the onshore and offshore wind farms as well as any in- service machines.
Consequently, the temperature of the windings in stators and rotors can be estimated
using calculation of motor parameters. In this method, the currents and the voltages in the rotors
and stators, the active power and the rotor speed can be measured and used to calculate the
resistance of the rotors and stators [66]. Due to the relationship between temperature and the
characteristics of materials, the winding temperatures in the rotors and stators can be estimated
with reasonable accuracy [20].
The advantage of these two methods is non-intrusive nature, where no temperature
sensors are required. Furthermore, they avoid drift errors in thermal sensors after long periods
of service [19, 20, 26]. Moreover, this technology is able to be applied in an online system,
which can give rapid response and results. Nonetheless, all the parameters to be measured are
very sensitive and are collected at certain frequencies. More specifically, the results will be not
satisfactory for transient states. Additionally, the cooling system used in different machines and
unstable conditions may lead to some deviations in data during evaluation [27].
2.3.5 Comparisons
Generally, online condition monitoring and diagnostics requires the sensing and
analysis of such signals that contain specific information which is characteristic of the
degradation process, problem or fault to be detected. Various factors need to be considered
when selecting the most appropriate monitoring technique for application in an industrial
environment. The system should meet the following requirements as blow:
1. The sensor should be non-invasive;

19
2. The sensor and instrumentation system must be reliable;
3. The diagnosis must be reliable;
4. The severity of the fault should be quantified;
5. Ideally, an estimation of the remaining lifetime should be given;
6. Ideally, a prediction of the fundamental cause of failures should be
provided via online information from the sensors.
7. Resolution and sensitivity should be as high as possible to provide more
accurate results.
Table 2-1 Comparisons of different methods of condition monitoring
Parameters
Potential
information
richness
Measurement device Possible of analysis methods
Current [7-9] Average Hall effect transducers RMS trending, phase
relationship, spectrum analysis
Voltage [51,52] Average Diagnostic Voltage
Meter
RMS trending, phase
relationship, spectrum analysis
Flux [64,65,82] Very high Search coil
RMS trending, time analysis,
spectrum analysis, statistical
methods
Vibration
[42,43,47] High Accelerometer
spectrum analysis,
Acoustics
[88,90,91] High Microphone
RMS trending, time analysis,
spectrum analysis,
Temperature
[17,36,57] Average Thermocouple
Trending, Visual interpretation
Torque [2,76] High Torque meter, encoders RMS trending, time analysis,
Table 2-I shows the basis of the several technologies for condition monitoring
referencing different parameters. Motor current signature analysis (MCSA) is the most
commonly used at the moment [7-9]. Researchers have developed many ways to conduct the
possible methods in the analysis, including RMS trending, phase relationships, spectrum
analysis and statistical methods. But MCSA cannot provide sufficient ability to discriminate

20
between different faults. Moreover, the current spectrum is also influenced by the power supply,
dynamic load and the machine geometry. Additionally, each MCSA diagnostic system will only
matches a certain type of motor which is universalizability and complex to integrate on the
control board.
However, the table 2-I shows that magnet flux detection can collect the richest
information which provide more useful information and more accurate results. It has the
capability of detecting different kinds of faults such as windings short-circuits, bearing fault
and eccentricities at the same time. The signature of the magnet flux during fault occurrence in
the motor is not influenced by machine geometry; meanwhile, data coming from the dynamic
load will provide very useful and transient information. According to previous research [29,
67], the characteristics of a failure situation do not change when the method is applied to
machines with different size, which means it can be used with any size of machine or generator.
The search coil was developed several decades ago, and in recent years many magnet sensors
have been invented which are highly sensitive and accurate. In this case, it is necessary to
develop the new magnet flux condition monitoring system using new sensors.
2.4 Magnetic field imaging and stray flux detections
Various non-invasive magnet detection devices have been applied in research. The
search coil shown in Fig 2.6 can detect motor faults. The advantage is that different types of
failure can be detected, such as turn-to-turn faults, bearing faults and broken rotor bars, and it
has been found to be more effective than MCSA. One drawbacks is that the diameter of the air
coil has to be much lower than the total height of the machine body, in order to measure the
flux in an area covering the width of several stator slots [68]. This means that different sizes of
motor require different sizes of coil.

21
Figure 2.6 Search coil (Emerson M-343F-1204) [7]
Figs 2.6 and 2.7 show the different ways in which measuring the radial magnetic field
can be measured with a sensor positioned in the vicinity of an induction machine. There is also
a compression between line current detection and radial magnetic field detection [39, 69]. The
Radial magnetic field detection is much more sensitive than MCSA. The value of the indicator
frequency (1+𝑘𝑟𝑁𝑟(1 + 𝑆))*f is 750, 850 and 1550 HZ with side band, when 𝑘𝑟= 1,-1,2.
Figure 2.7 Search coil

22
Figure 2.8 C shape magnet flux coil
The flux probe proposed here is similar to the sensor used elsewhere, consisting of a
ferrite core on which 300 turns of enameled copper of 0.1 mm2 thickness have been wound
(Fig. 2.8) [8]. The signal collected is an EMF, which is a the derivative of the flux. For this
research, measurements have been carried out with the sensors located in three different
positions in order to collect the fluxes on the axial body, radial body and end-winding of the
motor in Fig. 2.9. The dimensions of this sensor allow its use it for different sizes of motor,
placed in any type of industrial environment, and power can be supplied by the mains or by an
inverter [33, 67].
Figure 2.9 Positions of the sensor placed
Furthermore, compared with the MCSA, electrical machine are not in practice equipped
with a convenient system able to measure and analyse current online [62]. The disadvantage of
using external magnetic field analysis is that some sensitive indicators also exist in healthy
machines, especially when with the load during operation. Additionally, the machine user may
not have a record of the flux signature in the healthy mode. However, one advantage of this

23
method is that there is no requirement for the healthy former state of the machines to be
presumed. The sensor used in this method has a circular area of 8.04 cm2, with 200 turns of the
coil. The drawbacks of a coil sensor are that do not give localized information, and in order to
have more localized information, the sensor has to be small compared to the machine size.
Figure 2.10 Proposed sensor and detect position [12]
Different magnetic sensors such as search coils, and giant magnetoresistance (GMR)
sensors have been widely applied for magnetic flux measurement. Recently, search coils have
been installed at one end of the motor shaft, allowing detection of the axial magnetic flux
linkage of the machine. By analysing the different spectra in the frequency domain from
magnetic flux measurements, various kinds of defects can be detected. For example, Kokko [69]
applied a search coil with frequency analysis for the identification of different types of failure,
such as shorted turns and broken bars and end rings. Furthermore, flux leaking outside the
machine in the axial direction was detected and the threshold values of these axial flux
harmonics were set as the indicator to distinguish between faulty and healthy machines. Negrea
et al. [70] showed that measurements of the radial magnetic field with a coil sensor positioned
in the vicinity of an induction machine can detect not only stator and rotor faults, but also load
oscillations using the spectrum of static responses. Henao et al. [17, 21] also proved that leakage
flux analysis is more effective in detecting stator faults when compared to the motor current
signature analysis method. However, measurement sensitivity and bandwidth may not be
suitable for monitoring systems with different failure types. As the sensitivity of the search coil
is at a minimum for low frequencies, a sensitivity problem can arise for variable speed motor
drive systems when running at low speeds. In recent years, researchers have developed new
magnetic flux detection devices to increase measurement sensitivity, response frequency
bandwidth and accurate of monitoring systems [67]. For instance, a ‘C’ shape magnetic core
flux probe was developed by Frosini as part of an experimental sensing modality of monitoring
system measurement of multiple parameters [29]. The probe has a soft magnetic iron core,

24
which leads to a dramatic improvement in its characteristics compared with previous search
coils. However, this leads to a loss of linearity at high flux magnitudes and frequencies. One of
the disadvantages of coil sensor-based measurement instruments is that they cannot measure
static magnetic fields.
From the review of stray flux monitoring technologies above, there are several problems
and challenges which still need to be solved. Firstly, the common stray flux data is collected by
the impedance coil, which suffers from sensitivity problems at low speeds and non-linearity
problems at high supply frequency. This issue leads to the stray flux monitoring system
providing inaccuracy diagnostic result. Secondly, traditional stray flux technology only applies
to single failures and is unable to detect several simultaneous faults as well as the load
monitoring. Additionally, traditional stray flux monitoring approaches provide global
information by using a winding coil, but location information is lacking.
For magnetic sensors such as GMR sensors, the sensitivity and frequency of their
responses to magnetic fields are improved compared to coil impedance measurements. This
provides a new opportunity for the non-invasive sensing and dynamic monitoring of a motor’s
condition. GMR sensors have been applied in the field of non-destructive testing and evaluation,
such as in defect detections in ferromagnetic materials and electrical conductors. The key
advantages of GMR sensors are their high sensitivity and spatial resolution. For example, GMR
sensors have been applied to the non-destructive measurement of cracks within ferromagnetic
materials in combination with an eddy-current method in [71, 72]. This technique also allows
the detection and localization of sub-surface cracks and failures. The devices have a wide field
of application in the inspection of plates, bearings and rails to detect fatigue cracks of different
depths and orientations [71]. Nonetheless, no applications have yet been proposed for
inspection of defects in the magnetic circuit of induction machines.
2.5 Chapter summary
This chapter has carried out a comprehensive literature review focusing on the condition
monitoring of electrical machines. Condition monitoring technologies provide an extensive way
to improve the reliability of electrical machines. Moreover, the potential for reductions in
maintenance costs and downtime means that a condition monitoring system in an essential part
of an industrial drive system. A survey of potential failure modes in electrical machines was
carried out to identify the major failure types to be monitored. Based on previous research,
bearing and winding failure are the most frequent failure modes found in various types of
electrical machines. Additionally, dynamic loads are one of the major reasons which lead to

25
machine faults. Therefore, this research focuses on detecting and monitoring winding failures,
load variations and mechanical bearing failures.
Many condition monitoring technologies are available for electrical machines, each
approach has its own merits and drawbacks. Methods may be based on current, stray flux, surge
testing and temperature monitoring. A literature review and comparison of common monitoring
technologies was also carried out. Among these approaches, flux monitoring provides rich and
precise information, as flux is the most important parameter of electrical machines. To collect
flux information, several researchers have applied search coils and customized coils. However,
these impedance coils have disadvantages which include invasiveness, non-linearity, and low
sensitivity at high frequency. The problems and challenges identified in current stray flux
monitoring research also includes a lack of location information and multiple fault detection.
Therefore, this work focuses on developing a non-invasive stray flux condition monitoring
system for winding and bearing failures and load monitoring.

26
Chapter 3 Methodology
As discussed in the literature review, stray flux monitoring technology can provide rich
and precise information, and is more efficient than the traditional current signature monitoring
approach. However, current stray flux monitoring still has several and challenges, including
sensitivity at low speeds, non-linearity problems at high supply frequency, a lack of local
information, an inability to detect multiple faults. To investigate and solve these problems, this
chapter presents the methodology applied for the health monitoring of electrical machines based
on stray flux detection. The theoretical background of stray flux monitoring is discussed in
Section 3.1, including electromagnetic modelling and decoupling of the attenuation of flux
inside an electrical machine. Section 3.2 then gives the theoretical background of feature
extraction method applied in this thesis, which uses spectrograms and independent component
analysis.
Figure 3.1 Research diagram of magnetic sensor based monitoring system
Fig 3.1 shows the research diagram for a magnetic sensor-based electrical machine
condition monitoring system. This research work can be divided into several phases. The first
is to design an appropriate magnetic sensor-based monitoring system. With the help of
simulation models, the choice of sensor chosen, and the optimization of sensor detection
location and direction can be determined as well as the data acquisition transmission systems.

27
Three case studies consider load monitoring, electrical winding failures, and mechanical
bearing failure, and tests are carried out with the proposed sensing system to validates its
capability. By applying feature extraction methods, stray flux information from different
machine failures is represented through the proposed monitoring system, including
spectrograms for time-frequency information and independent component analysis.
3.1 Theoretical background of stray flux in electrical machines
The stray flux of an induction machine is created by both stator and rotor currents. The
reference frames can be transformed from the 3 phase (a-b-c axis) to the d-q axis using Clarke
transformation, and then to the 𝛾 − 𝛿 axis by Park transformation. In this case, the air gap flux
is used to link the stray flux with motor load. This air-gap flux can be expressed as follows [73]:
Ψ𝑟𝑔 = 𝑀𝑖𝛾𝑠 + 𝑀𝛾𝑟 (3.1)
Ψ𝛿𝑔 = 𝑀𝑖𝛿𝑠 + 𝑀𝛿𝑟 (3.2)
where the subscripts r and 𝛿 indicate the rotor and stator components respectively. Ψ𝑔 is the
air-gap flux; M is the mutual inductance; 𝑖𝛾𝑠, 𝑖𝛿𝑠 are the stator currents in the 𝛾 − 𝛿 axis and
𝑖𝛾𝑟 , 𝑖𝛿𝑠 are the rotor currents in the 𝛾 − 𝛿 axis respectively.
From equations 3.1 and 3.2, both the stator current and rotor current affect the magnetic
field in the air gap. The air gap flux is given by:
𝐵𝑎𝑔 = ∑ 𝐵 sin(𝐾𝜔𝑡 − 𝑚𝜙 − 𝜑𝑘,𝑚)𝑘,𝑚 (3.3)
where B is the component magnitude, 𝐵𝑎𝑔 is the magnetic flux density in the air gap at a given
point, m is the number of pole pairs, 𝜔 is the angular speed, 𝑘 is the harmonic rank, 𝜙 is the
angular position, and 𝜑𝑘,𝑚 is the initial phase. To show the stray flux model of an electrical
machine, several assumptions and simplifications need to be made as below:
1. The slot effect of a machine is not considered in this model, which is replaced
by a smooth air gap between stator and rotor as shown in Fig 3.2.
2. The geometry of the whole machine is complex. Thus, it is assumed that there
is no air gap between the stator yoke and external frame.
3. To reduce the influence of end windings, the length of the electrical machine is
made infinite.
4. The magnetic properties of the materials are constant.

28
Figure 3.2 Schematic of stray flux in the machine
To build a stray flux model for a machine, the magnetic vector potential can be set as 𝐴,
the magnetic permeability 𝜇, and electrical conductivity 𝜎. Thus the relationship among them
can be expressed as below:
∇ × ∇ × �� = −𝜇 𝜎𝜕��
𝜕𝑡 (3.4)
If the eddy current in the laminations is not considered, the conductivity 𝜎 is zero, and
then ∇ × ∇ × �� = 0.
To analyse the radial field of stray flux, the magnetic vector potential 𝐴 is oriented
through the Z direction of the machine, which is perpendicular to the machine frame. In this
case, 𝐴𝑥,𝜙 is directly related to the distance between the sensor location and machine centre 𝑥
and the angular position 𝜙. If only one magnetic field component is considered at the specific
frequency 𝐾, then 𝐴𝑥,𝜙 varies sinusoidally.
Thus, 𝐴𝑥,𝜙 can be shown as:
𝐴𝑥,𝜙 = ℜ⌊𝐴𝑥,𝜙𝑒𝑗𝜔𝐾𝑡⌋ (3.5)
where ℜ is the real part of the 𝐴𝑥,𝜙 complex quantity, and 𝑗 is the complex number, where 𝑗2 =
−1.
In this case, equation 4 can be transferred into a cylindrical referential:

29
𝜕2𝐴𝑥,𝜙
𝜕𝑥2 +1
𝑥
𝜕𝐴𝑥,𝜙
𝜕𝑥+
1
𝑥2
𝜕2𝐴𝑥,𝜙
𝜕𝜙2 = 𝑗𝜇𝜎𝜔𝐾𝐴𝑥,𝜙 (3.6)
From equation 3.6, it is noticed that if the eddy current is considered in the analytical
model, then the results will be related to the angular frequency 𝜔𝐾. Otherwise, the value of
𝑗𝜇𝜎𝜔𝐾𝐴𝑥,𝜙 in equation 6 is null.
3.1.1 Attenuation of stray flux in the machine
To investigate the relationship between stray flux and air gap flux, the coefficient of
attenuation can be presented as the ratio of the magnitude of flux. In this case, it is likely that
the reduction and shifting of stray flux due to the influences of stator lamination, external frame
and external air can be decoupled into three different coefficients as shown below.
𝐾 = 𝐾𝑠𝑙𝐾𝑒𝑓𝐾𝑎𝑖𝑟 (3.7)
where 𝐾𝑠𝑙 , 𝐾𝑒𝑓 𝑎𝑛𝑑 𝐾𝑎𝑖𝑟 are the coefficients of the stator lamination, external frame and
external air stray flux respectively. Each different part of the electrical machine provides a
different coefficient because of its different material and electromagnetic properties. These
three coefficients are presented as the ratio of magnitude of flux density from the one at the
inlet of the machine’s part to the one at the outlet as shown in Fig. 3.3. By calculating the
individual coefficient of each part, the link between stray flux outside the machine frame and
air-gap flux can be illustrated.
Figure 3.3 Decoupling of attenuation
In this case, by solving the equation 3.6, these three coefficients can be determined
separately. The variable separation method is applied to determine the solutions, as below:
𝐴𝑥,𝜙 = 𝐴𝑥
𝐴𝜙 (3.8)
From equation 3.8, the subsequent equations are shown below:
{𝐴𝜙 ′′
+ 𝑖2𝐴𝜙 = 0
𝐴𝑥 ′′
(𝑥) +1
𝑥𝐴𝑥 ′
(𝑥) − (𝑖2
𝑥2+ 𝑗𝜇𝜎𝜔𝐾) 𝐴𝑥
(𝑥) = 0 (3.9)

30
The first formula in equation 3.9 can be represented with real variables, where the
solutions of the sine functions are: 𝐴𝜙 = 𝛾1 cos 𝑖 𝜙 + 𝛾2 sin 𝑖𝜙. Additionally, due to the period
of sine wave, 𝐴𝜙(2𝜋) = 𝐴𝜙(0), the term 𝑖 is an integer in the variable separation method. Thus,
the solution can be illustrated as follows:
𝐴𝑥,𝜙 = ∑ 𝐴��𝑖 (3.10)
where 𝐴�� = 𝐴𝑥,𝑖 𝐴𝜙,𝑖
The relationship between flux density and the vector potential can be shown as:
�� = ∇ × 𝐴 (3.11)
Because this project mainly focuses on the radial stray flux of electrical machines, the
flux density �� can be assumed to be the sum of the directional Z, Y components, which are 𝑏𝑍
and 𝑏𝑌 respectively. Both components can be written in a cylindrical referential:
{𝑏�� =
1
𝑥
𝜕𝐴𝑖
𝜕𝜙
𝑏𝑌 = −
𝜕𝐴𝑖
𝜕𝑥
(3.12)
Consequently, to solve the equations above, the boundary conditions need to set as the
conservation of 𝑏𝑍 and 𝑏𝑌 . Additionally, the flux density at the inner surface of the stator
laminations is the same as that in the air-gap. In this case, one certain air gap flux density
component can be presented as below:
𝑏�� = 𝐵𝑒−𝑗𝑚𝜙 (3.13)
This means that 𝑏 = ℜ⌊𝑏��𝑒𝑗𝜔𝐾𝑡⌋
So the attenuation coefficient K can be expressed as the ratio between two flux densities
in the different positions:
𝐾 =|𝑏𝑧
(𝑥=𝑅𝑜𝑢𝑡)|
|𝑏𝑧 (𝑥=𝑅𝑖𝑛)|
(3.14)
3.1.2 Analytical model of stray flux
If the eddy current of the machine is not considered, and the 𝜎 = 0,thus equation 3.8
gives :

31
{𝐴𝜙 ′′
+ 𝑖2𝐴𝜙 = 0
𝐴𝑥 ′′
(𝑥) +1
𝑥𝐴𝑥 ′
(𝑥) − (𝑖2
𝑥2) 𝐴𝑥 (𝑥) = 0
(3.15)
By referring to equation 3.9, the solution of the stray flux model without eddy current
is then:
𝐴�� = 𝐴𝑥,𝑖 𝐴𝜙,𝑖
= (𝜆1𝑥𝑖 + 𝜆2𝑥−𝑖)(𝛽1𝑒𝑗𝑖𝜙 + 𝛽2𝑒−𝑗𝑖𝜙) (3.16)
In this case, 𝑏𝑍 and 𝑏𝑌
are represented in the cylindrical reference:
{𝑏�� =
1
𝑥
𝜕𝐴𝑖
𝜕𝜙= 𝑖𝑗(𝜆1𝑥𝑖−1 + 𝜆2𝑥−𝑖−1)(𝛽1𝑒𝑗𝑖𝜙 − 𝛽2𝑒−𝑗𝑖𝜙)
𝑏𝑌 = −
𝜕𝐴𝑖
𝜕𝑥= −𝑖(𝜆1𝑥𝑖−1 − 𝜆2𝑥−𝑖−1)(𝛽1𝑒𝑗𝑖𝜙 + 𝛽2𝑒−𝑗𝑖𝜙)
(3.17)
As mentioned in the previous section, the flux density at the inner surface of stator
laminations is equal to that in the air-gap in equation 3.13. In terms of equations 3.13 and 3.17,
𝑖 = 𝑚, 𝛽1 = 0 and 𝛽2 = 𝑗. To derive the 𝜆1𝑎𝑛𝑑 𝜆2, the conservation of 𝑏𝑍 and 𝑏𝑌
needs to be
considered.
3.1.2.1 Stray flux in air
If the distance between the stray flux detection point and the centre of the machine is
infinite, the values of 𝑏𝑍 and 𝑏𝑌
should be null, which leads to 𝜆1 = 0 , Additionally, the
magnitudes of 𝑏𝑍 and 𝑏𝑌
are the same and shifted by 𝜋
2 . To determine the coefficient of external
air, the ratio can be shown as :
𝐾𝑎𝑖𝑟 = (𝑥
𝑅𝑜𝑢𝑡𝑒𝑓 )−𝑚−1 (3.18)
3.1.2.2 Stray flux in stator lamination
As several assumptions have been made at the beginning of this Chapter, and the
coefficient 𝐾𝑠𝑙 is related to the material properties of the stator lamination. By setting 𝜇𝑠𝑙 as
the relative magnetic permeability of the stator lamination, the coefficient 𝐾𝑠𝑙 is:
𝐾𝑠𝑙 =2
(𝜇𝑠𝑙+1)(𝑅𝑖𝑛
𝑠𝑙
𝑅𝑜𝑢𝑡𝑠𝑙 )−𝑚−1−(𝜇𝑠𝑙−1)(
𝑅𝑖𝑛𝑠𝑙
𝑅𝑜𝑢𝑡𝑠𝑙 )𝑚−1
(3.19)
So the coefficient of attenuation in stator lamination, 𝐾𝑠𝑙 , is related to the
internal/external radius of the stator, pole pair number and magnetic permeability.

32
3.1.2.3 Stray flux in external frame
The coefficient of the external frame, 𝐾𝑒𝑓, provides the attenuation ratio of magnetic
flux density through the machine frame. To simplify the analytical model, eddy current is also
neglected in this section. By setting 𝜇𝑒𝑓 as the relative magnetic permeability of the external
machine frame, the 𝐾𝑒𝑓 is shown as below:
𝐾𝑒𝑓 =2
(𝜇𝑒𝑓+1)(𝑅
𝑖𝑛𝑒𝑓
𝑅𝑜𝑢𝑡𝑒𝑓
)−𝑚−1−(𝜇𝑒𝑓−1)(𝑅
𝑖𝑛𝑒𝑓
𝑅𝑜𝑢𝑡𝑒𝑓
)𝑚−1
(3.20)
By identifying these three coefficients, the attenuation of magnetic flux can be found.
The relationship between air-gap magnetic flux and stray flux outside the machine frame can
be derived by calculating the change in ratio due to the lamination, frame and external air. The
simplified analytical model implies that the stray flux is likely to be the same as the air-gap
magnetic flux. In this case, the stray flux can reflect any abnormality of the air gap flux, as the
air-gap flux is the most important parameter showing the state of the electrical machine. The
analytical model of attenuation coefficients thus gives the theoretical background to support the
stray flux health monitoring of electrical machines. The magnitude of stray flux depends on the
parameters of radius of the rotor and frame, the number of pole pair and the magnetic
permeability of the lamination and external frame.
To validate the analytical model, this stray flux model is applied to one of the induction
machines in the experiment research, which is a three-phase wound rotor induction machine
with ratings of 59kW rated power and 1500rpm rated speed with no load. The parameters are
the 𝑅𝑖𝑛𝑠𝑙 is 130mm, 𝑅𝑜𝑢𝑡
𝑠𝑙 is 150mm, 𝜇𝑠𝑙 is 1000, 𝑅𝑖𝑛𝑒𝑓
is 150mm, 𝑅𝑜𝑢𝑡𝑒𝑓
is 153mm, 𝜇𝑒𝑓 is 1.5. If
the amplitude of magnetic flux in the airgap is around 1.8T, considering the pervious analytical
model and attenuation coefficients, the amplitude of magnetic flux on the machine’s frame with
2mm lift-off is around 3.4mT. The numerical simulation result of the stray flux in this machine
is shown in chapter 4. In this case, the analytical model can provide a general idea with the stray
flux situation of the electrical machine.
3.2 Feature extraction and analysis of stray flux information
Further signal processing is required to extract the features and characteristics from stray
flux data, in order to assess an electrical machine’s health state. In this section, the spectrogram
is presented which shows the time-frequency features of the machine.

33
The aim of time-frequency analysis is to transfer a signal into the frequency domain as
a function of time. The Short Time Fourier Transform (STFT) is the Fast Fourier Transform
with a fixed moving window which is shorter than the total length of the signal. The short
window leads to a good localization of the frequency components in time.
The spectrogram is a square modulus of the fixed windowed Fourier transform of a
signal:
S𝑥(𝑡, 𝑣) = |∫ 𝑥(𝑠) ∗ ℎ(𝑠 − 𝑡) ∗ 𝑒−𝑖∗2𝜋𝑣𝑠𝑑𝑠+∞
−∞| (3.21)
where 𝑥(𝑠) is the temporal signal, ℎ(𝑠 − 𝑡) is the window conjugate form and 𝑣 is the
frequency. By applying the short-time Fourier transform (STFT) to the test data, transient
information from the stray flux data is expressed out in the time-frequency domain
Figure 3.4 STFT of a signal with a fixed window
As shown in Fig 3.4, the STFT provides a pattern of time and frequency, which localizes
the spectrum in the time domain. In this case, the different harmonics of electrical machines
can be illustrated with time variation. Especially during transient states such as start up and with
speed variations, the spectrogram presents an overall idea about the changing harmonics, which
is useful in stray flux feature extraction.
3.3 Chapter summary
This chapter explains the overall research methodology in this PhD project, including a
description of the research diagram, stray flux monitoring technology and the feature extraction

34
method. Based on the challenges summarized in chapter 2, the proposed magnetic sensor
monitoring system is to be designed with the help of simulation results. The proposed stray flux
system is implemented in different experimental studies to monitor the load state, and winding
failures and bearing failures in the following chapters.
The theoretical background of stray flux in electrical machines is shown in Section 3.1.
By making several assumptions, a simple analytical model is built to represent the relationship
between air-gap flux density and stray flux, which is influenced by the geometry of the machine
and the electromagnetic properties of the stator lamination and external frame only. As the air-
gap flux is an important parameter for the monitoring of an electrical machine and the analytical
model, the proposed stray flux monitoring system is also able to show the abnormality of the
electrical machine. Additionally, the feature extraction method in this research is explained in
Section 3.2, which was the Short Time Fourier Transform. The STFT can provide a spectrogram
of the harmonics in electrical machines depending on the time variation. In a transient state, the
spectrogram shows the pattern of distribution of and changes in harmonics. The measurement
data and signal processing results with different failures in machines are considered in the
following chapters.

35
Chapter 4 Monitoring System
Design
In the previous chapter, the theoretical background of stray flux monitoring technology
is introduced. In this chapter 4, the design of the stray flux condition monitoring system is
presented. More specifically, this chapter explains the choice magnetic sensor, sensor location
for the measurement of stray flux, the magnetic sensor array, wireless sensor network and data
acquisition system design. Due to the condition monitoring design, the proposed monitoring
system shows the capability to collect weak magnetic flux information with very high sampling
frequency.
4.1 Choice of sensor
Stray flux condition monitoring technology depends strongly on a sensitive magnetic
sensor to collect weak magnetic flux signals. Thus, to choose suitable magnetic sensor in the
proposed monitoring system is of considerable importance. There are several commercial
candidates for the magnetic sensor in the system design these include the giant magnetoresistive
(GMR), anisotropic magnetoresistive (AMR) and Hall sensors. However, AMR sensors have a
very low magnetic measurement range and are thus not suitable for this research.
Figure 4.1 Schematics of three different magnetic sensors

36
There are several ferromagnetic metallic films separated by thin nonmagnetic layers in
a GMR sensor, as shown in Fig 4.1. When a GMR sensor is affected by a magnetic field, the
resistant of the sensor will change dramatically. NVE AA002 GMR sensors are used in this
research work, and they can provide an output signal of a maximum of 200mV with a 5V power
supply. One of this advantages is that the GMR sensor has a large detection range of magnetic
strength with different levels of output voltage. Additionally, the sensitivity of the device is
improved due to the embedded magnetic flux concentrators.
The Hall device is an alternative choice for magnetic flux signal detection. Once an
electron is influenced by a magnetic field, it will be affected by the Lorentz force which leads
to a perpendicular move in the direction of both the magnetic field and of the movement of the
electron. In this case, if there is a current flowing through a magnetic field, a difference in the
electrons will appear between two sides, which is the output of the Hall devices. In practice, the
output of a Hall device is quite small, and therefore a built-in amplifier is need to magnify the
signal and reduce noise. In these circumstances, the outputs of most Hall devices are absolute
values.
Table 4-1 General comparisons of three different sensors
Table 4-I shows a general comparisons of three different sensors in the commercial
market. Although the Hall sensor has a larger magnetic dynamic range than GMR sensors, the
latter are more sensitive than the AMR and Hall sensors, and have higher resolution.
Additionally, the bandwidth of GMR sensors is much higher than that of Hall sensors. In this
case, NVE AA002 GMR sensors are used in this research project.
4.2 Sensor location for measuring stray flux
Stray flux is a magnetic flux that radiates from inside the machine frame and is
inherently and strictly connected to the magnetic state of the machine. Stray flux is induced by
stator and rotor current; both of which produce magnetic flux with different spectral
components. Depending on the physical location around the motor body where the

37
measurement is performed, the magnetic field can contain information about the state of both
the stator and rotor states, which are reflected in different spectra.
Traditionally, the stray flux method uses detection-coil transducers mounted on the
device to be tested. However, recent work has focused on the detection of radial magnetic fields,
and these magnetic fields can be studied by means of sensing in the axial and radial directions.
To design and select appropriate sensor specifications and locations for installation,
simulation on the targeted motors has been carried out in order to understand the strength and
distribution of stray magnetic flux. In this case, monitoring the health of a motor can be
achieved. The simulation model of the induction machine used for bearing fatigue tests in
chapter 5 (Fig 4.2(d)) has been built to find the magnetic sensor specifications and installation
location. An FEA simulation model is shown in Fig 4.2(a). Fig 4.2(b) shows the 3D distribution
of the magnetic flux under a typical operating current of 15 A, and Fig 4.2(d) indicates the
distributions of magnetic flux outside the cage. From the simulation results, the location of the
strongest leakage field and magnetic field change is in the middle of the cage, as highlighted in
Fig 4.2(b). In addition to the location, Fig 4.2(d) illustrates three different directions and their
variations at the detection point, where the z-direction provides the strongest magnetic flux in
the simulation (5mT). Compared to the analytical result in Chapter 3, there is a slight difference
between the numerical result (5mT) and analytical one (3.4mT), which may due to the eddy
current effect and material property. From the numerical results, the sensor location identified
is in the middle of the cage, in the z-direction, in order to monitor the magnetic flux field of the
induction machine.
(a) FEA model of tested induction machine

38
(b) Magnetic field distribution of the machine
c) Magnetic field flux distribution outside the cage

39
(d) Magnetic flux density in three directions
Figure 4.2 Simulation results of the target induction machine
4.3 Wireless sensor network
Traditional wire-based monitoring systems require long periods of deployment and
entail significant costs for cable installation. With the recent maturity of wireless
communication techniques, one of the recent challenges for the structural engineering
community is the emerging wireless condition monitoring system, which provides a promising
solution for rapid, accurate and low-cost structural monitoring.
However, the existing wireless communication protocol, IEEE 802.15.4, and wireless
hardware motes (e.g. Mica2, MicaZ and TelosB) in wireless sensor networks are designed for
low data rates and low computation applications, which make it is impossible for all of the data
to be transmitted to a central server that carries out centralized data processing and feature
extraction. To achieve a practical wireless sensor and actuator network for condition
monitoring, the wireless senor nodes must be armed with some kind of distributed data
processing and compressive sensing capabilities, so that the amount of data to be transmitted
over the wireless link can be reduced.
The designed wireless node features with a TMS320F28335 digital signal processor
(DSP) and an improved IEEE 802.15.4 wireless data transducer with data rates up to 2Mbps.
4.3.1 Hardware architecture
In the base board, one distinct feature of the TMS320F28335 microcontroller is the
capability for high-speed data acquisition. The direct memory access (DMA) module on the
0 0.05 0.1 0.15 0.2 0.25 0.3 0.35 0.4 0.45 0.5-6
-4
-2
0
2
4
6
8
Time(s)
Magnetic flu
x d
ensity (
mT
)
X-direction
Z-direction
Y-direction

40
TMS320F28335 allows the wireless PZT node to collect sensor data at a sampling rate up to
10MHZ with 12-bit ADC of 6.25Msps. The core of the base board is the distributed data
processing unit. The radio board contains an ATSAMR21G18 microcontroller, DSP module
interface, time synchronization and an RF module.
4.3.1.1 Base board
A typical smart wireless sensor node has limited memory, computational ability and
battery power. These conditions should be taken into account when the compressive sensing
algorithm is embedded into a wireless sensor board. The base board should be chosen according
to following conditions. Firstly, it should have an SPI or I2C interface to communicate with the
RF board; secondly, it should support high data transmission rates for large amounts of lamb
waves or other complex signals; thirdly it should support high enough crystal frequency; and
finally it should support sufficient memory storage for the data cache. For low-cost low-power
measurement devices, the programmable DSP could be an efficient digital, programmable and
real-time platform.
Figure 4.3Circuit prototype of: (a) radio board; (b) base board
The radio board is a four-layer PCB with roughly the size of a Texas Instruments
TMS320F28335 microcontroller (real-time digital signal processor with controller features of
(the Delfino-family) in the base board, running at up to a clock frequency of 150MHZ, adopted
in the wireless sensing node to execute high sampling rates of data acquisition and onboard data
processing. Additional important features of this DSP are the on-board DMA-controller, 16-bit
enhanced pulse-width modulators PWM (HR-EPWM), 12-bit multi-channel sampling/hold
circuit, internal flash memory of the program, and floating point hardware arithmetic. The
PWM works at a clock frequency of 100MHZ and can be used for precise digital-to-analog

41
conversion (DAC) or to trigger analog-to-digital conversion (ADC). The DSP chip also
includes a multiplexed ADC of 12-bits resolution with a conversion rate of up to 10MHZ or
more and it has 2 simultaneous sample-and-holds. So, this chip has high performance digital-
to-analog and analog-to-digital conversion without extra components. In this board, the P8 I/O
interface and P9 analog interface connector are used to communicate with the RF board and to
acquire sensor data respectively. The ADCL0 pin should be connected to the GND pin to make
sure that the ADC module in the DSP adopts the internal reference voltage.
4.3.1.2 Radio board
The radio board detailed in Figure 4.3 is employed in this research. The Atmel SMART
SAM R21 board with a low-power microcontroller ATSAMR21G18 is chosen. It adopts a 32-
bit ARM Cortex-M0+ Processor and an integrated ultra-low power RF233 as 2.4GHz ISM band
transceiver with a maximum data rate of 2Mbps. These devices are available in 48-pin packages
with up to 256KB Flash and 32KB of SRAM and operate at a maximum frequency of 48MHz.
Sensor data is sent from the DSP board using the SPI bus (PB03, PB22, PB02 and PB23
from Table 1) to the respective in radio board. The radio board is a two-layer PCB and its size
is roughly, as shown in Figure 4.3(a). The two vertical header pins are shown on the right side
and bottom side. The 4-pin horizontal headers interface with the base board and map to specific
pins on the vertical headers (SPICLK, SPISIMO, SPISOMI, SPISTA in Table 4-1 to enable
external data access from the base board. In transmitting state, the radio board consumes 35.5
mW of power (26 mA of power at 1.8 V) but less than 2 μW of power (1.1μW of power at 1.8
V) in power down mode.
Table 4-2 Signals transmitted through bus connections
Symbol Signal Symbol Signal
PB03 SPI clock ADCINA0 ADCA0 input
PB02 SPI output GND1 GND for ADCA0
PB22 SPI input ADCINB0 ADCB0 input
PB23 SPI chip GND2 GND for ADCB0
+5V Input supply voltage ADCL0 Internal/external select
GND0 Input GND GND3 GND for ADCL0
SPICLK SPI clock SPISIMO SPI input
SPISTA SPI chip SPISOMI SPI output

42
4.3.1.3 The architecture of high sampling rate operation
The flowchart in Fig 4.4(a) demonstrates the typical data sampling cycle of the
conventional design, such as prototypes of wireless nodes, Telosb motes, Imote2, and MICA
motes. These conventional motes have an internal 12-bit ADC in the microcontroller. The
microcontroller sends a clock signal and control signals to the ADC to trigger sampling cycle
conversion. The internal buffer is set up to get data from the ADC. The reading takes 12 periodic
operations and an ADC clock signal is generated in each period to fill the buffer bit by bit. After
all of the data has been read out entirely, the microcontroller provides a clock signal and control
signals to the on-board flash. Before writing the data into the flash bit by bit, the microcontroller
takes some instructions to send the address to the flash. The flash saving operation also takes
12 periodic operations, each of which involves several instructions and a few clock cycles.
Then, the sampling cycle ends and another sampling cycle may start. This architecture clearly
reveals the inefficiency of the wireless sensor node designed with an ordinary microcontroller.
FIFO input
DMA
controller
FIFO output
SRAM
controller
ADC clock
Sampling
Read ADC
Flash clock
Increase flash addr.
Write flash
END
Finished?
Internal
Buffer
Finished?
Flash
12-bit
ADC
YES
NO
YES
NO
1 bit
1 bit 12-bit
ADC
Internal
DMA buffer
16 bits
Clock
generator
S
R
A
Maddr
16 bits
ADC clock
SRAM clock
DMA clock
12 bits
(a) (b)
Write SPI to RF Write SPI to RF
Finished?
YES
END
NO
Figure 4.4 (a) Typical data sampling cycle of conventional wireless sensor node; (b)
improved sampling operation implemented in the designed wireless sensor node
Figure 4.4 (b) presents an improved sampling design using the TMS320F28335 chip.
The chip has some internal controllers, including a first-in-first-out (FIFO) DMA controller for

43
sampling data input and output, an SRAM controller, and a clock generator. The DMA
algorithm has been widely used to allow hardware to access memory independently. To enable
a wireless sensor node for high speed applications, various algorithms such as the semi-DMA
approach are applied to extend the traditional architecture of the wireless sensor node. In our
design with the DMA controller, the main TMS320F28335 microcontroller chip can be released
from the task of data transfer. Sampling data transfer and data acquisition can be more efficient
when the DMA is adopted. The 12-bit sampling data is acquired by the ADC and saved into the
internal DMA buffer in FIFO input mode by the DMA controller. Meanwhile, the DMA
controller and address controller controls the data to access the SRAM in FIFO output mode.
The sampling data is moved from the internal DMA buffer to SRAM at 16-bit length, which is
the I/O width of SRAM. Each clock cycle has 8 continuous sampling operations and one writing
operation for writing data for SRAM. As a result, sampling data are encapsulated according to
bit alignment in the internal DMA buffer and the DMA, ADC, and the SRAM can be fully
utilized without compromise.
4.4 Chapter summary
This chapter provides a detailed description of the design of the proposed condition
monitoring system. In comparison with other magnetic sensors, GMR sensors can provide a
large detection range, high sensitivity and high bandwidth, and are used in this research work.
By using an FEA model, the stray flux density distribution of the electrical machine is illustrated.
Depending on the simulation results, the location in which to place the GMR sensor is
determined, which is at the middle of the machine’s external frame. Additionally, the z-
direction of the stray flux provides the strongest signal among the three directions. Subsequently,
the NI USB-6125 card is applied for the wire data acquisition system with a fully functional
Labview program. Moreover, the wireless sensor network is also built to achieve wireless
communication and high sampling rates of data acquisition. In this chapter, the entire stray flux-
based condition monitoring system is designed, including the magnetic sensing system, data
acquisition system and data transfer system. The monitoring system is ready for evaluation in
different case studies involving load variation, winding failures and mechanical bearing failures.

44
Chapter 5 Load monitoring system
In the literature review, load variation was found to be the one of major reasons for
failure in electrical machines. Thus, it is essential to monitor abnormal load and to estimate the
machine characteristics. Existing load monitoring methods for electrical machines are generally
effective, but suffer from sensitivity problems at low speeds and non-linearity problems at high
supply frequencies. Unlike to the conventional methods of measuring stator and/or rotor voltage
and current, the proposed stray flux system measures the magnetic field at specific locations
and provides time-spectrum features, load response time and stator/rotor characteristics. In this
chapter, the proposed GMR condition monitoring system is used to illustrate the load state of
the machines. Three induction motors with different initial loading profiles are tested on two
separate test benches and the results are analysed in the time-frequency domain. Their steady-
state features and dynamic load response times through spectrograms under variable loads are
extracted and correlated with load variations based on spectrogram information.
5.1 Vsd induction motor drive
This section describes the variable speed drive (VSD) induction motor and gives a
mathematic model of the system. The VSD system consists of an outer speed controller loop,
inter field-oriented controller (FOC), pulse-width-modulation (PWM) and voltage-source
inverter (VSI), induction motor, the load system and the bearing to be monitored. The induction
motor is coupled to a load through a shaft that is supported by the bearing. When the bearing
suffers from degradation, it produces additional frictional force or unexpected torque to the
shaft. As a result, the additional friction and unexpected torque will have impacts on the motor
and VSD. The basic idea of the proposed non-destructive test approach is to monitor the status
of the bearing by detecting the changes in VSD performance.
The concept of the FOC implies that the current components supplied to the induction
motor are oriented in phases (flux component) and in quadrature (torque component) to the
rotor flux vector. This is achieved by controlling not only the magnitude and frequency of the
inverter output voltage, but also its phase angle and thus the instantaneous position of the rotor
flux. Since the three-phase voltages, currents and fluxes of induction motors can be analysed in

45
terms of complex space vectors, in the VSD system control is based on projections that
transform a three-phase time and speed-dependent system (i.e. the IM) into time invariant
system with two coordinates which are the d and q frame. As a result, from the viewpoint of
the speed controller, the actual control input of three phase stator currents are represented by a
vector, and this enables the implementation of a PI controller in VSD.
The rotor’s position 𝜃𝑟 is measured by an encoder and fed to a counter lock that
calculates the position of the rotor flux (d-axis) represented by angle 𝜃𝑒 and the electrical rotor
angular speed 𝜔𝑟 . Given the rotor speed reference 𝜔𝑑 (measured in electrical rotor angular
speed), the speed difference 𝜔𝑑 − 𝜔𝑟 between the desired speed 𝜔𝑑 and actual speed 𝜔𝑟 is fed
to the speed controller 𝐺𝑐(𝑠). According to the dynamics of the motor and load, the controller
𝐺𝑐(𝑠) computes how much torque current 𝑖𝑞𝑠 is needed so that enough electrical torque will be
generated to adjust the rotor’s rotation towards the expected speed. The flux current 𝑖𝑑𝑠 is
specified by the flux function. The outputs [𝑖𝑑𝑠, 𝑖𝑞𝑠] of the speed controller are sent to the FOC
to drive the motor. With the aid of knowledge of the rotor flux position 𝜃𝑒, the FOC applies the
inverse Park and Clarke transformation to [𝑖𝑑𝑠, 𝑖𝑞𝑠] and decides the required three phase
currents [𝑖𝑎∗ , 𝑖𝑏
∗ , 𝑖𝑐∗]. At this stage, the magnitude, frequency and phase of the three phase currents
are adjusted and oriented to the field of flux. The outputs of the FOC are fed to the pulse width
modulation (PWM) and voltage inverter block to generate the actual control voltages/currents.
If additional friction or unexpected torque is caused by degradation in the bearing system, the
dynamics of the control target (that is, the motor, bearing and load) will change, which results
in the VSD’s response with a speed adjustments. The performance of the VSD can be measured
by the magnetic sensor through changes in the magnetic field.
5.1.1 Modelling of the VSD system
5.1.1.1 Dynamics of IM in dq-coordinate
The dynamics of voltages, currents and flux of a general induction motor can be
described as follow [xx]:
(5.1)
(5.2)
where 𝑉 = [𝑣𝑎 𝑣𝑏 𝑣𝑐 𝑣1 𝑣2 𝑣3]𝑇 are the voltages applied to each stator and rotor phase; 𝐼 =
[𝑖𝑎 𝑖𝑏 𝑖𝑐 𝑖1 𝑖2 𝑖3]𝑇 are the phase currents and Ψ = [𝜓𝑎 𝜓𝑏 𝜓𝑐 𝜓1 𝜓2 𝜓3]𝑇 are the fluxes linked

46
to each rotor and stator phases. R and L are the resistance matrix and inductance matrix
respectively.
For an ideal induction motor, the d-axis of the synchronously rotating frame is aligned
with the rotor flux linkage, so that 𝜆𝑟𝑞 and 𝑑(𝜆𝑟𝑞)/𝑑𝑡 are both equal to 0, where 𝜆𝑟𝑞 is the q-
axis rotor flux linkage. Applying the Clarke and Park transformations to the equations above,
the induction motor in dq-coordinate can be expressed in a synchronously rotating reference
frame as [62]
𝑑 𝑥
𝑑𝑡= 𝐴 𝑥 + 𝐵 𝑢 (5.3)
For an ideal field-oriented induction motor drive, given the stator current [𝑖𝑑𝑠 𝑖𝑞𝑠] in the
dq-coordinate, the torque generated by the motor is:
𝑇𝑒 = (3
4𝑝
𝐿𝑚2
𝐿𝑟𝑟𝑖𝑑𝑠) 𝑖𝑞𝑠 = 𝐾𝑡𝑖𝑞𝑠 (5.4)
where p is the number of motor poles, 𝐿𝑚is the stator-rotor mutual inductance matrix, and 𝐿𝑟𝑟
is the rotor self-inductance matrix.
Given the load torque 𝑇𝐿 , torque disturbance Δ𝑇, equivalent friction factor 𝐵 of the
bearing, and the total mechanical inertia constant J of the motor and load, the dynamics of the
rotation speed can be described by:
𝑇𝑒 = (𝑇𝐿 + Δ𝑇) + 𝐵𝜔𝑟 + 𝐽𝑑𝜔𝑟
𝑑𝑡 (5.5)
5.1.1.2 Transient time analysis of the VSD system
Thus the dynamic behaviour of the whole VSD with load and bearing friction can be
reasonably represented by the control system block diagram as shown below in Figure 5.1. The
FOC is indeed a feed-forwarded controller to actuate the motor at the torque current demanded
by the speed controller. In the model of VSD dynamics, both the FOC and IM are regarded as
an actuator to generate electromagnetic torque 𝑇𝑒 according to the torque current 𝑖𝑞𝑠.

47
Figure 5.1 System model of VSD behaviour
The transfer function from the torque current 𝑖𝑑𝑠 to rotational speed 𝜔𝑟 is:
𝐺𝑝(𝑠) =𝐾𝑡
𝐽𝑠+𝐵 (5.6)
This can be rewritten as:
𝐺𝑝(𝑠) =𝐾𝑡/𝐽
𝑠+𝐵/𝐽=
𝑏
𝑠+𝑎 (5.7)
where 𝑎 = 𝐵/𝐽 and 𝑏 = 𝐾𝑡/𝐽. It can be noted that the dynamics of the motor, load and bearing
system are those of a first-order system.
The transfer function for a PI speed controller is:
𝐺𝑐(𝑠) = 𝐾𝑃 +𝐾𝐼
𝑠 (5.8)
The closed loop transfer function from the speed reference Ω𝑑(𝑠) to the actual speed
Ω𝑟(𝑠) is
𝐺(𝑠) =Ω𝑟(𝑠)
Ω𝑑(𝑠)=
𝐺𝑐(𝑠)𝐺𝑝(𝑠)
1+𝐺𝑐(𝑠)𝐺𝑝(𝑠) (5.9)
where the upper letters denote the Laplace transform of corresponding signals.
By algebraic manipulation, the closed loop transfer function can be rewritten as a second
order dynamic system with one zero:
𝐺(𝑠) =
𝐾𝑡𝐾𝐼𝐽
(𝐾𝑃𝐾𝐼
𝑠+1)
𝑠2+𝐾𝑡𝐾𝑃+𝐵
𝐽𝑠+
𝐾𝑡𝐾𝐼𝐽
(5.10)
Substituting 𝑎 = 𝐵/𝐽 and 𝑏 = 𝐾𝑡/𝐽 into this equation above gives:
𝐺(𝑠) =𝑏(𝐾𝑃𝑠+𝐾𝐼)
𝑠2+(𝑎+𝑏𝐾𝑝)𝑠+𝑏𝐾𝐼 (5.11)

48
𝐺(𝑠) =𝑏𝐾𝐼
𝑠2+(𝑎+𝑏𝐾𝑝)𝑠+𝑏𝐾𝐼 +
(𝑎+𝑏𝐾𝑃−𝑎)𝑠
𝑠2+(𝑎+𝑏𝐾𝑝)𝑠+𝑏𝐾𝐼 (5.12)
Let 𝐾𝑃 =2𝜁𝜔0−𝑎
𝑏 and 𝐾𝐼 =
𝜔02
𝑏, we have 𝑎 + 𝑏𝐾𝑃 = 2𝜁𝜔0 and 𝑏𝐾𝐼 = 𝜔0
2 . It then
follows that:
𝐺(𝑠) =𝜔0
2
𝑠2+2𝜁𝜔0𝑠+𝜔02
+(2𝜁𝜔0−𝑎)𝑠
𝑠2+2𝜁𝜔0𝑠+𝜔02
(5.13)
When 𝑎 = 𝐵/𝐽 is tiny, it can be ignored in the nominator, so that:
𝐺(𝑠) =𝜔0
2
𝑠2+2𝜁𝜔0𝑠+𝜔02
+2𝜁𝜔0𝑠
𝑠2+2𝜁𝜔0𝑠+𝜔02
(5.14)
𝐺(𝑠) =𝜔0
2
𝑠2+2𝜁𝜔0𝑠+𝜔02
+2𝜁
𝜔0⋅
𝜔02𝑠
𝑠2+2𝜁𝜔0𝑠+𝜔02
(5.15)
Let ℎ0(𝑡) be the unit step response of the transfer function
𝐺0(𝑠) =𝜔0
2
𝑠2+2𝜁𝜔0𝑠+𝜔02 (5.16)
where ℎ0(𝑡) = {1 − 𝑒−𝜁𝜔0𝑡(cos (𝜔0√1 − 𝜁2𝑡) +𝜁
√1−𝜁2sen (𝜔0√1 − 𝜁2𝑡)}
Usually, we have 𝜁 = 1 to achieve critical damping, and the unit step response is
ℎ0(𝑡) = 1 − 𝑒−𝜔0𝑡(1 + 𝜔0𝑡) (5.17)
It follows that the step response of 𝐺(𝑠) is
ℎ(𝑡) = ℎ0(𝑡) +2𝜁
𝜔0⋅
𝑑ℎ0(𝑡)
𝑑𝑡 (5.18)
Since 𝑑 ℎ0(𝑡)
𝑑 𝑡= 𝜔0
2 ⋅ 𝑒−𝜔0𝑡 ⋅ 𝑡, the slope of the unit step response is
𝑑ℎ(𝑡)
𝑑𝑡=
𝑑 ℎ0(𝑡)
𝑑 𝑡+
2𝜁
𝜔0⋅
𝑑2ℎ0(𝑡)
𝑑2𝑡 (5.19)
= 𝜔02 ⋅ 𝑒−𝜔0𝑡 ⋅ 𝑡 + 2𝜁𝜔0 ⋅ 𝑒−𝜔0𝑡(1 − 𝜔0𝑡)
= 𝑒−𝜔0𝑡{2𝜔0 − 𝜔02𝑡} (𝑓𝑜𝑟 𝜁 = 1)
Recalling the definition,

49
{
𝐾𝑡𝐾𝑃+𝐵
𝐽= 2𝜁𝜔0
𝐾𝑡𝐾𝐼
𝐽= 𝜔0
2 (5.20)
a conclusion can thus be drawn from the dynamic analysis, that when the bearing suffers
degradation and the friction coefficients increases, B increases and the damping factor 𝜁
increases. The increasing value of 𝜁 will slow the VSD’s unit step response. In another words,
when the degradation of the bearing is present, the VSD’s transient time to changes in rotational
speed will be longer. How fast the VSD’s transient response is can be measured by the slope
of the speed change. Since the magnetic sensor’s measurement of the stator magnetic field
provides information about the electrical rotation speed, analysis of the frequency changes in
the magnetic data during the transient period will reveal the status of the bearing.
5.2 Induction machine test benches
Two experimental test benches for machines with different power ranges and with different
types of loading strategies have been designed in order to validate the proposed machine load
monitoring technique, as shown in Fig. 5.2. The first test induction motor is a three-phase four-
pole wound rotor machine with the following parameters: rating 1.5kW, supply voltage
220V/380V, supply frequency 50Hz and rated speed 1500rpm with no load. The stator is star-
connected and the rotor is short-circuited. The frame of the test induction machine is made of
aluminum. The load has been emulated by a DC motor which is coupled to the induction
machine shaft and controlled by a DC load drive. Furthermore, by using a torque meter, an
encoder and a current probe, induction machine parameters such as speed, load and output
power can be monitored, as shown in Fig. 5.2(c). The GMR sensor (NVE AA002) is placed in
the middle of the machine yoke to detect stray magnetic flux. The output voltage from the GMR
sensor is measured by an oscilloscope and recorded on a PC. The second induction machine is
also a three-phase wound rotor induction machine with ratings of 59kW rated power and
1500rpm rated speed with no load. The machine has a steel frame. The test bench is used to
investigate the fatigue progress in a bearing. By using a hydraulic system, variable loads can be
applied to the test bearing and to accelerate the ageing of the bearing, as shown in Fig. 5.2(d).
With the degradation of the wind turbine main shaft bearing, the load’s changing in the whole
system can be achieved.

50
(a) 1.5 kW induction machine test bench
(b) 59 kW induction machine bearing test bench

51
(c) Photograph of 1.5 kW induction machine test bench
(d) Photograph of 59 kW induction machine bearing test bench
Figure 5.2 Induction machine load monitoring test benches
The experimental study includes tests of static and dynamic load. In the first test bench, the
induction machine operates normally with or without loads. During the no-load test, the
machine is operated at synchronous speed. After that, one DC motor generates a constant load
to test the induction machine, while the GMR sensor has been implemented on the machine’s
yoke and detects any change in the stray flux. In the dynamic load test, the DC motor applies a
constant load and the stray magnetic flux is measured from the machine start-up process up to
steady-state operation.
The magnetic flux data are analysed using two different approaches. For the data collected
from the static load test, they are analysed by comparing amplitudes. The magnetic sensor data
during machine start-up are analysed in the time-frequency domain. By monitoring changes in
the stray flux field, the change in dynamic load can be observed. To compare the stability of
the transient response, two induction motor systems with different ranges of load have been
tested.
Static and transient feature extraction methods are applied to the magnetic stray flux data.
Values of amplitude and peak magnetic stray flux are found from in the static test results. The
spectrograms illustrate the transient information of magnetic stray flux. The spectrogram
provides patterns to estimate the harmonic contents of a time-varying signal, which helps in
developing a visual correlation of load variations and detected signals.

52
5.3 Static test results and analysis
in the motor load test, the DC motor generates loads ranging from 0 to 5 N∙m. The stray
flux is measured in the z-direction of the magnetic field on the machine frame. The GMR sensor
detects the radial magnetic flux of the external magnetic field of the test machine. The output
voltage waveform of the GMR sensor is almost sinusoidal as shown in Fig. 5.3 a.
(a) GMR sensor voltage output waveform
(b) Comparisons of stator current and peak values of the GMR sensor output under
different loads
Figure 5.3 Stator current and peak values of the GMR output under different loads
Different steady-state features are captured, as presented in Fig. 5.3b. It can be seen that
the stray flux increases with loading in steady-state operation, and its peak values increase from
68.1 to 198 mV and 87.1 to 200mV respectively. In Fig. 5.3b, the stator current is also shown.

53
From the previous analysis in 5.1, the stator current can increase the stray magnetic flux which
is measured in the z-direction around the machine in this study. As a result, the load state of the
induction machine can be monitored by the GMR sensor in the steady state.
5.4 Transient data and feature extraction for characterization
The transient state of machine loading can also be monitored through two different
indicators. These are the first peak value of the GMR voltage output waveform, and the transient
response time in the spectrogram results. Fig. 5.4 shows the measured output voltage
waveforms from the GMR sensor during the two operating conditions of the machine. By
controlling the DC motor as a variable load, the test machine starts with a fixed load while the
load changes from 5, 4.5, 4, 3.5, 3, 2 to 1 N∙m for the starting tests. The test results are presented
in Fig. 5.4. It is observed that there is a peak value at around 80 mS in every waveform of the
stray magnet flux and the peak value of this waveform increases with load. The air-gap
magnetic flux reaches a maximum value at the beginning of the start-up period. It is evident
that the stray flux can indicate load variations in the machine starting transients.
(a) Induced voltage of the GMR sensor during starting-up of motor 1
40 60 80 100 120 140 160 180 200 220 240
0.02
0.04
0.06
0.08
0.1
0.12
0.14
0.16
0.18
Time (MS)
Outp
ut voltage o
f m
agnetic s
esnor
(V)
5 Nm Load
4.5 Nm Load
4 Nm Load
3.5 Nm Load
3 Nm Load
2 Nm Load
1 Nm Load
No Load
From no load to 5Nm load

54
(b) Induced voltage of the GMR sensor during starting-up of motor 2
Figure 5.4 Results for motors 1 and 2
In order to investigate the repeatability of the proposed load monitoring method, two
identical induction motors were tested in an experiment as illustrated in Figs. 5.4 a and b. It can
be seen in Fig. 5.4a that their first peaks and transient response times have the same trends as
the load varies.
The output results for start-up are illustrated in the time-frequency domain in Fig. 5.5.
The transient response time is the time from the machine starting point to the steady-state.
Whenever the test machine starts, there is a trigger signal sent from machine control board to
the NI DAQ card. Additionally, from the spectrogram, the time of entry into the steady-state
can be found. Thus, by calculating the difference between the two, the transient response time
is obtained. The transient response time is the response time of a system from change to a steady
state. In this particular case, the transient response time is the time of the tested machine from
the start-up to the steady state. As discussed in Section 5.1, variations in load will lead changes
in transient time during the start-up of the induction machines. In this case, as the load torque
increases, the transient response time in induction motors rises to reach the same speed as in
the previous load situation. Figs. 5.5 a and 5.5b show spectrograms of the magnetic sensor
signals during motor start-up. In particular, at the beginning of the start-up transient time, the
spectrum results demonstrate significant variations, as illustrated in Fig 5.5. Fig. 5.5 a and Fig.
5.5b show a slight difference in the spectrograms of the two motors during starting-up.
0 40 60 80 100 120 140 160 180 200
0
0.02
0.04
0.06
0.08
0.1
0.12
0.14
0.16
0.18
0.2
Time (Ms)
outp
ut voltage o
f m
agnetic s
ensor
(V)
No Load
1 Nm Load
2 Nm Load
3 Nm Load
4 Nm Load
5 Nm Load
From no load to 5 Nm load

55
(a) Motor 1 spectrogram for start-up
(b) Motor 2 spectrogram for start-up
Figure 5.5 Spectrograms of the magnetic sensor output in the time-frequency domain
by STFT
Their individual machine characteristics can be compared in terms of transient
responses; for example, in the time-spectrograph analysis as shown in Fig. 5.6. The comparison
between the GMR sensor output in steady state and the transient response time in a transient
state are illustrated in Fig. 5.6. The transient response time is more sensitive than the peak value
in detecting the variation in load. From Fig.5.6, the slope of the transient response time is greater
than the peak value during load variations, which leads to better performance of the monitoring
Time, s
Fre
quen
cy, H
z
Amplitude spectrogram of the signal
0 1 2 3 4 5 6 7 8 9 100
50
100
150
200
250
300
350
400
450
500
Mag
nit
ude,
dB
-110
-100
-90
-80
-70
-60
-50
-40
-30
-20
-10
Time, s
Fre
qu
ency
, H
z
Amplitude spectrogram of the signal
0 1 2 3 4 5 6 7 8 9 100
50
100
150
200
250
300
350
400
450
500
Mag
nit
ud
e, d
B
-110
-100
-90
-80
-70
-60
-50
-40
-30
-20
-10

56
system. The peak value data are captured during the steady state, and the response time is
collected in the transient state. The transient state can be considered as a collection of numerous
steady states, and thus contains richer information than the steady-state data. Thus, the transient
response time can provide better sensitivity performance than the peak values in monitoring
load variation.
Figure 5.6 Comparison of the peak value and transient response time during starting up

57
Figure 5.5 Test bearing status
To validate the proposed system and feature extraction method in monitoring induction
machines, a second load monitoring test was applied to a 59 kW motor. The first case study
was carried out with steady-state features applied. As shown in the bearing test bench (Fig. 5.2),
the motor shaft is directly linked to a test bearing. As the hydraulic system exerts an additional
constant load on the bearing, bearing cracks or failures may be generated as a result of excessive
fatigue cycling. Any cracks and faults on the test bearing will lead to a load increase. The
proposed method and transient feature (spectrogram) were applied for load monitoring,
especially at motor start-up, to estimate the bearing condition. Figs. 5.7 shows the bearing state
(outer race and inner race) before and after a ten-day accelerated fatigue test. The test data from
the second test bench was processed and the spectrogram results are shown in Fig. 5.8. The
start-up process is divided into several steps due to the heavy load and large power rating of the
experimental system. After several days of continuous testing, the start transient response time
was obtained and plotted in Fig. 5.9. As the transient response time increases, some bearing
faults start to appear, as illustrated in Fig. 5.7. It is thus proven that the spectrogram (and the
transient response time in particular) is a valid feature for the monitoring of bearing fatigue.

58
Figure 5.6 Data analysis using STFT in spectrogram with bearing test rig
Figure 5.7 Transient time during the experiment
5.5 Chapter summary
Experimental studies have been carried out through steady-state and transient magnetic
field measurements. In steady-state operation, the features are applied for load monitoring and
feature extraction. When induction motors start up with load, the first peak of the output voltage
of the magnetic sensor is a good indicator. Secondly, the spectrogram is used to provide patterns
between time and frequency. By referencing the transient time information of the stray flux
spectrogram patterns, load variations can be identified during the experiments. Compared with

59
steady-state analysis, the transient response time can provide more effective and better results
for the dynamic load states. Overall, the experimental tests on three induction motors have
confirmed the effectiveness of the proposed method of load monitoring. The proposed stray
flux system shows the capability to monitor the abnormalities and variations in load in three
induction machines even at a very low speed (200 RPM).

60
Chapter 6 Electrical Winding
Failures
The non-intrusive monitoring of health state of induction machines used in industrial
processes and harsh environments poses a technical challenge. In the previous review, winding
failures were found to be a major fault accounting for over 45% of total machine failures. This
chapter focuses on the influence of winding faults on stray magnetic flux in induction machines.
Finite element analysis and experimental tests on a 1.5-kW machine are presented to validate
the proposed health monitoring method. With time-frequency spectrogram analysis, it is proven
to be effective in detecting winding faults by referencing stray flux information. The novelty of
this work lies in the implementation of GMR sensing and the analysis of machine winding faults.
6.1 Finite element model
A three-phase induction machine is firstly modelled and built in finite element software,
and the same induction machine is later tested in an experimental test rig. The specifications of
the induction machine are shown in Table 6-I. Furthermore, the electromagnetic field
distribution in a healthy state and with winding failure is analyzed as well.
Table 6-1 Specifications of the tested induction machine
Item Value
Rated power 1.5 kW
Pole number 4
Phase number 3
Rated stator current 7 A
Rated stator voltage 220 V
Rated speed 1460 rpm
Stator slot 36
Rotor slot 28
Outer diameter of stator 140 mm

61
Inner diameter of stator 88 mm
Air-gap length 0.8 mm
6.1.1 Numerical results with winding faults
6.1.1.1 Healthy state of magnetic flux field
In order to investigate the change in the stray flux field, a steel housing and yoke is also
built in the FE model. The magnetic flux distribution and stray flux in a healthy state are
calculated and illustrated in Figs. 6.1 and 6.2, respectively. In this context, the baseline
information for stray flux can be observed in the healthy state and also helps in determining the
specifications of the magnetic sensors.
Figure 6.1 Magnetic flux distributions of FE model.

62
Figure 6.2 Stray flux density in the induction machine housing.
6.1.1.2 Phase -to-phase short-circuit simulation.
By changing the connections and winding parameters, a phase-to-phase short-circuit is
formed and simulated in the FE model. As the circuit current creates an imbalance inside the
induction machine, the magnetic field and stray flux distribution are different from those in the
healthy state, as shown in Fig. 6.3.
Once a winding fault occurs inside an induction machine, the three-phase currents
become unbalanced and distort the magnetic and stray flux. Stray flux results at the same
detection point are shown in Fig. 6.4.

63
Figure 6.3 Magnetic flux distribution with a phase-to-phase fault.
Figure 6.4 Stray magnetic flux with a stator winding fault.
6.1.2 Thermal simulation
As mention in the chapter 2, thermal degradation directly influences the winding
insulation and leads to winding circuit failures. Additionally, any winding faults in induction
machines will impact on the thermal performance of the machine and the undesirable heating
patterns may cause catastrophic damage to the machine if left untreated. Furthermore,

64
temperature changing inside of the machine affect the magnetic permeability, which leads to
change in the magnetic field of the machines. Therefore, it is necessary to investigate the
thermal model of the electrical machine.
6.1.2.1 3D Temperature field of the induction machines
In magnetic analysis, induction machines can be analyzed using a 2D magnetic model
with reasonable accuracy. But for thermal problems, it is necessary to use 3D models and also
to consider ventilation and heat transfer with in the machine. The induction machine model
used in this section has been augmented with some ducts in the rotor for cooling, including
totally enclosed air-cooling convection.
The following assumptions are made for temperature field modelling:
• All the slice faces of the induction machine model are perfectly insulated.
• The insulators in the slot are identical.
• The heat convection coefficient is identical at all positions in the air gap.
The reason for a temperature increase in the machine is heat losses. The total loss is
given by:
Pall = P1cu + P2cu + Piron + PM + PS (6.1)
where Pall is the total loss, P1cu is the copper loss in the stator, P2cu is the copper loss in the
rotor, Piron is the iron loss, PM is the mechanical loss, and PS is the stray load loss. By
determining the individual losses in the generator, it is then possible to sum them to find the
total loss. Then all the sources of heat for different generator components can be set by referring
to the corresponding losses.
In an air-cooled machine, the heat radiation is very small and is thus neglected in this
study for purposes of simplification. The main routes for heat transfer are through convection
and conduction. The 3D steady state heat conduction is:
𝜕
𝜕𝑥(𝑘𝑥
𝜕𝑇
𝜕𝑥) +
𝜕
𝜕𝑦(𝑘𝑦
𝜕𝑇
𝜕𝑦) +
𝜕
𝜕𝑧(𝑘𝑧
𝜕𝑇
𝜕𝑧) = 0 (6.2)
where 𝑘𝑥, 𝑘𝑦, 𝑘𝑧 are the heat conduction coefficients in the 𝑥-, 𝑦- and 𝑧- directions respectively.
Additionally, the heat convection coefficient h also needs to be calculated to set the
boundary conditions for the outer surface of the stator core. This is calculated as follow [8]:

65
ℎ = 𝜌 𝑐𝑝 𝐷𝑣
4𝐿∗[1−𝐸𝑋𝑃(−𝑀)] (6.3)
𝑀 = 0.1448𝐿0.96/𝐷1.16{𝑘/(𝜌 𝑐𝑝 𝑣) }0.214 (6.4)
where D is the outside diameter, L is the characteristic length of the surface, v is the fluid
velocity, 𝜌 is the fluid density, cp is the fluid specific heat capacity, and 𝑘 is the thermal
conductivity.
6.1.2.2 Thermal modelling of healthy induction machines
Figure 6.5 3D model of an induction machine
As heat is transferred in the x, y, and z directions, the thermal simulation cannot be fully
explained by a 2D model, so a time-consuming 3D model is needed. Fig. 6.5 shows a 3D model
of the induction machine designed using ThermNet (coupled with MagNet). To reduce the
solution time for thermal simulations, the 3D induction machine model is built with a portion
of the motor body for one phase with one pole. The types of convection heat transfer used in
the induction machines are natural convection and forced convection.
By adding all the losses calculated from MagNet, the temperature field distribution in
the induction machine with natural convection is illustrated in Fig. 6.6. It can be observed that
the hottest part is in the center of the rotor, with a recorded temperature of 125.48°C.

66
Figure 6.6 3D temperature field with natural convection
On the basis of the natural convection model, forced convection can be added to the
FEA. Generally, the forced convection in induction machines can be achieved by installing a
fan on the shaft and rotating it with the rotor. In this case, the air is blown into the airgap and
ventilation duct. In the FEA, it is assumed that the direction of forced convection is from the
left of the model to the right in all diagrams. When air flows through the induction machine,
the convection heat transfer coefficient h is different in the axial direction. Consequently, the
simulation model has been sliced into 13 sections along the axial direction. According to
equations 6.3 and 6.4, each part has been set with a different convection heat transfer coefficient.
Figs. 6.7 and 6.8 show the 3D temperature distribution of the healthy induction machine model.
After hours computation, the temperature field of the induction machine mode has
reached a steady state. Figs. 6.9 and 6.10 demonstrate that the hottest part of this whole model
is the outlet of the air path, which leads to the probability of damage to the winding insulation.
But the highest temperature in the generator is only 107.5°C, which is already much cooler than
that with natural convection. Moreover, the temperature distributions in the three different coils
in the stator are the same; so those are for the two coils in the rotor.
By setting the losses calculated from the faults induction machine model in MagNet
(with winding short-circuits), the temperature field of the faulty induction machine model is
obtained, as shown in Figs. 6.11 and 6.12. The short-circuit occurs only in one coil of the rotor
winding. From Fig. 6.9, the temperature field distribution of the short-circuited coil is different

67
from that of the healthy one. More specifically, the area of the highest temperature (117.7°C)
in the rotor shorted coil is larger than in the healthy case, which makes it more likely to cause
a winding failure.
Figure 6.7 3D temperature field with forced convection
Figure 6.8 3D temperature field under healthy conditions

68
Figure 6.9 3D temperature field with rotor short-circuits
Comparing the healthy and faulty induction machine models, the major difference is the
heat source which is induced by the current flowing through the copper winding. During a
winding short-circuit event, the current generates heat and creates initially hotspots. When
stabilized, the winding temperature in the fault model is much higher than that in the healthy
model, giving rise to the likelihood of insulation failure and fault propagation.
Figure 6.10 3D temperature field with rotor short-circuits

69
Figure 6.11 3D temperature field with short-circuits in both the rotor and stator windings
Figure 6.12 3D temperature field with short-circuits in both the rotor and stator windings
When turn-to-turn winding faults occurr in the stator or the rotor, the excessive heat
generated from short-circuits will diffuse through the air gap so that the average temperature of
the generator increases, leading to hotspots, insulation degradation or new short-circuits in
neighboring windings of the induction machine. When winding faults are present in both the
stator and the rotor, the damage can be more severe or even catastrophic for the generator. Figs.
6.11 and 6.12 show the temperature field distribution of the induction machine with short-

70
circuits occurring at one rotor coil and one stator coil. From the simulation results with rotor
and stator short-circuits, the highest temperature (123.09°C) is similar to the case of a natural
convection machine but much higher than the previous fault simulation in air-cooled cases.
Furthermore, the isotherm of the stator windings at the air inlet is quite different from in the
healthy model and faulty rotor winding models. Compared with the two healthy stator windings,
the trend of the bulging isotherm in the faulty windings is more significant than in the healthy
ones.
6.2 Experimental vilaidation
6.2.1 Experimented test bench set-up
An experimental test rig has been set up to validate the proposed technology at
Massachusetts Institute of Technology, Boston, USA, as shown in Fig. 6.13. The test machine
is a four-pole three-phase induction machine with a steel housing and frame. The stator windings
are star-connected and the rotor is short-circuited. The machine is controlled by a converter via
a Labview interface in the control PC. A DC motor is coupled to the test machine as the load.
The GMR sensor is installed at the middle of the housing to capture the leaking stray flux. The
output signal of the magnetic sensors is collected by a NI data acquisition card with sampling
frequency of 5-kHz. By changing the wire connection at the fault point, different stator winding
faults can be emulated and tested in the experimental test rig, including phase-to-phase and
phase-to-ground short-circuits. The aim of this sensor is to detect the stray flux, which is
perpendicular to the machine yoke. The sensor has to be placed with glue and tape in the middle
of the machine cage in order to minimize the influence of the ending windings as shown in Fig
6.13 b. The sensor can be implemented on any place in the middle of the machines cage to collect
the stray magnetic field information.
Stray flux is a magnetic flux that radiates from the inside of the machine frame and is
inherently and strictly connected to the magnetic state of the machine. Stray flux is induced by
stator and rotor currents, each of which produces magnetic flux with different spectral
components. In this case, if a short-circuit occurs inside the machine, the stray flux will change
depending on the variation in the machine stator and rotor currents. Therefore, several types of
electrical failure have been created during the experiment, such as a phase-to-phase short-circuit.
By collecting stray flux information, stray flux information of electrical failure of the machine
can be obtained.

71
(a) Induction machine failure test bench
(b) Stray flux sensor location
Figure 6.13 Experimental test rig
From the simulation results, the stray magnetic flux density is within the range which
can detected. In this case, the specifications of sensors and sensor arrays are designed to capture
the magnetic flux escaping from the machine housing. GMR sensor arrays can meet the design
requirements and give good performance in low magnetic fields. After collecting stray flux data,
the results can be compared between different health states in both the time and frequency
domains.

72
6.2.2 Experimental Results
The stator winding fault test is used to detect stray flux field variations during different
situations. The stray flux is measured in the radial direction of the machine housing when the
test machine is running at steady state. To build the healthy baseline information for stray flux,
the GMR sensors firstly capture the stray flux of a healthy machine with different output
voltages from the converter. The line-to-neutral voltages are set at 10 V, 90 V, 70 V, 40 V and
20 V. The output signals of the GMR sensors are presented in Fig. 6.14.
a) Stray flux data at different voltage outputs
b) Stray flux data at 70 V
Figure 6.14 Stray flux baselines for the healthy induction machine.

73
Figure 6.15 Stray flux spectrum of the healthy induction machine
In theory, the stray flux in the radial direction is created by both stator and rotor currents.
More specifically, current flow in the stator windings generates the main air-gap flux. Due to
attenuation phenomena in the stator lamination and machine housing, the stray flux can be seen
as a reduced air-gap flux. The attenuation can be decoupled and represented as a global
transmission coefficient which links the two together.
Fig. 6.15 provides the stray flux spectrum of the healthy induction machine. The different
frequency components reflect the characteristics of the test machine. The fundamental
frequency is 60 Hz, and there are several harmonic components, which are influenced by
slotting effects and the geometry of the machine. With the influence of eddy currents in the
housing, there is also a slight difference between simulation and experimental results.
By created a phase-to-phase winding fault, the stray flux of the test machine changes, as
shown in Fig. 6.16. As a short-circuit occurs in the stator windings, the current flowing in the
faulted phase is increased. Therefore, the induction machine becomes unbalanced, which is
shown in the stray flux results.

74
Figure 6.16 Stray flux of induction machine with a phase to phase fault.
By apply Fast Fourier Transform (FFT) analysis, the stray flux signal can be observed in the
frequency domain. Fig. 6.17 shows the stray flux spectrum of an induction machine with a
phase-to-phase short-circuit. Compared with the healthy state (Fig 6.16), the amplitude of
several harmonic components has already changed. The third harmonic (180 Hz) is increased
about 6-fold from 0.002575 to 0.01502. Additionally, the 150-Hz harmonic is also doubled.
However, the fundamental component and its side band remain at the same level as in the
normal state. From the stator current signature analysis, the thrid harmonic component is also
proven to be useful in identify an imbalance and winding faults. As a result, the third harmonic
component is used as an indicator for phase-to-phase winding short-circuits in induction
machines.

75
Figure 6.17 Stray flux spectrum of induction machine with phase to phase failure.
Subsequently, another winding failure is also created in the experiment, which is a
phase-to-ground short-circuit. This short-circuit usually occurs between the stator winding and
stator lamination. With degradation in the insulation of the stator winding, it is possible for it
to come into direct contact with laminations, which generates the phase-to-ground winding
short-circuit failure. To investigate this failure, one phase winding is connected to the ground
for a simulation in the induction machine test bench. The stray flux sensor is placed at the same
location as in the previous two experiments. Fig 6.18 shows the stray flux sensor output in the
phase-to-ground winding short-circuit.
Figure 6.18 Stray flux with phase-to-ground winding failure in the induction machine
6.76 6.78 6.8 6.82 6.84 6.86 6.88
0.1
0.15
0.2
0.25
Time (s)
Am
plit
ude

76
Figure 6.19 Stray flux spectrum of induction machine with phase-to-ground failure
Fig 6.19 shows the stray flux signal with a phase-to-ground failure in the frequency
domain. As the power supply is the same as in the previous experiment, the amplitude of the
fundamental frequency harmonic is reduced to 0.0398 compared to that of the phase to phase
short-circuit winding failure. Additionally, the amplitude of the third harmonic is also larger
than that in the healthy state, as unbalanced three-phase current flows in the stator windings.
Subsequently, the harmonic components at 30 Hz and 90 Hz decrease to 0.0007816 and
0.000834 respectively once the phase-to-ground short-circuit occurs in the induction machine,
this likely to be an indicator to distinguish between phase-to-phase short-circuit and phase-to-
ground short-circuits.
As discussed in Chapter 3, stray flux can represent as the main flux in air gap and reflect
the stator current. Previous researches of stator winding short circuit fault in the electrical
machines have provided several harmonic components as the indicators, which is shown as
follow [88]:
𝑓𝑠𝑡 = 𝑓𝑠 [𝑚(1−𝑠
2𝑝) ± 𝑘] (6.5)
where 𝑓𝑠𝑡 is indicator frequency, 𝑓𝑠 is fundamental frequency, 𝑠 is slip, 𝑝 is number of
pole, 𝑚 = 0, 1,2,3, and 𝑘 = 0,1,3,5. During the experimental study, the texted machine is
running at rated speed with no load, so the slip is zero. When 𝑚 =1 and 𝑘 = 1, the
indicator frequencies are 30Hz and 90Hz.When 𝑚 =1 and 𝑘 = 2, the indicator frequency
is 150Hz. As the stray flux reflect the stator current, the frequency indicators of the stator
current can be used as that of the stray flux as well, which has shown in the experimental
result analysis above.
50 100 150 200 250 3000
0.01
0.02
0.03
0.04
X: 89.76
Y: 0.000834
Frequency (Hz)
Am
plit
ude
X: 59.86
Y: 0.0398
X: 179.6
Y: 0.004836
X: 29.9
Y: 0.0007816

77
(a) Spectrogram of stray flux in healthy induction machine
(b) Spectrogram of stray flux in induction machines with phase-to-phase short-circuit
Time, s
Fre
qu
en
cy
, H
z
Amplitude spectrogram of the health machine
0.5 1 1.5 2 2.5 3 3.5 4 4.50
100
200
300
400
500
600
Magn
itud
e,
dB
-100
-80
-60
-40
-20
Time, s
Fre
qu
en
cy
, H
z
Amplitude spectrogram of the failure
0.5 1 1.5 2 2.5 3 3.5 4 4.50
100
200
300
400
500
600
Mag
nit
ud
e,
dB
-100
-80
-60
-40
-20

78
(c) Spectrogram of stray flux in induction machines with phase-to-ground short-
circuit
Figure 6.20 Spectrograms of stray flux data in the winding failure experiments
Figure 6.20 (a) shows the healthy state of the machine, and b) and c) represent phase-
to-phase and phase-to-ground short-circuits happening in the machine. Both set of data are
taken in the steady state. The purpose of using a representation of time evolution is to provide
time-varying information from the signal. Additionally, it is easier to show the pattern of the
spectrogram compared with FFT. The spectrogram analysis is used to estimate the frequency
content of the stray flux signal, and the magnitude squared of the STFT yields the spectrogram
of the function, which is represented in colour plots.
Information about harmonic pattern can be observed based on these three spectrograms.
In comparison with the FFT results, third harmonic is also increases from -53.83dB to -27.98dB.
Additionally, between 200 Hz to 300 Hz, there are several increased harmonics raised which
are shown in Fig 6.20 b, at 210 Hz, 239.3 Hz and 269.8 Hz, which are difficult to find in the
FFT results. Spectrograms can not only identify tiny abnormalities in frequency component,
but can also combine time information. Additionally, once the phase-to-ground short-circuit
occurs in the induction machine, the spectrogram in Fig 6.20 c shows the magnitude of
decreases in the 210 Hz, 239.3 Hz, 269.8 Hz and 30 Hz components. In this case, these harmonic
components could be indicators to distinguish between different types of stator winding failures,
and spectrograms can provide easily visible patterns and harmonic distributions.
Time, s
Fre
quency, H
z
0.5 1 1.5 2 2.5 3 3.5 4 4.50
100
200
300
400
500
600
Mag
nit
ud
e,
dB
-100
-80
-60
-40
-20

79
6.3 Chapter summary
In this chapter, a new non-invasive condition monitoring method for induction machines
has been proposed. It measures the stray magnetic flux field outside of the machine frame using
GMR magnetic sensors. The proposed method offers wide range spectrum information, and the
high resolution detection of low-level magnetic field detection.
Simulation results from different stator winding short-circuits can provide information
about changes in stray flux. The thermal simulation of winding failures shows that there will be
a temperature increase when a short-circuit occurs in the windings, which then accelerates the
degradation of the winding. Based on simulations, GMR sensors and arrays can be chosen and
developed to meet test requirements. Experimental results have confirmed that the proposed
condition monitoring system is capable of capturing stray magnetic flux even though the leaking
flux signal is quite weak. By studying the measured stray flux in the time domain, and especially
in the frequency domain, several significant harmonic components can be used as indicators of
stator winding faults.
Phase-to-phase and phase-to-ground short-circuit failures are tested in the induction
machine experimental bench. From the comparison of these two winding failures, the harmonic
component with an amplitude of 30 Hz (half of the fundamental frequency) is reduced once a
phase-to-ground failure happens. However, other harmonic components increased compared to
the healthy state of the tested induction machines. Thus, depending on the change in the
component at half of the fundamental frequency in the stray flux, these two winding failures can
be separated.

80
Chapter 7 Mechanical Failures
As mentioned in chapter 2, apart from electrical winding failures, mechanical failures
are the most frequent failures in electrical machines and leads to considerable amounts of
downtime. Due to the destructive and rapidly propagating nature of mechanical failures, it is
critical to monitor induction machines to prevent further damage. Traditional monitoring
techniques are based on variations in fundamental parameters, but those methods cannot
distinguish different kinds of mechanical failure. This chapter investigates the influence of
several types of mechanical faults on the stray magnetic flux field in the machines, with a view
to validating the stray flux-based non-invasive motor monitoring system using an indirect
approach. The designed stray magnetic flux monitoring system is proposed to estimate and
detect unbalanced loads and bearing misalignments in electrical machines, using both
simulation and experimental studies. By using independent component analysis, different
mechanical faults and defect characteristics can be distinguished using stray magnetic flux
information. Simulation and experimental results are presented to substantiate the idea that a
combination of spectrograph, ICA and stray magnetic flux measurement could be a viable
method for diagnosing between distinguishing the different mechanical failures.
7.1 Bearing misalignment and unbalanced load
Mechanical failures make the rotor eccentric, and an unexpected radial force is created.
This force moves the rotor off-centre, which leads to an unbalanced load on the bearings. This
force is called unbalanced magnetic pull (UMP) [2]. By reducing UMP, the bearing load can
be reduced as well, which is likely to extend the lifetime of the components. As the bearing and
mechanical failures are the major fault issues in the electrical machines, these failures need to
be monitored and detected before the rest of the machine is influenced.
In commercial electrical machines, the air gap is designed to be quite small in order to
reduce losses and increase efficiency. However, if any mechanical failure happens in the
machine, the air gap will become non-uniform, which can lead to poor performance and
inefficiency. Furthermore, on off-centre rotor can create UMP during the operation of the
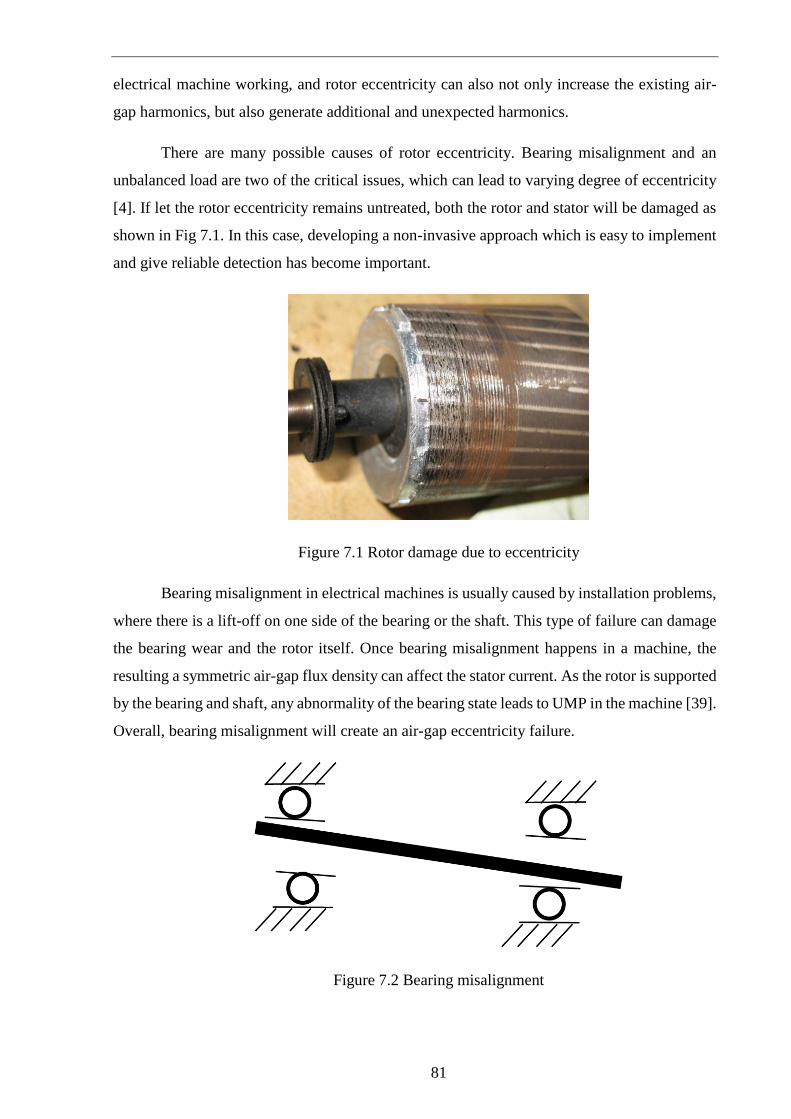
81
electrical machine working, and rotor eccentricity can also not only increase the existing air-
gap harmonics, but also generate additional and unexpected harmonics.
There are many possible causes of rotor eccentricity. Bearing misalignment and an
unbalanced load are two of the critical issues, which can lead to varying degree of eccentricity
[4]. If let the rotor eccentricity remains untreated, both the rotor and stator will be damaged as
shown in Fig 7.1. In this case, developing a non-invasive approach which is easy to implement
and give reliable detection has become important.
Figure 7.1 Rotor damage due to eccentricity
Bearing misalignment in electrical machines is usually caused by installation problems,
where there is a lift-off on one side of the bearing or the shaft. This type of failure can damage
the bearing wear and the rotor itself. Once bearing misalignment happens in a machine, the
resulting a symmetric air-gap flux density can affect the stator current. As the rotor is supported
by the bearing and shaft, any abnormality of the bearing state leads to UMP in the machine [39].
Overall, bearing misalignment will create an air-gap eccentricity failure.
Figure 7.2 Bearing misalignment

82
As with the air-gap eccentricity, these variations generate stator currents at frequencies
given as follow[35]:
𝑓𝑏𝑒𝑎𝑟𝑖𝑛𝑔 = |𝑓𝑠 ± 𝑚𝑛
2𝑓𝑟 [1 ±
𝑏𝑑
𝑝𝑑cos 𝛼]| (7.1)
where m=1,2,3,……, and 𝑓𝑠 is the fundamental frequency; n is the number of bearing balls; 𝑓𝑟
is the mechanical rotor speed in hertz; bd is ball diameter, and pd is bearing pitch diameter; and
𝛼 is the contact angle of the balls on the races.
Bearing misalignment leads to air-gap eccentricity which can be reflected in the
fundamental frequency sideband of the stator current:
𝑓𝑒𝑐𝑐 = 𝑓𝑠 ± 𝑚𝑓𝑟 = 𝑓𝑠 [1 ± 𝑚(1−𝑠
𝑝)] (7.2)
By using this component in the spectrum, bearing misalignment can be detected, where 𝑓𝑒𝑐𝑐 is
the considered as a side-band of the fundamental waveform.
If there is an unbalanced mechanical load influencing the electrical machine, the stator
current will also have additional harmonic component. In an electrical machine, any imbalance
in the load at a multiple of the rotational speed will produce stator currents at the following
frequencies [36] :
𝑓𝑙𝑜𝑎𝑑 = 𝑓𝑠 ±2𝑚𝑓𝑠
𝑝 (7.3)
In this case, once an unbalanced load is applied to the machine system, the low
frequency harmonic indicator is likely to overwhelm that for bearing misalignment. This is
because both bearing misalignment and unbalanced load can create air-gap eccentricity, which
then exert the same influence on the stator current. However, stray flux data can reflect air-gap
flux density, as discussed in chapter 3.
7.2 Finite element simulation
As mentioned in section 7.1, static and dynamic eccentricities represent different
mechanical failures, which in this case as unbalanced load and bearing misalignments. In order
to understand distribution of stray magnetic flux, a finite element (FE) model has been built to
investigate the potential influence of mechanical failures in machines. Static and dynamic
eccentricities are simulated in this section. There the distribution of stray flux in the presence
of the static and dynamic eccentricities can be observed in numerical results, and the simulation
results are subsequently validated by the experimental studies in the following parts.

83
The FEA model is built based on a brushless DC machine which is the test machine in
the mechanical failure experiment bench. As the eccentricities representing failure affect the
whole air gap of the machine, it is necessary to use the 3D simulation model shown in Fig 7.3,
which can provide more accurate results for the stray flux.
Figure 7.3 3D model of the tested machine
(a) Static eccentricity simulation

84
(b) Dynamic eccentricity simulation
Figure 7.4 FEA simulation diagrams of static and dynamic eccentricities
Two types of eccentricity are investigated in the simulation study. Static eccentricity
occurs when the rotor rotates along the same central axis, but there is a small displacement of
this centre axis, as shown in Fig 7.4 a. To simulate static eccentricity, the rotor has been moved
from the rotation centre by 0.1 mm. Meanwhile dynamic eccentricity makes the rotor turn at
the same central axis as in the health state, and there is an angular difference between its rotation
axis and stator central axis as shown in Fig 7.4 b. By achieving the simulation of dynamic
eccentricity, it is clear that there is an angle of 10 degree between the rotor and the central
rotation axis.
(a) Stray flux of the machine in a health state

85
(b) Stray flux in the machine with static eccentricity
(c) Stray flux in the machine with dynamic eccentricity
Figure 7.5 Simulation results for stray flux information in three different states
The FEA simulation results are presented in Fig 7.5, showing the stray flux waveforms
at the same detection point in the healthy state, and with static and dynamic eccentricity. From
Fig 7.5 a, the stray flux waveform is almost a sin wave, as the FEA model is for an ideal
brushless DC motor. However, there is region of a saturation at the peak of each waveform
which is due to the influence of eddy current from the external yoke and stator laminations.
Fig 7.5 b represents the stray flux waveform of a machine with static eccentricity.
Compared with the healthy case, the waveform contains several additional harmonic
components, as there is some oscillation in the simulation stray flux data. The reason for the
change in this stray flux waveform is that the machine’s air-gap is no longer symmetrical.
However, as the rotation centre has moved by 0.1mm, the air-gap flux density has also changed.
The stray flux waveform for dynamic eccentricity is shown in Fig 7.5 c. As the air-gap changes
during the machine’s operation, the stray flux waveform includes many of unexpected harmonic
components. From using the simulation software, different types of eccentricity have different
effects on the stray flux waveform, and it’s possible to analyse mechanical failures, such as
unbalanced loads and bearing misalignments with referenced to stray flux information.
7.3 Experiment set up and validation
A mechanical failures test bench is built to validate the proposed method and monitoring
system at Georgia Institute of Technology, Atlanta, USA. The test machine is a brushless DC

86
machine, which is widely used in industrial applications. The rated power is 2.5Kw and the
system is supplied by a voltage source inverter with 220V/280v. The pole number of the
machine is 6 and the no-load speed is 540 rpm with star connection. The frame and yoke are
made of steel. Fig 7.6 a shows the overall test bench set up, and sensor’s placement is shown in
Fig 7.6 b. The unbalanced load has been emulated by installing ponderable clips on the fans of
the motor, which is directly linked to the main shaft of the machine as shown in Fig 7.6 c. In
this circumstance, by applying clips of different weight, two different unbalanced load situation
can be performed in the experimented test rig. The GMR sensor is placed as shown in Fig 7.6
b to detect the stray magnetic flux. The output signal from the sensor is measured and captured
by an NI data acquisition card and a PC with a sampling frequency of 5000 Hz. Furthermore,
the bearing misalignment is created by changing the healthy main shaft bearing with a faulty
one. The stray magnetic flux data is recorded while the motor is running at the steady state with
different unbalance load and bearing misalignments.
(a) Mechanical failure test bench system diagram
(b) Photographs of experimental test bench and GMR sensor positioning

87
(c) Photograph of the application of unbalanced load with weighted clips
Figure 7.6 Mechanical failure test bench and system diagram
7.4 Data analysis and feature extraction
The proposed GMR sensor has been implemented outside of the tested machine as
shown in the previous section. Stray flux information was captured, from a healthy state first
as a baseline. Unbalanced load and bearing misalignments were also applied in the test bench.
Fig 7.7 shows the signal output of the GMR sensors, which includes much noise. There are two
main reasons for this noise. Firstly, due to the choice of its postioning, the GMR sensor is placed
at the very outside of the external frame which inclues a large external air gap. Sencodly, the
tested brushless DC motor is driven by a PWM conveter, from which the modulation waveform
contains lots of harmonics and noise.
Figure 7.7 Output signals of magnetic sensors

88
(a) Stray flux spectrum of the healthy test machine
(b) Stray flux spectrum of the test machine under unbalanced load with one
clip

89
(c) Stray flux spectrum of the test machine under unbalanced load with two clips
(d) Stray flux spectrum of the test machine with bearing misalignment
Figure 7.8 Stray flux spectrums of the test machine with different mechanical failures
The fast Fourier transformation is applied to address variations in the different harmonic
components of stray flux data analysis. Fig 7.8 a shows the stray flux spectrum of the healthy
test machine. As the machine is running at 180 RPM, the fundamental frequency 𝑓𝑠 is 9 Hz,
which is 0.000291 T. Additionally, reference to equation 7.3, the various indication harmonics
can be calculated by choosing different integer m. The experimental results analysis in this
section provides the changes of harmonic components at 105Hz(m=35), 117Hz(m=39), and
126Hz(m=42) for unbalanced load. This spectrum information can be set as the baseline data
for comparison with different mechanical failures. Furthermore, there is also some noise in the
high frequency region which might be caused by the PWM converter.
In Fig 7.8 b and c, the stray flux data is also analysed in the frequency domain with
different unbalanced load (one and two weighted clips, 30g for each). Due to the increase in
load, the amplitude of the fundamental frequency 𝑓𝑠 9 Hz is increased from 0.0004171 and
0.0008427 T respectively. Meanwhile, the frequency components at 105 Hz are also increased
to 0.000005506 T with one clip load and to 0.000008534 T with two clips. The frequency
components at 117Hz are also increased to 0.000007074 T with one clip load and to
0.000008085 T with two clips. The frequency components at 126Hz are also increased to
0.000005361 with one clip and 0.000006368 with two clips. As mentioned in Section 7.1 and

90
equation 7.2, once the unbalanced load occurs in the machine, the amplitude of the frequency
component will be also increased as same as the stator current.
Fig 7.8 d presents the stray flux spectrum with a bearing misalignment in the tested
brushless DC machine. Compared with the healthy state, the fundamental frequency 𝑓𝑠 stays
almost the same at 0.0002946 T. However, there are several high frequency components
increases such as 137.2 Hz and 146.4 Hz, when bearing misalignment in present. Additionally,
these frequency components are not influenced by the unbalanced load situation which may be
a very good candidate to distinguish the bearing misalignment from unbalanced load. This is
because the faulty bearing also has its own additional rotation frequency except the supply
frequency. These higher order harmonic components can be indicators of bearing misalignment.
From the output of the GMR sensor, the signal includes lots of noise, which means that
the target information is buried. Independent component analysis (ICA) is a technique that
transforms a multivariate random signal into a signal having components that are mutually
independent in the strict statistical sense. Recently, this technique has been demonstrated to be
able to extract independent components from mixed signals. Here independence means that the
information carried by one component cannot be inferred from that of other components.
Statistically, this means that the joint probability of independent quantities is obtained as the
product of the probability of each.
The ICA algorithm normally finds the independent components of a data set by
minimizing or maximizing some measure of independence. A review of the solution to ICA
problems shows that various theoretic information criteria have been used [101], such as mutual
information, negentropy, and maximum entropy, as well as the maximum likelihood approach.
The fixed-point algorithm is used due to its suitability for handling raw time domain data and
its good convergence properties.
The ICA is one of the most important methods for blind source separation, which aims
to provide independent signals from the signals with complex structure. ICA is statistically
independent and nongaussian, which the any results of the components are not influenced by
any other components. Considering the situation of bearing monitoring experiment in this
research, different harmonics mixes with the fundamental frequency and noise. To describe this
situation, the equation can be shown as following [112]:
𝑋 = 𝐴𝑆 (7.4)

91
where elements of X is different harmonics in the collected stray flux data, elements of S is
the original signals, A is the mixing matrix. To separate the harmonics from the mixtures of
signals, it can be assumed that the mixing matrix A can be inverted with appropriate mixing
coefficients:
𝑆 = 𝑊𝑋 (7.5)
Where W is the coefficient matrix. In this case, the problem of ICA turns to calculate the
statistical independent components of different solutions of X. As mentioned before, there are
serval methods to solve ICA problem. Referenced the concept of mutual information, the first
different entropy is shown as following:
𝐻(𝑦) = − ∫ 𝑓(𝑦) log 𝑓(𝑦)𝑑𝑦 (7.6)
where 𝐻 is the first different entropy, 𝑦 = (𝑦1,𝑦2, … , 𝑦𝑛) is random vector, 𝑓(𝑦) is density. As
the largest entropy is the one with a Gaussian variable, the definition of negentropy can be
found by normalizing the differential entropy.
𝐽(𝑦) = 𝐻(𝑦𝑔𝑎𝑢𝑠𝑠) − 𝐻(𝑦) (7.7)
where 𝑦𝑔𝑎𝑢𝑠𝑠 is a Gaussian random vector with the same matrix as 𝑦 . The negentropy is zero
with Gaussian variable and always nonnegative. In this case, mutual information can be shown
as following:
𝐼(𝑦1,𝑦2, … , 𝑦𝑛) = 𝐽(𝑦) − ∑ 𝐽(𝑦𝑖)𝑖 (7.8)
where I is mutual information. As the mutual information includes the independence of random
variable, it can be used to get the ICA transform. Due to the matrix W is found, the mutual
information of the different situations of mixed matrix X can be minimized [112]. In this case,
the independent components can be found.
Basically, feature extraction maps the processing of data from higher dimensional space
to lower dimensional space. This step is intended to avoid the phenomenon of the curse of
dimensionality. ICA was used here to reduce the feature dimensionality that contains 95% of
the variation in eigenvalues. In this work, feature extraction produced several independent
components (ICs) based on the eigenvalues. Also, from feature extraction using ICA, we can
understand that there is a change from data features becomes components which are
independent and uncorrelated, respectively. The first three independent and principal
components are plotted in Fig 7.9. It can be observed that the clusters for the four conditions

92
are well separated. It can be seen that feature extraction using ICA can effectively separate well
almost all conditions without overlapping.
Figure 7.9 ICA analysis results of different mechanical failures
Figure 7.10 Comparison of spectrograms between stray flux and stator current
A comparison of the spectrograms for stray flux and stator current is shown in Fig 7.10.
One of the advantages of the spectrogram is that it is easy to identify patterns in the time-

93
frequency domain. Fig 7.10 a presents a comparison of the stray flux data in the healthy state
and with a bearing misalignment. Several high frequency harmonics appear in the stray flux
spectrogram for bearing misalignment between 200 Hz to 600 Hz. However, in Fig 7.10 b, by
measuring the stator current in the steady state, spectrograms of a healthy machine and one with
a bearing misalignment are illustrated. It is unlikely that there is any obvious frequency
components changing as the stray flux. The reason for this is that the stray flux information
reflects the air-gap flux, which is directly linked to the health state of the machine; however,
the stator current feature may be overwhelmed other components such as those for unbalanced
load. By using the GMR sensor, stray flux monitoring gives a better performance in mechanical
failure detection than the current basic monitoring technology.
7.5 Chapter summary
In this chapter, the proposed GMR sensor monitoring system detects two mechanical
failures which are unbalanced load and bearing misalignment. Both of these types of
mechanical failure can lead to machine air-gap eccentricity. Furthermore, the air gap
eccentricity causes imbalance in magnetic pull and a nonsymmetrical air gap flux density
distribution, which may cause unexpected vibrations and reductions in machine performance
and efficiency. A comparison of stray flux data and current data for mechanical failures is also
provided in this chapter. Where current data shows global information of the whole windings
of the machine, the analysis of stray flux can illustrate local information which includes more
detail and better resolutions
An FEA simulation model has been built in this chapter to investigate the influences of
static and dynamic eccentricity on stray flux. The simulation results illustrate that both static
and dynamic eccentricity can cause additional harmonic in the stray flux, which provide support
for numerical analysis. A brushless DC test bench is built to simulate unbalanced load and
bearing misalignment. By referencing the stray flux spectrum, it was found that the fundamental
frequency component 𝑓𝑠 and the side band 2𝑓𝑠 increased dramatically during the different states
of unbalance load applied in the test bench. Additionally, the stray flux spectrum for bearing
misalignment shows increases in several higher order harmonic components compared with
healthy state base-line information. ICA is applied to these four sets of stray flux data, and it
can be observed that the clusters the for four conditions are well separated, which suggests that
this can be a good method to distinguish different types of failures. A comparison of stray flux
and current detection is applied using the spectrogram, which it shows that stray flux gives a

94
better performance than current-based monitoring technology, as the richness signal
information.

95
Chapter 8 Conclusions and Future
Work
The key points and essential outcomes of the thesis are summarised in this chapter.
Recommendations for the future work are also mentioned.
8.1 Research conclusion
Condition monitoring of electrical machines can not only reduce downtime but also
increase reliability. To identify the research objectives, a comprehensive literature review has
been carried out in this research, concerning failure modes and their causes. It is illustrated that
stator winding failures and mechanical failures involving unbalance loads and bearing
misalignments are the major types of failure occurring in these machines. Additionally,
dynamic load is another major reason for failure. Therefore, it is necessary to develop a suitable
condition monitoring system for electrical machines.
Previous research studies have mainly been based on different types of monitoring
technologies, especially those based on stator current monitoring technology. However, the
challenge of current monitoring methods include that they are invasive approaches and it is hard
to distinguish between different types of failure. By comparing different monitoring techniques,
it seems that stray flux analysis may be a good potential approach to electrical machine
monitoring, as it is non-invasive approach, and delivers rich information. In this study, a novel
magnetic sensor-based health monitoring system is designed and validated against different
types of failures in electrical machines.
The research in this thesis is focused on developing and investigating stray magnetic
field-based condition monitoring for electrical machines through analytical, numerical and
experimental studies. The theoretical background of stray flux in electrical machines is
described in chapter 3. By making several assumptions, a simple analytical model is built to
represent the relationship between air-gap flux density and stray flux, which is influenced by
the geometry of the machine and the electromagnetic properties of the stator lamination and

96
external frame only. Air-gap flux is an important parameter in an electrical machine’s
monitoring and analytical modelling, and the proposed stray flux monitoring system is also able
to identify abnormalities in the electrical machine. In this case, a bridge can be built between
the stray flux signal and different failures in electrical machine. Additionally, the feature
extraction method used in this research is explained, which is the short time Fourier transform.
The STFT can provide a spectrogram of the harmonics in an electrical machine depending on
time variation. In the transient state, the spectrogram shows patterns of the distribution of
changes in harmonics.
A novel stray flux-based machine health monitoring system is developed in this research,
including a magnetic sensing system, and a wired and wireless data acquisition system.
Comparison with other magnetic sensors, GMR sensors can provide a large detection range,
high sensitivity and high bandwidth, and these devices are used in this research. Numerical
models of the stray magnetic field are built to investigate the distribution of stray flux in
electrical machines. From the simulation results, the location of the placement of the GMR
sensor is determined, which is at the middle of the machine’s external frame. Additionally, the
z-direction of the stray flux is found to provide the strongest signal among the three directions.
Combined with a signal conditioning circuit, a GMR sensor PCB board is designed and tested
in chapter 3. Subsequently, the NI USB-6125 card is applied to the wired data acquisition
system with a fully functional Labview program. Moreover, a wireless sensor network is also
built to achieve wireless communication and high sampling rates of data acquisition.
Real-time load monitoring is carried out through the application of the proposed stray
flux system design. Existing load monitoring methods for electrical machines are generally
effective, but suffer from sensitivity problems at low speeds and non-linearity problems at high
supply frequencies. The proposed GMR condition monitoring system is used to illustrate the
load state during machine’s operation. Three induction motors with different starting loading
profiles are tested at two separate test benches and their results are analysed in the time-
frequency domain. Their steady features and dynamic load response time through spectrograms
under variable loads are extracted and correlated with load variations based on spectrogram
information.
The relationship between stray flux information and stator winding failures is also
investigated using the proposed stray magnetic field monitoring system. Simulation results
from different stator winding short-circuits can provide the information about changes in stray
flux. The thermal simulation of winding failures shows that there will be a temperature
increasing when a short-circuit happens in the windings, which accelerates the degradation of

97
the winding. Based on the simulations, GMR sensors and arrays can be chosen and developed
to meet test requirements. Experimental results have confirmed that the proposed condition
monitoring system is capable of capturing stray magnetic flux even though the leaking flux
signal is quite weak. By studying the measured stray flux in the time domain and especially in
the frequency domain, several significant harmonic components can be used as indicators of
stator winding faults. Phase-to-phase and phase-to-ground short-circuit failures are tested in the
induction machine experimental bench. In comparing these two types of winding failures, the
harmonic component with an amplitude of 30 Hz (half of fundamental frequency) is reduced
once a phase-to-ground failure happens. However, other harmonic components are increased
with reference to the healthy state of the tested induction machines. Thus, depending on the
change in this frequency component of stray flux, these two winding failures can be separated.
Mechanical failures are major issues in machine diagnosis. The developed GMR sensor
monitoring system can detect two types of mechanical failure which are unbalanced load and
bearing misalignment. Both of these mechanical failures can lead to eccentricity in the
machine’s air-gap. Furthermore, air gap eccentricity causes unbalanced magnetic pull and a
non-symmetrical air gap flux density distribution, which may casuse unexpected vibration and
reductions in machine performance and efficiency. An FEA simulation model has been built in
chapter 7 to investigate the influence of static and dynamic eccentricity on the stray flux. The
simulation results illustrate that both static and dynamic eccentricity can cause additional
harmonics in the stray flux, which provide support for numerical analysis. A brushless DC test
bench is built to simulate the unbalance load and bearing misalignment. By referencing the
stray flux spectrum, the fundamental frequency component fs and the side band 2fs increased
dramatically during the different states of unbalanced load occurring in the test bench.
Additionally, the stray flux spectrum for bearing misalignment shows increases in several
higher order harmonic components compared with healthy state base-line information. ICA is
applied to these four sets of stray flux data, and it can be observed that the clusters for the four
conditions are well separated, which means that this may be a good method to distinguish
between different types of failures. A comparison between stray flux and current detection is
applied using spectrograms, showing stray flux analysis gives better performance than current-
based monitoring, due to the richness information in the signal.
8.2 Future work
Future work in stray flux condition monitoring in electrical machines will be geared
towards improvements in the performance of failure detection and feature extraction, such as

98
in providing early warning systems and lifetime predictions. These improvements will also help
in moving towards commercial feasibility. As it is a non-invasive, low-cost approach, the
proposed stray flux monitoring system can be implemented in industrial drive systems to
increase reliability and reduce maintenance costs.
Although the stray flux model in this research is built with numerical and analytical
approaches, the analytical model is a simplified model to demonstrate the methodology and
theoretical background of stray flux monitoring. In reality, different aspects of machine design
will influence the stray flux information collected, such as in terms of phase shift and noise.
Additionally, finite element analysis is time-consuming. To develop a detailed analytical stray
flux model, it would not only be helpful to build a model-based condition monitoring system
so as to reduce calculation time, but also to improve the understanding of the principles of stray
flux distribution inside electrical machines.
At this moment, the proposed stray flux condition monitoring system usese GMR
sensors to collect the weak magnetic flux information. Although GMR sensors can provide
accurate stray flux information, the drawback of this approach is that one GMR sensor can only
collect stray flux information at one point. Future work may focus on implementing magnetic
cameras in the stray flux condition monitoring system. Magnetic cameras could be applied to
capture not only the stray flux at one point, but also stray flux density distributions over larger
areas. However, the sampling frequency of magnetic cameras are relatively low at the moment,
and this might be improved in future research work. Additionally, to improve sensitivity and
dynamic range, the tunnel magnetoresistance (TMR) sensor could be applied in the monitoring
system instead of the current GMR sensor, and this might can provide more accurate local
health information about the machine.
As an electrical machine is totally enclosed, the investigation of the mechanisms and
degradations associated with different failures, especially of the winding, insulation and
bearings, are still not fully understood. Moreover, every component of an electrical machine
may suffer from thermal, electrical and machine stresses. These factors may influence each
other, and so the complexities of the failure procedure are increased. To determine the
mechanisms of the different failures, a lifetime model of each component may be able to be
built in the future to help in achieving early warning and prognosis.
Stray flux monitoring technology has its own disadvantages, such as the issue of noise.
Future studies of stray flux monitoring should consider data fusion and the implementation of
advanced signal processing and decision making algorithms. By combining stray flux analysis

99
with other monitoring techniques such as of temperature, current and vibration, the accuracy
and capability of distinguishing between different types of failure can be increased in future
research. Furthermore, non-negative matrix factorization (NMF) is an approach to decompose
the features from data, which is more effective than ICA and could be used in the future. The
experiments and failure samples of electrical machines used in this research are limited due to
restrictions of the research resources. Future work also needs to focus on conducting more
experimental studies and failure tests for a stray flux condition monitoring system. In this case,
the relationship between the stray magnetic field and failures in electrical machines can be more
fully understood.

100
References
[1] Z. Pinjia, L. Bin, and T. G. Habetler, "An active stator temperature estimation technique
for thermal protection of inverter-fed induction motors with considerations of impaired
cooling detection," in Electric Machines and Drives Conference, 2009. IEMDC '09.
IEEE International, 2009, pp. 1326-1332.
[2] B. Yazici, G. B. Kliman, W. J. Premerlani, R. A. Koegl, and A. Abdel-Malek, "An
adaptive, on-line, statistical method for detection of broken bars in motors using stator
current and torque estimation," in Industry Applications Conference, 1997. Thirty-
Second IAS Annual Meeting, IAS '97., Conference Record of the 1997 IEEE, 1997, pp.
221-226 vol.1.
[3] B. Boulkroune, M. Galvez-Carrillo, and M. Kinnaert, "Additive and multiplicative fault
diagnosis for a doubly-fed induction generator," in Control Applications (CCA), 2011
IEEE International Conference on, 2011, pp. 1302-1308.
[4] I. Rodriguez, R. Alves, and V. Guzman, "Analysis of air gap flux to detect induction
motor faults," in Universities Power Engineering Conference, 2006. UPEC '06.
Proceedings of the 41st International, 2006, pp. 690-694.
[5] J. Li, D. Choi, and Y. Cho, "Analysis of rotor eccentricity in switched reluctance motor
with parallel winding using fem," Ieee Transactions on Magnetics, vol. 45, pp. 2851-
2854, Jun 2009.
[6] A. H. Bonnett, "Analysis of winding failures in three-phase squirrel cage induction
motors," Industry Applications, IEEE Transactions on, vol. IA-14, pp. 223-226, 1978.
[7] T. De Rybel, A. Singh, J. A. Vandermaar, M. Wang, J. R. Marti, and K. D. Srivastava,
"Apparatus for online power transformer winding monitoring using bushing tap
injection," Ieee Transactions on Power Delivery, vol. 24, pp. 996-1003, Jul 2009.
[8] M. A. Awadallah and M. A. Morcos, "Application of AI tools in fault diagnosis of
electrical machines and drives - An overview," Ieee Transactions on Energy Conversion,
vol. 18, pp. 245-251, Jun 2003.
[9] P. S. Barendse, B. Herndler, M. A. Khan, and P. Pillay, "The application of wavelets
for the detection of inter-turn faults in induction machines," in Electric Machines and
Drives Conference, 2009. IEMDC '09. IEEE International, 2009, pp. 1401-1407.

101
[10] Q. D. Sun, Z. X. Zhou, and W. Q. Guo, "An approach of insulation state on-line
monitoring and fault diagnosis for generator and its application," in Power and Energy
Engineering Conference (APPEEC), 2010 Asia-Pacific, 2010, pp. 1-6.
[11] Y. Amirat, V. Choqueuse, M. E. H. Benbouzid, and J. F. Charpentier, "Bearing fault
detection in DFIG-based wind turbines using the first Intrinsic Mode Function," in
Electrical Machines (ICEM), 2010 XIX International Conference on, 2010, pp. 1-6.
[12] C. Harlisca, L. Szabo, L. Frosini, and A. Albini, "Bearing faults detection in induction
machines based on statistical processing of the stray fluxes measurements," in
Diagnostics for Electric Machines, Power Electronics and Drives (SDEMPED), 2013
9th IEEE International Symposium on, 2013, pp. 371-376.
[13] A. Cassat, C. Espanet, and N. Wavre, "BLDC motor stator and rotor iron losses and
thermal behavior based on lumped schemes and 3-D FEM analysis," Ieee Transactions
on Industry Applications, vol. 39, pp. 1314-1322, Sep-Oct 2003.
[14] A. Yazidi, H. Henao, and G. A. Capolino, "Broken rotor bars fault detection in squirrel
cage induction machines," in Electric Machines and Drives, 2005 IEEE International
Conference on, 2005, pp. 741-747.
[15] Z. Yujiao, R. Jiangjun, H. Tao, Y. Xiaoping, Z. Houquan, and Y. Gao, "Calculation of
temperature rise in air-cooled induction motors through 3-d coupled electromagnetic
fluid-dynamical and thermal finite-element analysis," Magnetics, IEEE Transactions on,
vol. 48, pp. 1047-1050, 2012.
[16] K. Bacha, M. Gossa, H. Henao, and G. A. Capolino, "Comparative investigation of
diagnosis media of stator voltage asymmetry and rotor broken bars in induction
machines," in IEEE Industrial Electronics, IECON 2006 - 32nd Annual Conference on,
2006, pp. 5040-5045.
[17] C. Kral, A. Haumer, M. Haigis, H. Lang, and H. Kapeller, "Comparison of a cfd analysis
and a thermal equivalent circuit model of a tefc induction machine with measurements,"
Ieee Transactions on Energy Conversion, vol. 24, pp. 809-818, Dec 2009.
[18] Y. Wenxian, P. J. Tavner, and M. Wilkinson, "Condition monitoring and fault diagnosis
of a wind turbine with a synchronous generator using wavelet transforms," in Power
Electronics, Machines and Drives, 2008. PEMD 2008. 4th IET Conference on, 2008,
pp. 6-10.
[19] C. J. Crabtree, S. Djurovic, P. J. Tavner, and A. C. Smith, "Condition monitoring of a
wind turbine DFIG by current or power analysis," in Power Electronics, Machines and
Drives (PEMD 2010), 5th IET International Conference on, 2010, pp. 1-6.

102
[20] M. R. Wilkinson, F. Spinato, and P. J. Tavner, "Condition monitoring of generators
other subassemblies in wind turbine drive trains," in Diagnostics for Electric Machines,
Power Electronics and Drives, 2007. SDEMPED 2007. IEEE International Symposium
on, 2007, pp. 388-392.
[21] S. J. Watson, B. J. Xiang, Y. Wenxian, P. J. Tavner, and C. J. Crabtree, "Condition
monitoring of the power output of wind turbine generators using wavelets," Energy
Conversion, IEEE Transactions on, vol. 25, pp. 715-721, 2010.
[22] L. M. Popa, B. B. Jensen, E. Ritchie, and I. Boldea, "Condition monitoring of wind
generators," in Industry Applications Conference, 2003. 38th IAS Annual Meeting.
Conference Record of the, 2003, pp. 1839-1846 vol.3.
[23] Y. Wenxian, P. J. Tavner, C. J. Crabtree, and M. Wilkinson, "Cost-effective condition
monitoring for wind turbines," Industrial Electronics, IEEE Transactions on, vol. 57,
pp. 263-271, 2010.
[24] G. Gao and W. Chen, "Design challenges of wind turbine generators," in Electrical
Insulation Conference, 2009. EIC 2009. IEEE, 2009, pp. 146-152.
[25] J. Vieira, M. Nunes, and U. H. Bezerra, "Design of optimal PI controllers for doubly
fed induction generators in wind turbines using genetic algorithm," in Power and
Energy Society General Meeting - Conversion and Delivery of Electrical Energy in the
21st Century, 2008 IEEE, 2008, pp. 1-7.
[26] L. Zarri, M. Mengoni, Y. Gritli, A. Tani, F. Filippetti, G. Serra, and D. Casadei,
"Detection and localization of stator resistance dissymmetry based on multiple reference
frame controllers in multiphase induction motor drives," Industrial Electronics, IEEE
Transactions on, vol. 60, pp. 3506-3518, 2013.
[27] T. Utsumi and I. Yamaguchi, "Detection and location of inter-turn short-circuit in linear
induction motor," in Diagnostics for Electric Machines, Power Electronics and Drives,
2003. SDEMPED 2003. 4th IEEE International Symposium on, 2003, pp. 63-68.
[28] J. Penman, H. G. Sedding, B. A. Lloyd, and W. T. Fink, "Detection and location of
interturn short-circuits in the stator windings of operating motors," Energy Conversion,
IEEE Transactions on, vol. 9, pp. 652-658, 1994.
[29] C. Demian, A. Mpanda-Mabwe, H. Henao, and G. A. Capolino, "Detection of induction
machines rotor faults at standstill using signals injection," Ieee Transactions on Industry
Applications, vol. 40, pp. 1550-1559, Nov-Dec 2004.
[30] G. Joksimovic and J. Penman, "The detection of interturn short-circuits in the stator
windings of operating motors," in Industrial Electronics Society, 1998. IECON '98.
Proceedings of the 24th Annual Conference of the IEEE, 1998, pp. 1974-1979 vol.4.

103
[31] H. Douglas, P. Pillay, and P. Barendse, "The detection of interturn stator faults in
doubly-fed induction generators," in Industry Applications Conference, 2005. Fourtieth
IAS Annual Meeting. Conference Record of the 2005, 2005, pp. 1097-1102 Vol. 2.
[32] C. Kral, F. Pirker, and G. Pascoli, "Detection of rotor faults in squirrel-cage induction
machines at standstill for batch tests by means of the Vienna Monitoring Method," Ieee
Transactions on Industry Applications, vol. 38, pp. 618-624, May-Jun 2002.
[33] V. Dinkhauser and F. W. Fuchs, "Detection of rotor turn-to-turn faults in doubly-fed
induction generators in wind energy plants by means of observers," in Power
Electronics and Applications, 2009. EPE '09. 13th European Conference on, 2009, pp.
1-10.
[34] A. Fazli, M. Fazli, S. Hesami, A. Seif, and A. Shafighi Malekshah, "The detection of
VFC and STATCOM faults in Doubly Fed Induction Generator," in Environment and
Electrical Engineering (EEEIC), 2012 11th International Conference on, 2012, pp. 161-
165.
[35] K. D. Sousa, A. A. Hafner, H. J. Kalinowski, and J. C. C. da Silva, "Determination of
temperature dynamics and mechanical and stator losses relationships in a three-phase
induction motor using fiber bragg grating sensors," Ieee Sensors Journal, vol. 12, pp.
3054-3061, Oct 2012.
[36] L. Frosini, A. Borin, L. Girometta, and G. Venchi, "Development of a leakage flux
measurement system for condition monitoring of electrical drives," in Diagnostics for
Electric Machines, Power Electronics & Drives (SDEMPED), 2011 IEEE International
Symposium on, 2011, pp. 356-363.
[37] E. Al-Ahmar, M. E. H. Benbouzid, Y. Amirat, and S. E. Ben Elghali, "DFIG-based wind
turbine fault diagnosis using a specific discrete wavelet transform," in Electrical
Machines, 2008. ICEM 2008. 18th International Conference on, 2008, pp. 1-6.
[38] C. Harlisca, L. Szabo, L. Frosini, and A. Albini, "Diagnosis of rolling bearings faults in
electric machines through stray magnetic flux monitoring," in Advanced Topics in
Electrical Engineering (ATEE), 2013 8th International Symposium on, 2013, pp. 1-6.
[39] S. Djurovic, S. Williamson, and A. Renfrew, "Dynamic model for doubly-fed induction
generators with unbalanced excitation, both with and without winding faults," Electric
Power Applications, IET, vol. 3, pp. 171-177, 2009.
[40] M. J. Islam, H. V. Khang, A. Repo, and A. Arkkio, "Eddy-current loss and temperature
rise in the form-wound stator winding of an inverter-fed cage induction motor,"
Magnetics, IEEE Transactions on, vol. 46, pp. 3413-3416, 2010.

104
[41] R. Romary, R. Pusca, J. P. Lecointe, and J. F. Brudny, "Electrical machines fault
diagnosis by stray flux analysis," 2013 Ieee Workshop on Electrical Machines Design,
Control and Diagnosis (Wemdcd), 2013.
[42] Y. S. Chen, Y. D. Cheng, J. J. Liao, and C. C. Chiu, "Electromagnetic-rotordynamic
integrated vibration analysis for electrical machines," Proceedings of the Institution of
Mechanical Engineers Part C-Journal of Mechanical Engineering Science, vol. 223, pp.
2549-2559, Nov 2009.
[43] M. R. Bissonnette, "End-winding vibration monitoring and interpretation," in Electrical
Insulation (ISEI), Conference Record of the 2012 IEEE International Symposium on,
2012, pp. 285-290.
[44] S. Ul Haq and T. Bashir, "Evaluation of induction motor groundwall insulation using
infrared thermography," Second International Conference on Emerging Technologies
2006, Proceedings, pp. 416-420, 2006.
[45] D. Casadei, F. Filippetti, A. Stefani, C. Rossi, A. Yazidi, and G. A. Capolino,
"Experimental fault characterization of doubly fed induction machines for wind power
generation," 2006 International Symposium on Power Electronics, Electrical Drives,
Automation and Motion, Vols 1-3, pp. 1281-1286, 2006.
[46] D. Casadei, F. Filippetti, A. Stefani, C. Rossi, A. Yazidi, and G. A. Capolino,
"Experimental fault characterization of doubly fed induction machines for wind power
generation," in Power Electronics, Electrical Drives, Automation and Motion, 2006.
SPEEDAM 2006. International Symposium on, 2006, pp. 1281-1286.
[47] S. P. Verma and R. S. Girgis, "Experimental verification of resonant frequencies and
vibration behaviour of stators of electrical machines. Part 1: Models, experimental
procedure and apparatus," Electric Power Applications, IEE Proceedings B, vol. 128,
pp. 12-21, 1981.
[48] V. Kontargyri, C. Tsirekis, S. Kabanaros, A. Sakarellos, A. Moronis, N. Kolliopoulos,
and S. Kaminaris, "An expert system for fault diagnosis, repairing and maintenance of
electrical machines," Aee '07: Proceedings of the 6th Wseas International Conference
on Applications of Electrical Engineering, pp. 166-171, 2007.
[49] M. R. Wilkinson and P. J. Tavner, "Extracting condition monitoring information from
a wind turbine drive train," in Universities Power Engineering Conference, 2004. UPEC
2004. 39th International, 2004, pp. 591-594 vol. 1.
[50] L. R. Cusido, A. Garcia, J. A. Rosero, and J. A. Ortega, "Fault detection in induction
machines by using continuous and discrete wavelet decomposition," in Power
Electronics and Applications, 2007 European Conference on, 2007, pp. 1-8.

105
[51] D. Basak, A. Tiwari, and S. P. Das, "Fault diagnosis and condition monitoring of
electrical machines - A review," 2006 IEEE International Conference on Industrial
Technology, Vols 1-6, pp. 2987-2992, 2006.
[52] S. Nandi and H. A. Toliyat, "Fault diagnosis of electrical machines - A review,"
Iemdc'99 - Ieee International Electric Machines and Drives Conference, Proceedings,
pp. 219-221, 1999.
[53] A. Yazidi, H. Henao, G. A. Capolino, M. Artioli, F. Filippetti, and D. Casadei, "Flux
signature analysis: An alternative method for the fault diagnosis of induction machines,"
in Power Tech, 2005 IEEE Russia, 2005, pp. 1-6.
[54] H. Henao, C. Demian, and G. A. Capolino, "A frequency-domain detection of stator
winding faults in induction machines using an external flux sensor," Ieee Transactions
on Industry Applications, vol. 39, pp. 1272-1279, Sep-Oct 2003.
[55] H. Henao, C. Demian, and G. A. Capolino, "A frequency-domain detection of stator
winding faults in induction machines using an external flux sensor," Industry
Applications, IEEE Transactions on, vol. 39, pp. 1272-1279, 2003.
[56] S. M. J. R. Fatemi, H. Henao, and G. A. Capolino, "Gearbox monitoring by using the
stray flux in an induction machine based electromechanical system," 2008 Ieee
Mediterranean Electrotechnical Conference, Vols 1 and 2, pp. 463-468, 2008.
[57] M. S. N. Sdid and M. E. H. Benbouzid, "H-G diagram based rotor parameters
identification for induction motors thermal monitoring," Energy Conversion, IEEE
Transactions on, vol. 15, pp. 14-18, 2000.
[58] S. H. Kia, H. Henao, and G. A. Capolino, "A high-resolution frequency estimation
method for three-phase induction machine fault detection," Ieee Transactions on
Industrial Electronics, vol. 54, pp. 2305-2314, Aug 2007.
[59] K. A. Folly and S. Sheetekela, "Impact of fixed and variable speed wind generators on
the transient stability of a power system network," in Power Systems Conference and
Exposition, 2009. PSCE '09. IEEE/PES, 2009, pp. 1-7.
[60] E. Levi, A. Lamine, and A. Cavagnino, "Impact of stray load losses on vector control
accuracy in current-fed induction motor drives," Energy Conversion, IEEE
Transactions on, vol. 21, pp. 442-450, 2006.
[61] A. Yazidi, H. Hena, G. A. Capolino, M. Artioli, and F. Filippetti, "Improvement of
frequency resolution for three-phase induction machine fault diagnosis," in Industry
Applications Conference, 2005. Fourtieth IAS Annual Meeting. Conference Record of
the 2005, 2005, pp. 20-25 Vol. 1.

106
[62] A. H. Bonnett and C. Yung, "Increased efficiency versus increased reliability," Industry
Applications Magazine, IEEE, vol. 14, pp. 29-36, 2008.
[63] A. M. da Silva, R. J. Povinelli, and N. A. O. Demerdash, "Induction machine broken
bar and stator short-circuit fault diagnostics based on three-phase stator current
envelopes," Industrial Electronics, IEEE Transactions on, vol. 55, pp. 1310-1318, 2008.
[64] S. H. Kia, H. Henao, G. A. Capolino, and C. Martis, "Induction machine broken bars
fault detection using stray flux after supply disconnection," in IEEE Industrial
Electronics, IECON 2006 - 32nd Annual Conference on, 2006, pp. 1498-1503.
[65] K. Bacha, H. Henao, M. Gossa, and G. A. Capolino, "Induction machine fault detection
using stray flux EMF measurement and neural network-based decision," Electric Power
Systems Research, vol. 78, pp. 1247-1255, Jul 2008.
[66] J. Cusido, J. A. Rosero, J. A. Ortega, A. Garcia, and L. Romeral, "Induction motor fault
detection by using wavelet decomposition on dq0 components," in Industrial
Electronics, 2006 IEEE International Symposium on, 2006, pp. 2406-2411.
[67] J.-q. Li, L. Ma, and D.-y. Wang, "Influence of stator turn-to-turn short-circuit on
magnetic field of DFIG," in Electrical Machines and Systems (ICEMS), 2011
International Conference on, 2011, pp. 1-5.
[68] S. N. Huang and H. Y. Yu, "Intelligent fault monitoring and diagnosis in electrical
machines," Measurement, vol. 46, pp. 3640-3646, Nov 2013.
[69] A. J. M. Cardoso, S. M. A. Cruz, and D. S. B. Fonseca, "Inter-turn stator winding fault
diagnosis in three-phase induction motors, by Park's vector approach," Energy
Conversion, IEEE Transactions on, vol. 14, pp. 595-598, 1999.
[70] B.-q. Xu, H.-m. Li, and L.-l. Sun, "Joint detection of stator winding inter-turn short-
circuit and rotor bar breaking fault in squirrel cage induction motors," in Power System
Technology, 2002. Proceedings. PowerCon 2002. International Conference on, 2002,
pp. 761-764 vol.2.
[71] T. Utsumi and I. Yamaguchi, "Location of inter-turn short-circuit in linear induction
motor by dc measurement," in Diagnostics for Electric Machines, Power Electronics
and Drives, 2005. SDEMPED 2005. 5th IEEE International Symposium on, 2005, pp.
1-5.
[72] Q. F. Lu, Z. T. Cao, and E. Ritchie, "Model of stator inter-turn short-circuit fault in
doubly-fed induction generators for wind turbine," in Power Electronics Specialists
Conference, 2004. PESC 04. 2004 IEEE 35th Annual, 2004, pp. 932-937 Vol.2.

107
[73] L. Qian, T. Breikin, and W. Hong, "Modelling and fault diagnosis for DFIGs with multi-
phase inter-turn short-circuit," in Advanced Mechatronic Systems (ICAMechS), 2011
International Conference on, 2011, pp. 155-160.
[74] R. F. M. Brandao, J. A. B. Carvalho, and F. P. M. Barbosa, "Monitoring systems for
wind generators maintenance," in Universities Power Engineering Conference (UPEC),
2010 45th International, 2010, pp. 1-4.
[75] P. A. Zotos, "Motor failures due to steep fronted switching surges: the need for surge
protection - user's experience," Industry Applications, IEEE Transactions on, vol. 30, p.
1514, 1994.
[76] T. A. Lipo and K. C. Chang, "A new approach to flux and torque-sensing in induction
machines," Industry Applications, IEEE Transactions on, vol. IA-22, pp. 731-737, 1986.
[77] C. Siwei and T. G. Habetler, "A new method to detect stator turn-to-turn faults in a
closed-loop multiple-motor drive system," in Diagnostics for Electric Machines, Power
Electronics and Drives, 2009. SDEMPED 2009. IEEE International Symposium on,
2009, pp. 1-6.
[78] A. Yazidi, G. A. Capolino, F. Filippetti, and D. Casadei, "A new monitoring system for
wind turbines with doubly-fed induction generators," in Electrotechnical Conference,
2006. MELECON 2006. IEEE Mediterranean, 2006, pp. 1142-1145.
[79] L. Frosini, A. Borin, A. Albini, and F. Benzi, "New techniques to simulate and diagnose
stator winding faults in low voltage induction motors," in Electrical Machines (ICEM),
2012 XXth International Conference on, 2012, pp. 1783-1789.
[80] J. Castellon, J. Bouquart, J. P. Reboul, and A. Toureille, "A new tool to study the ageing
of the winding insulation of electrical machines," in Electrical Insulation and Dielectric
Phenomena, 1997. IEEE 1997 Annual Report., Conference on, 1997, pp. 447-450 vol.2.
[81] T. M. Wolbank, P. Nussbaumer, H. Chen, and P. E. Macheiner, "Non-invasive detection
of rotor cage faults in inverter fed induction machines at no load and low speed," 2009
Ieee International Symposium on Diagnostics for Electric Machines, Power Electronics
and Drives, pp. 143-149, 2009.
[82] L. Frosini, A. Borin, L. Girometta, and G. Venchi, "A novel approach to detect short-
circuits in low voltage induction motor by stray flux measurement," in Electrical
Machines (ICEM), 2012 XXth International Conference on, 2012, pp. 1538-1544.
[83] L. Qian and T. Breikin, "Observer based fault detection for stator inter-turn short-circuit
in wind turbine DFIGs," in Modelling, Identification and Control (ICMIC), The 2010
International Conference on, 2010, pp. 483-488.

108
[84] S. Williamson and S. Djurovic, "Origins of stator current spectra in DFIGs with winding
faults and excitation asymmetries," in Electric Machines and Drives Conference, 2009.
IEMDC '09. IEEE International, 2009, pp. 563-570.
[85] F. Blaabjerg, R. Teodorescu, M. Liserre, and A. V. Timbus, "Overview of control and
grid synchronization for distributed power generation systems," Ieee Transactions on
Industrial Electronics, vol. 53, pp. 1398-1409, Oct 2006.
[86] C. Kral, A. Haumer, and S. Lee, "A practical thermal model for the estimation of
permanent magnet and stator winding temperatures," Power Electronics, IEEE
Transactions on, vol. PP, pp. 1-1, 2013.
[87] D. F. Leite, M. B. Hell, P. H. Diez, B. S. L. Gariglio, L. O. Nascimento, and P. Costa,
"Real-time model-based fault detection and diagnosis for alternators and induction
motors," in Electric Machines & Drives Conference, 2007. IEMDC '07. IEEE
International, 2007, pp. 202-207.
[88] A. Gandhi, T. Corrigan, and L. Parsa, "Recent advances in modeling and online
detection of stator interturn faults in electrical motors," Industrial Electronics, IEEE
Transactions on, vol. 58, pp. 1564-1575, 2011.
[89] F. Spinato, P. J. Tavner, G. J. W. van Bussel, and E. Koutoulakos, "Reliability of wind
turbine subassemblies," Renewable Power Generation, IET, vol. 3, pp. 387-401, 2009.
[90] K. Alewine and W. Chen, "A review of electrical winding failures in wind turbine
generators," Electrical Insulation Magazine, IEEE, vol. 28, pp. 8-13, 2012.
[91] Z. Daneshi-Far, G. A. Capolino, and H. Henao, "Review of failures and condition
monitoring in wind turbine generators," in Electrical Machines (ICEM), 2010 XIX
International Conference on, 2010, pp. 1-6.
[92] M. El Hachemi Benbouzid, "A review of induction motors signature analysis as a
medium for faults detection," Industrial Electronics, IEEE Transactions on, vol. 47, pp.
984-993, 2000.
[93] A. Siddique, G. S. Yadava, and B. Singh, "A review of stator fault monitoring
techniques of induction motors," Energy Conversion, IEEE Transactions on, vol. 20,
pp. 106-114, 2005.
[94] M. Moghadasian, R. Kiani, F. Betin, A. Sivert, V. Lanfranchi, A. Yazidi, and G. A.
Capolino, "Sensorless position control of six-phase induction machine using fuzzy-PI
system," in Industrial Electronics (ISIE), 2011 IEEE International Symposium on, 2011,
pp. 739-744.

109
[95] J. Martinez, P. C. Kjar, P. Rodriguez, and R. Teodorescu, "Short-circuit signatures from
different wind turbine generator types," in Power Systems Conference and Exposition
(PSCE), 2011 IEEE/PES, 2011, pp. 1-7.
[96] A. Boglietti, A. Cavagnino, M. Lazzari, and M. Pastorelli, "A simplified thermal model
for variable speed self cooled industrial induction motor," in Industry Applications
Conference, 2002. 37th IAS Annual Meeting. Conference Record of the, 2002, pp. 723-
730 vol.2.
[97] Y. Gritli, A. Stefani, F. Filippetti, and A. Chatti, "Stator fault analysis based on wavelet
technique for wind turbines equipped with DFIG," in Clean Electrical Power, 2009
International Conference on, 2009, pp. 485-491.
[98] J. Aguayo, A. Claudio, L. G. Vela, S. Lesecq, and A. Barraud, "Stator winding fault
detection for an induction motor drive using actuator as sensor principle," in Power
Electronics Specialist Conference, 2003. PESC '03. 2003 IEEE 34th Annual, 2003, pp.
1347-1351 vol.3.
[99] S. M. A. Cruz and A. J. M. Cardoso, "Stator winding fault diagnosis in three-phase
synchronous and asynchronous motors, by the extended Park's vector approach," in
Industry Applications Conference, 2000. Conference Record of the 2000 IEEE, 2000,
pp. 395-401 vol.1.
[100] D. Shah, S. Nandi, and P. Neti, "Stator-interturn-fault detection of doubly fed induction
generators using rotor-current and search-coil-voltage signature analysis," Industry
Applications, IEEE Transactions on, vol. 45, pp. 1831-1842, 2009.
[101] A. Ceban, R. Pusca, and R. Romary, "Study of rotor faults in induction motors using
external magnetic field analysis," Industrial Electronics, IEEE Transactions on, vol. 59,
pp. 2082-2093, 2012.
[102] Z. Pinjia, D. Yi, T. G. Habetler, and L. Bin, "A survey of condition monitoring and
protection methods for medium-voltage induction motors," Industry Applications, IEEE
Transactions on, vol. 47, pp. 34-46, 2011.
[103] R. Johan and B. Lina Margareta, "Survey of failures in wind power systems with focus
on swedish wind power plants during 1997-2005," Energy Conversion, IEEE
Transactions on, vol. 22, pp. 167-173, 2007.
[104] X. Ying, G. Chenglin, and W. Lingchao, "There-dimensional temperature estimation of
squirrel-cage induction motor using finite element method," in Electrical Machines and
Systems (ICEMS), 2011 International Conference on, 2011, pp. 1-5.

110
[105] A. Boglietti, A. Cavagnino, M. Popescu, and D. Staton, "Thermal model and analysis
of wound rotor induction machine," in Energy Conversion Congress and Exposition
(ECCE), 2012 IEEE, 2012, pp. 2688-2695.
[106] K. de Morais Sousa, A. A. Hafner, E. G. Carati, H. J. Kalinowski, and J. C. C. da Silva,
"Validation of thermal and electrical model for induction motors using fiber Bragg
gratings," Measurement, vol. 46, pp. 1781-1790, 2013.
[107] S. Djurovic, D. Vilchis-Rodriguez, and A. C. Smith, "Vibration monitoring for wound
rotor induction machine winding fault detection," in Electrical Machines (ICEM), 2012
XXth International Conference on, 2012, pp. 1906-1912.
[108] T. Sun, Z. Chen, and F. Blaabjerg, "Voltage recovery of grid-connected wind turbines
with DFIG after a short-circuit fault," in Power Electronics Specialists Conference,
2004. PESC 04. 2004 IEEE 35th Annual, 2004, pp. 1991-1997 Vol.3.
[109] M. N. Zaggout, P. J. Tavner, and L. Ran, "Wind turbine condition monitoring using
generator control loop signals," in Power Electronics, Machines and Drives (PEMD
2012), 6th IET International Conference on, 2012, pp. 1-6.
[110] G. Peng, D. Infield, and Y. Xiyun, "Wind turbine generator condition-monitoring using
temperature trend analysis," Sustainable Energy, IEEE Transactions on, vol. 3, pp. 124-
133, 2012.
[111] Y. Amirat, V. Choqueuse, and M. E. H. Benbouzid, "Wind turbines condition
monitoring and fault diagnosis using generator current amplitude demodulation," in
Energy Conference and Exhibition (EnergyCon), 2010 IEEE International, 2010, pp.
310-315.
[112] Pöyhönen S, Jover P, Hyötyniemi H. "Independent component analysis of vibrations for
fault diagnosis of an induction motor. " InProceedings of IASTED International
Conference Circuits, Signals, and Systems, 2003 May, pp. 19-21.

111
Appendix
GMR sensor board design
As the GMR sensor collects very weak magnetic field signals, the noise in the signal is
a major problem in a stray flux monitoring system. If the signal-to-noise ratio is too small,
accurate measurement results are unlikely to be obtained. In this case, it is necessary to design
the signal conditioning circuit in the GMR sensor board to be suitable for low power and 5V
operation.
Figure 9.1 Single amplifier circuit
Fig 9.1 shows the single amplifier circuit for one GMR sensor. The advantages of this
circuit are that it is simple and cheap and has fewer components. Depending on the amplifier
circuit, the GMR sensor board is designed with 5 NVE AA02-02E GMR devices embedded
together. Table II shows the PCB elements for a 5-channel GMR sensor board.
Table 9-1 PCB elements list
Element Quantity Packaging
Header 10 Pin 1 HDR 2*5 way
resistors 80K 5 0805N
Capacitors 10uF 10 0805N
Capacitors 10nF 5 0805N

112
INA 126UA 5 8SOIC
GMR sensors AA02-02E 5 8SOIC
The GMR sensor array PCB board has been assembled, which includes two layers for
the sensor detection circuit and signal conditioning circuit. Following the application of the
NVE GMR sensor, a schematic of the 5-channel GMR sensor array is shown below.
Figure 9.2 PCB layout
The PCB board is 85MM*30MM with 4 via pan (3MM) in each corner to be fastened
by screws. In the PCB layout, the blue lines are the wires on the bottom signal conditioning
circuit layout, and the red lines are the wires on the top sensors detection circuit layout. The 10
Pin head has integrated the five channels of output, 5V, -5V and ground together.
Test results
The GMR sensor array can detect a magnetic field especially for very weak magnetic
field. In this case, the obejct in this test is an electrical magnetic copper coil shown in Fig 9.3,
which is able to generate the magnetic field using input signals. In order to test the transient and
dynamic satuation of the sensor array, the input of the electrical magnetic coil is a sinusoidal
wave. The output of the sine wave is 100Hz, 5Vpp and the offset is 2.5Vpp.
Fig 9.3 Electrical magnetic coil and power suppy for experiment

113
The PCB board is directly connected to a DC power supply (5V, -5V and ground). Due
to limitations of the oscilloscope, for each test there are only two channels showing on the
screen.First two GMR sensors are tested at the same time, and the positions of the electrical
magnet coil are shown in the following figure.
Fig 9.4 Two tested sensors and output signals
The green waveform is the output from sensor A, and the yellow waveform is the output
from sensor B. From the results, the amplitude of sensor A is higher than that of sensor B,
because sensor A is in the middle of the coil and stays within a much stronger magnetic field.
The frequency of the two output waveforms are 100Hz. If the coil moves far from the sensors,
by1.5 cm, the results are showing in Fig 9.5.
Fig. 9.5 The postions of two tested sensors and output signals
From figure above, the amplitude of the output waveform of sensor A is reduced due to
the magnet coil moving further from the PCB board, which leads to the reduction in magnetic
field strength. In this case, the testing results are able to show that sensors A and B are working
well; furthermore, they are quite sensitive to changes in the magnetic field, and they are able to
collect stray flux information from the machines.
Data acquisition design
In the previous section, the GMR sensor board has been designed and tested with the
oscilloscope. However, to produce complete and fully functional condition monitoring, a data

114
acquisition system is needed. Due to the output of the 5 channels, the DAQ system is able to
collect the stray flux data with multiple channels and high sampling frequency. The NI USB-
6125 is used in this research project for the wire data acquisition system with 16 analog channels
(16-bit,250kS/s).
The Labview program is applied to the data acquisition of the GMR sensor array. It is
possible to collect data from the NI USB-6125 with adjustable sampling frequency and
sampling time. Furthermore, by choosing a different channel, the program is able to apply the
fast Fourier transform during the recording of the data. The data is saved to a specified path and
given a manual name. Additionally, the program is also able to provide a 3D mesh to show the
magnet flux strength in real time.
Figure 9.6 Labview design