Strawberry Marketing- Problems and...
45
141 Chapter Four: Strawberry Marketing- Problems and Prospects 4.1. A Glance on Strawberry Marketing Marketing of strawberry is one of the divers among the other cultivates fruits. In beginning of winter season it is the first fruit, which available in market therefore it get best market rate. Demand for strawberry in market hikes day by day on account of its taste and nutrition contents. Strawberry fruit demands in cosmetics, medicine, and food processing sectors along with consumption. It’s international demand also in rise. Strawberry from these locations reaches in local market as well as APMC Mumbai, Pune, Banglore, Hydrabad and other famous cities all over in India. Export of strawberry in 2007 for Europe also done from Mahabaleshwar. But perishable nature of fruit cannot stand long time and not target the far market. Cultivator concentrates while in marketing process on the following operations. 4.1.1. Harvesting Clipping of strawberry fruits getting starts in mid November in Mahabaleshwar region and in October 1 st week in other tahsil’s. This fruit need not any special practice to ripe like Mango, Banana etc. because it can easily available in market after clipping from farm. After the natural improvement in plant, plant start to continue flowering and fruiting up to its life span. Cultivators therefore need to ready for every day harvesting. Mid November to mid June about seven months period seems to yield tenure in Mahabaleshwar region. In other tahsil’s it seems from October to March end or mid April. In which November to March is accessible to higher yield, after and before main period we able to attain only least yield. Proper stage for clipping fruits are depends upon cultivars variety
Transcript of Strawberry Marketing- Problems and...
141
Chapter Four:
Strawberry Marketing- Problems and Prospects
4.1. A Glance on Strawberry Marketing
Marketing of strawberry is one of the divers among the other cultivates
fruits. In beginning of winter season it is the first fruit, which available in
market therefore it get best market rate. Demand for strawberry in market
hikes day by day on account of its taste and nutrition contents. Strawberry
fruit demands in cosmetics, medicine, and food processing sectors along
with consumption. It’s international demand also in rise. Strawberry from
these locations reaches in local market as well as APMC Mumbai, Pune,
Banglore, Hydrabad and other famous cities all over in India. Export of
strawberry in 2007 for Europe also done from Mahabaleshwar. But
perishable nature of fruit cannot stand long time and not target the far
market. Cultivator concentrates while in marketing process on the
following operations.
4.1.1. Harvesting
Clipping of strawberry fruits getting starts in mid November in
Mahabaleshwar region and in October 1st week in other tahsil’s. This fruit
need not any special practice to ripe like Mango, Banana etc. because it
can easily available in market after clipping from farm. After the natural
improvement in plant, plant start to continue flowering and fruiting up to
its life span. Cultivators therefore need to ready for every day harvesting.
Mid November to mid June about seven months period seems to yield
tenure in Mahabaleshwar region. In other tahsil’s it seems from October
to March end or mid April. In which November to March is accessible to
higher yield, after and before main period we able to attain only least
yield. Proper stage for clipping fruits are depends upon cultivars variety
142
and distance between markets to farm. Mostly ¾ ripen fruits picks for
fresh sells in market because they can stand long time. Fully ripe fruit
collects for processing because they can’t endure long time. Fruit stems
cuts at proper distance from calyx. This stems plucks by thumbs and fruit
carries inside the palm.
4.1.2. Handling and Grading
Strawberry fruits gentle feature urge us to handle it in minimum time.
Every touch of hands forwards it towards to spoil. Spotted and nipped by
birds and other pests frits are apart separately while picking. Fruit grading
determines on fruit size. Large size considered in 1st, medium size
considered in 2nd, small size considered in 3rd grade. These three grades
are follows by All India Strawberry Growers Association, New Delhi
fruit grading management. Generally 1st and 2nd grades prefer to sells in
market and 3rd graded mainly use in processing. A fruit separates as per
grade while collects it in bamboo baskets while plucking. Stems and
calyx should be left on fruits for long staying but its clears in case of use
in processing unit.
4.1.3. Packaging
“Pan” and Thick paper box use to packing. Pan consists of eight plastic
rectangular shape jars. These jars mount inside the plastic tray, this
plastic tray keep inside the pan box cover. Approximate 250 gm fruits can
easily packs in one tray of pan. About 350 gm fruits can carriers into
paper box. Layer of leaves scatters inside the box while fruit packing.
Then fruit mounts closely near to each other. Before taping the box again
leaves layer put on the fruits. Jars laden have four holes on the top and
two holes on each left and right side on box maintains for ventilation.
This attractive packing of strawberry fruit allures its eaters.
143
4.1.4. Available Markets for Strawberry Marketing
There is not historical presence of this fruit in nationwide market. Most of
the consumers in our markets are unaware about this fruits. Most of the
consumers seem that, this is elite class fruit. Beside this the cultivation of
strawberry has been taking place since last some decades in
Mahabaleshwar not enough to create its nationwide awareness solely.
Therefore the markets are limited for its marketing. The produce of this
fruit can be sell in local market, APMC Mumbai, and other cities in
different states through the contract agents. Beside this the cultivators in
Mahabaleshwar tahsil are selling their produce in local market as well as
in other nearest cities without any intermediate. They himself take part it
produce marketing that’s why this is also one kind of marketing source of
this strawberry fruit. We in briefly focus on these markets.
4.1.4.1. Local Market -
Visitors enjoying Mahabaleshwar – Panchagani trips in millions of
number every year therefore restaurants, ice- cream parlors and juice
centers are in flourish. These firms demands fruits for different recipes
abstract from strawberry, which are well demanded by visitors. Beside
this some processing units are situated near by this area demand
strawberry fruits for processing and forming new recipes. These firms
directly keep in touch with cultivators and give its return in daily basis.
Fresh strawberry fruit always prefer to taste while roaming in
Mahabaleshwar – Panchgani market by visitors. These visitors’s
requirement fulfills by “Kawadwala”. Kawadwala take part in sells
procedure of strawberry fruit. They formulate fruit heaps in small
bamboo basket. This attractive heap allures customers. Kawadwala sales
fruit in kilogram and Shares measures to customers. There in one
144
praiseworthy things about the Kawadwala is this, they have originate
“Strawberry Kawad Sanghatan – Mahabaleshwar” in 2004.
Cultivators prefer to sales their some specific share of yield in local
market due to easy access and need not any good practice for handle. Its
returns are unrevealing but gets quickly in local market, which helps
cultivator to complete its daily needs. The underlying thing is that in
whole marketing mechanism he himself not taking part.
4.1.4.2. APMC Mumbai (Vashi)
Many cultivators from these tahsil's send their produce in to Agricultural
Produce Marketing Committee at Vashi (Mumbai) through the local
transport. They pack the produce in ½ kg. box and sends to selected
agents for marketing. These agents give them their final statement of
every delivery.
4.1.4.3. Contract Agents
Some specific cultivators attached with this market mechanism. Agents
belongs to different cities desire to buy goods from cultivators and
distribute it in seller in their local cities. Cultivators use pan in large scale
for packing goods. Pan abides together in thick paper and sends by S T
bus, private vehicle, and tourist bus to reach destination. All expenses are
born in transport practice carries by agents. Price for goods determines
for whole year and this is flat price. Though there are oscillations in price
levels in throughout year he pays flat rate price. This trade prefer by
cultivators because they do not need to search any other market source for
goods.
4.1.4.4. Self Marketing
This is noteworthy thing in strawberry marketing that’s cultivator himself
take part into the marketing of self grown fruit. These cultivators sell
their fruits directly to customers in local market as well as on the road
145
links to Mahabaleshwar from Pune, Mumbai and other cities by
becoming Kawadwalla. Similarly some the enthusiastic cultivators in
Mahabaleshwar region show their spontaneous efforts to sell this produce
outside of local market. These cultivators sell their produce in nearest
famous cities in nearby district i.e. Satara, Raigad, Ratnagiri, Pune etc.
Cultivators himself take part into the whole marketing mechanism and he
solely establish relation with customers without any intermediary.
According to these cultivators, this marketing method is convenient and
trustful from our angle. We accustomed to this system of marketing with
understanding the everyday changes and responses by market and
customers.
4.1.5. Expenses in Marketing
Marketing of produce involve some expenditure i.e. transport, packing,
weighing, commission and some other cost. The expenditure pattern is
varying from market to market and somewhat differ in degree also. There
is also crux that who is bearing the marketing expenditure.
4.1.6. Marketing Returns
Here is the final stage of his Hercules efforts. Cultivators rewarded by
appropriate price for his produce. He receives his returns on different
term basis and different mode of payment.
4.2. Study of Marketing Mechanism
4.2.1. Period of Fruit Harvesting
Strawberry fruits are gentle in nature. Usually fruits can be last for very
short period after ripe viz. two or three days. It is highly perishable that’s
why cultivators can’t wait until market response. Strawberry plants once
started to flowering then keep flowering continuously so the fruits too.
That’s why cultivators requires to cut the ripen fruits continuously. Some
146
of the cultivators who have much area under the strawberry cultivation
they have been plucking the fruits from plant one day later. There are
23.68% cultivators need to do daily fruit picking operation. Remaining
76.32 % cultivators cut the fruits every 2nd day in whole season. This is
also depending upon the markets. Those cultivators who send their
produce to other than domestic markets in bulk quantity do cut fruits
every one day later.
4.2.2. Categorization of Fruits
All cultivators have a good awareness of categorization of their produce
to fetch attractive price in market. Every cultivator categorizes the fruits
according to the standard of size. This standard is based on fruit size and
has set by All India Strawberry Growers Association as earlier
mentioned.
4.2.3. Packing of the Fruits
Cultivators require packing of fruits in boxes and Pan (plastic tray) to
avoid wastage while transporting and facilitate in marketing. 82.33%
famers need of packing the strawberry fruits whereas 17.67 cultivators
don’t need to packing produce for any specific purpose. Without packing
produce sells in domestic markets by cultivators to local Kawadwalla
that’s why they free from this troublesome work.
4.2.4. Probable Markets for Strawberry Fruits
A strawberry cultivator has not more option available since he has been
cultivating and marketing of this fruit. He has been following the tradition
ways of marketing which was been since some decade ago. He can sell
his produce at domestic market to kawadwalas, hotels – restaurant in
Mahabaleshwar and Panchgani, Ice cream parlors etc. Besides he can sell
his produce in Mahabaleshwar and Panchgani local market where market
always throng with tourist as well as on the way roads of Mahabaleshwar
147
and Panchgani and sells in nearest cities. Those Cultivators have bulk of
produce to sell then they send it into APMC market Mumbai (Vashi) and
now days he is become able to send his produce in different cities across
the Maharashtra as well as in other states also. Following table lights on
the present market structure of strawberry produce.
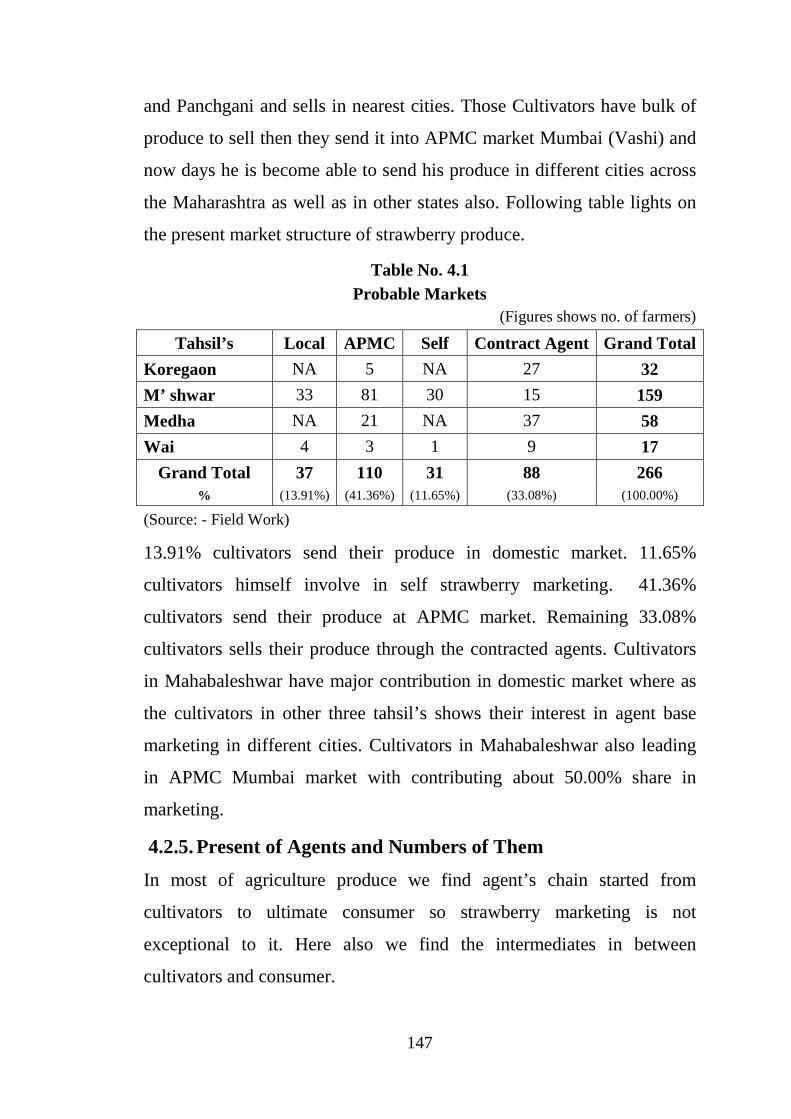
Table No. 4.1 Probable Markets
(Figures shows no. of farmers)
Tahsil’s Local APMC Self Contract Agent Grand Total
Koregaon NA 5 NA 27 32
M’ shwar 33 81 30 15 159
Medha NA 21 NA 37 58
Wai 4 3 1 9 17
Grand Total 37 110 31 88 266 % (13.91%) (41.36%) (11.65%) (33.08%) (100.00%)
(Source: - Field Work)
13.91% cultivators send their produce in domestic market. 11.65%
cultivators himself involve in self strawberry marketing. 41.36%
cultivators send their produce at APMC market. Remaining 33.08%
cultivators sells their produce through the contracted agents. Cultivators
in Mahabaleshwar have major contribution in domestic market where as
the cultivators in other three tahsil’s shows their interest in agent base
marketing in different cities. Cultivators in Mahabaleshwar also leading
in APMC Mumbai market with contributing about 50.00% share in
marketing.
4.2.5. Present of Agents and Numbers of Them
In most of agriculture produce we find agent’s chain started from
cultivators to ultimate consumer so strawberry marketing is not
exceptional to it. Here also we find the intermediates in between
cultivators and consumer.
148
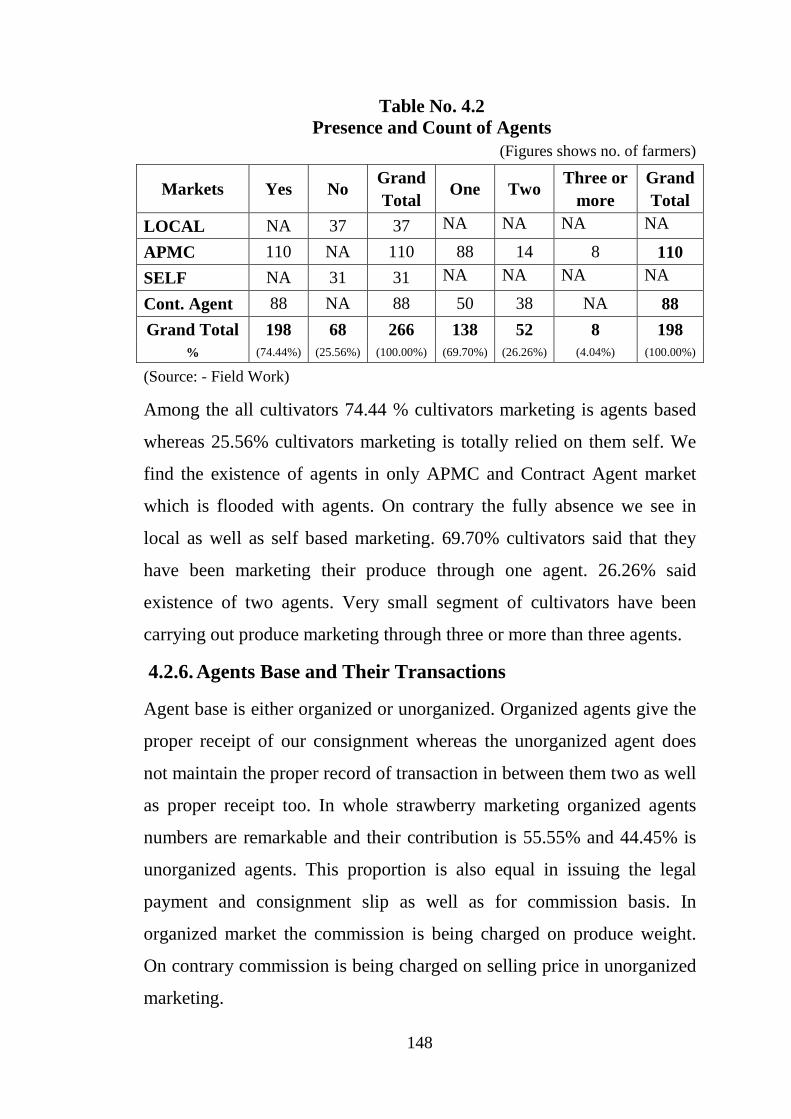
Table No. 4.2 Presence and Count of Agents
(Figures shows no. of farmers)
Markets Yes No Grand Total
One Two Three or
more Grand Total
LOCAL NA 37 37 NA NA NA NA
APMC 110 NA 110 88 14 8 110
SELF NA 31 31 NA NA NA NA
Cont. Agent 88 NA 88 50 38 NA 88
Grand Total 198 68 266 138 52 8 198 % (74.44%) (25.56%) (100.00%) (69.70%) (26.26%) (4.04%) (100.00%)
(Source: - Field Work)
Among the all cultivators 74.44 % cultivators marketing is agents based
whereas 25.56% cultivators marketing is totally relied on them self. We
find the existence of agents in only APMC and Contract Agent market
which is flooded with agents. On contrary the fully absence we see in
local as well as self based marketing. 69.70% cultivators said that they
have been marketing their produce through one agent. 26.26% said
existence of two agents. Very small segment of cultivators have been
carrying out produce marketing through three or more than three agents.
4.2.6. Agents Base and Their Transactions
Agent base is either organized or unorganized. Organized agents give the
proper receipt of our consignment whereas the unorganized agent does
not maintain the proper record of transaction in between them two as well
as proper receipt too. In whole strawberry marketing organized agents
numbers are remarkable and their contribution is 55.55% and 44.45% is
unorganized agents. This proportion is also equal in issuing the legal
payment and consignment slip as well as for commission basis. In
organized market the commission is being charged on produce weight.
On contrary commission is being charged on selling price in unorganized
marketing.
149
4.2.7. Expenses in Marketing
There are various expenses in marketing of agriculture produce. Some of
major expenses are transport, packing, weighting, loading – unloading,
commission, fees, taxes etc. In all agriculture marketing most of the
charges are paid by cultivators. Strawberry marketing is in some extend
exceptional among the all if there is any exceptions in agriculture
marketing. In organized marketing the expenses are made by cultivators.
Marketing expenses are rather charge on agents in unorganized marketing
of strawberry.
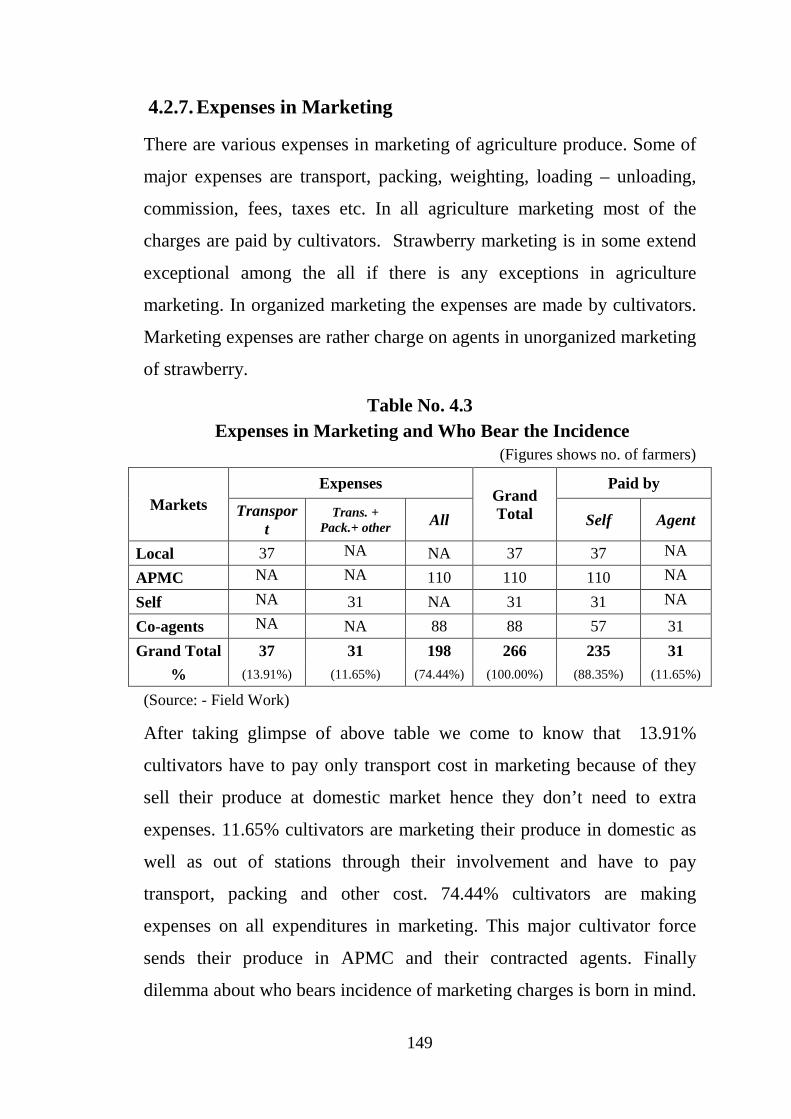
Table No. 4.3 Expenses in Marketing and Who Bear the Incidence
(Figures shows no. of farmers)
Markets Expenses
Grand Total
Paid by
Transport
Trans. + Pack.+ other All Self Agent
Local 37 NA NA 37 37 NA
APMC NA NA 110 110 110 NA
Self NA 31 NA 31 31 NA
Co-agents NA NA 88 88 57 31
Grand Total 37 31 198 266 235 31
% (13.91%) (11.65%) (74.44%) (100.00%) (88.35%) (11.65%)
(Source: - Field Work)
After taking glimpse of above table we come to know that 13.91%
cultivators have to pay only transport cost in marketing because of they
sell their produce at domestic market hence they don’t need to extra
expenses. 11.65% cultivators are marketing their produce in domestic as
well as out of stations through their involvement and have to pay
transport, packing and other cost. 74.44% cultivators are making
expenses on all expenditures in marketing. This major cultivator force
sends their produce in APMC and their contracted agents. Finally
dilemma about who bears incidence of marketing charges is born in mind.
150
88.35% cultivators are responsible to weighing this marketing
expenditure cost. Other 11.65% cultivators are may be lucky from this
point of view. The agents on behalf of cultivators lift burden of
marketing. These are the lucky once among the cultivators who
marketing their produce through their contract agents.
4.2.8. Period and Mode of Return
Cultivator has to wait for his marketing return for particular time. When
he makes a deal direct to customer he gets instantly return and in cash
forms. But otherwise if he markets his produce through the agents then
maybe he receive partial payment at the time of dealing and settle down
the balances in end of the seasons. Some of agents give advances before
the cultivation season to cultivators and contract with them. These all
agents pay the returns in either cash form, issue the cheque of balance
amount or give some percentage amount as an advance. The below given
table is focusing on the payment and its period of return.
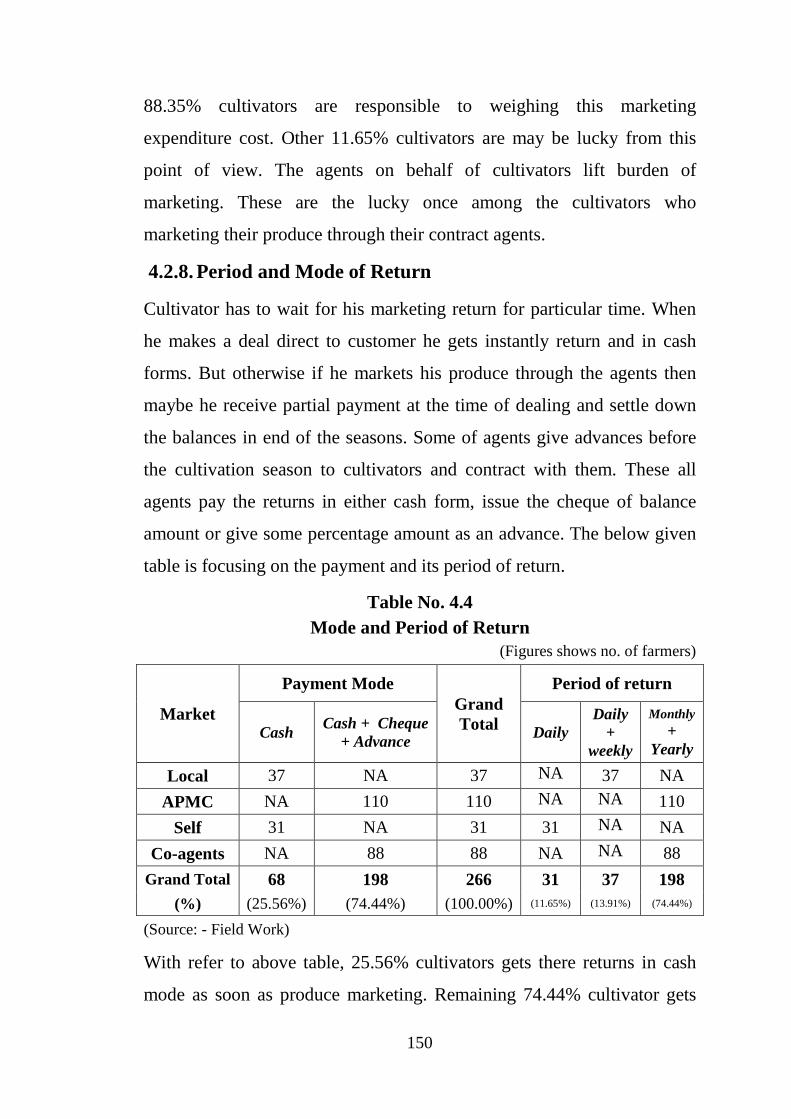
Table No. 4.4 Mode and Period of Return
(Figures shows no. of farmers)
Market
Payment Mode Grand Total
Period of return
Cash Cash + Cheque
+ Advance Daily
Daily +
weekly
Monthly +
Yearly
Local 37 NA 37 NA 37 NA
APMC NA 110 110 NA NA 110
Self 31 NA 31 31 NA NA
Co-agents NA 88 88 NA NA 88
Grand Total 68 198 266 31 37 198 (%) (25.56%) (74.44%) (100.00%) (11.65%) (13.91%) (74.44%)
(Source: - Field Work)
With refer to above table, 25.56% cultivators gets there returns in cash
mode as soon as produce marketing. Remaining 74.44% cultivator gets
151
their return in three different ways viz. as an advance before season, cash
amount in mid season and finally they cleared in some proportionate
balance in cash and some in cheque mode.
This table no. 4.4 is also relevance to period of returns from marketing
of produce. 11.65% cultivators say’s that, they get as soon as returns
when they markets their produce because of they are participating this
market. 13.91% cultivator gets theirs returns on daily basis as well as on
weekly basis. These cultivators are mainly associated with local market
and local Kawadwalas. 74.44% are those cultivators who get their returns
on monthly and yearly basis. Because of their links are with the agents
situated in APMC and other unorganized agents in other cities.
4.2.9. Transport Facilities
The role of transport is inevitable in marketing procedure compare to
cultivation operations. Cultivators who send their produce at APMC need
only transport means to convey the produce up to its destination. But
transport facilities and adequate means are reached at the door step of
cultivators hence he doesn’t think anything lag in this system. The
contract agents also collect the produce from their centre point by their
own vehicle so cultivator duty is transport the produce up to that center
point so he also doesn’t wish any from this improvement point of view.
Some of cultivators send their produce at different cities across
Maharashtra and out of Maharashtra by bus and train. There is enough
and good frequency of S.T. buses for famous cities in Maharashtra from
Mahabaleshwar so that cultivators can easily dispatch produce. Similarly
Wathar (Dist. Satara) and Veer (Dist. Raigad) are two nearest railway
station to dispatch the produce by train in selected cities in other states.
152
4.2.10. Cold Storage Facility
It is a very gentle and highly perishable fruit. Many times cultivators as
well as kawadwalas in local market unable to sell whole produce every
day because of tourist frequency is less in week days. In this sense they
are expecting this kind of facility at least at local level markets. But there
is not enough endeavors by both cultivators and associate agency or
department of government. Finally they sell their surplus of produce to
processing units in mid and peak season to stop the ruins of produce.
4.2.11. Marketing Guidance
Today’s cultivators have good accessibility of information technology
and means so he does not need a particular person or agency as a
marketing guidance. These cultivators have good business
communication within them so they share the ups and down in all
markets. They come into connection with any agents in marketing
procedure on collective basis that’s why any ignorance among them can
be easily accommodated. But it is not applicable to all. Except this there
is no certain agency, institution, person to guide them on marketing and
they initiate in this light.
4.2.12. Difficulties in Marketing
While marketing their produce cultivators faces several of difficulties
relevance to i.e. price, demand, gluts in markets etc. whenever cultivator
assign his land for every agricultural produce he keeps his one eye on
cultivation season and another on the price will he get in market. When
the cultivator striving for marketing his produce he also face the
difficulties in somewhat extend like other agriculture produce. Following
table is an eye witness of difficulties arises in market and degree of faces
by cultivators.
153
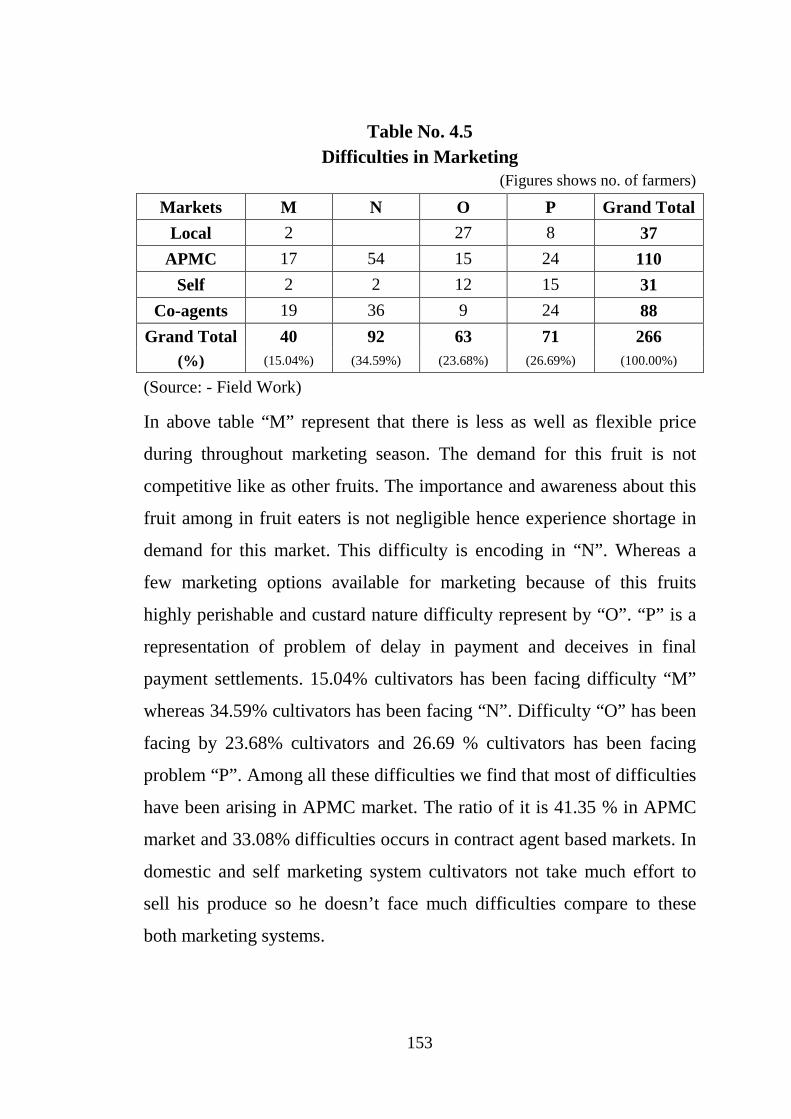
Table No. 4.5
Difficulties in Marketing (Figures shows no. of farmers)
Markets M N O P Grand Total
Local 2
27 8 37
APMC 17 54 15 24 110
Self 2 2 12 15 31
Co-agents 19 36 9 24 88
Grand Total 40 92 63 71 266 (%) (15.04%) (34.59%) (23.68%) (26.69%) (100.00%)
(Source: - Field Work)
In above table “M” represent that there is less as well as flexible price
during throughout marketing season. The demand for this fruit is not
competitive like as other fruits. The importance and awareness about this
fruit among in fruit eaters is not negligible hence experience shortage in
demand for this market. This difficulty is encoding in “N”. Whereas a
few marketing options available for marketing because of this fruits
highly perishable and custard nature difficulty represent by “O”. “P” is a
representation of problem of delay in payment and deceives in final
payment settlements. 15.04% cultivators has been facing difficulty “M”
whereas 34.59% cultivators has been facing “N”. Difficulty “O” has been
facing by 23.68% cultivators and 26.69 % cultivators has been facing
problem “P”. Among all these difficulties we find that most of difficulties
have been arising in APMC market. The ratio of it is 41.35 % in APMC
market and 33.08% difficulties occurs in contract agent based markets. In
domestic and self marketing system cultivators not take much effort to
sell his produce so he doesn’t face much difficulties compare to these
both marketing systems.
154
4.3. Critical study of Marketing
4.3.1. Tahsil wise Produce Marketed
Producers send their produce from tahsil's in different marketing
channels. Following table no. 4.6 focus on the actual produce sells by the
tahsil’s in markets since last ten years as well as it is counting increasing
moving average trend of last ten years. From the table no.4.6 we can
reach up to the conclusion that the major market has been covered by
Mahabaleshwar tahsil. If we consider the last ten year data of marketing
then it show this contribution of market share. The share of
Mahabaleshwar tahsil is around 62 % in last year 2011-12. Then Medha
20%, Koregaon 12% and Wai is 6% share in market in same year.
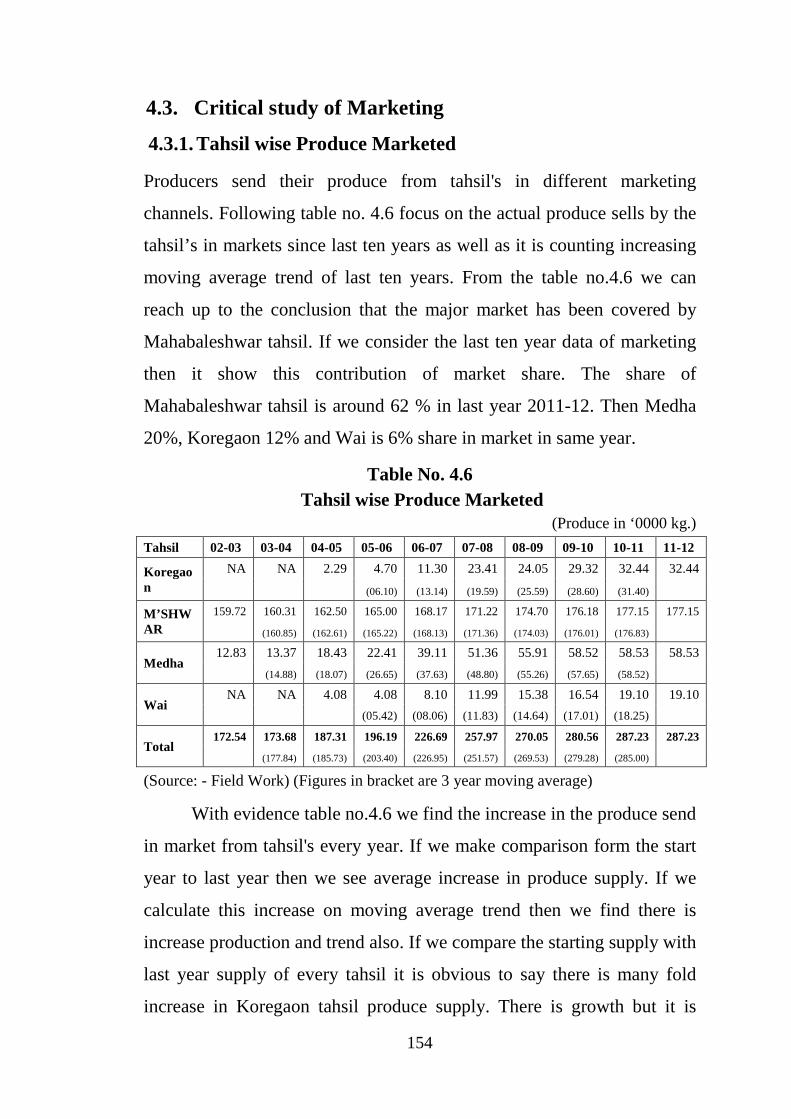
Table No. 4.6 Tahsil wise Produce Marketed
(Produce in ‘0000 kg.)
Tahsil 02-03 03-04 04-05 05-06 06-07 07-08 08-09 09-10 10-11 11-12
Koregaon
NA NA 2.29 4.70 11.30 23.41 24.05 29.32 32.44 32.44
(06.10) (13.14) (19.59) (25.59) (28.60) (31.40)
M’SHWAR
159.72 160.31 162.50 165.00 168.17 171.22 174.70 176.18 177.15 177.15
(160.85) (162.61) (165.22) (168.13) (171.36) (174.03) (176.01) (176.83)
Medha 12.83 13.37 18.43 22.41 39.11 51.36 55.91 58.52 58.53 58.53
(14.88) (18.07) (26.65) (37.63) (48.80) (55.26) (57.65) (58.52)
Wai NA NA 4.08 4.08 8.10 11.99 15.38 16.54 19.10 19.10
(05.42) (08.06) (11.83) (14.64) (17.01) (18.25)
Total 172.54 173.68 187.31 196.19 226.69 257.97 270.05 280.56 287.23 287.23
(177.84) (185.73) (203.40) (226.95) (251.57) (269.53) (279.28) (285.00)
(Source: - Field Work) (Figures in bracket are 3 year moving average)
With evidence table no.4.6 we find the increase in the produce send
in market from tahsil's every year. If we make comparison form the start
year to last year then we see average increase in produce supply. If we
calculate this increase on moving average trend then we find there is
increase production and trend also. If we compare the starting supply with
last year supply of every tahsil it is obvious to say there is many fold
increase in Koregaon tahsil produce supply. There is growth but it is
155
negligible in Mahabaleshwar and trend also indicates this thing. Medha
and Wai tahsil also show remarkable increase in produce supply during
the last years. Aggregate produce supply also showing increase in
produce supply throughout the last ten years and it is remarkable one.
Because it is comparatively about 66% more than the first year value.
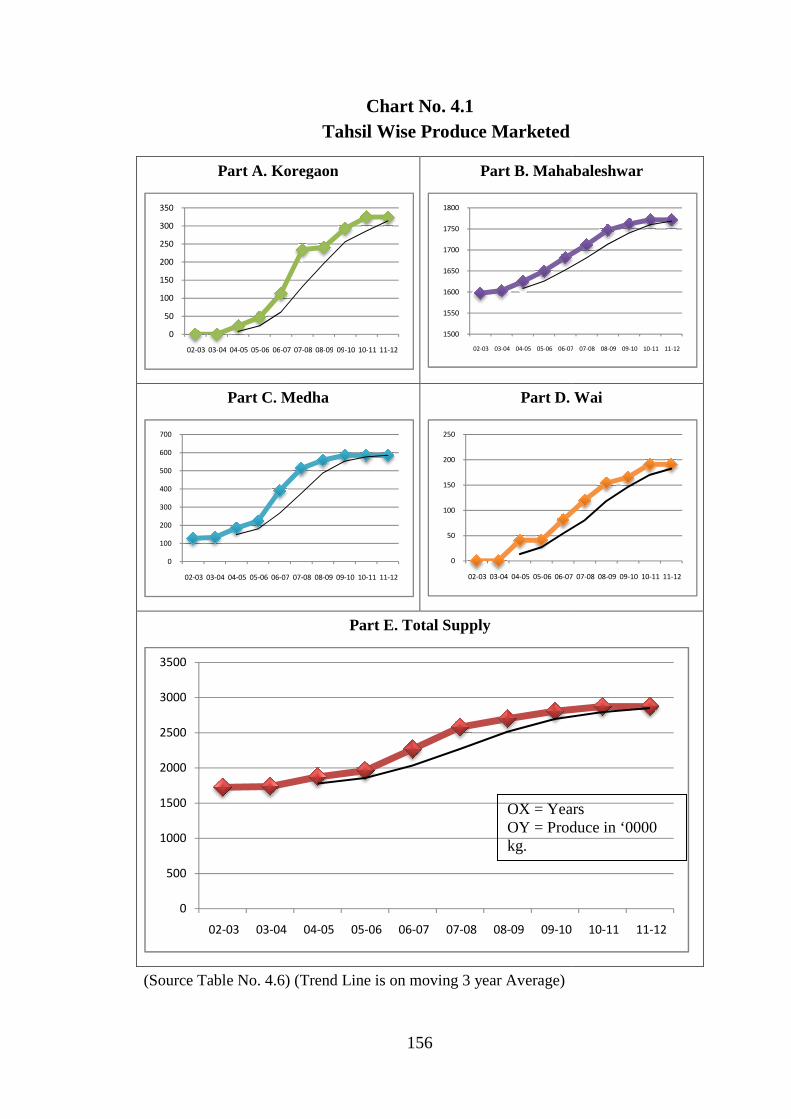
In following chart no.4.1 we come across the volume of produce has been
supplied by the cultivators from there tahsil's. On vertical axis the
produce in kilogram is measured whereas on horizontal axis the period is
counted. This graph shows the increase in produce supply and trend. In
part “A” the supply of produce from Koregaon is shown. This curve
shows the increase in supply. The slop is positive and the stiff increase is
there in supply. The trend line is something stable but actual increase is
fluctuates than the trend value. Mahabaleshwar is presented in Part “B”
where the increase and trend both are increasing and averagely finds
equal. With the Medha tahsil in part “C” the increase is slow in initial
year and later started to increase in higher rate. The trend also show
increase and actual value is far from the trend value. In part “D”, there is
liner growth is finding. The rate of supply increasing is raise but it is less
to compare Koregaon and Medha. In the case of total supply part “E”
there is relevance seen in Mahabaleshwar and it. Here is also increase in
supply and average trend and similarity observed in between two.
Part A. Koregaon
Part C. Medha
(Source Table No. 4.6)
0
50
100
150
200
250
300
350
02-03 03-04 04-05 05-06 06-07
0
100
200
300
400
500
600
700
02-03 03-04 04-05 05-06 06-07
0
500
1000
1500
2000
2500
3000
3500
02-03 03-04
156
Chart No. 4.1 Tahsil Wise Produce Marketed
Part A. Koregaon
Part B. Mahabaleshwar
Part C. Medha
Part D. Wai
Part E. Total Supply
(Source Table No. 4.6) (Trend Line is on moving 3 year Average)
07 07-08 08-09 09-10 10-11 11-12
1500
1550
1600
1650
1700
1750
1800
02-03 03-04 04-05 05-06 06-07
07 07-08 08-09 09-10 10-11 11-12
0
50
100
150
200
250
02-03 03-04 04-05 05-06 06-07
04 04-05 05-06 06-07 07-08 08-09 09-10
OX = Years OY = Produce in ‘0000 kg.
Part B. Mahabaleshwar
Part D. Wai
07 07-08 08-09 09-10 10-11 11-12
07 07-08 08-09 09-10 10-11 11-12
10-11 11-12
OX = Years OY = Produce in ‘0000
157
4.3.2. Market wise Produce Marketed
Market wise produce sells is a factor which bring into eyesight the
produce sells from different market or the produce has been sent in
different market for marketing since last 10 years by the cultivators. Here
are mainly four ways for marketing the strawberry fruit and cultivators
use how use these channel is analyze with the help of following table.
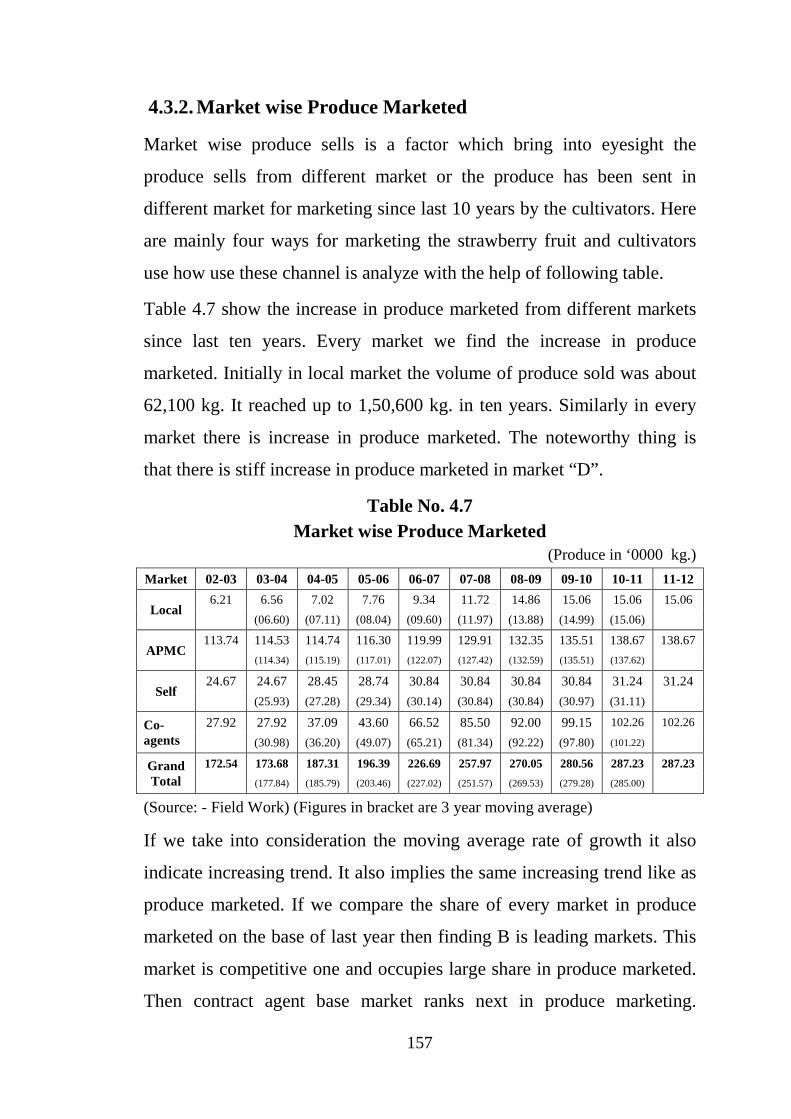
Table 4.7 show the increase in produce marketed from different markets
since last ten years. Every market we find the increase in produce
marketed. Initially in local market the volume of produce sold was about
62,100 kg. It reached up to 1,50,600 kg. in ten years. Similarly in every
market there is increase in produce marketed. The noteworthy thing is
that there is stiff increase in produce marketed in market “D”.
Table No. 4.7 Market wise Produce Marketed
(Produce in ‘0000 kg.)
Market 02-03 03-04 04-05 05-06 06-07 07-08 08-09 09-10 10-11 11-12
Local 6.21 6.56 7.02 7.76 9.34 11.72 14.86 15.06 15.06 15.06
(06.60) (07.11) (08.04) (09.60) (11.97) (13.88) (14.99) (15.06)
APMC 113.74 114.53 114.74 116.30 119.99 129.91 132.35 135.51 138.67 138.67
(114.34) (115.19) (117.01) (122.07) (127.42) (132.59) (135.51) (137.62)
Self 24.67 24.67 28.45 28.74 30.84 30.84 30.84 30.84 31.24 31.24
(25.93) (27.28) (29.34) (30.14) (30.84) (30.84) (30.97) (31.11)
Co-agents
27.92 27.92 37.09 43.60 66.52 85.50 92.00 99.15 102.26 102.26
(30.98) (36.20) (49.07) (65.21) (81.34) (92.22) (97.80) (101.22)
Grand Total
172.54 173.68 187.31 196.39 226.69 257.97 270.05 280.56 287.23 287.23
(177.84) (185.79) (203.46) (227.02) (251.57) (269.53) (279.28) (285.00)
(Source: - Field Work) (Figures in bracket are 3 year moving average)
If we take into consideration the moving average rate of growth it also
indicate increasing trend. It also implies the same increasing trend like as
produce marketed. If we compare the share of every market in produce
marketed on the base of last year then finding B is leading markets. This
market is competitive one and occupies large share in produce marketed.
Then contract agent base market ranks next in produce marketing.
158
Initially the share of this market was many folds less then this recent year.
Among these markets the Contract agent based D market shows the
fastest growth in produce marketing. Another most important thing is that
the produce marketed increase remaining stable form the year 2008-09 in
A market where as in C market it show the stability trend from year 2006-
07.
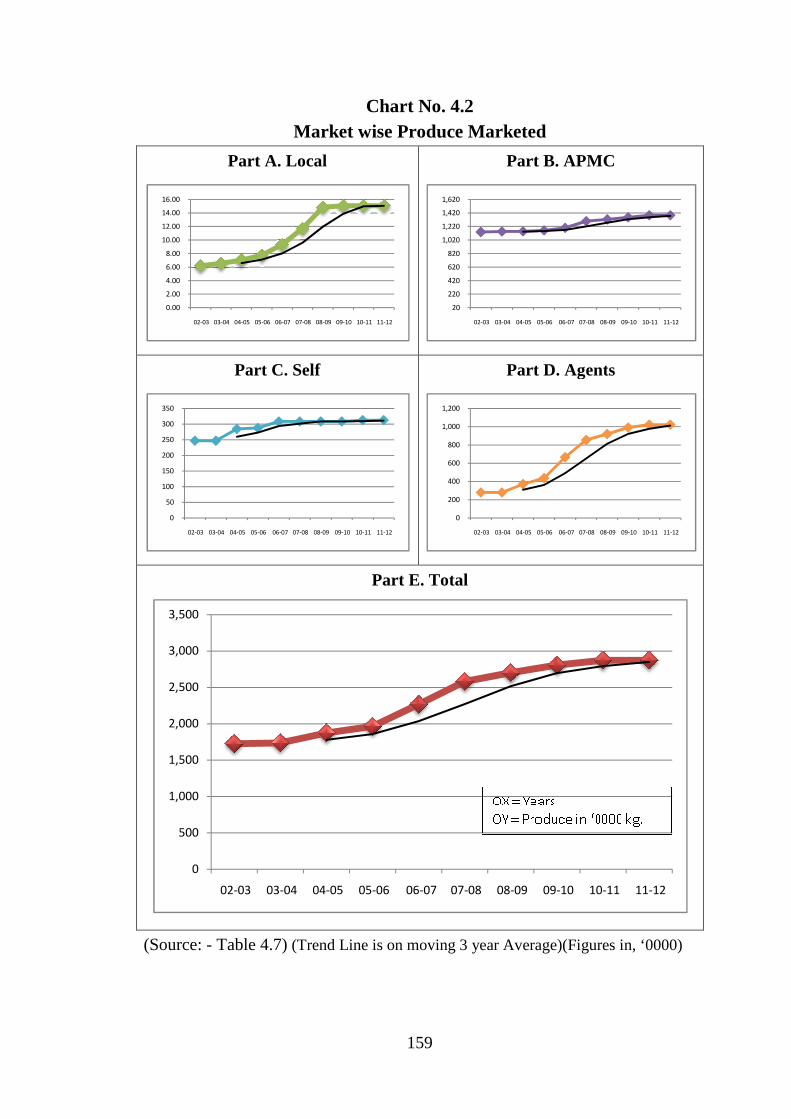
Chart no.4.2 is the graphical representation of table no.4.7 and
representing the increase in marketed produce as well as the increasing
trend on the basis of three year moving average trend. Part I in concern to
domestic market and show the stiff increase in up to first seven years and
later increase is constant. Therefore the actual increase in particular
period is more than the average increase and the cause to more fluctuate
than the average value. In part B alias in APMC market show the increase
but the rate of increase in not much greater to consider the increase rate.
Therefore the rate of increase and average trend is somewhat similar. In
part C- self marketing method the rate of marketing was started to
increase in 2nd year and keep continue for next four year and later
remained minimum stable. It is a reason behind the equality between the
actual rate and average moving rate and trend line too. But part D; agent
based marketing show the continuous increase in produce marketed and
that’s why the curve is showing increasing rate similarly the trend line is
also showing the increasing trend but the actual value is greater than
average value therefore in middle period it is far from trend line. There is
also increase in total produce marketing since last ten year but rate of
increasing is low. The trend also shows increase but the actual value is
more vary than the average value and result to gap in average and actual
curve.
Part A. Local
Part C. Self
(Source: - Table 4.7)
0.00
2.00
4.00
6.00
8.00
10.00
12.00
14.00
16.00
02-03 03-04 04-05 05-06 06-07
0
50
100
150
200
250
300
350
02-03 03-04 04-05 05-06 06-07
0
500
1,000
1,500
2,000
2,500
3,000
3,500
02-03 03-04
159
Chart No. 4.2 Market wise Produce Marketed
A. Local
Part B. APMC
Part C. Self
Part D. Agents
Part E. Total
Table 4.7) (Trend Line is on moving 3 year Average)(Figures in, ‘0000
07 07-08 08-09 09-10 10-11 11-12
20
220
420
620
820
1,020
1,220
1,420
1,620
02-03 03-04 04-05 05-06 06-07
07 07-08 08-09 09-10 10-11 11-12
0
200
400
600
800
1,000
1,200
02-03 03-04 04-05 05-06 06-07
04 04-05 05-06 06-07 07-08 08-09 09-10
Part B. APMC
Part D. Agents
(Figures in, ‘0000)
07 07-08 08-09 09-10 10-11 11-12
07 07-08 08-09 09-10 10-11 11-12
10 10-11 11-12
160
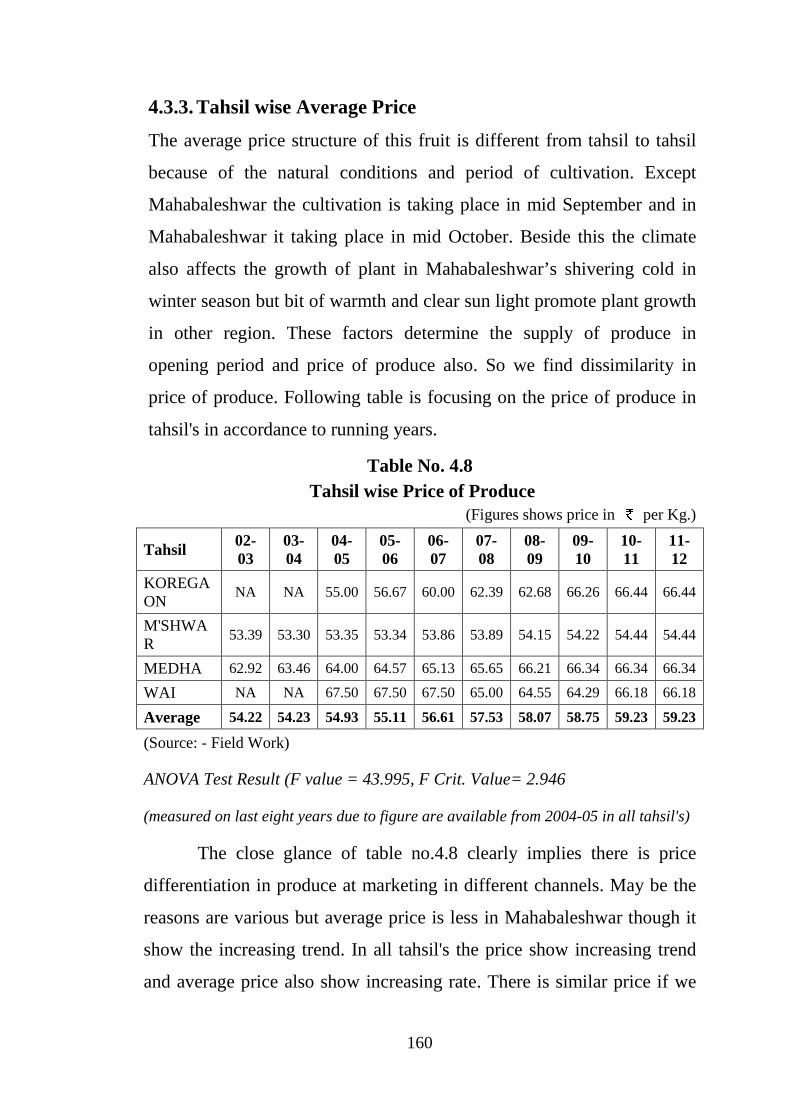
4.3.3. Tahsil wise Average Price
The average price structure of this fruit is different from tahsil to tahsil
because of the natural conditions and period of cultivation. Except
Mahabaleshwar the cultivation is taking place in mid September and in
Mahabaleshwar it taking place in mid October. Beside this the climate
also affects the growth of plant in Mahabaleshwar’s shivering cold in
winter season but bit of warmth and clear sun light promote plant growth
in other region. These factors determine the supply of produce in
opening period and price of produce also. So we find dissimilarity in
price of produce. Following table is focusing on the price of produce in
tahsil's in accordance to running years.
Table No. 4.8 Tahsil wise Price of Produce
(Figures shows price in per Kg.)
Tahsil 02-03
03-04
04-05
05-06
06-07
07-08
08-09
09-10
10-11
11-12
KOREGAON
NA NA 55.00 56.67 60.00 62.39 62.68 66.26 66.44 66.44
M'SHWAR
53.39 53.30 53.35 53.34 53.86 53.89 54.15 54.22 54.44 54.44
MEDHA 62.92 63.46 64.00 64.57 65.13 65.65 66.21 66.34 66.34 66.34
WAI NA NA 67.50 67.50 67.50 65.00 64.55 64.29 66.18 66.18
Average 54.22 54.23 54.93 55.11 56.61 57.53 58.07 58.75 59.23 59.23
(Source: - Field Work)
ANOVA Test Result (F value = 43.995, F Crit. Value= 2.946
(measured on last eight years due to figure are available from 2004-05 in all tahsil's)
The close glance of table no.4.8 clearly implies there is price
differentiation in produce at marketing in different channels. May be the
reasons are various but average price is less in Mahabaleshwar though it
show the increasing trend. In all tahsil's the price show increasing trend
and average price also show increasing rate. There is similar price if we
161
neglect the difference of paisa above on the main value of final year in
Koregaon, Medha and Wai tahsil.
The result of ANOVA test thesis that there is actual difference
between average prices in tahsil's. For finding the difference of prices
between the tahsil’s this test has applied. ANOVA test here taking prices
in these tahsil’s as samples and calculated them altogether. The actual
value after calculating these sample means got (F=43.995) is greater than
the critical value (f crit. 2.946685).It also denotes the difference between
all prices is having significant importance though it is in paisa.
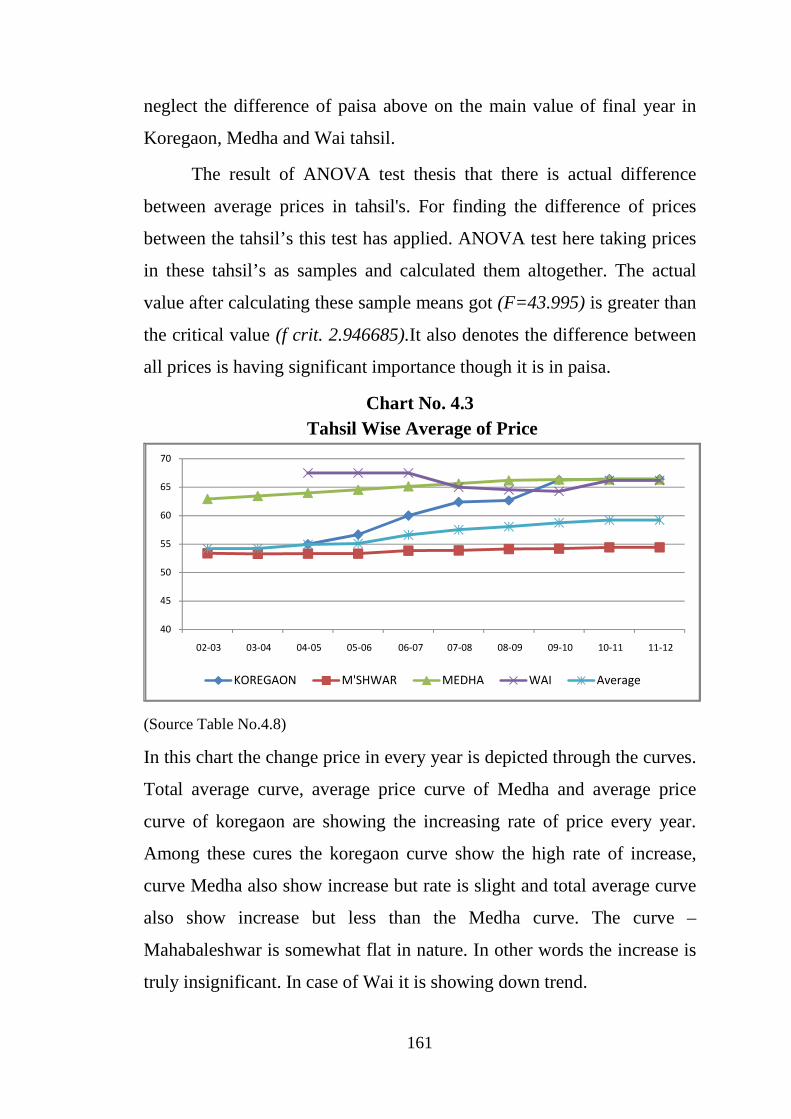
Chart No. 4.3 Tahsil Wise Average of Price
(Source Table No.4.8)
In this chart the change price in every year is depicted through the curves.
Total average curve, average price curve of Medha and average price
curve of koregaon are showing the increasing rate of price every year.
Among these cures the koregaon curve show the high rate of increase,
curve Medha also show increase but rate is slight and total average curve
also show increase but less than the Medha curve. The curve –
Mahabaleshwar is somewhat flat in nature. In other words the increase is
truly insignificant. In case of Wai it is showing down trend.
40
45
50
55
60
65
70
02-03 03-04 04-05 05-06 06-07 07-08 08-09 09-10 10-11 11-12
KOREGAON M'SHWAR MEDHA WAI Average
162
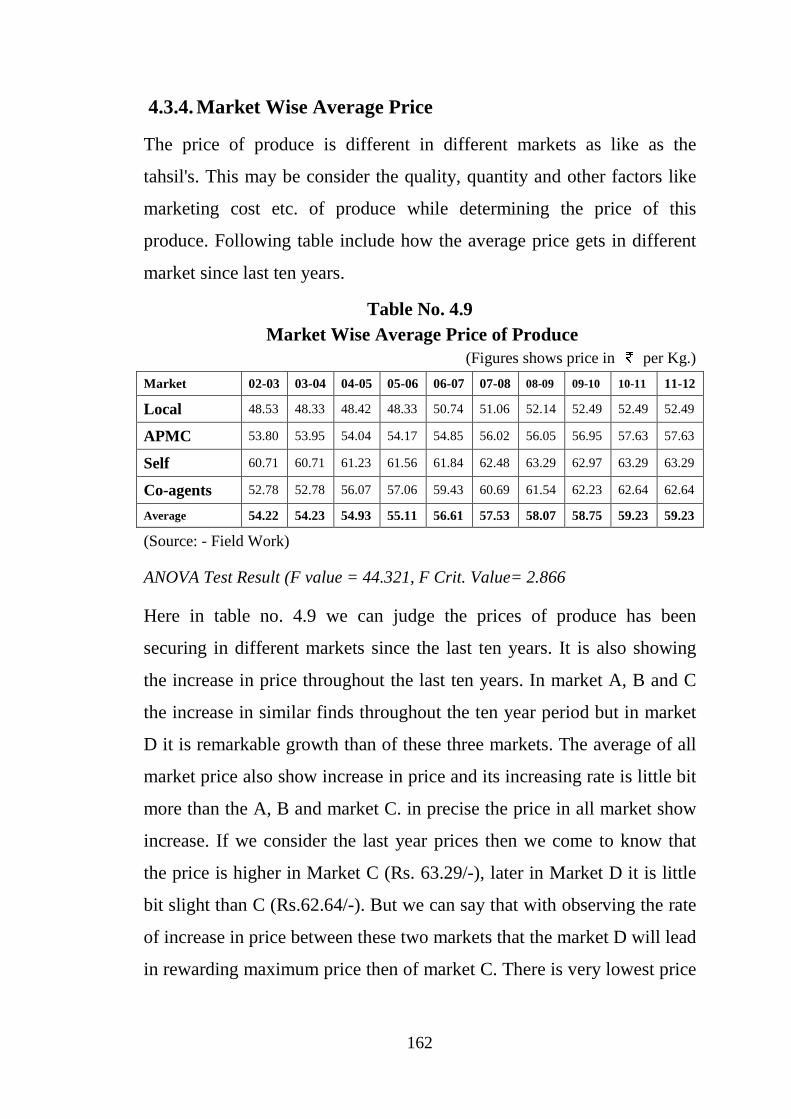
4.3.4. Market Wise Average Price
The price of produce is different in different markets as like as the
tahsil's. This may be consider the quality, quantity and other factors like
marketing cost etc. of produce while determining the price of this
produce. Following table include how the average price gets in different
market since last ten years.
Table No. 4.9 Market Wise Average Price of Produce
(Figures shows price in per Kg.)
Market 02-03 03-04 04-05 05-06 06-07 07-08 08-09 09-10 10-11 11-12
Local 48.53 48.33 48.42 48.33 50.74 51.06 52.14 52.49 52.49 52.49
APMC 53.80 53.95 54.04 54.17 54.85 56.02 56.05 56.95 57.63 57.63
Self 60.71 60.71 61.23 61.56 61.84 62.48 63.29 62.97 63.29 63.29
Co-agents 52.78 52.78 56.07 57.06 59.43 60.69 61.54 62.23 62.64 62.64
Average 54.22 54.23 54.93 55.11 56.61 57.53 58.07 58.75 59.23 59.23
(Source: - Field Work)
ANOVA Test Result (F value = 44.321, F Crit. Value= 2.866
Here in table no. 4.9 we can judge the prices of produce has been
securing in different markets since the last ten years. It is also showing
the increase in price throughout the last ten years. In market A, B and C
the increase in similar finds throughout the ten year period but in market
D it is remarkable growth than of these three markets. The average of all
market price also show increase in price and its increasing rate is little bit
more than the A, B and market C. in precise the price in all market show
increase. If we consider the last year prices then we come to know that
the price is higher in Market C (Rs. 63.29/-), later in Market D it is little
bit slight than C (Rs.62.64/-). But we can say that with observing the rate
of increase in price between these two markets that the market D will lead
in rewarding maximum price then of market C. There is very lowest price
163
than others markets in market A which is also lower than average of total
market price.
ANOVA test result also says that there is difference between
average prices in markets. The actual value (F=44.32156) and critical
value (F crit. =2.866266 ) are not equal. Here the critical value is less
than the actual value therefore the average of price different in different
markets. The difference is also significant to take into consideration.
Following chart is representing this table into its graphical form.
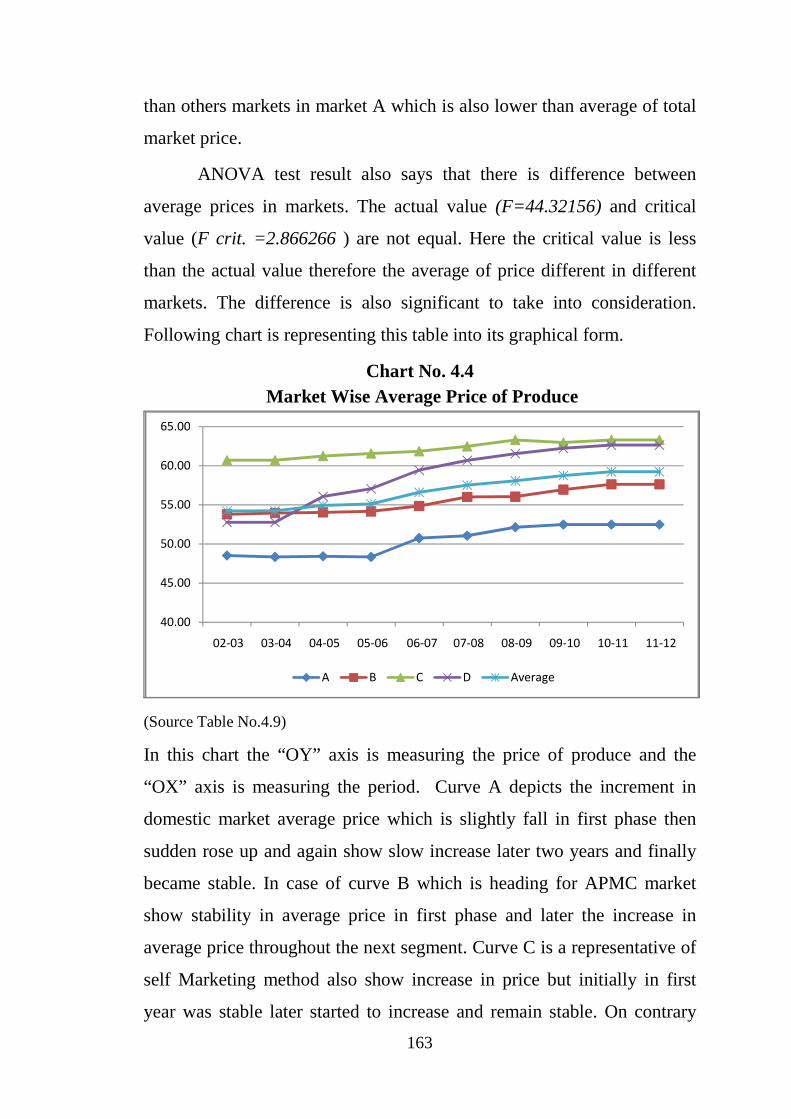
Chart No. 4.4 Market Wise Average Price of Produce
(Source Table No.4.9)
In this chart the “OY” axis is measuring the price of produce and the
“OX” axis is measuring the period. Curve A depicts the increment in
domestic market average price which is slightly fall in first phase then
sudden rose up and again show slow increase later two years and finally
became stable. In case of curve B which is heading for APMC market
show stability in average price in first phase and later the increase in
average price throughout the next segment. Curve C is a representative of
self Marketing method also show increase in price but initially in first
year was stable later started to increase and remain stable. On contrary
40.00
45.00
50.00
55.00
60.00
65.00
02-03 03-04 04-05 05-06 06-07 07-08 08-09 09-10 10-11 11-12
A B C D Average
164
the D curve assumed name agents base market curve is showing higher
rate of increase in average of price than any other market. Similarly the
average of total price is also showing the increasing trend in price.
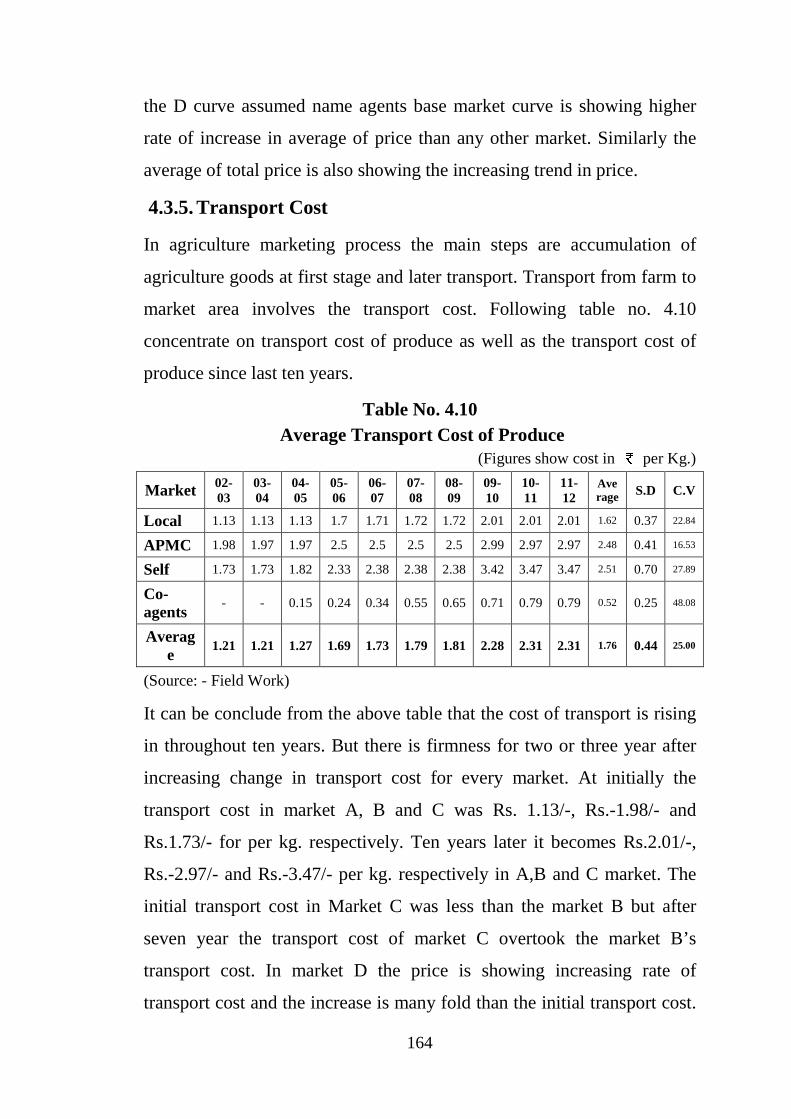
4.3.5. Transport Cost
In agriculture marketing process the main steps are accumulation of
agriculture goods at first stage and later transport. Transport from farm to
market area involves the transport cost. Following table no. 4.10
concentrate on transport cost of produce as well as the transport cost of
produce since last ten years.
Table No. 4.10 Average Transport Cost of Produce
(Figures show cost in per Kg.)
Market 02-03
03-04
04-05
05-06
06-07
07-08
08-09
09-10
10-11
11-12
Average S.D C.V
Local 1.13 1.13 1.13 1.7 1.71 1.72 1.72 2.01 2.01 2.01 1.62 0.37 22.84
APMC 1.98 1.97 1.97 2.5 2.5 2.5 2.5 2.99 2.97 2.97 2.48 0.41 16.53
Self 1.73 1.73 1.82 2.33 2.38 2.38 2.38 3.42 3.47 3.47 2.51 0.70 27.89
Co-agents
- - 0.15 0.24 0.34 0.55 0.65 0.71 0.79 0.79 0.52 0.25 48.08
Average
1.21 1.21 1.27 1.69 1.73 1.79 1.81 2.28 2.31 2.31 1.76 0.44 25.00
(Source: - Field Work)
It can be conclude from the above table that the cost of transport is rising
in throughout ten years. But there is firmness for two or three year after
increasing change in transport cost for every market. At initially the
transport cost in market A, B and C was Rs. 1.13/-, Rs.-1.98/- and
Rs.1.73/- for per kg. respectively. Ten years later it becomes Rs.2.01/-,
Rs.-2.97/- and Rs.-3.47/- per kg. respectively in A,B and C market. The
initial transport cost in Market C was less than the market B but after
seven year the transport cost of market C overtook the market B’s
transport cost. In market D the price is showing increasing rate of
transport cost and the increase is many fold than the initial transport cost.
165
It is also increasing about the average of total transport cost. If we
analyze the S.D. then we come to know the more variations are there in
market C’s transport cost. Later in total average of market cost. And
minimum variations in market D’s transport cost. In same sense we can
observe the C.V. which state that there is stability in transport cost in B
market where as more unstable is market D’s transport cost.
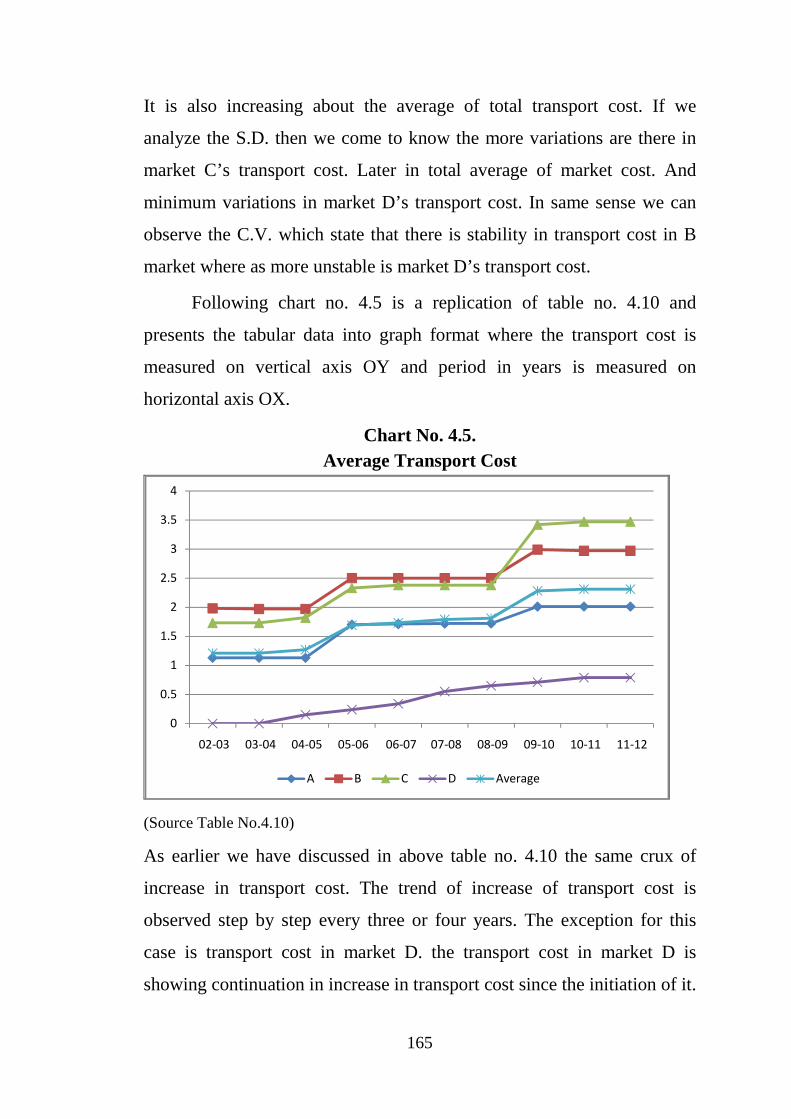
Following chart no. 4.5 is a replication of table no. 4.10 and
presents the tabular data into graph format where the transport cost is
measured on vertical axis OY and period in years is measured on
horizontal axis OX.
Chart No. 4.5. Average Transport Cost
(Source Table No.4.10)
As earlier we have discussed in above table no. 4.10 the same crux of
increase in transport cost. The trend of increase of transport cost is
observed step by step every three or four years. The exception for this
case is transport cost in market D. the transport cost in market D is
showing continuation in increase in transport cost since the initiation of it.
0
0.5
1
1.5
2
2.5
3
3.5
4
02-03 03-04 04-05 05-06 06-07 07-08 08-09 09-10 10-11 11-12
A B C D Average
166
The transport cost in market C was lying below the transport cost in
market B in first seven years and then it increase and dropped the market
B’s transport cost curve below it. Curve A and Average of all transport
cost show the same variation in transport cost of first seven years and
later average transport cost rate increase is more than of rate market A’s
transport cost.
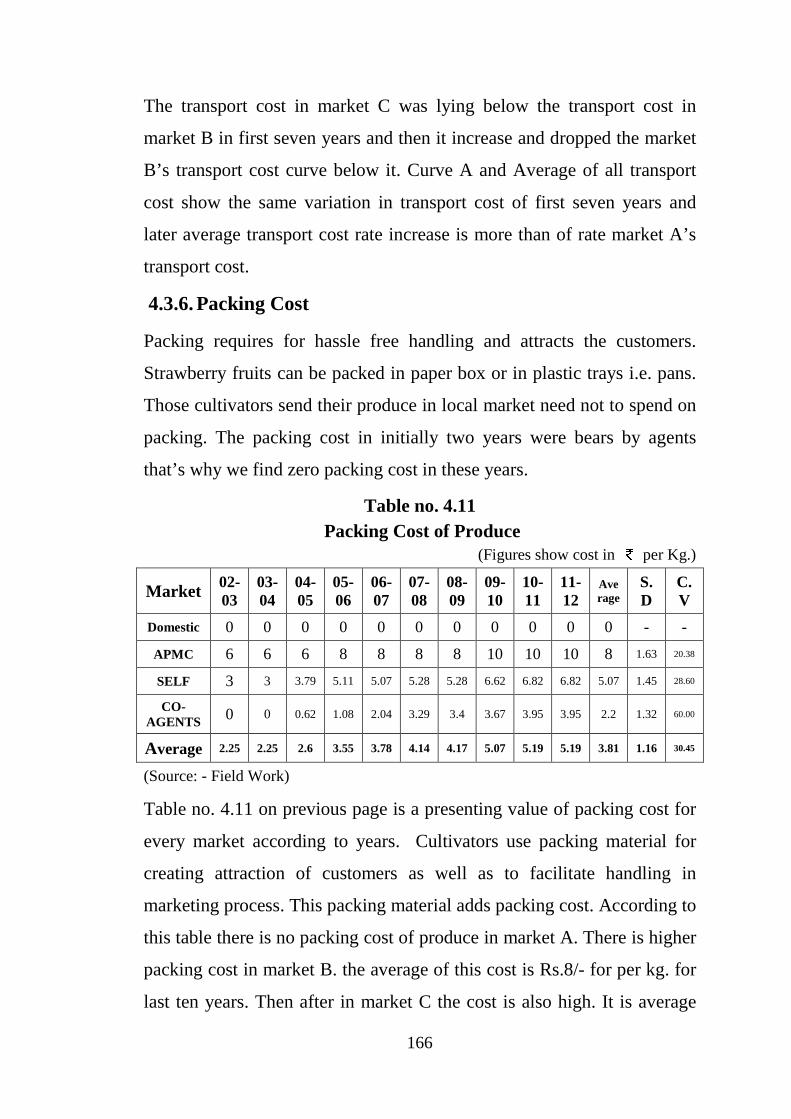
4.3.6. Packing Cost
Packing requires for hassle free handling and attracts the customers.
Strawberry fruits can be packed in paper box or in plastic trays i.e. pans.
Those cultivators send their produce in local market need not to spend on
packing. The packing cost in initially two years were bears by agents
that’s why we find zero packing cost in these years.
Table no. 4.11 Packing Cost of Produce
(Figures show cost in per Kg.)
Market 02-03
03-04
04-05
05-06
06-07
07-08
08-09
09-10
10-11
11-12
Average
S.D
C.V
Domestic 0 0 0 0 0 0 0 0 0 0 0 - -
APMC 6 6 6 8 8 8 8 10 10 10 8 1.63 20.38
SELF 3 3 3.79 5.11 5.07 5.28 5.28 6.62 6.82 6.82 5.07 1.45 28.60
CO-AGENTS 0 0 0.62 1.08 2.04 3.29 3.4 3.67 3.95 3.95 2.2 1.32 60.00
Average 2.25 2.25 2.6 3.55 3.78 4.14 4.17 5.07 5.19 5.19 3.81 1.16 30.45
(Source: - Field Work)
Table no. 4.11 on previous page is a presenting value of packing cost for
every market according to years. Cultivators use packing material for
creating attraction of customers as well as to facilitate handling in
marketing process. This packing material adds packing cost. According to
this table there is no packing cost of produce in market A. There is higher
packing cost in market B. the average of this cost is Rs.8/- for per kg. for
last ten years. Then after in market C the cost is also high. It is average
167
Rs. 5.27/- per kg. for last ten years. Lastly for agent base market it is
average Rs. 2.2/- per kg. for last eight years. If we seen this from angle
of increasing rate of packing cost then it reflect the step by step increase
in packing cost in B , C and Average total market though there is
negligible difference.
If we observe the S.D. then we come to know that average of total
packing cost is less deviate from mean whereas packing cost in market B
is more deviate from the mean. While considering the C.V. we find there
is stability in packing cost of produce in market B while in market D it’s
unstable.
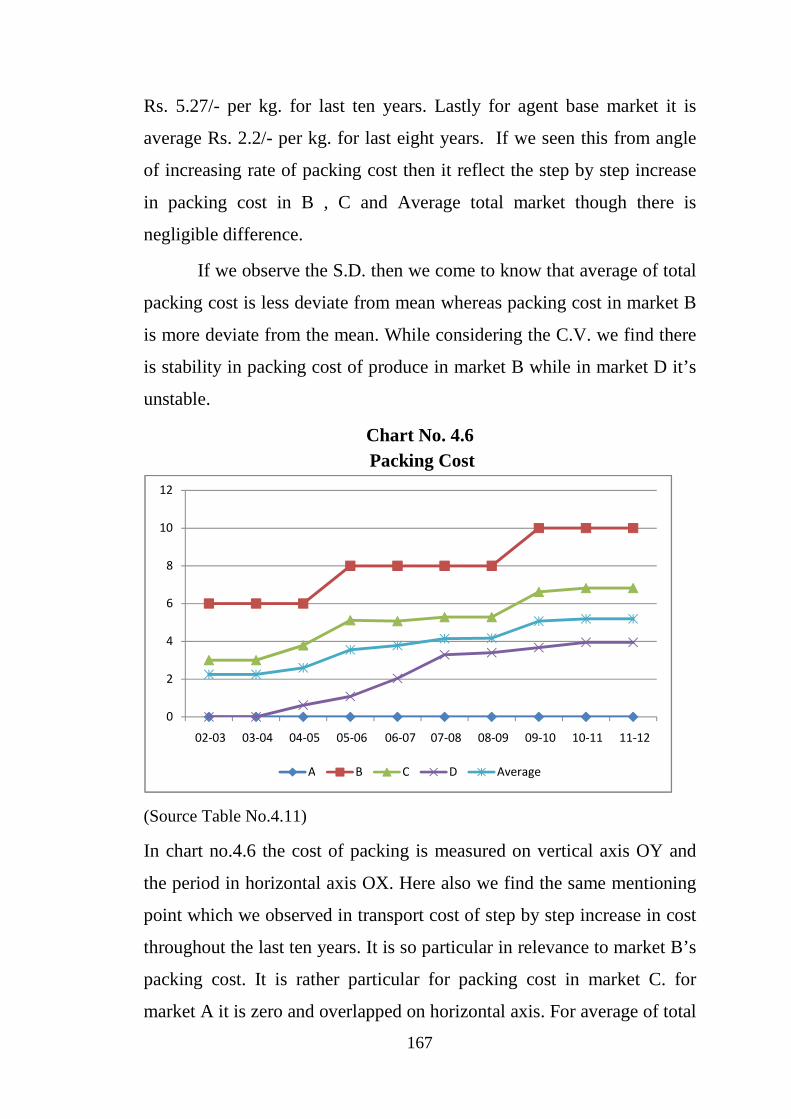
Chart No. 4.6 Packing Cost
(Source Table No.4.11)
In chart no.4.6 the cost of packing is measured on vertical axis OY and
the period in horizontal axis OX. Here also we find the same mentioning
point which we observed in transport cost of step by step increase in cost
throughout the last ten years. It is so particular in relevance to market B’s
packing cost. It is rather particular for packing cost in market C. for
market A it is zero and overlapped on horizontal axis. For average of total
0
2
4
6
8
10
12
02-03 03-04 04-05 05-06 06-07 07-08 08-09 09-10 10-11 11-12
A B C D Average
168
packing cost it is increasing but show the step by step increase. But
difference is that at every segment it maintains increase on low rate and
on next segment it rise sudden and again follow the same trend of
increase. Packing cost in market D show higher rate of increasing in first
four years and in later four years it become slow but increasing.
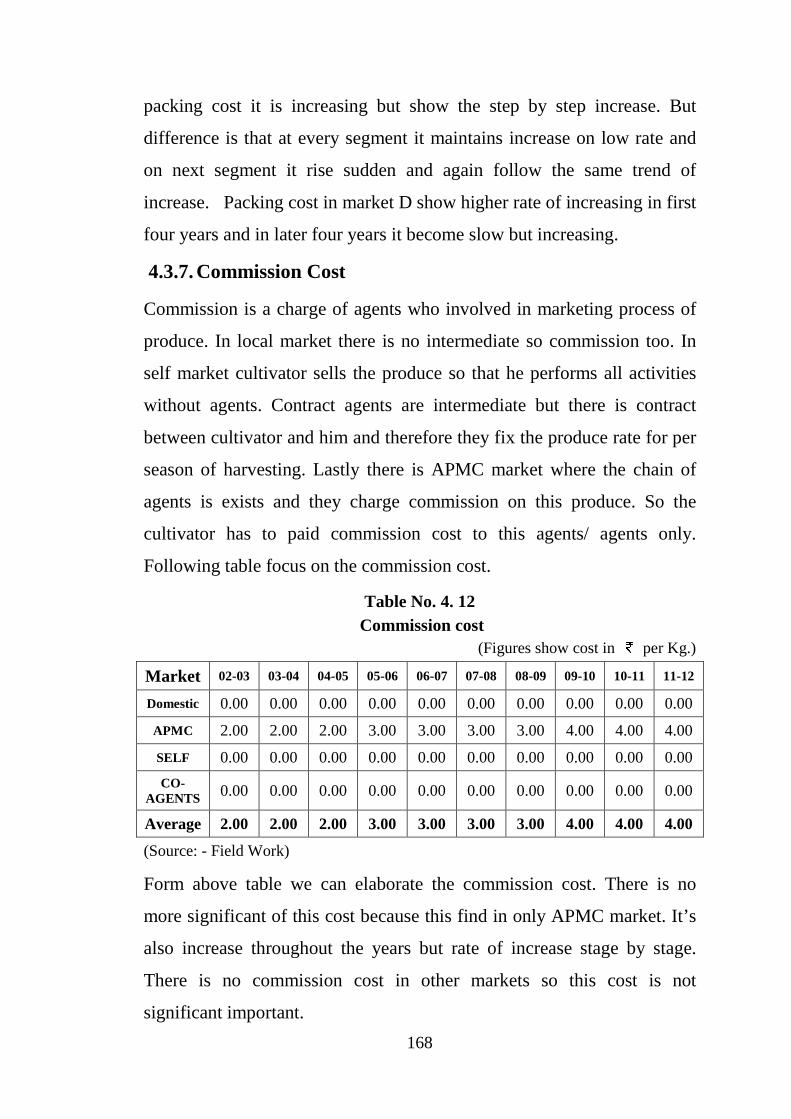
4.3.7. Commission Cost
Commission is a charge of agents who involved in marketing process of
produce. In local market there is no intermediate so commission too. In
self market cultivator sells the produce so that he performs all activities
without agents. Contract agents are intermediate but there is contract
between cultivator and him and therefore they fix the produce rate for per
season of harvesting. Lastly there is APMC market where the chain of
agents is exists and they charge commission on this produce. So the
cultivator has to paid commission cost to this agents/ agents only.
Following table focus on the commission cost.
Table No. 4. 12 Commission cost
(Figures show cost in per Kg.)
Market 02-03 03-04 04-05 05-06 06-07 07-08 08-09 09-10 10-11 11-12
Domestic 0.00 0.00 0.00 0.00 0.00 0.00 0.00 0.00 0.00 0.00
APMC 2.00 2.00 2.00 3.00 3.00 3.00 3.00 4.00 4.00 4.00
SELF 0.00 0.00 0.00 0.00 0.00 0.00 0.00 0.00 0.00 0.00
CO-AGENTS 0.00 0.00 0.00 0.00 0.00 0.00 0.00 0.00 0.00 0.00
Average 2.00 2.00 2.00 3.00 3.00 3.00 3.00 4.00 4.00 4.00
(Source: - Field Work)
Form above table we can elaborate the commission cost. There is no
more significant of this cost because this find in only APMC market. It’s
also increase throughout the years but rate of increase stage by stage.
There is no commission cost in other markets so this cost is not
significant important.
169
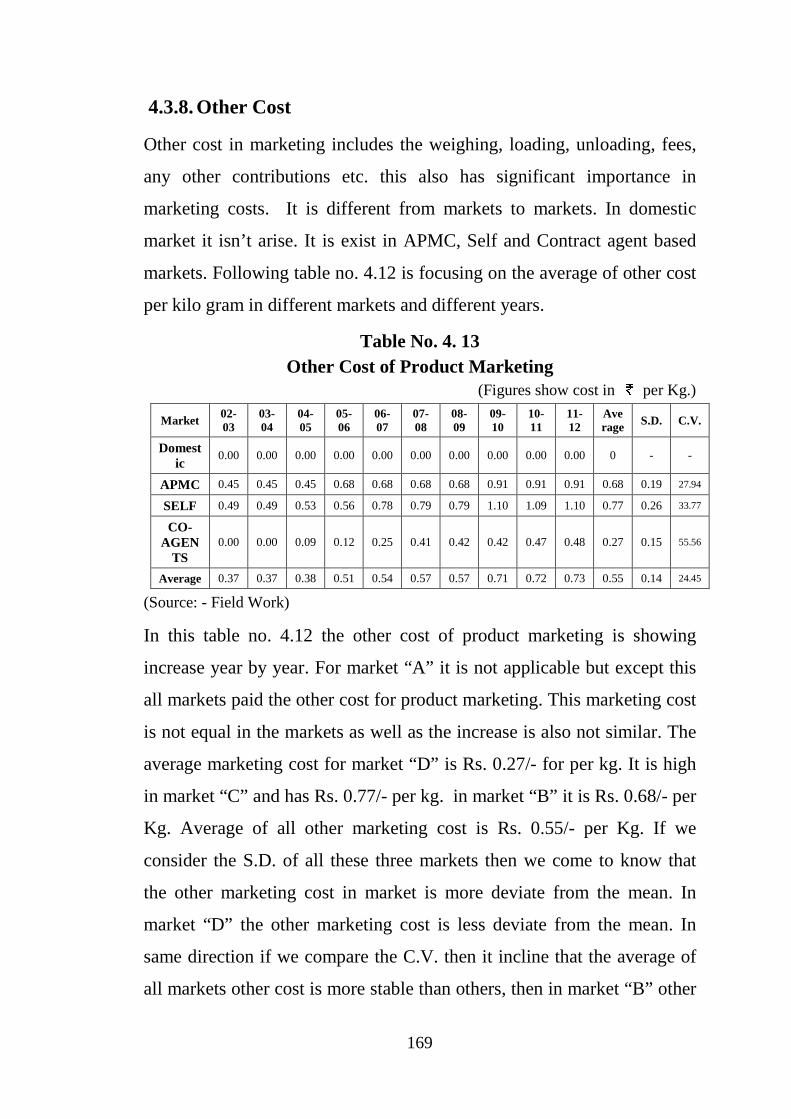
4.3.8. Other Cost
Other cost in marketing includes the weighing, loading, unloading, fees,
any other contributions etc. this also has significant importance in
marketing costs. It is different from markets to markets. In domestic
market it isn’t arise. It is exist in APMC, Self and Contract agent based
markets. Following table no. 4.12 is focusing on the average of other cost
per kilo gram in different markets and different years.
Table No. 4. 13 Other Cost of Product Marketing
(Figures show cost in per Kg.)
Market 02-03
03-04
04-05
05-06
06-07
07-08
08-09
09-10
10-11
11-12
Average S.D. C.V.
Domestic
0.00 0.00 0.00 0.00 0.00 0.00 0.00 0.00 0.00 0.00 0 - -
APMC 0.45 0.45 0.45 0.68 0.68 0.68 0.68 0.91 0.91 0.91 0.68 0.19 27.94
SELF 0.49 0.49 0.53 0.56 0.78 0.79 0.79 1.10 1.09 1.10 0.77 0.26 33.77
CO-AGEN
TS 0.00 0.00 0.09 0.12 0.25 0.41 0.42 0.42 0.47 0.48 0.27 0.15 55.56
Average 0.37 0.37 0.38 0.51 0.54 0.57 0.57 0.71 0.72 0.73 0.55 0.14 24.45
(Source: - Field Work)
In this table no. 4.12 the other cost of product marketing is showing
increase year by year. For market “A” it is not applicable but except this
all markets paid the other cost for product marketing. This marketing cost
is not equal in the markets as well as the increase is also not similar. The
average marketing cost for market “D” is Rs. 0.27/- for per kg. It is high
in market “C” and has Rs. 0.77/- per kg. in market “B” it is Rs. 0.68/- per
Kg. Average of all other marketing cost is Rs. 0.55/- per Kg. If we
consider the S.D. of all these three markets then we come to know that
the other marketing cost in market is more deviate from the mean. In
market “D” the other marketing cost is less deviate from the mean. In
same direction if we compare the C.V. then it incline that the average of
all markets other cost is more stable than others, then in market “B” other
170
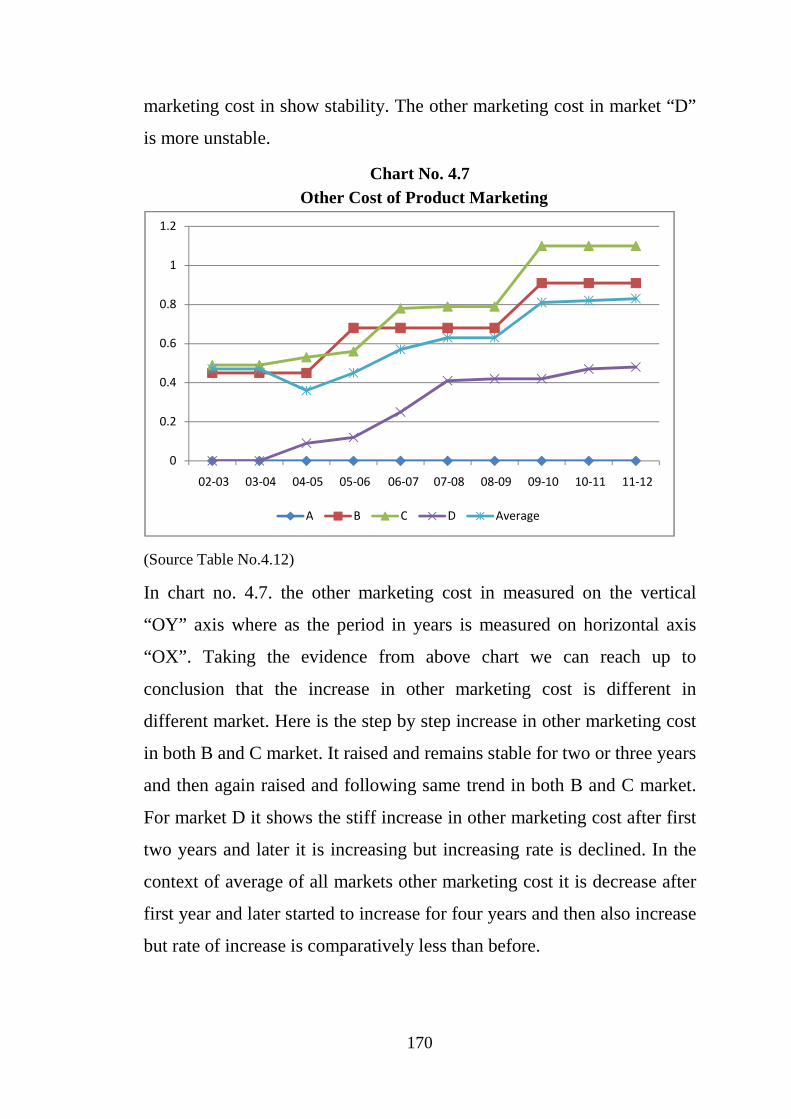
marketing cost in show stability. The other marketing cost in market “D”
is more unstable.
Chart No. 4.7 Other Cost of Product Marketing
(Source Table No.4.12)
In chart no. 4.7. the other marketing cost in measured on the vertical
“OY” axis where as the period in years is measured on horizontal axis
“OX”. Taking the evidence from above chart we can reach up to
conclusion that the increase in other marketing cost is different in
different market. Here is the step by step increase in other marketing cost
in both B and C market. It raised and remains stable for two or three years
and then again raised and following same trend in both B and C market.
For market D it shows the stiff increase in other marketing cost after first
two years and later it is increasing but increasing rate is declined. In the
context of average of all markets other marketing cost it is decrease after
first year and later started to increase for four years and then also increase
but rate of increase is comparatively less than before.
0
0.2
0.4
0.6
0.8
1
1.2
02-03 03-04 04-05 05-06 06-07 07-08 08-09 09-10 10-11 11-12
A B C D Average
171
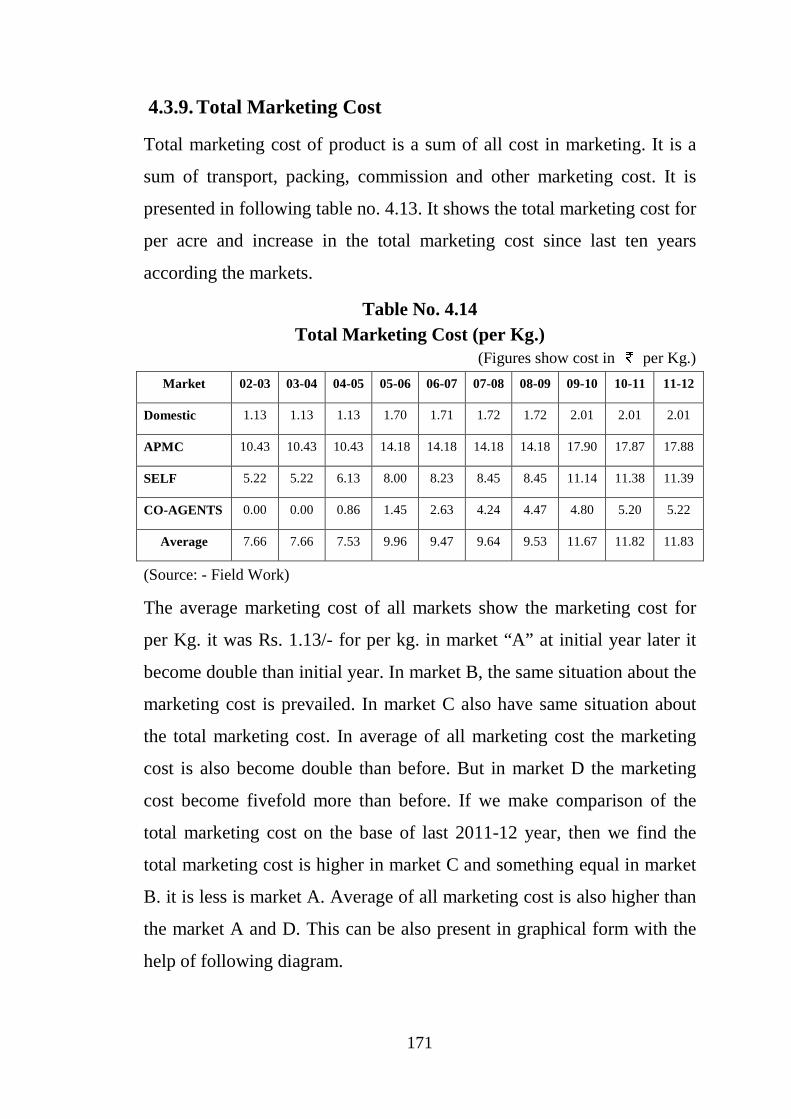
4.3.9. Total Marketing Cost
Total marketing cost of product is a sum of all cost in marketing. It is a
sum of transport, packing, commission and other marketing cost. It is
presented in following table no. 4.13. It shows the total marketing cost for
per acre and increase in the total marketing cost since last ten years
according the markets.
Table No. 4.14 Total Marketing Cost (per Kg.)
(Figures show cost in per Kg.)
Market 02-03 03-04 04-05 05-06 06-07 07-08 08-09 09-10 10-11 11-12
Domestic 1.13 1.13 1.13 1.70 1.71 1.72 1.72 2.01 2.01 2.01
APMC 10.43 10.43 10.43 14.18 14.18 14.18 14.18 17.90 17.87 17.88
SELF 5.22 5.22 6.13 8.00 8.23 8.45 8.45 11.14 11.38 11.39
CO-AGENTS 0.00 0.00 0.86 1.45 2.63 4.24 4.47 4.80 5.20 5.22
Average 7.66 7.66 7.53 9.96 9.47 9.64 9.53 11.67 11.82 11.83
(Source: - Field Work)
The average marketing cost of all markets show the marketing cost for
per Kg. it was Rs. 1.13/- for per kg. in market “A” at initial year later it
become double than initial year. In market B, the same situation about the
marketing cost is prevailed. In market C also have same situation about
the total marketing cost. In average of all marketing cost the marketing
cost is also become double than before. But in market D the marketing
cost become fivefold more than before. If we make comparison of the
total marketing cost on the base of last 2011-12 year, then we find the
total marketing cost is higher in market C and something equal in market
B. it is less is market A. Average of all marketing cost is also higher than
the market A and D. This can be also present in graphical form with the
help of following diagram.
172
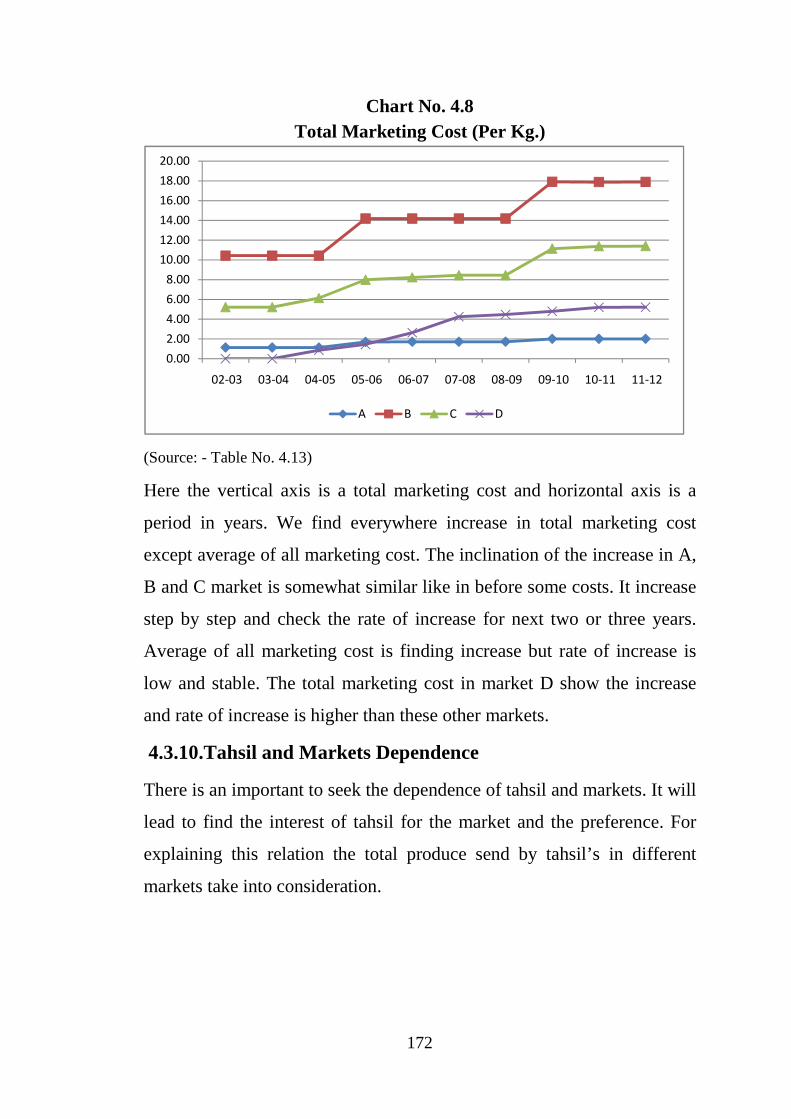
Chart No. 4.8 Total Marketing Cost (Per Kg.)
(Source: - Table No. 4.13)
Here the vertical axis is a total marketing cost and horizontal axis is a
period in years. We find everywhere increase in total marketing cost
except average of all marketing cost. The inclination of the increase in A,
B and C market is somewhat similar like in before some costs. It increase
step by step and check the rate of increase for next two or three years.
Average of all marketing cost is finding increase but rate of increase is
low and stable. The total marketing cost in market D show the increase
and rate of increase is higher than these other markets.
4.3.10. Tahsil and Markets Dependence
There is an important to seek the dependence of tahsil and markets. It will
lead to find the interest of tahsil for the market and the preference. For
explaining this relation the total produce send by tahsil’s in different
markets take into consideration.
0.00
2.00
4.00
6.00
8.00
10.00
12.00
14.00
16.00
18.00
20.00
02-03 03-04 04-05 05-06 06-07 07-08 08-09 09-10 10-11 11-12
A B C D
173
Table No. 4.15 Tahsil and Market Dependence
(Figures show cost in per Acre)
Market/ tahsil's Koregaon M’SHWAR Medha Wai Total
Domestic NA 887567 NA 198810 1086377
APMC 85773 11170731 1170186 117610 12544300
SELF NA 2668228 NA 255360 2923588
CO-AGENTS 1513785 2196529 2719790 412018 6842122
Total 1599558 16923055 3889976 983798 23396387
(6.84 %) (72.33%) (16.63%) (4.20%) (100.00%)
(Source: - Field Work)
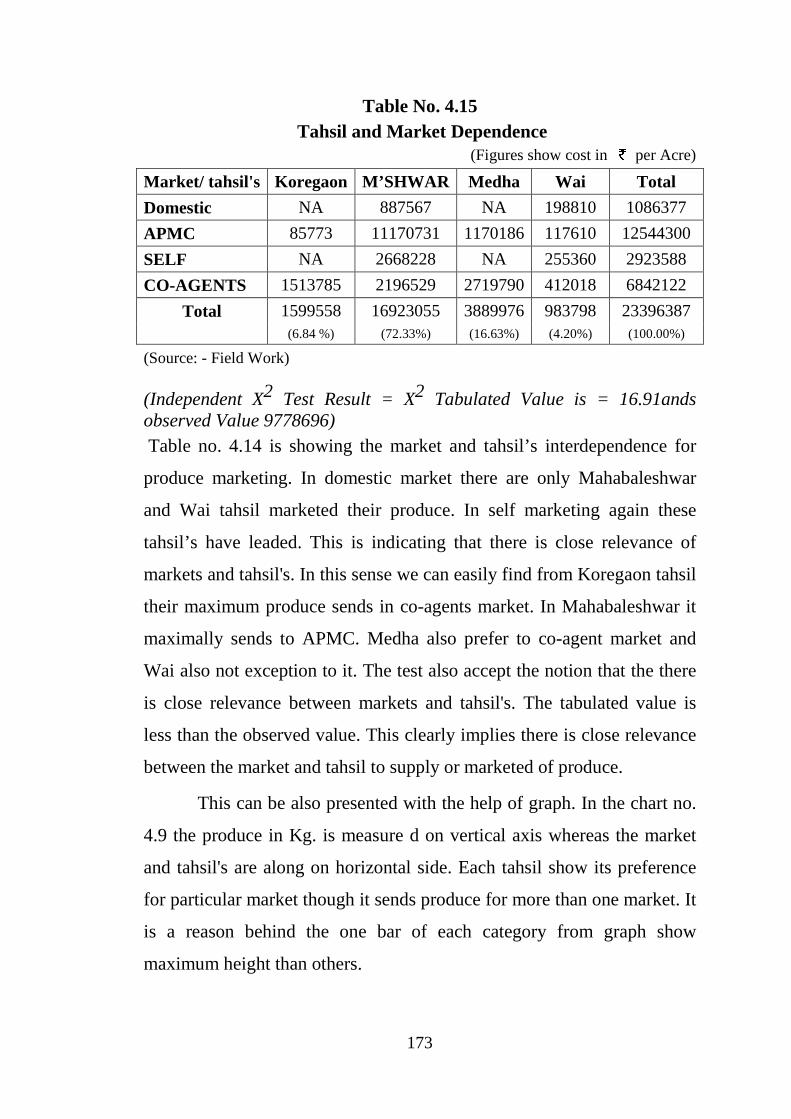
(Independent X2 Test Result = X2 Tabulated Value is = 16.91ands observed Value 9778696) Table no. 4.14 is showing the market and tahsil’s interdependence for
produce marketing. In domestic market there are only Mahabaleshwar
and Wai tahsil marketed their produce. In self marketing again these
tahsil’s have leaded. This is indicating that there is close relevance of
markets and tahsil's. In this sense we can easily find from Koregaon tahsil
their maximum produce sends in co-agents market. In Mahabaleshwar it
maximally sends to APMC. Medha also prefer to co-agent market and
Wai also not exception to it. The test also accept the notion that the there
is close relevance between markets and tahsil's. The tabulated value is
less than the observed value. This clearly implies there is close relevance
between the market and tahsil to supply or marketed of produce.
This can be also presented with the help of graph. In the chart no.
4.9 the produce in Kg. is measure d on vertical axis whereas the market
and tahsil's are along on horizontal side. Each tahsil show its preference
for particular market though it sends produce for more than one market. It
is a reason behind the one bar of each category from graph show
maximum height than others.
174
Chart No. 4.9
Tahsil and Market Dependence
(Source: - Table No. 4.14)
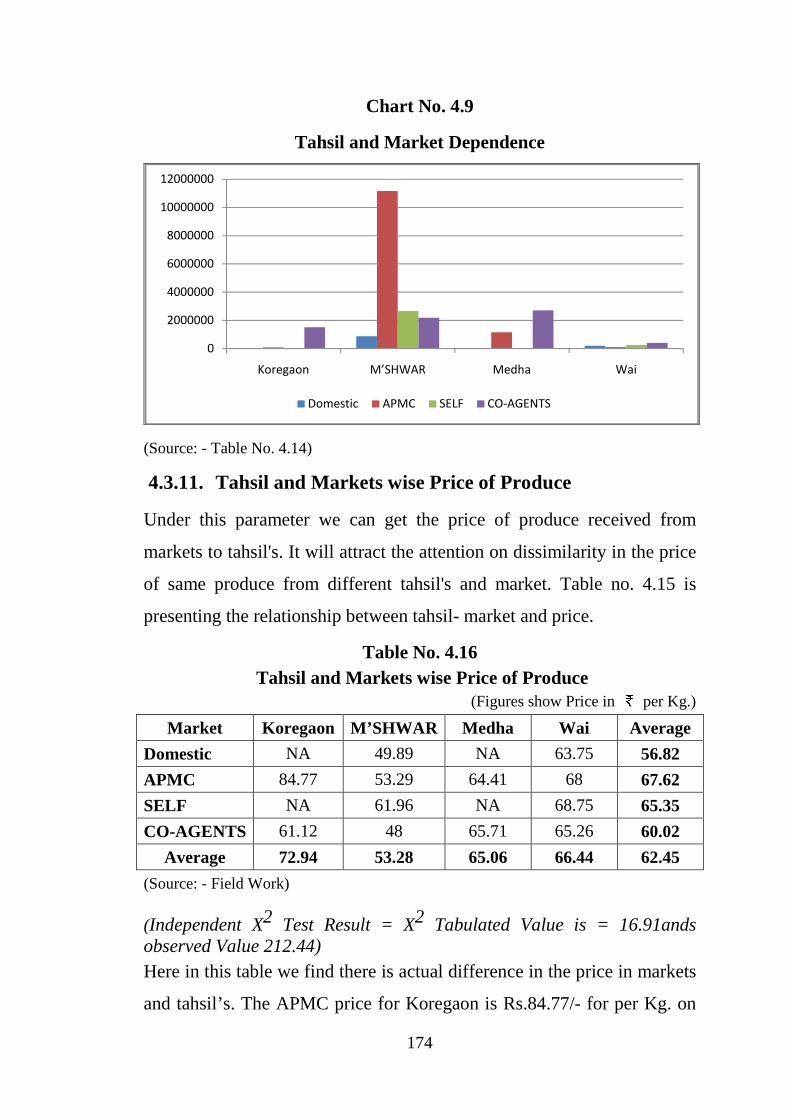
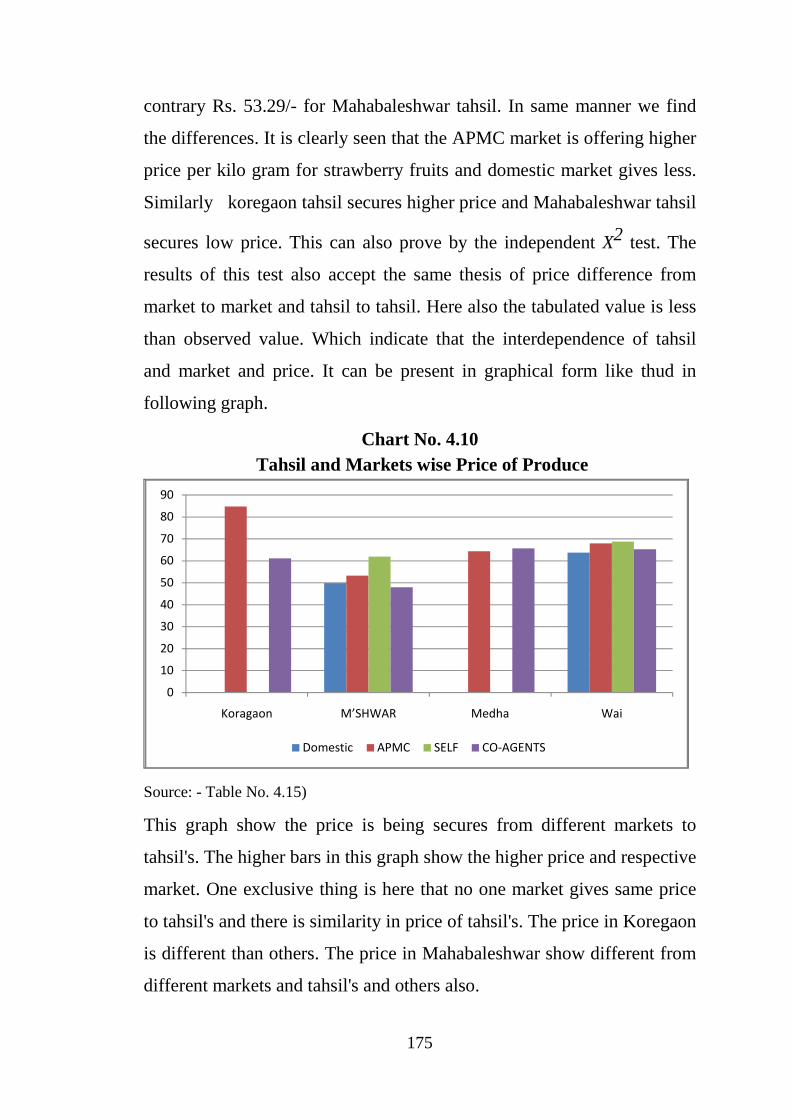
4.3.11. Tahsil and Markets wise Price of Produce
Under this parameter we can get the price of produce received from
markets to tahsil's. It will attract the attention on dissimilarity in the price
of same produce from different tahsil's and market. Table no. 4.15 is
presenting the relationship between tahsil- market and price.
Table No. 4.16 Tahsil and Markets wise Price of Produce
(Figures show Price in per Kg.)
Market Koregaon M’SHWAR Medha Wai Average
Domestic NA 49.89 NA 63.75 56.82
APMC 84.77 53.29 64.41 68 67.62
SELF NA 61.96 NA 68.75 65.35
CO-AGENTS 61.12 48 65.71 65.26 60.02
Average 72.94 53.28 65.06 66.44 62.45
(Source: - Field Work)
(Independent X2 Test Result = X2 Tabulated Value is = 16.91ands observed Value 212.44) Here in this table we find there is actual difference in the price in markets
and tahsil’s. The APMC price for Koregaon is Rs.84.77/- for per Kg. on
0
2000000
4000000
6000000
8000000
10000000
12000000
Koregaon M’SHWAR Medha Wai
Domestic APMC SELF CO-AGENTS
175
contrary Rs. 53.29/- for Mahabaleshwar tahsil. In same manner we find
the differences. It is clearly seen that the APMC market is offering higher
price per kilo gram for strawberry fruits and domestic market gives less.
Similarly koregaon tahsil secures higher price and Mahabaleshwar tahsil
secures low price. This can also prove by the independent X2 test. The
results of this test also accept the same thesis of price difference from
market to market and tahsil to tahsil. Here also the tabulated value is less
than observed value. Which indicate that the interdependence of tahsil
and market and price. It can be present in graphical form like thud in
following graph.
Chart No. 4.10 Tahsil and Markets wise Price of Produce
Source: - Table No. 4.15)
This graph show the price is being secures from different markets to
tahsil's. The higher bars in this graph show the higher price and respective
market. One exclusive thing is here that no one market gives same price
to tahsil's and there is similarity in price of tahsil's. The price in Koregaon
is different than others. The price in Mahabaleshwar show different from
different markets and tahsil's and others also.
0
10
20
30
40
50
60
70
80
90
Koragaon M’SHWAR Medha Wai
Domestic APMC SELF CO-AGENTS
176
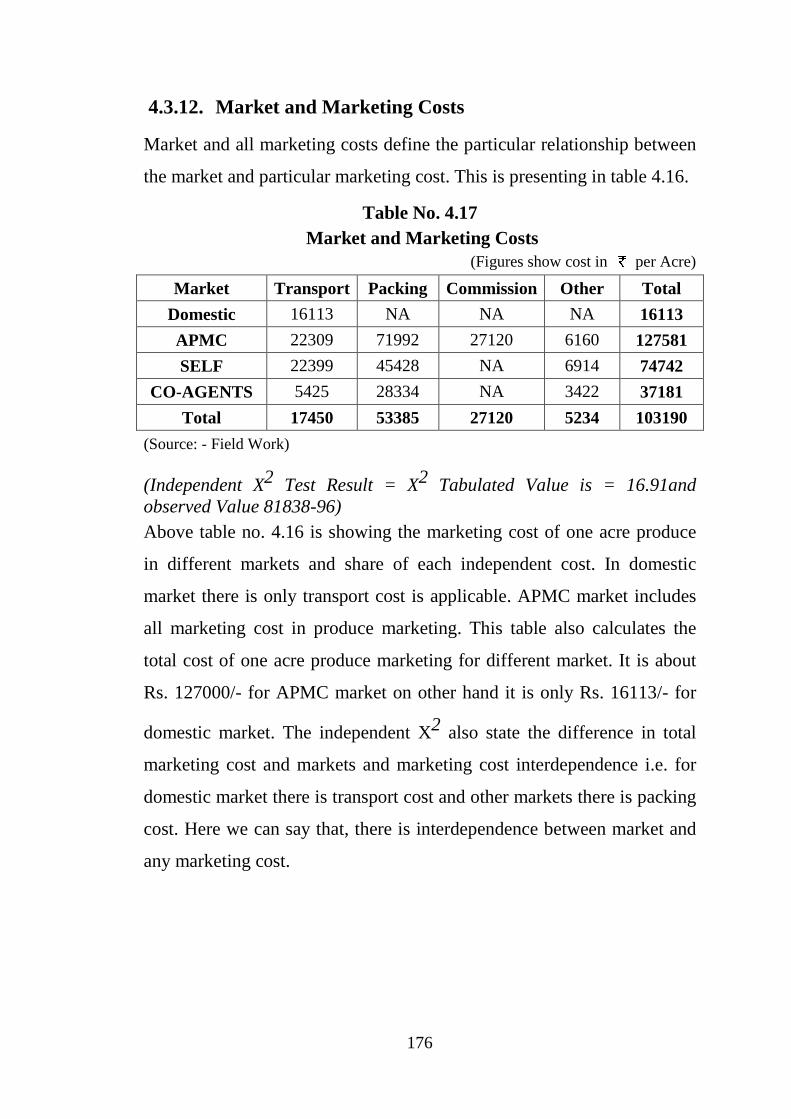
4.3.12. Market and Marketing Costs
Market and all marketing costs define the particular relationship between
the market and particular marketing cost. This is presenting in table 4.16.
Table No. 4.17 Market and Marketing Costs
(Figures show cost in per Acre)
Market Transport Packing Commission Other Total
Domestic 16113 NA NA NA 16113
APMC 22309 71992 27120 6160 127581
SELF 22399 45428 NA 6914 74742
CO-AGENTS 5425 28334 NA 3422 37181
Total 17450 53385 27120 5234 103190
(Source: - Field Work)
(Independent X2 Test Result = X2 Tabulated Value is = 16.91and observed Value 81838-96) Above table no. 4.16 is showing the marketing cost of one acre produce
in different markets and share of each independent cost. In domestic
market there is only transport cost is applicable. APMC market includes
all marketing cost in produce marketing. This table also calculates the
total cost of one acre produce marketing for different market. It is about
Rs. 127000/- for APMC market on other hand it is only Rs. 16113/- for
domestic market. The independent X2 also state the difference in total
marketing cost and markets and marketing cost interdependence i.e. for
domestic market there is transport cost and other markets there is packing
cost. Here we can say that, there is interdependence between market and
any marketing cost.
177
4.4. Problems in Marketing
4.4.1. The daily ache of cultivator is unmanageable fruit picking. It must
be undertakes early sunrise at least before 8.00 am in morning. It is
essential but exhaustive work. In this practice cultivator loose his whole
day working capacity. On account of its essentiality and without option
work mechanism cultivator must keep him assign with this work.
4.4.2. The packing of strawberry fruit is a skillful work and it takes a long
time to pack the whole produce in packing material. As soon as after
completion of fruit clipping this work starts. Cultivator can bring the
specialization in packing and have to cut the packing time for his rest.
In specialization he can work with his colleagues and distributes the
different work for different and skillful person so that there is increase
the work speed in minimum time.
4.4.3. The expenditure in marketing is also major difficulty. In domestic
market it is near to about twenty thousand. It is about Rs. 125000/- in
APMC market which is half of one acre cultivation cost. In these
context cultivators have to concentrate on these independent
expenditure heads in marketing cost and try to cut down the marketing
cost. Here is chance to cut down the packing cost as well as other cost.
Just like usually for packing the all process is manually done. If there is
invention of this kind of machine which automatically weigh the fruits
and fill into box without human touch result to spend time in other
activities as well as for rest.
4.4.4. Another difficulty is relevance to existence of transaction of these
agents. As per cultivators view agents stand between transactions of
178
cultivators and ultimate customers and charge the commission of his
interferes. In this light of agents works cultivators have to keep in mind
that he cannot eliminate this chain similarly he can’t sells his produce
without agents. But cultivators can overcome on this difficulty if one of
the cultivation partner either brother or son or any may perform the
direct marketing function of his strawberry fruit.
4.4.5. Cultivator chooses the suitable market for better return from his
produce sell. He need cash in meantime to foster his family and meet
the all maintenance cost. Therefore he needs instant return form
marketing. There is instant return in domestic and self marketing
method but rate is usually less and risky in nature. He sends his produce
in APMC and his Contracted agents where he gets his return truly late.
Some time they make full payment as an advance for next year. This
payment system collapses the economic schedule of cultivators. The
best way to avoid this economic situation is to use multi markets for
marketing so they can give you payment when you needed it.
4.4.6. While marketing of this fruit about 15% cultivators utters that there
is much flexibility in price during the year. It is a result of demand and
supply and which influence the price. We can’t interfere in this
mechanism with our squirrel share in market. As a producer we can
make plan of production on cooperative basis and try to keep constant
supply throughout year.
4.4.7. 35 % cultivators state that there is no awareness about this fruit in
common consumer so that consumption too. In light of this statement
we have to create awareness among the consumer about benefits of this
fruits as well as the various recipes. Now days the strawberry festival
179
has been organizing in Mahabaleshwar tahsil to create awareness in
consumers. But it is limited up to visitors who visit Mahabaleshwar
tahsil. So we should have to organize this festival on state and national
level to create awareness. Simultaneously we can present our stall in
various exhibitions and fairs to increase in demand.
4.4.8. About 24% cultivators have opinion that they have limited
available options to sell their produce. Instead of these traditional
markets there is no alternative market available for produce marketing.
Today we send our produce in selected cities in Maharashtra and nearest
and famous other State cities. Yet our produce is not reached more than
these selected cities so we have to show our interest in other markets.
4.4.9. About 27% cultivators say their respective intermediate person
doesn’t give them payment on time and some time he makes
misappropriation in final amount. As a cultivator our bargaining power
is less and economic condition doesn’t force us to movement against
well settled agent chain. So we can become self independent to sell our
own product to ease form these incidences. If we come together and on
cooperative basis raise our noise for the price and transaction then it
will lead to eliminated bad conduction in market.
4.4.10. This fruit is perishable so it can’t send very far market and dump
for more days. It can be possible if cold storage facility is available for
storing it and same facility for transporting it to far markets. This will
lead to manage supply according to demand and helpful in capture
nationwide market for increasing aggregate demand.
4.4.11. In India strawberry fruit is generally consumed in fresh form.
Beside this the strawberry we can make available in frozen form for
180
consuming and utilizing in different products. It will helpful in off
season viz. monsoon where produce is not available for marketing. It is
also helpful in stabilize the market price of this fruit. When there are
gluts of produce in market we can transform it into frozen form and sell
out it in scare supply condition.
4.4.12. One more possibility is there to increase the demand for this fruit.
Mostly it is used fresh consumption purpose but if we give stress on the
secondary product in processing units then the demand tend to rise.
4.4.13. Beside this the international market is also allure to our strawberry
and generate maximum benefits from it export to some worldwide
countries.
4.5. Prospects of Strawberry Marketing
4.5.1. Besides the traditional marketing of strawberry fruit in fresh form it
also trades in frozen form in international markets. Cultivators have to
develop this frozening technique and promote the marketing activities.
4.5.2. Find out secondary use of fruit for creating additional demand.
4.5.3. Capture the popular city markets in Indian Territory for widen the
markets.
4.5.4. Advertisement of strawberry fruits through proper media which
will turn to bear awareness in among customer.
4.5.5. Beside these following is international market potential for Indian
strawberry growers.
Strawberry fruits most likes from consumers at global level. Strawberry
cultivates in Europe and America on large scale. Spain, Italy, Poland,
Israel, Kenya, China, Japan etc. are major producers of strawberry.
Though Europe – America produce major parts of strawberry fruits, they
found shortage in October to March due to vagaries of climate situation.
181
This period considers nourishing for strawberry cultivation in Satara.
Abundant yield attains in this period, if diverts in foreign market may be
advantageous to cultivators. We seen pace associated with this intention
in year 2007. About 300 ton exports if strawberry done in Europe and
expected 2000 ton in 2008 – 09 stuck in world recession.
4.6. Export Pricing and Costing -
Export pricing is the most important tool for promoting sells and
facing international Competition. The price has to be realistically worked
out taking into consideration all export benefits and expenses. However
there is no fixed formula for pricing strategies it will differ from exporter
to exporter. The current wholesale market price of strawberry in India is
ranging from Rs 240 to 300 per kg depends on the grades.
4.6.1. Export Standards
EU Market Standards - The marketing standards for quality and labeling
of fruit and vegetables are laid down in basic regulation EC 2200/96 (of
28 October 1996), in the framework of the Common Agricultural Policy
(CAP). Products, which do not comply with these standards, are barred
from the market. Besides EU legislation, importers of frozen fruit and
vegetables have their own quality standards. The EU requirements must
therefore be seen as indicative for the Quality that is demanded by the
European importers. The care and handling between harvests and delivery
to the country of import is often one of the weakest points in the
relationship between producer and importer. The UN standards apply in
the case of a product, which is not covered by the EU quality standards.
The Standards organizations are able to inform the quality standards that
apply to the various products.
4.6.2. EUREPGAP :- A code for fruit and vegetables that is gaining
ground in Europe is EurepGap. The Euro- Retailer Produce Working
182
Group (EUREP) has developed the Good Agricultural Practice
standards. The Working Group has responded to increasing consumer
interest in food safety and environmental issues. The framework of
EurepGap requires companies to have a good management system in
place to deal with quality, hygiene and environmental matters. Although
EurepGap standards are yet not common practice in all the EU member
states, it is expected that they will be increasingly accepted and applied
in the future, particularly by the large supermarket chains.
4.6.3. Major Markets in the World for Frozen Strawberry
A) the Unites States
The United States can be termed as the single largest market for
frozen fruits and vegetables in the world. The US market consumed an
approximate of 4.5 million tones of frozen fruits and vegetables in 2005.
With an annual growth rate of around 3%, it is expected to reach the 6
million tones level by 2010. Frozen vegetables totally dominate the
frozen fruits and vegetables category in US with a share of 93% in 2005.
With future even better for frozen vegetables, the share is expected to
increase to 94% by 2010, meaning 5.6 million tons. Frozen fruits
category’s share is projected to plunge to 5.9% by 2010.
B) The United Kingdom -
United Kingdom is the largest European market for frozen fruits
and vegetables with a total volume of around 1 million tons in 2005. The
market has been clocking a growth rate of around 2.5% for this decade
and is expected to contribute over 26% to the total frozen fruits and
vegetables market in Europe at the end of this decade. Similar to the US
market, frozen vegetables contribute 99% to the category. The frozen
fruits market in UK is expected to grow at a CAGR of 2.15%. Consumers
183
in United Kingdom are getting more and more inclined towards healthy
food as a part of a lifestyle change.
C) France -
France represents one of the largest market in the European Frozen
fruits and Vegetables market. French frozen fruit and vegetable market is
estimated to total 962 thousand tons in 2005. The market for these
products is projected to grow at a compounded annual rate of 2.56% to
reach 1,088 thousand tons by 2010. Frozen vegetables segment is
estimated to hold a lion’s share in the total French Frozen fruits and
vegetables market in 2005. The market is projected to reach 1,077
thousand tons by 2010. Frozen fruit market is estimated to total 9
thousand tons in 2005. The segment is projected to grow at a CAGR of
4.17% to during the ten-year analysis period.
D) Germany -
German market for frozen fruits and vegetables was estimated to
total 886 thousand tons in 2005, and is 906 thousand tons in 2006. The
market is projected to grow at a moderate rate of 2.49% over the analysis
period 2001-2010 to reach 999 thousand tons by 2010. Frozen vegetables
segment is projected to account for a share of 90.43% of the German
frozen fruits and vegetables market in 2005. The market for frozen fruits
is projected to grow at a compounded annual rate of about 2.64% to reach
97 thousand tons by 2010. This segment is projected to experience a
market share gain over the 2001- 2010 periods, to represent 9.67% of the
total market by 2010.
E) Belgium -
The Belgian frozen food market grew by 5.2% in 2003 to reach a
value of $785 million. In 2008, the market is forecast to have a value of
$979 million, an increase of 24.7% since 2003. Frozen meat, fish and
184
seafood remained the leading segment in the market. In 2003, frozen
meat, fish and seafood generated 44.9% of the frozen food sales. In 2003,
the Belgian market generated 1.8% of the European frozen food sales.
During the next five years, the market is expected to experience strong
but gradually decelerating growth rates. By 2008, the market is forecast
to reach a value of $979 million, which equates to a CAGR of 4.5% in the
period of 2003 – 2008, higher than the European market. Indeed, it is
expected that the Belgian market will be the strongest performing frozen
food market in Western Europe in the next five years, heavily outpacing
the larger markets of France, Germany and the UK.
F) Japan -
The Japanese market for frozen fruits and vegetables was estimated
at 1,153 thousand tons in 2005, and is 1,189 thousand tons in 2006. The
market is projected to grow at a compounded annual rate of about 3.44%,
to reach 1,324 thousand tons by 2010. The Japanese frozen fruits market
was estimated to be 247 thousand tons in 2005, and is projected to grow
at a CAGR of 2.31% to reach 268 thousand tons by 2010. The frozen fruit
segment is projected to experience a decline in market share through the
ten-year period and account for 20.23% of the total market by 2010.
We are standing on the threshold of world’s liberalization,
privatization and globalization policy. In line of this policy we have to
accept the agricultural as a commercial activity where fittest can only
survive. Every commodity and service is becoming global and customer
too. Now day we have to accept the new challenges and our old
discrepancies as opportunities and major thrust areas. Tough there are
several difficulties occurs in strawberry marketing since we have been
185
starting the marketing of this fruits but we never stop our proceeding of
marketing. In same direction we can keep our marketing continues with
this long experience with our back. We can adjoin the international
market to our domestic market for better marketing and profit. But if we
concentrate our national market for marketing this produce would helpful
to fulfill market objective of farmers and dietary indicator of our
population. We have major thrust in our nation market than international
market. Strawberry from this district is until in nearby markets of this and
some famous cities in few near States. So in future days we make able us
to fill the all nation market and then international markets.