STRAUSS GROUP LTD. TABLE OF CONTENTS
88
• DESCRIPTION OF THE CORPORATION'S BUSINESS • BOARD OF DIRECTORS' REPORT TO THE SHAREHOLDERS AS AT SEPTEMBER 30, 2016. • FINANCIAL STATEMENTS AS AT SEPTEMBER 30, 2016. • ISOX DECLARATION • INCLUSION OF THE FINANCIAL STATEMENTS OF AN INVESTEE PURSUANT TO REGULATION 44 OF THE SECURITIES REGULATIONS, 1970 STRAUSS GROUP LTD. TABLE OF CONTENTS
Transcript of STRAUSS GROUP LTD. TABLE OF CONTENTS

• DESCRIPTION OF THE CORPORATION'S BUSINESS
• BOARD OF DIRECTORS' REPORT TO THE SHAREHOLDERS AS AT
SEPTEMBER 30, 2016.
• FINANCIAL STATEMENTS AS AT SEPTEMBER 30, 2016.
• ISOX DECLARATION
• INCLUSION OF THE FINANCIAL STATEMENTS OF AN INVESTEE PURSUANT TO REGULATION 44 OF THE SECURITIES REGULATIONS, 1970
STRAUSS GROUP LTD. TABLE OF CONTENTS

STRAUSS GROUP LTD. DESCRIPTION OF THE CORPORATION'S BUSINESS

UPDATE OF THE CHAPTER "DESCRIPTION OF THE COMPANY'S BUSINESS AFFAIRS" IN THE PERIODIC REPORT OF STRAUSS GROUP LTD. (HEREINAFTER: THE "COMPANY") FOR THE
YEAR 20151 (HEREINAFTER: THE "PERIODIC REPORT")
Following is a description of material changes and/or developments that occurred in the Company's business in the nine months ended on September 30, 2016 and through to the date of publication of the report, which are required to be described in the Periodic Report in accordance with Regulation 39A of the Securities Regulations (Periodic and Immediate Reports), 1970. This update refers to several sections in the chapter Description of the Company's Business Affairs as well as a number of regulations appearing in the chapter Additional Information on the Company in the Company's 2015 Periodic Report (“Description of the Company's Business Affairs Report” and “Additional Information on the Company Report”, respectively). 1. Section 4 of the Description of the Company's Business Affairs Report, Dividend Distribution
On July 7, 2016 the Board of Directors of the Company approved the distribution of a cash dividend to the shareholders of the Company. For information on said dividend distribution, see the Immediate Report of July 10, 2016 (reference number 2016-01-078250).
2. Section 14 of the Description of the Company's Business Affairs Report, the International Dips
& Spreads Segment
On June 30, 2016 the Company announced that PepsiCo-Strauss Fresh Dips & Spreads International ( “Obela”), an investee that is jointly controlled by Strauss and PepsiCo, entered into an agreement for the acquisition of 100% of the share capital of Florentin B.V. (hereinafter: “Florentin”). Florentin is a Dutch company engaged in the development and manufacture of organic hummus, falafel, spreads and pita bread products and markets its products in Western Europe, particularly in the Netherlands, Germany and France. Florentin employs a staff of forty and operates a production site in Holland. According to Florentin's financial statements, its sales turnover in 2015 is estimated at approximately €5 million. The acquisition represents the expansion of the dips and spreads operation into Western Europe. For further information on the acquisition, see the Immediate Report of June 30, 2016 (reference number 2016-01-071689).
3. Section 21 of the Description of the Company's Business Affairs Report, Human Capital
Section 21.8, Officers and Managers – On September 26, 2016 the Meeting of Shareholders of the
Company approved the proposed resolutions on the agenda, as follows: (1) Approval of the Company's revised remuneration policy; (2) Approval of the revision and extension of the conditions of office and employment of the Chairperson of the Board of Directors of the Company; (3) Revision of the conditions of office and employment of the Company CEO; (4) Approval of the grant of a letter of undertaking to indemnity to Mr. Adi Strauss, a director of the Company and relative of the controlling shareholder; (5) Discussion of the Annual Financial Statements of the Company and Board of Directors' Report for the year ended December 31, 2015; (6) Reappointment of KPMG Somekh Chaikin as the auditors of the Company until the next Annual General Meeting, empowerment of the Board of Directors of the Company to determine their fee for 2016 and a report on their fee for 2015; and (7) Reappointment of Ms. Ronit Haimovitch, Mr. Akiva Mozes and Ms. Galia Maor, who are retiring by rotation, as directors of the Company in accordance with the provisions of the Articles of Association of the Company. For further information, see Immediate Reports of August 18, 2016 (reference number 2016-01-105793), September 25, 2016 (reference number 2016-01-128779) and September 27, 2016 (reference number 2016-01-054906).
4. Section 22 of the Description of the Company's Business Affairs Report, Financing Section 22.1, General – On May 18, 2016 the Company published a shelf prospectus. For further
information, see the Immediate Report of May 18, 2016 (reference number 2016-01-028557). Section 22.8, Credit Rating – On April 4, 2016 the Company announced the reaffirmation of Standard &
Poor's Maalot's ilAA+ rating with a revision of the rating outlook from stable to negative. For further
1 As published on March 21, 2016 (reference number 2016-01-010371).

information, see the Company's Immediate Report of April 4, 2016 (reference number 2016-01-041209).
On April 21, 2016 the Company announced the reaffirmation of Midroog's Aa2 rating for the Company's outstanding Series B and Series D Debentures, with stable outlook. For further information, see the Company's Immediate Report of April 21, 2016 (reference number 2016-01-054433).
5. Section 25 of the Description of the Company's Business Affairs Report, Restrictions and Supervision of the Group's Operations
On September 30, 2016 the Public Health Protection (Food) Law entered into force. The law deals with the comprehensive regulation of the food industry in Israel and of all parties
engaged in this industry (manufacturers, importers, marketers, exporters, shippers and storage companies). Among other things, the law regulates a manufacturer's liability for the food it produces, inter alia, supervision of the manufacturing process, the liability of a food importer and supervision of the import of food products. The law further regulates the liability and obligations of a food marketer in all phases of food shipping and handling from production through import to the direct point of sale to the consumer.
In addition, the law defines a number of mitigations including the extension of licenses
(production/storage and shipping), mitigations in the import of non-sensitive products, extension of the expiration date of non-sensitive raw materials, and regulation in the primary legislation of an existing contradiction between official regulations and standards applying to food safety, which are likely to influence competition in the food and beverages industry to a certain extent and at the same time, create new business opportunities for the Company. In the Company's opinion, the law will not have a material impact on the financial results of the Company.
On November 21, 2016 the recommendations of the Regulation Committee for the Promotion of
Healthy Nutrition in Israel (the "Committee") were published. The recommendations include, inter alia, reference to positive and negative labeling on the packaging of food products with respect to sodium, sugar and saturated fat content; supplementation of the nutrition information on the "back of pack"; and a review of certain limitations on the advertising of negatively labeled products. As at the date of this report the Company is reviewing the Committee's recommendations and is unable to assess the extent of their impact, if and to the extent that they are adopted in legislation, on the Company's business results.6. Section 27 of the Description of the Company's Business Affairs Report, Legal Proceedings
For updates, see Note 6 to the Consolidated Interim Financial Statements of the Company as at
September 30, 2016. 7. Regulations 21, 22 and 29A of the Additional Information on the Company Report, Payments to
Interested Parties and Senior Officers, Transactions with a Controlling Shareholder, and Company Resolutions, respectively
For information, see section 3 of this Report. 8. Regulation 22 of the Additional Information on the Company Report, Transactions that Are Not
Listed in Section 270(4) of the Companies Law Which Are Not Negligible Transactions Purchase of advertising time – The purchase of advertising time from Reshet-Noga Communications
Ltd. in the nine months ended September 2016 totaled NIS 7,604,144. 9. Regulation 26 of the Additional Information on the Company Report, Directors of the Company
On May 3, 2016 the Company announced that Mr. Ran Midyan had ceased to serve as a director of the Company. For further information, see the Company's Immediate Report of May 3, 2016 (reference number 2016-01-058330).
Date: November 21, 2016 Names and titles of signatories: ___________________________ Ofra Strauss, Chairperson of the Board of Directors Strauss Group Ltd. Gadi Lesin, CEO

STRAUSS GROUP LTD. BOARD OF DIRECTORS' REPORT TO THE SHAREHOLDERS AS AT SEPTEMBER 30, 2016

Convenience Translation from Hebrew
1
STRAUSS GROUP LTD. BOARD OF DIRECTORS’ REPORT TO THE SHAREHOLDERS
FOR THE QUARTER ENDED SEPTEMBER 30, 2016 EXPLANATIONS BY THE BOARD OF DIRECTORS REGARDING THE COMPANY'S BUSINESS POSITION, THE RESULTS OF ITS OPERATIONS, ITS SHAREHOLDERS' EQUITY AND CASH FLOWS The Board of Directors of Strauss Group Ltd. (hereinafter: the "Company" or the "Group") hereby respectfully submits the Board of Directors' Report for the first nine months and third quarter of 2016 in accordance with the Securities Regulations (Periodic and Immediate Reports), 1970 (the "Regulations"). The review presented below is limited in scope and refers to events and changes that occurred in the state of the Company's affairs in the reporting period, which have a material impact, and should be read together with the chapter "Description of the Company's Business Affairs" in the Periodic Report as at December 31, 2015, the Financial Statements and Board of Directors' Report on the Company's Business Position for the year then ended (the "2015 Periodic Report"), as well as the update of the chapter "Description of the Company's Business Affairs", the Board of Directors' Report and the Financial Statements as at March 31, 2016 and June 30, 2016 and the update of the chapter "Description of the Company's Business Affairs" and the Financial Statements as at September 30, 2016. Strauss Group Ltd. and the companies it controls, including jointly controlled companies, are a group of industrial and commercial companies engaged mainly in the development, manufacture, sale and marketing of a variety of branded food and beverage products. The Group is also active in the development, marketing, servicing and sale of water filtration, purification and carbonation systems. The Group is active in six segments, as follows: Strauss Israel, which comprises two activity segments (Health & Wellness and Fun & Indulgence); Strauss Coffee, which comprises two segments (Israel Coffee (which includes the coffee company's corporate center) and the International Coffee operation); the International Dips & Spreads segment; and other activities that are included in the financial statements as the "Other Operations" segment (the major operations being those of Strauss Water and Max Brenner). The Group is a leading player in most of the markets in which it operates. The center of the Group's activity is in Israel, where it is the second-largest company in the food and beverage market. In the first nine months of 2016 the
Group held an 11.5% share of the domestic food and beverage market (in value terms1
) compared to 11.1% at the end of 2015, and it has the highest sales turnover among Israeli food companies (according to the Company's non-GAAP sales turnover). The operation in Israel includes the activity of Strauss Israel (sale of a broad variety of refrigerated and dry food products), the coffee operation in Israel, Strauss Water's activity in Israel and Max Brenner in Israel. In addition to the operation in Israel, the Group is also active in three other major geographical regions: the operation in Brazil,
which is conducted through the Três Corações joint venture2
and mainly focuses on roast and ground (R&G) coffee in the domestic market; the operation in Europe, which mainly includes the coffee business in Russia, Ukraine
and Central and Eastern Europe as well as Obela's activity in the Netherlands via the acquisition of Florentin B.V.3; and the operation in the US and Canada, which includes Sabra's operations and part of the Max Brenner business. The Group is also active in Australia and Mexico through the company Obela; and in China and the UK through Strauss Water. The Group manages and develops its business with the aim of providing the entire public with a broad variety of top-quality branded products for different consumption opportunities. The products of the Group are generally sold through a variety of sales channels including large food chains, private stores and supermarkets, kiosks, workplaces, hotels, vending machines, etc.
1 According to StoreNext figures. StoreNext engages in the measurement of the consumer goods market in the barcoded retail market
(hereinafter: "StoreNext"). 2 Três Corações (3C) – "Três Corações Joint Venture" in Brazil – a company jointly held by the Group (50%) and by a local holding company,
São Miguel Holding e Investimentos S.A. (50%). (Data reflect Strauss Coffee's share (50%) unless expressly stated otherwise). 3 For information on the acquisition of Florentin B.V., see Note 4.4 to the Consolidated Interim Financial Statements as at September 30, 2016.

Convenience Translation from Hebrew
2
The controlling shareholders of the Company are Mr. Michael Strauss through his holdings in Strauss Holdings Ltd. (hereinafter: the "Parent Company" or "Strauss Holdings") and Ms. Ofra Strauss, who is considered as holding the shares of the Company together with him. The Financial Statements were prepared in accordance with the International Financial Reporting Standards (IFRS). CHANGES IN THE ECONOMIC ENVIRONMENT Prices of raw materials and other production inputs – The commodities markets account for a substantive component of the raw materials used in the manufacture of the Group's products. Compared to the corresponding period last year, the first nine months of 2016 were characterized by a drop in the average market prices of some of the Company's raw materials, while the average market prices of other raw materials increased compared to the corresponding period last year. On the one hand, green coffee prices dropped (except in Brazil), as did the price of raw milk (the "target price") and the prices of milk powders, tahini, hazelnuts, almonds and sesame. On the other, green coffee prices in Brazil rose (in Brazilian Reals), as did the prices of olive oil, coupled with an increase in the minimum wage and in other production inputs such as municipal taxes. In the third quarter of 2016 average green coffee prices rose overall contrary to the prevailing trend since the beginning of the year, while with regard to the rest of the raw materials the trend in the past quarter is consistent with the trend that has prevailed since the beginning of the year. Since the third quarter of 2015 the Group has lowered its prices in a number of dairy product categories such as white cheese, desserts, milk beverages and enriched milk, by 3%-7%, and in the beginning of 2016 the Company made a further significant reduction in prices – particularly those of enriched milk and Activia yogurt – of 5%-20%. In June 2016 the Company lowered the prices of fruit yogurt products by approximately 22%, followed by a 12% reduction in the price of hummus 400g implemented in the third quarter. The Group is taking steps to reduce the impacts of commodity price volatility, including hedging, making changes in the raw materials mix in its products and operational efficiency enhancement. The cost of raw materials to the Company (including green coffee) in the Group's non-GAAP reports includes profits and losses that were realized in respect of financial derivatives that served to economically hedge those commodities. Energy prices – Since the second half of 2014 oil prices have dropped dramatically. Average oil prices remained low in the nine months as well as in the three months ended on September 30, 2016, compared to the corresponding periods last year. Exchange rate fluctuations – In the first nine months of the year all average currency rates weakened versus the Shekel compared to the average rates in the corresponding period last year. This weakening led to negative translation differences in the Group's statements of income. In the third quarter of 2016 the Brazilian Real strengthened while most of the Group's other functional currencies weakened against the Shekel compared to their average exchange rates in the corresponding quarter last year, leading to immaterial positive translation differences in the Group's statements of income. In the first nine months of the year some of the Group's functional currencies, such as the Brazilian Real and the Russian Ruble, were significantly revalued against the Shekel compared to their exchange rate in the beginning of the year, leading to an increase in the Group's shareholders' equity. For an analysis of the foreign currency effect on the Group's sales, see the section on the analysis of financial results below.
Convenience Translation from Hebrew
3
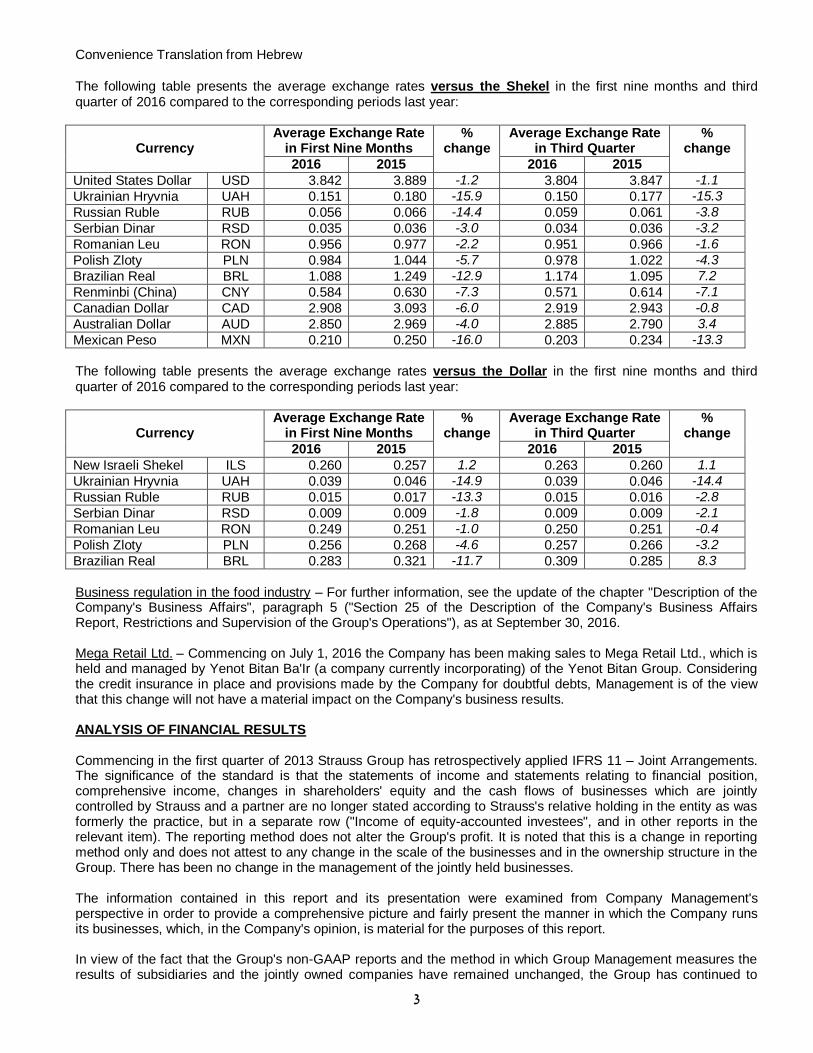
The following table presents the average exchange rates versus the Shekel in the first nine months and third quarter of 2016 compared to the corresponding periods last year:
Currency
Average Exchange Rate in First Nine Months
% change
Average Exchange Rate in Third Quarter
% change
2016 2015 2016 2015
United States Dollar USD 3.842 3.889 -1.2 3.804 3.847 -1.1
Ukrainian Hryvnia UAH 0.151 0.180 -15.9 0.150 0.177 -15.3
Russian Ruble RUB 0.056 0.066 -14.4 0.059 0.061 -3.8
Serbian Dinar RSD 0.035 0.036 -3.0 0.034 0.036 -3.2
Romanian Leu RON 0.956 0.977 -2.2 0.951 0.966 -1.6
Polish Zloty PLN 0.984 1.044 -5.7 0.978 1.022 -4.3
Brazilian Real BRL 1.088 1.249 -12.9 1.174 1.095 7.2
Renminbi (China) CNY 0.584 0.630 -7.3 0.571 0.614 -7.1
Canadian Dollar CAD 2.908 3.093 -6.0 2.919 2.943 -0.8
Australian Dollar AUD 2.850 2.969 -4.0 2.885 2.790 3.4
Mexican Peso MXN 0.210 0.250 -16.0 0.203 0.234 -13.3
The following table presents the average exchange rates versus the Dollar in the first nine months and third quarter of 2016 compared to the corresponding periods last year:
Currency
Average Exchange Rate in First Nine Months
% change
Average Exchange Rate in Third Quarter
% change
2016 2015 2016 2015
New Israeli Shekel ILS 0.260 0.257 1.2 0.263 0.260 1.1
Ukrainian Hryvnia UAH 0.039 0.046 -14.9 0.039 0.046 -14.4
Russian Ruble RUB 0.015 0.017 -13.3 0.015 0.016 -2.8
Serbian Dinar RSD 0.009 0.009 -1.8 0.009 0.009 -2.1
Romanian Leu RON 0.249 0.251 -1.0 0.250 0.251 -0.4
Polish Zloty PLN 0.256 0.268 -4.6 0.257 0.266 -3.2
Brazilian Real BRL 0.283 0.321 -11.7 0.309 0.285 8.3
Business regulation in the food industry – For further information, see the update of the chapter "Description of the Company's Business Affairs", paragraph 5 ("Section 25 of the Description of the Company's Business Affairs Report, Restrictions and Supervision of the Group's Operations"), as at September 30, 2016. Mega Retail Ltd. – Commencing on July 1, 2016 the Company has been making sales to Mega Retail Ltd., which is held and managed by Yenot Bitan Ba'Ir (a company currently incorporating) of the Yenot Bitan Group. Considering the credit insurance in place and provisions made by the Company for doubtful debts, Management is of the view that this change will not have a material impact on the Company's business results. ANALYSIS OF FINANCIAL RESULTS Commencing in the first quarter of 2013 Strauss Group has retrospectively applied IFRS 11 – Joint Arrangements. The significance of the standard is that the statements of income and statements relating to financial position, comprehensive income, changes in shareholders' equity and the cash flows of businesses which are jointly controlled by Strauss and a partner are no longer stated according to Strauss's relative holding in the entity as was formerly the practice, but in a separate row ("Income of equity-accounted investees", and in other reports in the relevant item). The reporting method does not alter the Group's profit. It is noted that this is a change in reporting method only and does not attest to any change in the scale of the businesses and in the ownership structure in the Group. There has been no change in the management of the jointly held businesses. The information contained in this report and its presentation were examined from Company Management's perspective in order to provide a comprehensive picture and fairly present the manner in which the Company runs its businesses, which, in the Company's opinion, is material for the purposes of this report. In view of the fact that the Group's non-GAAP reports and the method in which Group Management measures the results of subsidiaries and the jointly owned companies have remained unchanged, the Group has continued to

Convenience Translation from Hebrew
4
present the activity segments in the same manner in which they were presented before the standard was applied. The next pages present the non-GAAP reports, the GAAP reports and the various adjustments made by the Company in making the transition between the Company's GAAP reports and its non-GAAP reports.
Strauss Group has a number of jointly controlled companies: the Três Corações joint venture (in Brazil)4, Sabra Dipping Company (an investee company in North America), Strauss Frito-Lay Ltd. (the salty snack business in Israel) and PepsiCo Strauss Fresh Dips & Spreads International (the international dips and spreads company, Obela). The next pages present the non-GAAP reports, the GAAP reports and the various adjustments made by Company Management in making the transition from the Company's GAAP reports to its non-GAAP reports: Following are the condensed results of business operations (based on the Company's non-GAAP management reports) for the quarter and the nine months ended September 30, 2016 and 2015 (in NIS millions)*:
First Nine Months Third Quarter
2016 2015 % Chg 2016 2015 % Chg
Sales 5,909 5,743 2.9 2,096 1,974 6.1
Organic growth excluding foreign currency effect
7.1%
1.9%
5.8%
3.2%
Cost of sales 3,646 3,614 0.9 1,292 1,263 2.3
Gross profit – non-GAAP 2,263 2,129 6.3 804 711 13.0%
% of sales 38.3% 37.1% 38.3% 36.0%
Selling and marketing expenses 1,316 1,321 (0.3) 471 424 11.1
General and administrative expenses(1)
338 307 9.8 120 95 25.1
Operating profit – non-GAAP 609 501 21.4 213 192 11.2
% of sales 10.3% 8.7% 10.2% 9.7%
Financing expenses, net (102) (99) 3.7 (41) (35) 18.9
Income before taxes on income 507 402 25.8 172 157 9.5
Taxes on income (142) (115) 21.8 (45) (46) (2.9)
Effective tax rate 27.8% 28.7% 25.9% 29.2%
Income for the period – non-GAAP 365 287 27.4 127 111 14.4
Attributable to: The Company's shareholders
277
219 26.5
92
86
7.0
Non-controlling interests 88 68 30.3 35 25 39.8
EPS (NIS) 2.58 2.05 0.86 0.80
(1) In the first nine months and third quarter of 2016, including the Company's share of the profits of equity-
accounted investees in an immaterial amount. * Financial data were rounded to NIS millions. Percentages changes were calculated on the basis of the exact figures in NIS thousands.
4
Três Corações (3C) – "Três Corações Joint Venture" in Brazil – a company jointly held by the Group (50%) and by a local holding company,
São Miguel Holding e Investimentos S.A. (50%). (Data reflect Strauss Coffee's share (50%) unless expressly stated otherwise).

Convenience Translation from Hebrew
5
Following are the condensed results of business operations (based on non-GAAP management reports) of the major business sectors for the quarter and the nine months ended September 30, 2016 and 2015 (in NIS millions)*:
First Nine Months Third Quarter
2016 2015 % Chg 2016 2015 % Chg
Israel
Net sales 2,274 2,178 4.4 786 747 5.2
Operating profit 248 222 11.9 87 86 2.4
Coffee
Net sales 2,612 2,557 2.2 955 876 9.0
Operating profit 275 199 37.7 112 63 75.8
International Dips & Spreads
Net sales 581 565 2.8 199 201 (1.1)
Operating profit 62 52 18.2 11 29 (62.2)
Other
Net sales 442 443 (0.4) 156 150 3.8
Operating profit 24 28 (13.0) 3 14 (74.3)
Total
Net sales 5,909 5,743 2.9 2,096 1,974 6.1
Operating profit 609 501 21.4 213 192 11.2
Following are the condensed financial accounting (GAAP) statements of income for the quarter and the nine months ended September 30, 2016 and 2015 (in NIS millions)*:
First Nine Months Third Quarter
2016 2015 % Chg 2016 2015 % Chg
Sales 3,972 3,881 2.3 1,378 1,365 0.9
Cost of sales excluding impact of valuation of balance of commodity hedging transactions as at end-of-period
2,387
2,434
(1.9)
826
880
(6.0)
Valuation of balance of commodity hedging transactions as at end-of-period**
(28)
3
(1)
8
Cost of sales 2,359 2,437 (3.2) 825 888 (7.1)
Gross profit 1,613 1,444 11.7 553 477 15.9
% of sales 40.6% 37.2% 40.1% 35.0%
Selling and marketing expenses 911 892 2.1 314 285 10.2
General and administrative expenses 269 237 13.7 96 75 26.5
Total expenses 1,180 1,129 410 360
Share of profit of equity-accounted investees 154 134 15.7 51 51 1.9
Operating profit before other expenses 587 449 30.8 194 168 16.9
% of sales 14.8% 11.6% 14.1% 12.2%
Other expenses, net (43) (20) 112.6 (25) (14) 71.1
Operating profit after other expenses 544 429 27.0 169 154 11.7
Financing expenses, net (93) (78) 18.9 (37) (25) 53.4
Income before taxes on income 451 351 28.7 132 129 4.8
Taxes on income (119) (94) 27.1 (31) (39) (14.1)
Effective tax rate 26.4% 26.7% 23.6% 29.4%
Income for the period 332 257 29.3 101 90 12.4
Attributable to: The Company's shareholders
242
192
26.5
69
68
1.1
Non-controlling interests 90 65 37.6 32 22 47.9
* Financial data were rounded to NIS millions. Percentages changes were calculated on the basis of the exact figures in NIS thousands. ** Reflects mark-to-market as at end-of-period of open positions in the Group in respect of financial derivatives used to hedge commodity prices.

Convenience Translation from Hebrew
6
Following are the adjustments to the Company's non-GAAP management reports (NIS millions)*:
- Adjustments for IFRS 11 – change from the equity method in the GAAP report to the proportionate consolidation method (according to the segmental information based on the Group's management accounting (non-GAAP) and internal reports):
First Nine Months 2016 First Nine Months 2015 Third Quarter 2016 Third Quarter 2015
Equity method
Change
Propor-tionate
consoli-dation
method (formerly applied)
Equity method
Change
Propor-tionate
consoli-dation
method (formerly applied)
Equity method
Change
Propor-tionate consoli-dation
method (formerly applied)
Equity method
Change
Propor-tionate
consoli-dation
method (formerly applied)
Sales 3,972 1,937 5,909 3,881 1,862 5,743 1,378 718 2,096 1,365 609 1,974
Cost of sales excluding impact of valuation of balance of hedging transactions as at end-of-period
2,387
1,259
3,646
2,434
1,180
3,614
826
466
1,292
880
383
1,263
Valuation of balance of commodity hedging transactions as at end-of-period
(28)
-
(28)
3
-
3
(1)
-
(1)
8
-
8
Cost of sales 2,359 1,259 3,618 2,437 1,180 3,617 825 466 1,291 888 383 1,271
Gross profit 1,613 678 2,291 1,444 682 2,126 553 252 805 477 226 703
% of sales 40.6% 38.8% 37.2% 37.0% 40.1% 38.4% 35.0% 35.6%
Selling and marketing expenses 911 405 1,316 892 429 1,321 314 157 471 285 139 424
General and administrative expenses and Company's share of profit of equity-accounted investees
(1)
115
233
348
103
216
319
45
79
124
24
74
98
Operating profit before other expenses
587
40
627
449
37
486
194
16
210
168
13
181
% of sales 14.8% 10.6% 11.6% 8.5% 14.1% 10.0% 12,2% 9.2%
Other expenses, net (43) - (43) (20) - (20) (25) 1 (24) (14) - (14)
Operating profit after other expenses
544
40
584
429
37
466
169
17
186
154
13
167
Financing expenses, net (93) (9) (102) (78) (21) (99) (37) (4) (41) (25) (10) (35)
Income before taxes on income
451
31
482
351
16
367
132
13
145
129
3
132
Taxes on income (119) (31) (150) (94) (16) (110) (31) (13) (44) (39) (3) (42)
Effective tax rate 26.4% 30.9% 26.7% 30.1% 23.6% 29.6% 29.4% 31.4%
Income for the period 332 - 332 257 - 257 101 - 101 90 - 90
Attributable to: The Company's shareholders
242
-
242
192
-
192
69
-
69
68
-
68
Non-controlling interests 90 - 90 65 - 65 32 - 32 22 - 22
(1)
For further information, see the above GAAP statements of income for the quarter and the nine months ended September 30, 2016 and 2015.
* Financial data were rounded to NIS millions. Percentages changes were calculated on the basis of the exact figures in NIS thousands.

Convenience Translation from Hebrew
7
- Additional adjustments to the non-GAAP management reports (share-based payment and liability plan, valuation of hedging transactions, other expenses and taxes referring to these adjustments)*:
First Nine Months Third Quarter
2016 2015 % Chg 2016 2015 % Chg
Operating profit – according to proportionate consolidation method – after other expenses
584
466
25.2
186
167
11.5
Share-based payment and liability plan 10 12 4 3
Valuation of balance of commodity hedging transactions as at end-of-period
(28)
3
(1)
8
Other expenses, net 43 20 24 14
Operating profit – non-GAAP 609 501 21.4 213 192 11.2
Financing expenses, net (102) (99) (41) (35)
Taxes on income (150) (110) (44) (42)
Taxes in respect of adjustments to the above non-GAAP operating profit
8
(5)
(1)
(4)
Income for the period – non-GAAP 365 287 27.4 127 111 14.4
Attributable to: The Company's shareholders
277
219
26.5
92
86
7.0
Non-controlling interests 88 68 30.3 35 25 39.8
* Financial data were rounded to NIS millions. Percentages changes were calculated on the basis of the exact figures in NIS thousands. ANALYSIS OF THE BUSINESS RESULTS OF THE GROUP Sales – non-GAAP
First Nine Months Third Quarter
2016 2015 2016 2015
Sales 5,909 5,743 2,096 1,974
Growth 2.9% (5.2%) 6.1% (7.6%)
Organic growth excluding foreign currency effect
7.1%
1.9%
5.8%
3.2%
Organic growth of the Group's sales in the first nine months and third quarter of 2016, excluding the foreign currency effect, amounted to 7.1% and 5.8%, respectively, compared to the corresponding periods last year. Following are the components of the change in sales in these periods in local currency and the rates of increase according to the Company's major activity sectors in local currency, together with the overall impact of translation differences (the "translation differences effect") and inorganic growth (M&A) in particular:

Convenience Translation from Hebrew
8
(*) The translation differences effect is calculated according to the average exchange rates in the relevant period.
The Group's sales in the first nine months of 2016, and particularly sales by Strauss Coffee, were impacted by negative translation differences, which amounted to approximately NIS 218 million, of which NIS 130 million are due to the erosion of the average exchange rate of the Brazilian Real against the Shekel compared to the corresponding period last year (see also the foreign exchange rate table in the section "Changes in the Economic Environment). In the third quarter of the year sales on the level of the Group were influenced by positive translation differences, which amounted to NIS 4 million. The change in the Group's sales in local currency was the result of the following factors:
Organic growth in sales by the coffee business, excluding green coffee (in the first nine months and third quarter, an increase of approximately NIS 260 million and NIS 71 million, respectively), mainly reflected volume growth along with price increases implemented in most countries of operations (in Israel prices were not raised, and the prices of some products were even reduced) in light of the rising cost of green coffee and the erosion of the local currencies versus the US Dollar compared to the corresponding periods last year. The US Dollar is the currency in which green coffee is purchased in all countries (except for Brazil).
Growth in Strauss Israel's sales (in the first nine months and third quarter, an increase of approximately NIS 96 million and NIS 39 million, respectively) mainly reflects volume growth mostly as a result of innovation, which was partly offset by price reductions in the various categories, particularly dairy products.
Organic growth in sales by the International Dips & Spreads operation (in the first nine months, an increase of approximately NIS 22 million, as opposed to a decrease of NIS 2 million in the third quarter). Sales growth in the cumulative period mainly reflects growth in hummus sales with an increase in value market share since the end of the fourth quarter of 2015, up from 60.7% to 62.3% (approximately 60.2% in the corresponding period last year).
Organic growth in sales by the "Other Operations" segment (in the first nine months and third quarter, approximately NIS 16 million and NIS 8 million, respectively), mainly as a result of growth in Strauss Water's business in Israel, and conversely, a decrease in sales by Max Brenner.
Green coffee export sales by the Três Corações joint venture in Brazil(1)(2)
, reflecting Strauss Coffee's share (50%), decreased in the first nine months of the year by approximately NIS 2 million compared to the corresponding period last year. The decrease reflects a significant drop in volumes in the first quarter of 2016, which was partly set off by an increase in green coffee prices. In the third quarter of the year green coffee export sales from Brazil rose by approximately NIS 1 million compared to the corresponding quarter of 2015 following the increase in green coffee prices, which was set off in part by the drop in sales volumes.
(1) As part of its operations in Brazil, the Três Corações joint venture exports green coffee, mainly to Europe and the US. The amount of
green coffee sales is presented further on this report in the framework of sales by the coffee segment according to geographical regions. 2)
Três Corações (3C) – "Três Corações Joint Venture" in Brazil – a company jointly held by the Group (50%) and by a local holding
company, São Miguel Holding e Investimentos S.A. (50%). (Data reflect Strauss Coffee's share (50%) unless expressly stated otherwise).

Convenience Translation from Hebrew
9
Inorganic decrease in the Group's sales (in the first nine months, down by approximately NIS 8 million, and third quarter, up by NIS 1 million). The decrease in the nine months mainly reflects the discontinuation of proportionate consolidation and the change to the equity method in the Haier Strauss Water joint venture in China as a result of the restructuring process, as well as inorganic sales decrease following the closing of Max Brenner locations owned by the Company; these were offset in part by sales arising from the acquisition of the coffee businesses of Itamaraty and Cia Iguaçu by the Três Corações joint venture in Brazil.
Further explanations on the Group's sales are included in the chapter "Analysis of the Business Results of the Group's Major Business Units". Gross Profit – Non-GAAP
First Nine Months Third Quarter
2016 2015 % Chg % chg less translation differences
impact
2016 2015 % Chg % chg less translation differences
impact
Gross profit 2,263 2,129 6.3 9.6 804 711 13.0 12.6
Gross profit margin 38.3% 37.1% 38.3% 36.0% The Group's non-GAAP gross profit in the first nine months of 2016 was negatively influenced by translation differences into Shekels, which amounted to approximately NIS 63 million. Most of the translation differences originated in Strauss Coffee following the weakening of the Brazilian Real and the Russian Ruble against the Shekel (approximately NIS 51 million in the nine months). Following the strengthening of some of the Group's functional currencies in the third quarter, the gross profit was positively impacted (by approximately NIS 2 million) compared to the corresponding quarter last year (see also the table of exchange rates in the chapter "Changes in the Economic Environment"). The Group's non-GAAP gross profit in the first nine months and third quarter of the year rose by approximately NIS 134 million and NIS 93 million, respectively, compared to the corresponding periods last year:
In the Strauss Israel segment the gross profit rose by approximately NIS 74 million and NIS 30 million in the first nine months and third quarter, respectively, compared to the corresponding periods last year. The increase in the gross profit is due to sales growth and reflects the favorable effect of the launch of new products, efficiency enhancing moves applied in production and packaging processes in a number of manufacturing sites, a drop in energy prices and a decrease in the prices of some raw materials (particularly raw milk), which was accompanied by a reduction in the retail prices of some of the Company's products.
The aggregate gross profit of the International Dips & Spreads and Other Operations segments grew approximately NIS 13 million in the first nine months and dropped NIS 3 million in the third quarter, compared to the corresponding periods last year. The growth in the gross profit in the cumulative period mainly reflects sales growth, efficiency enhancing processes and a decrease in the prices of commodities used in these segments.
In Strauss Coffee the gross profit increased by approximately NIS 47 million and NIS 66 million in the first nine months and the third quarter, respectively, compared to the corresponding periods last year. The change in the gross profit margin in the first nine months and third quarter is explained by sales growth, mainly as a result of price increases introduced in some of the countries where the Company is active (in Israel prices were not raised, and the prices of some products were even reduced), a change in the product mix sold in some countries of operations (Brazil, Israel, Romania and Poland) and a reduction in customs duties on the import of green coffee to Romania, which lowered the cost of raw materials and allowed for a reduction in prices. Additionally, in the third quarter the aggregate gross profit of the CEE countries increased, among other things as a result of a drop in raw material prices, the decreasing volatility of the Russian Ruble and a change in the product mix. The cost of raw materials to the Company (including green coffee) in the Group's non-GAAP reports includes profits and losses that were realized in respect of financial derivatives used to economically hedge those commodities.
Further explanations on the Group's gross profit are included in the chapter "Analysis of the Business Results of the Group's Major Business Units".

Convenience Translation from Hebrew
11
Operating Profit before Other Expenses – Non-GAAP
First Nine Months Third Quarter
2016 2015 % Chg % chg less translation differences
impact
2016 2015 % Chg % chg less translation differences
impact
Operating profit (EBIT) 609 501 21.4 25.0 213 192 11.2 10.9
Operating profit margin 10.3% 8.7% 10.2% 9.7% The Group's non-GAAP operating profit (EBIT) in the first nine months of 2016 was adversely influenced by translation differences into Shekels, which amounted to approximately NIS 14 million. Most of the translation differences originated in Strauss Coffee following the weakening of the Brazilian Real and Russian Ruble against the Shekel (approximately NIS 15 million). In the third quarter translation differences added NIS 1 million to EBIT (see also the table of exchange rates in the chapter "Changes in the Economic Environment"). In the first nine months and third quarter of 2016 the non-GAAP operating profit grew by approximately NIS 108 million and NIS 21 million, respectively. Following are the components of the change in the operating profit compared to the corresponding periods last year, according to the Company's major activity segments:
The change in the Group's EBIT in the first nine months and third quarter of 2016 was the result of the following:
An increase of approximately NIS 76 million and NIS 49 million in the operating profit of the coffee business in the first nine months and third quarter, respectively, compared to the corresponding periods last year. The change in Strauss Coffee's operating profit reflects:
An increase in the operating profit of the coffee business in the CEE countries in the first nine months and third quarter of the year, explained by sales growth, mainly as a result of price increases introduced in some of the countries where the Company is active (in Israel prices were not raised, and the prices of some products were even reduced), a change in the product mix sold in some countries of operations (Brazil, Israel, Romania and Poland) and a reduction in customs duties on the import of green coffee to Romania, which lowered the cost of raw materials and allowed for a reduction in prices. Additionally, in the third quarter the aggregate gross profit of the CEE countries increased, among other things as a result of a drop in raw material prices, the decreasing volatility of the Russian Ruble and a change in the product mix.
Convenience Translation from Hebrew
11
Growth in the operating profit of Israel Coffee in the first nine months and third quarter of the year, mainly as a result of sales growth and an improvement in the product mix sold, compared to the corresponding periods in 2015.
The increase in the operating profit of the Três Corações joint venture in Brazil(1)
in the first nine months and third quarter of 2016 is the result of an increase in volumes and prices, despite negative translation differences, and an improvement in the product mix sold. Três Corações' operating profit (before other expenses) in Brazilian Reals rose in the first nine months by 18.9%, and in the third quarter – by 72.2% (see the financial statements of Três Corações Alimentos S.A., which are attached to the financial statements of the Group).
An increase of approximately NIS 26 million and NIS 1 million in the operating profit of Strauss Israel in the nine months and in the third quarter, respectively, compared to the corresponding periods last year. The growth in EBIT mainly reflects an increase in sales, which was reflected in volume growth and was partly offset by price reductions in the various categories, as well as an increase in the gross profit reflecting operational efficiency enhancement and the favorable effect of a drop in the prices of some raw materials as described above.
The operating profit of the International Dips & Spreads business increased by approximately NIS 10 million in the first nine months of 2016 versus a drop of NIS 18 million in the third quarter, compared to the corresponding periods last year. Growth in the cumulative period is the result of sales growth and operational efficiency enhancement. In addition, Sabra's results include an insurance payout as a result of the product recall, which amounted to approximately NIS 10 million in the first quarter of 2016 (approximately NIS 5 million reflect the Group's share (50%)). The drop in EBIT in the third quarter was the result of the sales mix and increased marketing effort.
A decrease in the EBIT of the Other Operations segment – approximately NIS 4 million and NIS 11 million in the first nine months and third quarter, respectively, compared to last year. The decrease in the operating profit is the result of a one-time increase in expenses compared to the corresponding period last year, and a decrease in the profits of Max Brenner following a drop in sales.
Financing Expenses, Net – Non-GAAP Net financing expenses in the first nine months of 2016 totaled NIS 102 million compared to expenses of NIS 99 million in the corresponding period last year. Net financing expenses in the third quarter of the year amounted to NIS 41 million compared to expenses of NIS 35 million in the corresponding quarter of 2015. Most of the increase in financing expenses in the third quarter is due to valuation differences of a financial instrument and to expenses in respect of exchange differences and the valuation of foreign exchange derivatives in the current quarter following the weakening of the US Dollar, as opposed to income in the corresponding quarter last year as a result of the strengthening of the Dollar, which was set off against the impact of a 0.3% increase in the (known) CPI, in which a substantive portion of the Company's debt is denominated, compared to an increase of 0.4% in the corresponding quarter in 2015; coupled with a decrease in the Index-linked debt and the expenses of the valuation of Index derivatives in the corresponding quarter in light of decreasing inflation expectations. Net credit (according to the proportionate consolidation method) as at September 30, 2016 totaled NIS 1,640 million compared to NIS 1,655 million on December 31, 2015. Net credit (according to the equity method) as at September 30, 2016 totaled NIS 1,360 million compared to NIS 1,516 million on December 31, 2015. Taxes on Income – Non-GAAP In the first nine months of 2016 taxes on income (non-GAAP) amounted to NIS 142 million, reflecting an effective tax rate of 27.8%, whereas in the corresponding period last year income tax amounted to NIS 115 million and the effective tax rate was 28.7%. In the third quarter taxes on income (non-GAAP) amounted to NIS 45 million, reflecting an effective tax rate of 25.9%, versus NIS 46 million in the corresponding quarter last year with an effective tax rate of 29.2%. (1)
Três Corações (3C) – "Três Corações Joint Venture" in Brazil – a company jointly held by the Group (50%) and by a local holding
company, São Miguel Holding e Investimentos S.A. (50%). (Data reflect Strauss Coffee's share (50%) unless expressly stated otherwise).

Convenience Translation from Hebrew
12
The decrease in the effective tax rate in the first nine months and third quarter of 2016 is the result of the profit mix for tax purposes between the companies in the various countries and the decrease in the corporate tax rate in Israel from 26.5% to 25%, and was partly offset by an increase in the weight of non-deductible tax expenses. Income for the Period Attributable to the Company's Shareholders – Non-GAAP
First Nine Months Third Quarter
2016 2015 % Chg 2016 2015 % Chg
Income attributable to the Company's shareholders
277
219
26.5
92
86
7.0
% of sales 4.7% 3.8% 4.4% 4.4% Non-GAAP income attributable to the Company's shareholders in the first nine months and third quarter of 2016 rose by approximately NIS 58 million and NIS 6 million, respectively, compared to the corresponding periods last year. The increase in non-GAAP income attributable to the Company's shareholders is mainly due to growth in the operating profit. Comprehensive Income (Loss) for the Period (according to the GAAP report) In the first nine months of the year the GAAP comprehensive income amounted to approximately NIS 422 million, compared to a comprehensive loss of NIS 30 million in the corresponding period last year. In the reporting period income in respect of translation differences, which are the main component of the other comprehensive income, amounted to NIS 89 million compared to losses of NIS 292 million arising from translation differences in the corresponding period last year. In the third quarter the GAAP comprehensive income amounted to approximately NIS 67 million, compared to a comprehensive loss of NIS 2 million in the corresponding quarter last year. In the reporting period losses in respect of translation differences, which are the main component of the other comprehensive income, amounted to NIS 35 million compared to losses of NIS 93 million arising from translation differences in the corresponding period last year. The gains from translation differences in the first nine months of 2016 primarily arise from the operations of Strauss Coffee; of the above amounts, approximately NIS 88 million are due to the strengthening of the Brazilian Real against the Shekel compared to their exchange rate at the end of 2015. In the third quarter of the year, the losses from translation differences were also primarily the result of Strauss Coffee's operations; of them, approximately NIS 15 million are due to the weakening of the Brazilian Real against the Shekel compared to their exchange rate at the end of the second quarter of 2016. LIQUIDITY, SOURCES OF FINANCE AND FINANCIAL POSITION (ACCORDING TO THE GAAP REPORT)
In the first nine months of 2016 Cash flows used in operating activities amounted to a positive cash flow of approximately NIS 310 million, compared to a positive cash flow of NIS 14 million in the corresponding period last year. The change in cash flows is due to an increase in income for the period and to changes in working capital compared to the corresponding period last year. On the other hand, in December 2015 the Company received a rebate from the Assessing Officer in respect of advance tax in the amount of approximately NIS 96 million. Of this amount, the sum of NIS 53 million was refunded to the Assessing Officer in January 2016. Cash flows used in investing activities amounted to a positive cash flow of approximately NIS 58 million compared to a negative cash flow of NIS 52 million in the corresponding period last year. The change is mainly due to dividends received from investee companies and is offset by investments in fixed assets on a smaller scale compared to the corresponding period and by the sale of securities and deposits on a smaller scale in the reporting period compared to the corresponding period in 2015. Cash flows used in financing activities amounted to a negative cash flow of approximately NIS 357 million compared to a negative cash flow of NIS 246 million last year. The change is mainly due to the payment of a dividend of NIS 150 million to shareholders and a dividend of NIS 42 million to the non-controlling interest, less loans amounting to NIS 115 million taken in the current period.
Convenience Translation from Hebrew
13
In the third quarter of 2016 Cash flows used in operating activities amounted to a positive cash flow of approximately NIS 131 million, compared to a positive cash flow of NIS 23 million in the corresponding period last year. The change in cash flows is due to an increase in income for the period and changes in working capital. Cash flows provided by (used in) investing activities amounted to a positive cash flow of approximately NIS 97 million compared to a negative cash flow of NIS 25 million last year. The change is mainly due to dividends received from investee companies and is offset by investments in fixed assets on a smaller scale compared to the corresponding period last year. Cash flows used in financing activities amounted to a negative cash flow of approximately NIS 212 million compared to a negative cash flow of NIS 47 million last year. The change is mainly due to the payment of a dividend of NIS 150 million to the shareholders of the Company. The change in working capital (according to the proportionate consolidation method) in the first nine months of 2016 and 2015 reflects an increase of NIS 246 million and NIS 236 million compared to December 31, 2015 and 2014, respectively. The change in working capital (according to the proportionate consolidation method) in the third quarter of 2016 and 2015 reflects an increase of NIS 91 million and NIS 66 million compared to June 30, 2016 and 2015, respectively. The change in working capital (according to the equity method) in the first nine months of 2016 and 2015 reflects an increase of NIS 87 million and NIS 235 million compared to December 31, 2015 and 2014, respectively. The change in working capital (according to the equity method) in the third quarter of 2016 and 2015 reflects an increase of NIS 33 million and NIS 88 million compared to June 30, 2016 and 2015, respectively. The Company’s cash and cash equivalents as at September 30, 2016 totaled NIS 564 million compared to NIS 560 million on December 31, 2015. In accordance with Company policy, these assets are held mainly in deposits (most of them in Shekels and Dollars). The Company’s liquidity ratio as at September 30, 2016 is 1.41 compared to 1.39 on December 31, 2015. On September 30, 2016 liabilities in respect of long-term loans and credit (including current maturities) amounted to NIS 1,948 million compared to NIS 2,096 million on December 31, 2015. On September 30, 2016 short-term credit (excluding current maturities) totaled NIS 30 million compared to NIS 40 million on December 31, 2015. On September 30, 2016 supplier credit totaled NIS 672 million, compared to NIS 713 million on December 31, 2015. Total assets in the Company's Consolidated Statement of Financial Position on September 30, 2016 amounted to NIS 6,204 million, compared to NIS 6,147 million on December 31, 2015. Reportable credit – further to Note 20.6 to the Periodic Report – Financial Criteria – the ratio of equity attributable to the Company's shareholders to total assets in the Company's Consolidated Statement of Financial Position as at September 30, 2016 is 30.1%, compared to 27.7% on December 31, 2015. The net financial debt-to-EBITDA ratio as at September 30, 2016 is 1.4, compared to 1.9 on December 31, 2015. The Company is in compliance with the required financial criteria. On July 7, 2016 the Board of Directors of the Company approved the distribution of a cash dividend to the shareholders of the Company, and on July 26, 2016 payment to the shareholders was effectuated. For information on dividend distributions, see the update of the chapter "Description of the Company's Business Affairs" as at September 30, 2016. Customer credit – from time to time, the Company executes non-recourse factoring transactions in accounts receivable, as well as reverse factoring transactions in supplier credit. In April 2016 the Company announced the reaffirmation of Midroog's Aa2 rating for the Company's outstanding Series B and Series D Debentures, with stable outlook. In April 2016 the Company announced the reaffirmation of Standard & Poor's Maalot's ilAA+ rating with a revision of the rating outlook from stable to negative. After IFRS 11 took effect on January 1, 2013 the Company elected to include a number of relevant data that correspond to the GAAP reporting method that was in practice prior thereto. The data below are in the

Convenience Translation from Hebrew
14
proportionate consolidation method (as reported by the Company up to and including 2012). The Company reserves the right not to include this information in the future. First Nine
Months Third Quarter Year Ended
December 31
2016 2015 2016 2015 2015
Cash flow from operating activities (proportionate consolidation method)
402
90
132
60
516
Acquisition of fixed assets and investment in intangibles (proportionate consolidation method)
163
211
50
54
279
Net debt balance (proportionate consolidation method) as at the reporting date
1,640
1,813
1,640
1,813
1,655
Depreciation and amortization (excluding impairment, which is included in the other expenses item):
172
170
60
54
232
Strauss Israel:
Health & Wellness 43 38 14 14 54
Fun & Indulgence 27 22 9 8 32
Strauss Coffee:
Israel Coffee 8 8 2 3 10
International Coffee 38 47 13 13 57
International Dips & Spreads 20 17 9 5 23
Other 36 38 13 11 56 The Group's EBITDA (non-GAAP) totaled approximately NIS 781 million in first nine months of the year compared to NIS 671 million in the corresponding period in 2015, an increase of 16.3%. Non-GAAP EBITDA in the third quarter amounted to NIS 273 million compared to NIS 246 million last year, an increase of 11.0%. ANALYSIS OF THE BUSINESS RESULTS OF THE GROUP'S MAJOR BUSINESS UNITS Strauss Coffee Following are the condensed results of business operations based on the non-GAAP management reports of Strauss Coffee by reported segments for the quarter and the nine months ended September 30, 2016 and 2015 (in NIS millions):
First Nine Months Third Quarter
2016 2015 % Chg 2016 2015 % Chg
Israel Coffee
Net sales 526 494 6.6 179 161 11.4
Operating profit 79 64 22.1 27 18 47.9
% operating profit 14.9% 13.0% 14.7% 11.1%
International Coffee
Net sales 2,086 2,063 1.1 776 715 8.5
Operating profit 196 135 45.1 85 45 86.7
% operating profit 9.4% 6.5% 10.9% 6.4%
Total Strauss Coffee
Net sales 2,612 2,557 2.2 955 876 9.0
Organic growth excluding foreign currency effect
11.0%
8.4%
8.0%
9.7%
Gross profit 862 815 5.7 322 256 25.7
% gross profit 33.0% 31.9% 33.7% 29.2%
Operating profit 275 (1)
199 37.7 112 63 75.8
% operating profit 10.5% 7.8% 11.6% 7.2%
(1) The operating profit of the coffee business in the first nine months of 2015 includes a provision for impairment of
intangible assets attributed to the operation in Serbia in the amount of NIS 8 million.

Convenience Translation from Hebrew
15
Sales In the first nine months and third quarter of 2016 organic growth in the coffee business, excluding the foreign currency effect, amounted to 11.0% and 8.0%, respectively, compared to the corresponding periods last year. Organic growth of the coffee operation, excluding the foreign currency effect and green coffee exports, amounted to 11.4% and 8.2%, respectively, compared to the corresponding periods in 2015. Growth in coffee sales in local currency in the first nine months and third quarter mainly reflects volume growth as well as price increases implemented in most countries (in Israel prices were not raised, and the prices of some products were even reduced), in light of the rising cost of green coffee to the Company and the erosion of the functional currencies versus the US Dollar compared to the corresponding periods last year, since in all countries except for Brazil, green coffee is purchased in US Dollars. For further information, see the section "Strauss Coffee Sales by Major Geographical Regions". In the first nine months of 2016 and in the third quarter of the year Strauss Coffee's Shekel sales increased by approximately NIS 55 million and NIS 79 million, respectively, compared to the corresponding periods last year. Translation differences into Shekels in the first nine months of the year had a negative impact on sales by the coffee operation and amounted to NIS 207 million, compared to a positive impact in the third quarter, amounting to NIS 7 million; of said amounts, the negative impact of the change in the average exchange rate of the Brazilian Real against the Shekel amounted to NIS 130 million in the cumulative period, as opposed to a positive impact of NIS 25 million in the third quarter. Additionally, the erosion of exchange rates in Russia and Ukraine against the Shekel led to negative translation differences amounting to NIS 58 million and NIS 12 million in the nine months and the quarter, respectively, compared to the corresponding periods in 2015. Further explanations on sales by the coffee operation in the reporting period are included in the section "Strauss Coffee Sales by Major Geographical Regions". Gross profit In the first nine months of 2016 the gross profit rose by approximately NIS 47 million compared to the corresponding period last year. The gross profit margin rose by 1.1% and amounted to 33.0%. In the third quarter of the year the gross profit increased by approximately NIS 66 million compared to the corresponding quarter in 2015. The gross profit margin rose by 4.5% and amounted to 33.7%. The change in the gross profit margin in the first nine months and third quarter is explained by growth in sales volumes, price increases implemented in almost all countries where the Company is active (in Israel, the prices of some products were reduced), an improvement in the product mix sold in part of the Company's countries of operations (Brazil, Israel, Romania and Poland) ) and a reduction in customs duties on the import of green coffee to Romania, which lowered the cost of raw materials and allowed for a reduction in prices. Additionally, in the third quarter the aggregate gross profit of the CEE countries increased, among other things as a result of a drop in raw material prices, the decreasing volatility of the Russian Ruble and a change in the product mix. The cost of raw materials to the Company (including green coffee) in the Group's non-GAAP reports includes profits and losses that were realized in respect of financial derivatives that served to economically hedge those commodities. Operating profit In the first nine months and third quarter of 2016 the operating profit of the coffee operation increased by approximately NIS 76 million and NIS 49 million, respectively, compared to the corresponding periods last year. The operating profit margin in the nine months and the quarter amounted to 10.5% and 11.6%, respectively, compared to last year. The change in Strauss Coffee's EBIT in the nine months and in the quarter reflects:
An increase in the operating profit of the coffee business in the CEE countries in the first nine months and third quarter of the year, mainly as a result of an improvement in the product mix sold in Poland and Romania, compared to the corresponding periods last year, and a reduction in customs duties on the import of green coffee to Romania, which lowered the cost of raw materials and allowed for a reduction in prices.
The operating profit and operating profit margin in Russia rose in the third quarter compared to the corresponding period last year despite the drop in sales as a result of the decreasing volatility of the Russian Ruble and a drop in raw material prices.

Convenience Translation from Hebrew
16
Growth in the operating profit of Israel Coffee in the first nine months and third quarter, mainly as a result of sales growth and an improvement in the instant coffee supply chain in Israel, compared to the corresponding periods in 2015.
The increase in the operating profit of the Três Corações joint venture in Brazil(1)
in the first nine months and third quarter of 2016, which is the result of an increase in prices. Três Corações' operating profit (before other expenses) in Brazilian Reals rose in the first nine months by approximately 18.9%, and in the third quarter – by 72.2% (see the financial statements of Três Corações Alimentos S.A., which are attached to the financial statements of the Group).
Strauss Coffee sales by major geographical regions Following is the scope of sales of the coffee business in the major geographical regions (not including intercompany sales), and growth rates for the quarter and the nine months ended September 30, 2016 and 2015 (in NIS millions):
First Nine Months Third Quarter
Geographical region
2016
2015
% chg
% change in local
currency*
2016
2015
% chg
% change in local
currency*
Israel Coffee 526 494 6.6 6.6 979 161 11.4 11.4
International Coffee
Três Corações joint venture (Brazil)
(1) (2) (3) - 50%
1,188
1,128
5.4
19.2
461
355
30.1
21.6
Former USSR countries 409 414 (1.2) 14.7 147 174 (15.3) (9.1)
Poland 205 211 (3.0) 2.9 70 73 (4.2) 0.1
Romania 188 196 (4.2) (2.3) 60 72 (17.2) (15.8)
Serbia 96 114 (16.2) (13.6) 38 41 (10.1) (7.1)
Total International Coffee 2,086 2,063 1.1 12.4 776 715 8.5 7.4
Total Coffee 2,612 2,557 2.2 11.2 955 876 9.0 8.1 * The growth rate in local currency neutralizes the effect of changes in foreign exchange rates in the different countries
versus the Shekel on the growth in the countries' sales.
(1) Três Corações (3C) – "Três Corações Joint Venture" in Brazil – a company jointly held by the Group (50%) and by a local holding company, São Miguel Holding e Investimentos S.A. (50%). (Data reflect Strauss Coffee's share (50%) unless expressly stated otherwise).
(2) Sales by the Três Corações joint venture (Brazil) include:
First Nine Months
Third Quarter
2016 2015 2016 2015
Green coffee sales 67 78 32 29
Sales of corn-based products 53 46 21 14
(3) The Três Corações joint venture (Brazil) – Excluding intercompany sales between Três Corações Alimentos S.A. and Strauss Coffee.
The Três Corações (3C) joint venture (Brazil) – A company jointly held by the Group (50%) and the São Miguel Group (50%); (Data reflect Strauss Coffee's share (50%)) In March 2016 Três Corações acquired the operation attributed to the retail coffee brands of the coffee company Cia Iguaçu. The agreement between the companies includes the acquisition of the retail coffee brands (Iguaçu, Cruzeiro, Amigo), as well as accompanying Cia Iguaçu products, in South America, including Brazil. In July, the agreement was approved by the regulatory authorities in Brazil. In the first nine months of 2016 the Três Corações joint venture's average value market share in roast and ground coffee (R&G) amounted to approximately 24.2%, compared to 24.1% in the corresponding period last year (value market share reflecting 100% of the Três Corações joint venture's sales according to A.C. Nielsen figures). Despite the economic and political crisis in Brazil, in the first nine months and third quarter of 2016 the Três Corações joint venture's sales in local currency grew by approximately 19.2% and 21.6% (18.9% and 21.6%, respectively, before the exclusion of intercompany sales between Três Corações Alimentos S.A. and Strauss

Convenience Translation from Hebrew
17
Coffee). Excluding green coffee sales, growth in local currency amounted to 20.8% and 23.2% in the nine months and the quarter, respectively. Most of the growth originates in R&G sales. The increase in the Três Corações joint venture's local currency sales reflects price increases introduced in 2015 and 2016 in light of the rising cost of green coffee to Três Corações compared to the corresponding periods last year, as well as volume growth in sales. Green coffee export sales from Brazil by the Três Corações joint venture
(1), reflecting Strauss Coffee's share
(50%), decreased in the first nine months of 2016 by approximately NIS 11 million compared to the corresponding period last year (excluding the foreign exchange effect, sales decreased by NIS 2 million). The decrease in the nine months reflects a drop in volumes, which was offset in part by an increase in green coffee prices compared to the corresponding period last year. In the third quarter green coffee export sales from Brazil by Três Corações rose by approximately NIS 3 million compared to the corresponding quarter last year (excluding the foreign currency effect, export sales increased by approximately NIS 1 million). Growth in the Três Corações joint venture's Shekel sales in the first nine months and third quarter of 2016 compared to the corresponding periods last year was adversely affected by the erosion of the average exchange rate of the Brazilian Real against the Shekel, which amounted to approximately NIS 130 million in the first nine months, as opposed to a positive effect amounting to approximately NIS 25 million in the third quarter. The Três Corações joint venture's gross profit in domestic currency rose by 8.8% and 19.8% in the first nine months and third quarter, respectively, and amounted to approximately 295 million and 111 million BRL, respectively. In the first nine months and third quarter the Três Corações joint venture's gross profit margin decreased by 2.5% and 0.4% and amounted to 27.1% and 28.2%, respectively. The decrease in the gross profit margin primarily reflects the rising cost of green coffee to the Três Corações joint venture, which was offset in part by price increases. EBIT (before other expenses) in BRL increased in the first nine months by 18.9% and reflects an increase in the gross profit margin as a result of volume growth. In the third quarter EBIT (before other expenses) in BRL rose by 72.2% and mainly reflects sales growth (see the financial statements of Três Corações Alimentos S.A., which are attached to the financial statements of the Group). The overall impact of the TRES solution on the Três Corações joint venture's operating profit in the first nine months and third quarter of the year amounted to an operating loss of approximately NIS 11 million and NIS 1 million, respectively (approximately 10 million and 1 million BRL, respectively), compared to an operating loss of NIS 12 million and NIS 0.6 million, respectively (9 million and 0.5 million BRL, respectively) in the corresponding periods last year (figures reflect Strauss Coffee's share (50%)). The former USSR countries Following the political crisis in Russia and Ukraine and the complexity of Russia's relations with the West and as a result of the drop in oil prices, the Russian and Ukrainian currencies devalued significantly against the major currencies at the beginning of the year, including the US Dollar (which adversely impacted the cost of sales in the region) and the Shekel (causing negative translation differences). Additionally, the competitive environment in the region has remained challenging. The Company's sales in the region in local currency grew by approximately 14.7% in the first nine months, as opposed to a decrease of approximately 9.1% in the third quarter, compared to the corresponding periods last year. The Company's sales in local currency mainly reflect price increases introduced in light of the devaluation of the Russian and Ukrainian currencies against the US Dollar, as mentioned. The Company's Shekel sales in the region dropped by approximately NIS 5 million and NIS 27 million in the first nine months and in the third quarter, respectively, compared to the corresponding periods last year, and were affected by negative translation differences against the Shekel, which were partly offset by the increase in sales prices in local currency and by volume growth in Ukraine. Poland The Company's sales in Poland in local currency increased by approximately 2.9% and 0.1% in the first nine months and third quarter of 2016, respectively, compared to the corresponding periods last year. The growth in sales is the result of an improvement in the sales mix compared to the corresponding periods in 2015. The Company's Shekel sales in Poland decreased by approximately NIS 6 million and NIS 3 million in the first nine months and the third quarter, respectively, compared to the corresponding periods last year. The decrease is due to the erosion of the Polish Zloty against the Shekel.
Convenience Translation from Hebrew
18
(1) Três Corações (3C) – "Três Corações Joint Venture" in Brazil – a company jointly held by the Group (50%) and by a local holding
company, São Miguel Holding e Investimentos S.A. (50%). (Data reflect Strauss Coffee's share (50%) unless expressly stated otherwise).
Romania The Company's sales in Romania in local currency decreased by approximately 2.3% and 15.8% in the first nine months and the third quarter of 2016, respectively, compared to the corresponding periods last year. The drop in sales in local currency reflects a drop in volumes and is primarily due to a reduction in customs duties on the import of green coffee, which lowered the cost of raw materials and allowed for a reduction in prices.
Shekel sales in Romania decreased by approximately NIS 8 million and NIS 12 million in the nine months and in the quarter, respectively, compared to the corresponding periods in 2015, and were affected by negative translation differences due to the erosion of the Romanian Leu against the Shekel and the drop in prices, as described above. Serbia
The Company's sales in Serbia in local currency decreased by 13.6% and 7.1% in the first nine months and third quarter of the year, respectively, compared to the corresponding periods last year. Sales were influenced by a drop in volumes reflecting a consumer trend of preferring cheaper coffee brands and by price erosion due to the harshening competitive environment. The Company's Shekel sales in Serbia dropped by approximately NIS 18 million and NIS 4 million in the nine months and in the quarter, respectively, compared to the corresponding periods last year, and were affected by negative translation differences as a result of the erosion of the Serbian Dinar against the Shekel and the consumer trend of preferring cheaper coffee brands as well as price erosion in light of the harshening competitive environment, as mentioned. In light of the increase in green coffee prices and the anticipated erosion of profit margins, the Group examined the recoverable amount of the unit as at September 30, 2016, which reflects value in use. Consequently, the Group recorded an intangible asset impairment loss of NIS 9 million, which was recognized in the "other expenses" item in the Group's non-GAAP statements of income. For further information, see Note 4.6 to the Consolidated Interim Financial Statements as at September 30, 2016. Israel The Company's sales in Israel rose by approximately NIS 32 million and NIS 18 million in the first nine months and third quarter, respectively, compared to the corresponding periods last year. The increase is explained by growth in volumes due to the timing of the Jewish holidays, despite effective price reductions. The increase in the operating profit is the result of sales growth as described above.
The Group's Activity in Israel Strauss Group is the second-largest company in the Israeli food industry, and in the first nine months of 2016 according to StoreNext figures held an 11.5% share of the total retail domestic food and beverage market in value terms (compared to 11.1% in the corresponding period last year), an increase of 0.4% over the corresponding period. The Israeli market is the Group's home market, where it is active in various categories. The Company's sales in Israel grew by 4.4% in value terms, although according to StoreNext, in the first nine months of 2016 the Israeli food and beverage market decreased by 0.4% in financial value. Sales by all operations of Strauss Group in Israel include sales by the Health & Wellness and Fun & Indulgence divisions, the coffee operation in Israel, Max Brenner in Israel and Strauss Water Israel (Tami 4). The Max Brenner and Strauss Water businesses are not included in StoreNext's market share measurements. In the first nine months of the year Strauss Group's Israel sales totaled approximately NIS 3,169 million versus NIS 3,021 million last year, an increase of 4.9%. In the third quarter sales in Israel totaled approximately NIS 1,100 million compared to NIS 1,034 million last year, an increase of 6.5%.

Convenience Translation from Hebrew
19
Strauss Israel Following are the condensed results of business operations based on the non-GAAP management reports of Strauss Israel by activity segments, for the quarter and the nine months ended September 30, 2016 and 2015 (in NIS millions):
First Nine Months Third Quarter
2016 2015 % Chg 2016 2015 % Chg
Health & Wellness segment
Net sales 1,491 1,435 3.9 526 507 3.8
Operating profit 162 141 14.7 63 63 0.2
% operating profit 10.9% 9.8% 12.0% 12.4%
Fun & Indulgence segment
Net sales 783 743 5.4 260 240 8.1
Operating profit 86 81 6.9 24 23 8.4
% operating profit 11.0% 10.9% 9.3% 9.3%
Total Strauss Israel
Net sales 2,274 2,178 4.4 786 747 5.2
Gross profit 907 833 8.9 314 284 10.6
% gross profit 39.9% 38.2% 39.9% 38.0%
Operating profit 248 222 11.9 87 86 2.4
% operating profit 10.9% 10.2% 11.1% 11.4%
Sales In the first nine months of 2016 Strauss Israel's sales increased by approximately 4.4% (NIS 96 million). In the Health & Wellness segment the increase was approximately 3.9% (NIS 56 million), and in Fun & Indulgence sales growth amounted to 5.4% (NIS 40 million). In the third quarter of the year Strauss Israel's sales increased by approximately 5.2% (NIS 39 million). In Health & Wellness the increase was approximately 3.8% (NIS 19 million), and in Fun & Indulgence sales growth amounted to 8.1% (NIS 20 million). The increase in sales in the nine months and quarter reflects volume growth, which was offset in part by price reductions in the various categories, particularly dairy products (in the first half the Company lowered its prices in a number of dairy categories by 5%-22%, in addition to a 4.4% reduction in the controlled prices of white cheese and sweet cream). Gross profit In the first nine months of 2016 Strauss Israel's gross profit increased by approximately NIS 74 million with 1.7% growth in the gross profit margin, compared to the corresponding period last year. In the third quarter Strauss Israel's gross profit rose by NIS 30 million and the gross profit margin by 1.9% compared to the corresponding quarter of 2015. The increase in the gross profit is the result of growth in sales volumes, continued efficiency enhancing moves applied in production and packaging processes in a number of plants, and also reflects the favorable effect of a drop in the prices of some raw materials (raw milk, milk powders, tahini, hazelnuts and almonds) while the prices of other raw materials rose (sugar, potatoes and olive oil). In addition, during the year an increase was recorded in production inputs such as the minimum wage and municipal taxes, coupled with a reduction in energy prices, compared to the corresponding periods in 2015. Operating profit In the first nine months of 2016 Strauss Israel's EBIT increased by approximately NIS 26 million and the operating profit margin rose by 0.7% and amounted to 10.9% of sales. The increase in operating profit mainly reflects the growth in sales volumes and in the gross profit compared to the corresponding periods in 2015, which was partly offset by an increase in marketing expenses. Furthermore, in the second quarter last year a provision for doubtful debts was recorded in respect of Mega Retail. In the third quarter the operating profit increased by approximately NIS 1 million and the operating profit margin dropped by 0.3% and amounted to 11.1% of sales.

Convenience Translation from Hebrew
21
The International Dips & Spreads Activity
The Group develops, manufactures, sells, markets and distributes dips and spreads through Sabra in the US and Canada, and through Obela in Mexico, Australia and Holland. The operations of Sabra and Obela are each carried out through joint ventures between the Group and PepsiCo (each party holds 50%). In the GAAP report, the Group's holdings in Sabra and Obela are accounted for in the equity method.
Sabra is the largest refrigerated flavored dips and spreads company in the US. According to IRI, Sabra's value market share of the total refrigerated dips and spreads category in the 36 weeks ended on September 30, 2016 was 28.0% (Number 1 in the market), compared to 27.8% at the end of 2015 and 28.0% in the corresponding period last year. Sabra's value market share of the hummus category in the third quarter of 2016 was 62.2%, compared to 60.1% in the corresponding quarter last year.
Sale volumes in Australia and Mexico are immaterial. Nevertheless, it is noted that the company leads the hummus market in Australia in market share as well as in Mexico. In both countries, significant growth in the company's sales volumes was recorded in the first nine months of 2016.
In June 2016 Obela entered into an agreement for the acquisition of 100% of the share capital of Florentin B.V. ("Florentin"). Florentin is a Dutch company engaged in the development and manufacture of organic hummus, falafel, spreads and pita bread, and markets its products in Western Europe, particularly in the Netherlands, Germany and France. For further information, see Note 4.4 to the Consolidated Interim Financial Statements as at September 30, 2016 and the update of the chapter "Description of the Company's Business Affairs" as at September 30, 2016.
Sabra
Following are selected financial data on Sabra's business (in NIS millions, reflecting 100% ownership):
First Nine Months Third Quarter
2016 2015 2016 2015
Sales 1,095 1,078 371 384
Growth 1.6% 15.7% (3.4%) 19.0%
Organic growth excluding foreign currency effect 3.2% 4.0% (1.7%) 8.9%
Operating profit before other expenses 144 131 29 64
% operating profit 13.1% 12.2% 7.6% 16.6%
Sales by Sabra in the first nine months of 2016 grew by approximately NIS 17 million versus a decrease of approximately NIS 13 million in the third quarter, compared to the corresponding periods last year. In the first nine months of the year Sabra's market share continued to grow to 62.3%, compared to 60.2% in the corresponding period last year. Hummus sales in North America continued to increase, but the increase was offset in part by a drop in sales of other products. Sales were adversely affected by negative translation differences amounting to NIS 7 million. In the third quarter sales decreased by 3.4% compared to the corresponding quarter last year, which was particularly strong following the recall in the prior quarter.
The operating profit in the first nine months rose by approximately NIS 13 million, with an increase of 0.9% in the operating profit margin compared to the corresponding period in 2015. In the third quarter EBIT dropped by NIS 35 million, with a drop of 9.0% in the operating profit margin compared to the corresponding quarter last year. The drop in EBIT in the quarter is the result of an increase in selling and marketing expenses and of the marketing mix. On November 19, 2016 Sabra announced a voluntary recall in North America of some of its hummus products, manufactured and marketed in the US and Canada, due to concerns of possible Listeria contamination. The bacteria were detected in Sabra's production site in Virginia, but not in the end products themselves. Sabra applied a series of measures in the plant to address the incident and is working in coordination with the relevant authorities in the US. For further information, see the Immediate Report of November 19, 2016 (reference number 2016-01-079956). As at the date of this report, Company Management anticipates that the recall by Sabra will have a direct impact of approximately $5 million on the Company's operating profit, based, among other things, on existing insurance coverage. Notwithstanding the foregoing, as at the date of this report, Company Management is unable to assess the indirect effect of the recall on the Company's financial results, if any. The information in this section regarding the impact of the recall on the Company is forward-looking information, as this term is defined in the Securities Law, 1968, which is based on information in the Company's possession on the reporting date and includes estimates made by the Company on said date. There can be no assurance

Convenience Translation from Hebrew
21
that these assessments will, in fact, occur, among other things in light of the uncertainty inherent in the recall and in the insurance claim.
Obela
Following are selected financial data on Obela's business (in NIS millions, reflecting 100% ownership):
Sales by Obela in the first nine months of 2016 totaled approximately NIS 68 million, compared to NIS 53 million in the corresponding period last year (27.5% growth). Excluding the foreign currency effect, growth in the period amounted to 34.3% compared to the first nine months of 2015.
Obela's sales in the third quarter totaled approximately NIS 28 million, compared to NIS 19 million in the corresponding quarter last year (44.8% growth). Excluding the foreign currency effect, sales growth in the quarter amounted to 43.1% compared to last year.
The operating loss in the first nine months totaled NIS 20 million, compared to NIS 26 million in the corresponding period last year.
In the third quarter of 2016 the operating loss amounted to NIS 6 million, compared to NIS 5 million last year. The third quarter included the business results of Florentin, which had a negative effect on EBIT.
Other Operations The Group has activities which are included in the financial statements as the "Other Operations" segment. The main operations in this segment are Strauss Water, Max Brenner, and other immaterial activities of the Group. Strauss Water Through Strauss Water the Group is active in the water market in the development, assembly, marketing and servicing of systems for the filtration, purification and carbonation of drinking water, mainly in Israel, China and the UK. Commencing in the third quarter of 2015 the restructuring process of the operation in China is reflected in the Group's non-GAAP reports. Following this process the Company holds 34% of the Haier Strauss Water joint venture in China. For further information, see the Board of Directors' Report on the Company's Business Position for the year ended December 31, 2015. Sales by Strauss Water in the first nine months of 2016 amounted to approximately NIS 371 million compared to NIS 362 million in the corresponding period last year, an increase of 2.5%. The moderate growth in Strauss Water's income in the first nine months is mainly explained by the restructuring of the international operation in China. The change of structure led to a drop in sales due to the discontinuation of the proportionate consolidation of the Haier Strauss Water joint venture in China and a transition to accounting in the equity method as described above. In the third quarter of the year Strauss Water's sales totaled NIS 133 million compared to NIS 122 million in the corresponding period in 2015, an increase of 8.6%. Sales by the Haier Strauss Water joint venture in China in the first nine months and third quarter of 2016 amounted to approximately NIS 240 million and NIS 98 million, respectively (unaudited). In the first nine months of 2016 Strauss Water has posted an improvement in operating profit and cash flow compared to the corresponding period in 2015. Max Brenner On the date of publication of the report, the Max Brenner chain comprises sixty-two "Chocolate Bars" in Israel and around the world, fifty-nine under franchise and three owned by the Company (in the US: New York, Philadelphia and Boston). The Max Brenner bars are located in Australia (43), Israel (8), Japan (5), the US (3), Russia (2) and South Korea (1).
Convenience Translation from Hebrew
22
In the first nine months of 2016 Max Brenner's sales totaled approximately NIS 70 million compared to NIS 80 million last year, a decrease of 12.8%. The decrease in sales, excluding the foreign currency effect, amounted to approximately 12.1% compared to the corresponding period last year. In the third quarter Max Brenner's sales totaled approximately NIS 22 million compared to NIS 27 million in the corresponding quarter last year, a decrease of 17.5%. Excluding the foreign currency effect, sales decreased by approximately 17.0% compared to the corresponding period last year. DISCLOSURE RELATING TO THE EXAMINATION OF WARNING SIGNS IN RESPECT OF A WORKING CAPITAL DEFICIENCY PURSUANT TO REGULATION 10(B)(14)(a) In the Company's separate financial statements ("solo report") for the third quarter of 2016 there is a working capital deficiency of approximately NIS 83 million, whereas in the consolidated financial statements of the Company for the quarter there is no such deficiency. Cash flows provided by operating activities in the "solo report" amount to a positive cash flow of NIS 198 million. In light of the working capital deficiency in the "solo report", on November 21, 2016 the Board of Directors of the Company examined the Company's liquidity as described below, and determined that said working capital deficiency is not indicative of a liquidity issue in the Company. This decision is based on a review, inter alia, of the Company's financial results as reported in the financial statements of the Company as at September 30, 2016, and is also based on data regarding the Company's projected cash flow "solo" for the next two years given the Company's existing and anticipated liabilities, including the Company's liabilities to the holders of its debentures (Series B and Series D) and to banking corporations and their maturity dates, and on an inspection of existing and anticipated sources for the repayment of these liabilities and the resources arising from the Company's holdings in its major investees, including the receipt of dividends, repayment of loans made available to investees, raising capital from banking corporations and/or other sources if necessary; as well as on the financial strength of the major investees of the Company and their leading competitive position in the markets where these companies operate. The Board of Directors also reviewed sensitivity analyses of the Company's projected cash flow "solo" for the next two years, and determined that the working capital deficiency is not indicative of a liquidity issue in the Company. It is emphasized that the abovementioned assessment by the Board of Directors is forward-looking information, as this term is defined in the Securities Law, 1968, which is primarily based on the Company's forecasts and on its analysis of its actual cash flows in the period since the end of the quarter and its future cash flows, its existing and anticipated liabilities, its existing assets, its expectations as to future profits and dividend distributions by investees, etc. There can be no assurance that these assessments will, in fact, occur, or that they will not occur in a different form, including materially, than estimated, among other things as a result of market behavior and occurrence of the risk factors set forth in section 30 in Part A of the Company's 2015 Periodic Report. ASPECTS OF CORPORATE GOVERNANCE General For information on the effectiveness of internal control over financial reporting and disclosure pursuant to Regulation 38C(a), see the attached report. INFORMATION ON THE DEBENTURE SERIES
Following is information on the series of material capital notes with respect to the Company's liabilities as at September 30, 2016:
Debentures Series B
Debentures Series D
A. Nominal/par value 297 465
B. Par value linked to the Consumer Price Index 357 465
C. Book value of Debentures 357 476
D. Book value of interest payable 2 -
E. Market value 368 528

Convenience Translation from Hebrew
23
LIABILITY REPORT ACCORDING TO PAYMENT DATES See Form T-126, published simultaneously with the financial statements. MATERIAL EVENTS IN THE REPORTING PERIOD
For a review of material events occurring in the reporting period, see the update of the chapter "Description of the Company's Business Affairs" as at September 30, 2016 and Notes 4, 5 and 6 to the Consolidated Interim Financial Statements as at September 30, 2016.
POST-STATEMENT OF FINANCIAL POSITION DATE EVENTS
For a review of events occurring after the statement of financial position date, see Note 9 to the Consolidated Interim Financial Statements as at September 30, 2016.
The Board of Directors and Management express their gratitude and appreciation to the employees and managers of Strauss Group.
Ofra Strauss Gadi Lesin Chairperson of the Board Chief Executive Officer
November 21, 2016

STRAUSS GROUP LTD. FINANCIAL STATEMENTS AS AT SEPTEMBER 30, 2016
Convenience Translation from Hebrew
Strauss Group Ltd.
Financial Statements As at September 30, 2016
Convenience Translation from Hebrew Strauss Group Ltd.
1
Financial Statements as at September 30, 2016 Contents
Page Auditors’ Review Report 2 Consolidated Interim Statements of financial position 3
Consolidated Interim Statements of Income 5 Consolidated Interim Statements of Comprehensive Income 6 Consolidated Interim Statements of Changes in Shareholders' Equity 7 Consolidated Interim Statements of Cash Flows 12 Notes to the consolidated Interim Financial Statements 14

Somekh Chaikin KPMG Millennium Tower 17 Ha’arba’a Street, PO Box 609 Tel Aviv 61006, Israel +972 3 684 8000
Somekh Chaikin, an Israeli partnership and a member firm of the KPMG network of independent member firms affiliated with KPMG International Cooperative (“KPMG International”), a Swiss entity.
Review Report to the Shareholders of Strauss Group Ltd. Introduction We have reviewed the accompanying financial information of Strauss Group Ltd. and its subsidiaries (hereinafter– “the Group”) comprising of the condensed consolidated interim statement of financial position as of September 30, 2016 and the related condensed consolidated interim statements of income, comprehensive income, changes in equity and cash flows for the nine and three month periods then ended. The board of directors and management are responsible for the preparation and fair presentation of this interim financial information in accordance with IAS 34 “Interim Financial Reporting”, in addition management is responsible for the financial information to be prepared in accordance with Section D of the Securities Regulations (Periodic and Immediate Reports), 1970. Our responsibility is to express a conclusion on this interim financial information based on our review. We did not reviewed the financial statements of equity accounted investees the investment in which amounted to approximately NIS 20.2 million as of September 30, 2016, and the Group’s share in their profits amounted to approximately NIS 6.8 million and NIS 2.3 million for the nine and three month periods then ended, respectively. The financial statements of those companies were reviewed by other auditors whose review reports thereon were furnished to us, and our conclusion, insofar as it relates to amounts emanating from the financial statements of such companies, is based solely on the said review reports of the other auditors. Scope of Review We conducted our review in accordance with Standard on Review Engagements 1, "Review of Interim Financial Information Performed by the Independent Auditor of the Entity" of the Institute of Certified Public Accountants in Israel. A review of interim financial information consists of making inquiries, primarily of persons responsible for financial and accounting matters, and applying analytical and other review procedures. A review is substantially less in scope than an audit conducted in accordance with generally accepted auditing standards in Israel and consequently does not enable us to obtain assurance that we would become aware of all significant matters that might be identified in an audit. Accordingly, we do not express an audit opinion. Conclusion Based on our review and the review reports of other auditors, nothing has come to our attention that causes us to believe that the accompanying financial information was not prepared, in all material respects, in accordance with IAS 34. In addition to the mentioned in the previous paragraph, based on our review and the review reports of other auditors, nothing has come to our attention that causes us to believe that the accompanying interim financial information does not follow, in all material respects, the disclosure directives of Section D of the Securities Regulations (Periodic and Immediate Reports), 1970. Somekh Chaikin Certified Public Accountants (Isr.) November 21, 2016
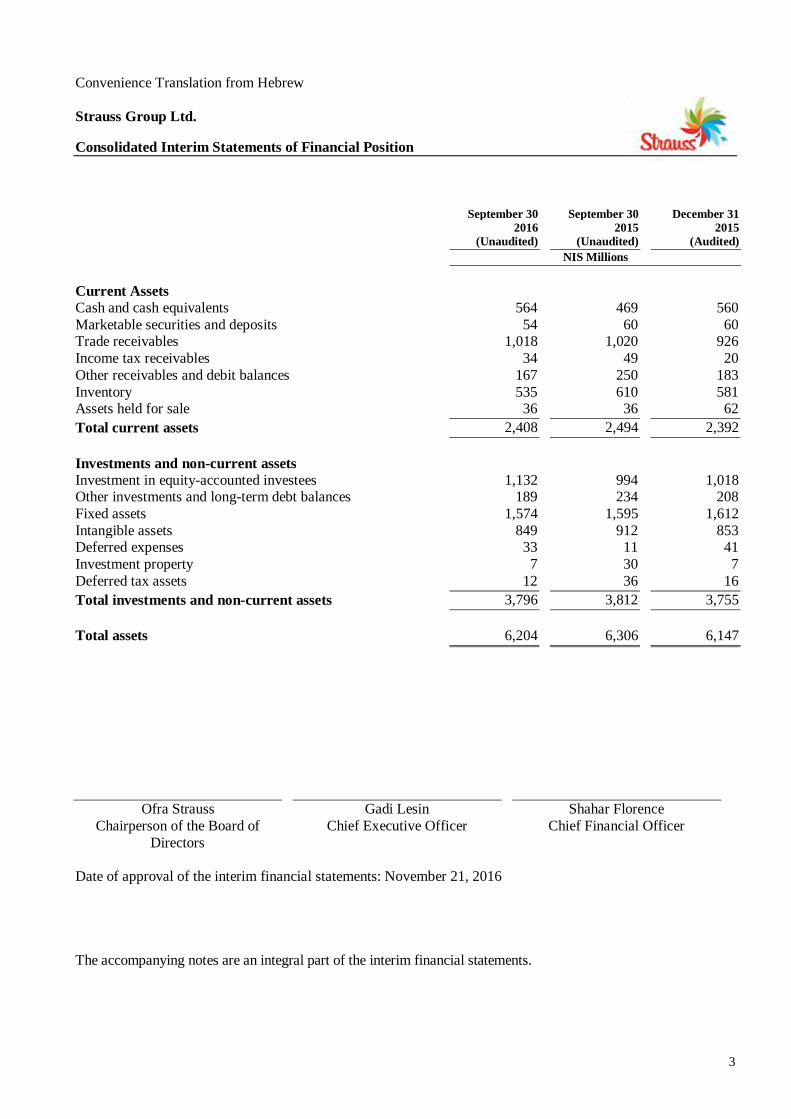
Convenience Translation from Hebrew Strauss Group Ltd.
3
Consolidated Interim Statements of Financial Position
September 30 September 30 December 31 2016 2015 2015 (Unaudited) (Unaudited) (Audited) NIS Millions
Current Assets Cash and cash equivalents 564 469 560 Marketable securities and deposits 54 60 60 Trade receivables 1,018 1,020 926 Income tax receivables 34 49 20 Other receivables and debit balances 167 250 183 Inventory 535 610 581 Assets held for sale 36 36 62 Total current assets 2,408 2,494 2,392 Investments and non-current assets Investment in equity-accounted investees 1,132 994 1,018 Other investments and long-term debt balances 189 234 208 Fixed assets 1,574 1,595 1,612 Intangible assets 849 912 853 Deferred expenses 33 11 41 Investment property 7 30 7 Deferred tax assets 12 36 16 Total investments and non-current assets 3,796 3,812 3,755 Total assets 6,204 6,306 6,147
Ofra Strauss Gadi Lesin Shahar Florence Chairperson of the Board of
Directors Chief Executive Officer Chief Financial Officer
Date of approval of the interim financial statements: November 21, 2016 The accompanying notes are an integral part of the interim financial statements.

Convenience Translation from Hebrew Strauss Group Ltd.
4
Consolidated Interim Statements of Financial Position (cont'd) September 30 September 30 December 31 2016 2015 2015 (Unaudited) (Unaudited) (Audited) NIS Millions Current liabilities Current maturities of debentures 197 179 178 Short terms credit and current maturities of long- term credit and loans 159 156 181 Trade payables 672 653 713 Income tax payables 25 16 80 Other payables and credit balances 618 643 531 Provisions 32 35 34 Total current liabilities 1,703 1,682 1,717 Non-current liabilities Debentures 636 838 834 Long-term loans and credit 986 990 943 Long-term payables and credit balances 67 96 88 Employee benefits, net 56 57 55 Deferred taxes 211 186 202 Total non-current liabilities 1,956 2,167 2,122 Equity and reserves Share capital 244 244 244 Share premium 622 622 622 Reserves (904) )888( )965( Retained earnings 1,908 1,836 1,804 Total equity attributable to the Company’s shareholders 1,870 1,814 1,705 Non-Controlling interests 675 643 603 Total equity 2,545 2,457 2,308 Total liabilities and equity 6,204 6,306 6,147 The accompanying notes are an integral part of the interim financial statements.

Convenience Translation from Hebrew Strauss Group Ltd.
5
Consolidated Interim Statements of Income
For the year For the nine months ended For the three months ended ended September 30 September 30 September 30 September 30 December 31 2016 2015 2016 2015 2015 (Unaudited) (Audited) NIS millions
Sales 3,972 3,881 1,378 1,365 5,183 Cost of sales 2,359 2,437 825 888 3,228 Gross profit 1,613 1,444 553 477 1,955
Selling and marketing expenses 911 892 314 285 1,198 General and administrative expenses 269 237 96 75 329 1,180 1,129 410 360 1,527 Share of profits of equity accounted investees 154 134 51 51 198 Operating profit before other income (expenses) 587 449 194 168 626 Other income 5 10 1 2 16 Other expenses (48) (30) (26) (16) )57( Other expenses, net (43) (20) (25) (14) )41( Operating profit 544 429 169 154 585 Financing income 3 14 1 5 21 Financing expenses (96) (92) (38) (30) )122( Financing expenses, net (93) (78) (37) (25) )101( Profit before income taxes 451 351 132 129 484 Income taxes (119) (94) (31) (39) )139( Profit for the period 332 257 101 90 345 Attributable to: The Company’s shareholders 242 192 69 68 257 Non-Controlling interests 90 65 32 22 88 Profit for the period 332 257 101 90 345 Earnings per share for the Company’s shareholders Basic earnings per share (in NIS) 2.26 1.79 0.64 0.64 2.40 Diluted earnings per share (in NIS) 2.25 1.78 0.64 0.63 2.39
The accompanying notes are an integral part of the interim financial statements.
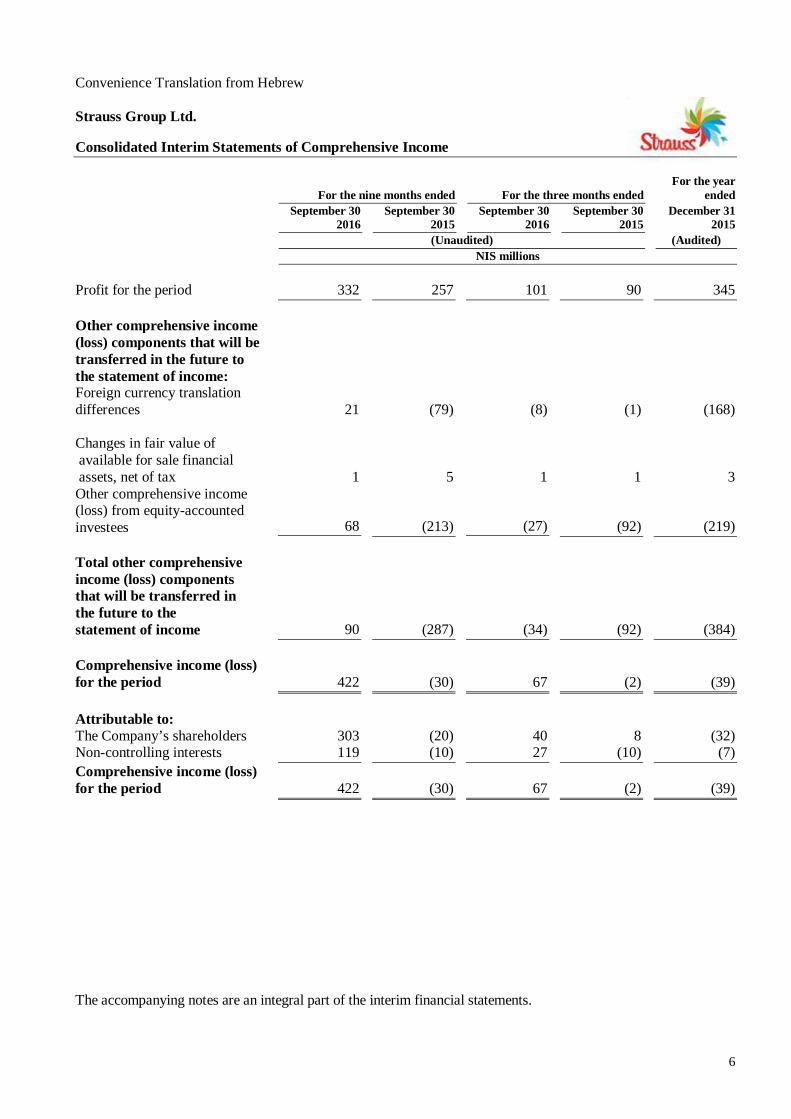
Convenience Translation from Hebrew Strauss Group Ltd.
6
Consolidated Interim Statements of Comprehensive Income
For the year For the nine months ended For the three months ended ended September 30 September 30 September 30 September 30 December 31 2016 2015 2016 2015 2015 (Unaudited) (Audited) NIS millions
Profit for the period 332 257 101 90 345 Other comprehensive income (loss) components that will be transferred in the future to the statement of income: Foreign currency translation differences 21 )79(
)8( )1( )168(
Changes in fair value of available for sale financial assets, net of tax 1 5 1 1 3 Other comprehensive income (loss) from equity-accounted investees
68
)213(
)27(
)92(
)219(
Total other comprehensive income (loss) components
that will be transferred in the future to the statement of income 90 )287( )34( )92( )384( Comprehensive income (loss) for the period 422 )30( 67 )2( )39( Attributable to: The Company’s shareholders 303 )20( 40 8 )32( Non-controlling interests 119 )10( 27 )10( )7( Comprehensive income (loss) for the period 422 )30( 67 )2( )39(
The accompanying notes are an integral part of the interim financial statements.

Convenience Translation from Hebrew Strauss Group Ltd.
7
Consolidated Interim Statements of Changes in Equity Attributable to the Company’s shareholders Reserve in respect of available for sale Non- Share Share Translation Treasury financial Retained Controlling Total capital premium reserve stock assets earnings Total interests equity NIS millions For the nine month period ended September 30, 2016 - unaudited: Balance as at January 1, 2016 - Audited 244 622 (951) (20) 6 1,804 1,705 603 2,308 Comprehensive income for the period Profit for the period - - - - - 242 242 90 332 Other comprehensive income:
Foreign currency translation differences - - 15 - - - 15 6 21 Changes in fair value of available for sale financial assets, net of tax - - - - - - - 1 1 Other comprehensive income from equity accounted investees - - 46 - - - 46 22 68
Total other comprehensive income for the Period, net of tax - - 61 - - - 61 29 90 Total comprehensive income for the period - - 61 - - 242 303 119 422 Share-based payment - - - - - 10 10 - 10 Transaction with non-controlling interests - - - - - 2 2 (5) (3) Dividend distributed - - - - - (150) (150) - (150) Dividend to non-controlling interests in - - - - - - - (42) (42) subsidiaries Balance as at September 30, 2016 - unaudited 244 622 (890) (20) 6 1,908 1,870 675 2,545 The accompanying notes are an integral part of the interim financial statements.

Convenience Translation from Hebrew Strauss Group Ltd.
8
Consolidated Interim Statements of Changes in Shareholders' Equity (Cont'd) Attributable to the Company’s shareholders Reserve in respect of available for sale Non- Share Share Translation Treasury financial Retained Controlling Total capital premium reserve stock assets earnings Total interests equity NIS millions Changes during the nine-month period ended September 30, 2015 - Unaudited: Balance as at January 1, 2015 -Audited 244 622 (661) (20) 5 1,633 1,823 717 2,540 Comprehensive income (loss) for the period Profit for the period - - - - - 192 192 65 257 Other comprehensive income (loss):
Foreign currency translation differences - - )55( - - - (55) (24) (79) Other comprehensive income (loss) from equity-accounted investees - - )159( - - - (159) (54) (213) Changes in fair value of available for sale financial assets, net of tax - - - - 2 - 2 3 5
Total Other comprehensive income (loss) for the period, net of tax - - )214( - 2 - (212) (75) (287)
Total Comprehensive income (loss) for the period - - )214( - 2 192 (20) (10) (30) Share-based payment - - - - - 11 11 - 11 Share-based payment to Non-Controlling interests in a subsidiary - - - - - - - 1 1 Dividend to Non-Controlling interests in a subsidiary - - - - - - - (65) (65) Balance as at September 30, 2015 – Unaudited 244 622 )875( )20( 7 1,836 1,814 643 2,457 The accompanying notes are an integral part of the interim financial statements.

Convenience Translation from Hebrew Strauss Group Ltd.
9
Consolidated Interim Statements of Changes in Equity (cont'd) Attributable to the Company’s shareholders Reserve in respect of available for sale Non- Share Share Translation Treasury financial Retained Controlling Total capital premium reserve stock assets earnings Total interests equity NIS millions
For the three month period ended September 30, 2016 - unaudited: Balance as at July 1, 2016 - unaudited 244 622 (861) (20) 6 1,985 1,976 648 2,624 Comprehensive income (loss) for the period Profit for the period - - - - - 69 69 32 101
Other comprehensive income: Foreign currency translation differences - - (5) - - - (5) (3) (8) Changes in fair value of available for sale financial assets - - - - - - - 1 1 Other comprehensive loss from equity- accounted investees - - (24) - - - (24) (3) (27)
Total other comprehensive loss for the period, net of tax - - (29) - - - (29) (5) (34) Total comprehensive income (loss) for the period - - (29) - - 69 40 27 67 Share-based payment - - - - - 4 4 - 4 Dividend distributed - - - - - (150) (150) - (150)
Balance as at September 30, 2016 - unaudited 244 622 (890) (20) 6 1,908 1,870 675 2,545
The accompanying notes are an integral part of the interim financial statements.
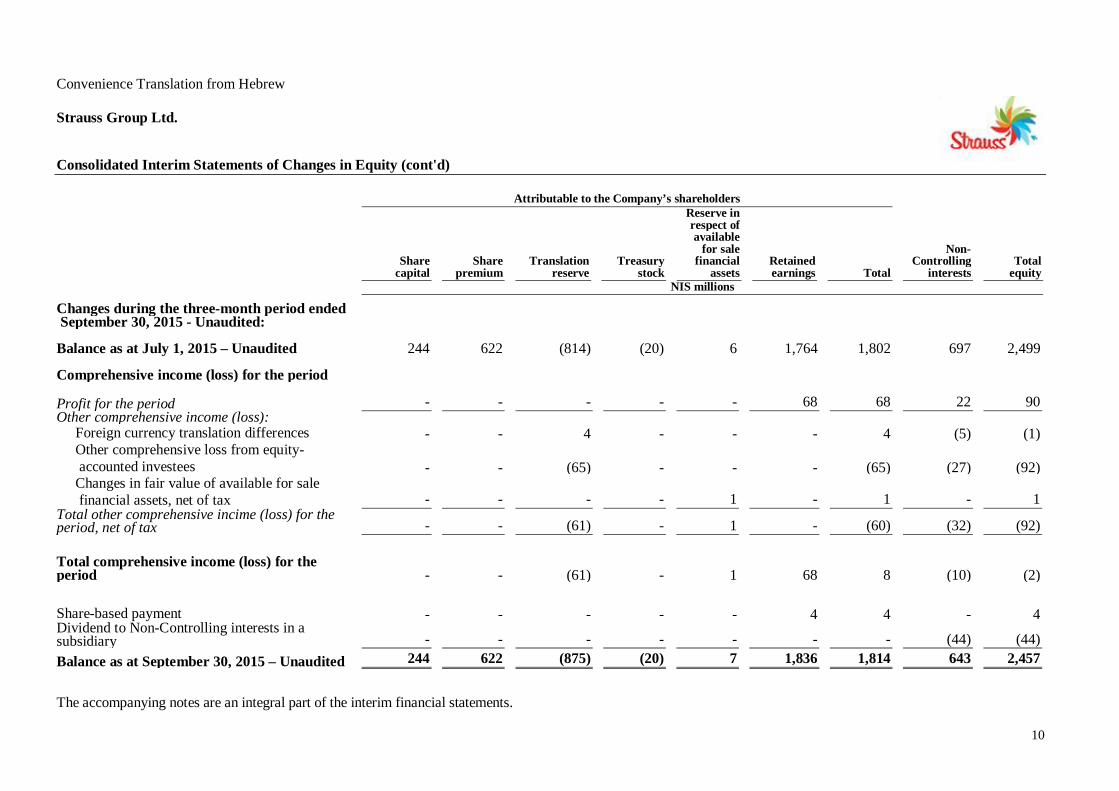
Convenience Translation from Hebrew Strauss Group Ltd.
10
Consolidated Interim Statements of Changes in Equity (cont'd) Attributable to the Company’s shareholders Reserve in respect of available for sale Non- Share Share Translation Treasury financial Retained Controlling Total capital premium reserve stock assets earnings Total interests equity NIS millions
Changes during the three-month period ended September 30, 2015 - Unaudited: Balance as at July 1, 2015 – Unaudited 244 622 (814) (20) 6 1,764 1,802 697 2,499 Comprehensive income (loss) for the period Profit for the period - - - - - 68 68 22 90 Other comprehensive income (loss):
Foreign currency translation differences - - 4 - - - 4 (5) )1( Other comprehensive loss from equity- accounted investees - - (65) - - - (65) (27) (92) Changes in fair value of available for sale financial assets, net of tax - - - - 1 - 1 - 1
Total other comprehensive incime (loss) for the period, net of tax - - (61) - 1 - (60) (32) (92)
Total comprehensive income (loss) for the period - - (61) - 1 68 8 (10) (2)
Share-based payment - - - - - 4 4 - 4 Dividend to Non-Controlling interests in a subsidiary - - - - - - - (44) (44) Balance as at September 30, 2015 – Unaudited 244 622 )875( )20( 7 1,836 1,814 643 2,457 The accompanying notes are an integral part of the interim financial statements.

Convenience Translation from Hebrew Strauss Group Ltd.
11
Consolidated Statements of Changes in Equity (cont'd) Attributable to the Company’s shareholders Reserve in respect of available-for- sale Non- Share Share Translation Treasury financial Retained controlling Total capital premium reserve shares assets earnings Total interests equity NIS millions For the year ended December 31, 2015 – audited Balance as at January 1, 2015 – audited 244 622 (661) (20) 5 1,633 1,823 717 2,540 Comprehensive income (loss) for the year Profit for the year - - - - - 257 257 88 345 Other comprehensive income (loss):
Foreign currency translation differences - - (126) - - - (126) (42) (168) Other comprehensive loss from equity- accounted investees - - (164) - - - (164) (55) (219) Changes in fair value of available-for-sale
financial assets, net of tax - - - - 1 - 1 2 3
Total other comprehensive income (loss) for the year, net of tax
- - (290) - 1 - (289) (95) (384)
Total comprehensive income (loss) for the year - - (290) - 1 257 (32) (7) (39) Share-based payment - - - - - 14 14 - 14 Share-based payment to non-controlling interests in a subsidiary - - - - - - - 1 1 Dividend distributed - - - - - (100) (100) - (100) Dividend to non-controlling interests in subsidiaries - - - - - - - (108) (108) Balance as at December 31, 2015 - audited 244 622 (951) (20) 6 1,804 1,705 603 2,308
The accompanying notes are an integral part of the consolidated financial statements.

Convenience Translation from Hebrew Strauss Group Ltd.
12
Consolidated Interim Statements of Cash Flows For the year For the nine months ended For the three months ended ended September 30 September 30 September 30 September 30 December 31 2016 2015 2016 2015 2015 Unaudited Audited NIS millions
Cash flows from operating activities Income for the period 332 257 101 90 345 Adjustments: Depreciation 103 97 34 35 132 Amortization of intangible assets and deferred expenses 33 36 11 11 51 Impairment of fixed assets and intangible assets 15 19 12 - 29 Other expenses (income), net 13 (12) 8 4 )14( Expenses in respect of share based payment 10 12 4 3 15 Financing expenses, net 93 78 37 25 101 Income tax expenses 119 94 31 39 139 Share of profits of equity accounted investees (154) (134) (51) (51) )198( Change in inventory 52 54 48 94 62 Change in trade and other receivables (88) (147) (77) (182) )56(
Change in long-term receivables (1) (11) 1 (13)
9
Change in trade and other payables 42 (199) 28 17
)204( Change in employee benefits 3 (2) 4 (3) )3( Interest paid (91) (91) (39) (42) )99( Interest received 13 18 10 9 26 Income tax received (paid), net (184) (55) (31) (13) 14 Net cash flows provided by (used in) operating activities 310 14 131 23 349 Cash flows from investing activities Sale (purchase) of marketable securities and deposits, net 5 60 (1) (2) 61 Proceeds from sale of fixed assets, intangible assets and investment property 27 23 2 - 24 Acquisition of fixed assets (93) (137) (28) (36) (182) Acquisition of subsidiary - (4) - - (4) Investments in intangible assets (20) (22) (7) (6) (30) Repayment of deposits and loans granted 42 31 9 11 50 Long-term loans granted (11) (18) (1) (5) (21) Taxes received due to the sale of investment property - - - - 5 Dividends from investee companies 144 15 123 13 48 Investment in investee companies (36) - - - (32) Net cash flows provided by (used in) investing activities 58 )52( 97 )25( )81( The accompanying notes are an integral part of the interim financial statements.
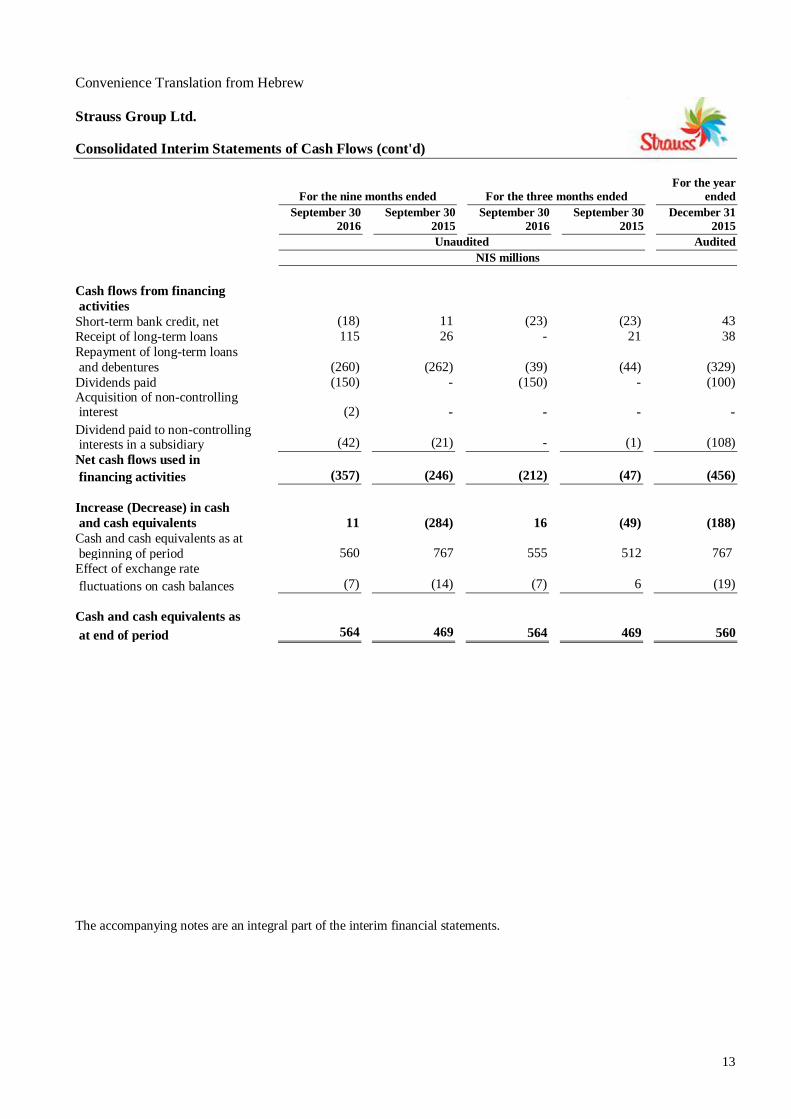
Convenience Translation from Hebrew Strauss Group Ltd.
13
Consolidated Interim Statements of Cash Flows (cont'd) For the year For the nine months ended For the three months ended ended September 30 September 30 September 30 September 30 December 31 2016 2015 2016 2015 2015 Unaudited Audited NIS millions Cash flows from financing activities Short-term bank credit, net (18) 11 (23) )23( 43 Receipt of long-term loans 115 26 - 21 38 Repayment of long-term loans and debentures (260) )262( (39) )44( )329( Dividends paid (150) - (150) - )100( Acquisition of non-controlling interest (2) - - - - Dividend paid to non-controlling interests in a subsidiary (42) )21( -
)1( (108)
Net cash flows used in financing activities (357) )246( (212) )47( )456( Increase (Decrease) in cash and cash equivalents 11 )284( 16 )49( )188( Cash and cash equivalents as at beginning of period 560 767 555 512 767 Effect of exchange rate fluctuations on cash balances (7) )14( (7) 6 )19( Cash and cash equivalents as at end of period 564 469 564 469 560 The accompanying notes are an integral part of the interim financial statements.

Convenience Translation from Hebrew Strauss Group Ltd.
Notes to the Consolidated Interim Financial Statements (unaudited)
14
Note 1 - Reporting Rules and Accounting Policies
1.1 General 1.1.1. The reporting entity, Strauss Group Ltd. (hereinafter: the “Company” or “Strauss Group”) is an
Israeli resident company. The Company's registered office address is at 49 Hasivim St., Petach Tikva.
The Company and its subsidiaries (hereinafter: the “Group”) are a group of industrial and commercial companies operating in Israel and abroad and active in the development, manufacture, marketing and sale of a broad variety of branded food and beverage products. The Group is also active in the development, marketing, servicing and sale of water filtration and purification products. The consolidated interim financial statements of the Company as at September 30, 2016 and for the nine and three-month periods then ended (hereinafter: the “Interim Financial Statements”) comprise those of the Company and its subsidiaries, as well as the Group's rights in joint arrangements. The Company’s controlling shareholders are Mr. Michael Strauss through his holdings in Strauss Holdings Ltd. (hereinafter: the “Parent Company” or “Strauss Holdings”) and Ms. Ofra Strauss, who is considered a joint holder of the Company’s shares with Mr. Strauss.
1.1.2. The Interim Financial Statements were prepared in accordance with IAS 34 with respect to
interim financial reporting and in accordance with the provisions of Section D of the Securities Regulations (Periodic and Immediate Reports), 1970. These Interim Financial Statements should be read in context with the audited consolidated financial statements of the Company and its consolidated subsidiaries as at December 31, 2015 and for the year then ended, and their accompanying notes (hereinafter: the “Annual Financial Statements”). The accounting policies applied in the Interim Financial Statements are consistent with those applied in preparing the Annual Financial Statements.
1.1.3. The consolidated financial statements are presented in New Israeli Shekels, which is the
functional currency of the Company. The financial information is presented in NIS millions and has been rounded to the nearest million.
1.1.4. The consolidated Interim Financial Statements were approved for publication by the Company's
board of directors on November 21, 2016. Note 2 - Seasonality
Sales of Fun & Indulgence and coffee products in Israel are characterized by seasonality, and are generally higher in the first quarter of the year. Seasonality is mainly influenced by the winter months, when greater consumption of chocolate products and hot beverages is typical, and by increased consumption of Fun & Indulgence products as Passover approaches. In Health & Wellness products there is no distinct trend of seasonality, but revenue is generally relatively higher in the third quarter of the year – the hot summer months, which are characterized by greater consumption of dairy products. The international coffee sales are usually higher in the fourth quarter of the year. The seasonality is mainly affected by the timing of the Christian holidays and the end of the calendar year in the fourth quarter of the year, a time characterized by higher purchases of coffee products.
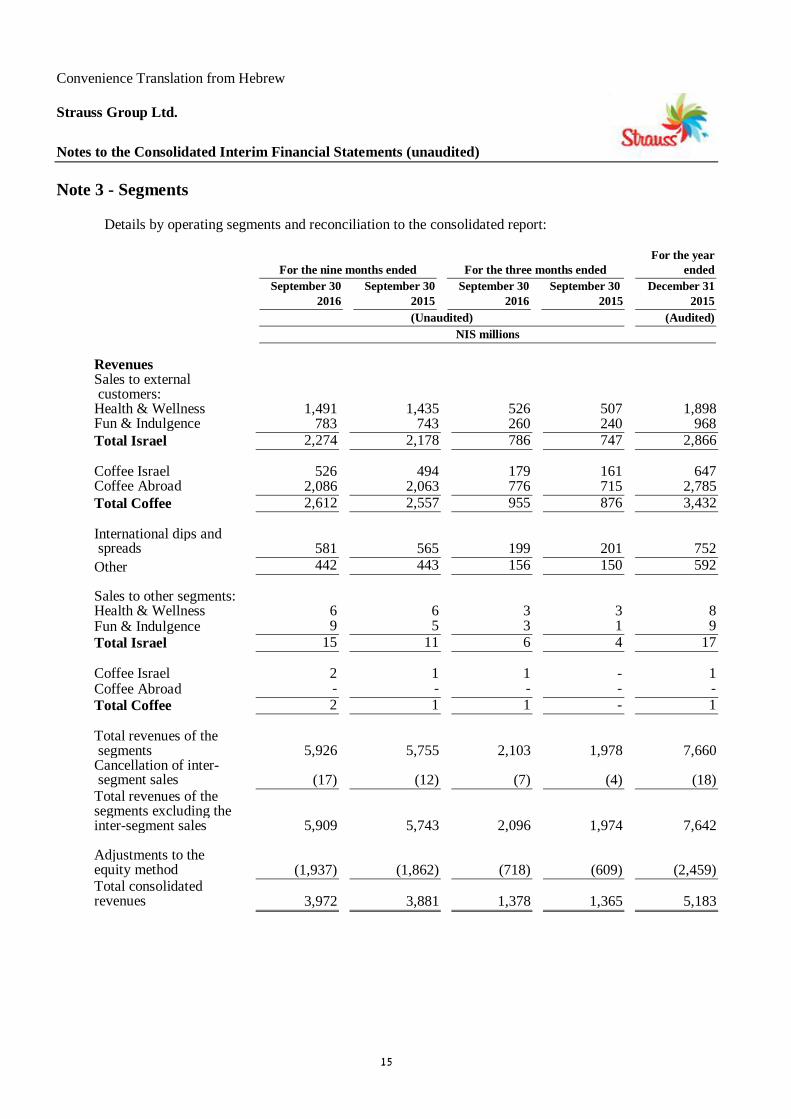
Convenience Translation from Hebrew Strauss Group Ltd.
Notes to the Consolidated Interim Financial Statements (unaudited)
15
Note 3 - Segments Details by operating segments and reconciliation to the consolidated report:
For the year For the nine months ended For the three months ended ended September 30 September 30 September 30 September 30 December 31 2016 2015 2016 2015 2015 (Unaudited) (Audited) NIS millions
Revenues Sales to external customers: Health & Wellness 1,491 1,435 526 507 1,898 Fun & Indulgence 783 743 260 240 968 Total Israel 2,274 2,178 786 747 2,866 Coffee Israel 526 494 179 161 647 Coffee Abroad 2,086 2,063 776 715 2,785 Total Coffee 2,612 2,557 955 876 3,432 International dips and spreads 581 565 199 201 752 Other 442 443 156 150 592 Sales to other segments: Health & Wellness 6 6 3 3 8 Fun & Indulgence 9 5 3 1 9 Total Israel 15 11 6 4 17 Coffee Israel 2 1 1 - 1 Coffee Abroad - - - - - Total Coffee 2 1 1 - 1 Total revenues of the segments 5,926 5,755 2,103 1,978 7,660 Cancellation of inter- segment sales (17) (12) (7) (4) )18( Total revenues of the segments excluding the inter-segment sales 5,909 5,743 2,096 1,974 7,642 Adjustments to the equity method (1,937) (1,862) (718) (609) )2,459( Total consolidated revenues 3,972 3,881 1,378 1,365 5,183

Convenience Translation from Hebrew Strauss Group Ltd.
Notes to the Consolidated Interim Financial Statements (unaudited)
16
Note 3 - Segments (cont'd)
For the year For the nine months ended For the three months ended ended September 30 September 30 September 30 September 30 December 31 2016 2015 2016 2015 2015 (Unaudited) (Audited) NIS millions
Profit
Health & Wellness 162 141 63 63 188 Fun & Indulgence 86 81 24 23 93 Total Israel 248 222 87 86 281
Coffee Israel 79 64 27 18 84 Coffee Abroad 196 135 85 45 184 Total Coffee 275 199 112 63 268 International dips and spreads 62 52 11 29 80 Other 24 28 3 14 30 Total profit of reportable segments 609 501 213 192 659
Unallocated income (expenses): Valuation of commodities hedging transactions as at the end of the period 28 (3) 1 (8) 22 Other expenses, net (1) (43) (20) (24) (14) )42( Share based payment (10) (12) (4) (3) )15( Total operating profit of reportable segments 584 466 186 167
624
Adjustments to the equity method (40) (37) (17) (13) )39( Total consolidated operating profit 544 429 169 154
585
Financing expenses, net (93) (78) (37) (25) )101( Income before taxes On income 451 351 132 129 484
(1) For the nine-month period ended September 30, 2016 also includes expenses of approximately NIS 29 million in respect of
organizational changes (of said amount, NIS 12 million in respect of an onerous contract and NIS 17 million in respect of the derecognition of fixed assets and intangible assets), as well as intangible asset impairment in an amount of approximately NIS 9 million (see also Note 4.6).
For the three-month period ended September 30, 2016. Also includes expenses of approximately NIS 11 million in respect of organizational changes (of said amount, NIS 3 million in respect of an onerous contract and NIS 8 million in respect of the derecognition of fixed assets and intangible assets), as well as intangible asset impairment in an amount of approximately NIS 9 million (see also Note 4.6).

Convenience Translation from Hebrew Strauss Group Ltd.
Notes to the Consolidated Interim Financial Statements (unaudited)
17
Note 4 - Material Events during the Reported Period 4.1 On January 4, 2016 the Knesset plenum approved the Law for the Amendment of the Israeli Tax
Ordinance (Amendment 216), 2016 (the “Amendment”), which determines, inter alia, that the corporate tax rate will be reduced commencing in 2016 and thereafter, by 1.5%, i.e. from 26.5% to 25%. Deferred tax balances as at September 30, 2016 were calculated according to the new tax rates as determined in the Law for the Amendment of the Israeli Tax Ordinance, on the basis of the expected tax rate at the time of reversal. The impact of the change on the financial statements as at September 30, 2016 is expressed in the reduction of the deferred tax liability by approximately NIS 8 million against revenue generated by deferred taxes.
4.2 In February 2016 the subsidiary, Strauss Coffee, distributed a dividend by way of a capital
reduction, expressed in the payment of NIS 21 million to the non-controlling interest. 4.3 In March 2016 the Três Corações joint venture, an equity-accounted investee in Brazil (jointly
held by the Group (50%) and by São Miguel Holding e Investimentos S.A. (50%)), signed an agreement with the coffee company Cia Iguaçu de Café Soluvel for the acquisition of the operation attributed to Cia Iguaçu's retail coffee brands in South America, including Brazil. Três Corações is to pay approximately NIS 77 million for the acquisition (the Group's share is NIS 38 million). In September, the agreement was approved by the regulatory authorities in Brazil. According to the final acquisition agreement, an additional sum of NIS 2 million (the Group's share – NIS 1 million) will be added to the consideration, reflecting interest accrued on funds deposited in a trust account.
4.4 On June 30, 2016 PepsiCo-Strauss Fresh Dips & Spreads International (hereinafter: “Obela”),
an equity-accounted investee that is jointly controlled by Strauss and PepsiCo, entered into an agreement for the acquisition of 100% of the share capital of Florentin B.V. (hereinafter: “Florentin”). Florentin is a Dutch company engaged in the development and manufacture of organic hummus, falafel, spreads and pita bread products and markets its products in Western Europe, particularly in the Netherlands, Germany and France. Florentin employs a staff of forty employees and operates a production site in Holland. According to Florentin's financial statements, its sales turnover in 2015 is estimated at €5 million (approximately NIS 22 million). Obela is to pay the sum of NIS 38.5 million in consideration for the acquisition of Florentin, plus an additional performance-contingent payment of NIS 7.5 million (approximately €1.75 million) over a three-year period. The acquisition will be equally financed by Strauss and PepsiCo.
4.5 On July 26, 2016 the company distributed a dividend to shareholders in amount of NIS 150 million (NIS 1.40 per share).
4.6 Following the increase in the green coffee prices and the expected erosion of profits of Strauss Adriatic d.o.o., (a Strauss Coffee B.V. subsidiary) on September 30, 2016 the Company examined the recoverable amount of the unit. This amount reflects value in use and calculated by discounting the unit's projected future cash flows at a pre-tax discount rate of 14.5%. The estimate did not include an assumption of long-term growth. Consequently, the Group recognized an intangible asset impairment loss of NIS 9 million, which was recognized in the statement of income under other expenses.

Convenience Translation from Hebrew Strauss Group Ltd.
Notes to the Consolidated Interim Financial Statements (unaudited)
18
Note 5 - Share-Based Payment
5.1 Grants in the reporting period
5.1.1 On September 26 the meeting of shareholders of the Company approved the grant of 524,613
warrants to the Company CEO, as well as 164,634 performance share units (PSUs) (the "Restricted Shares") which are exercisable for ordinary shares of the Company of NIS 1 par value each. The CEO's entitlement to receive the underlying shares resulting from the options offered to him will vest in four tranches, as follows: 50% of the total number options on July 27, 2018, and 16.667% of the number of options on July 27 in each of the years 2019, 2020 and 2021. The terms and conditions of the options granted to the CEO include a ceiling for the possible benefit embodied in the options, in such manner that if the market price of the share on the exercise date is higher by 60% or more than the average adjusted closing price of the Company's share in the 30 trading days preceding the date of approval of the allotment by the board of directors, the difference between the share price on the exercise date and the price at the time of grant shall be added to the original exercise price, plus 60%. The fair value of the options on the date of approval by the meeting of shareholders of the Company was calculated according to the binomial model and estimated at NIS 11.94 per warrant. The main assumptions that were used in determining the fair value of the options are the following: share price NIS 59.29; annual standardized deviation 22.9%-24.9%; risk-free interest rate 1.36%-1.71%; exercise price NIS 63.13; projected dividend rate 0%; and life of the warrants 7-9 years. The CEO's entitlement to exercise the Restricted Shares will vest in four tranches, as follows: 50% of the total number of options on August 30, 2018, and 16.667% of the number of options on August 30 in each of the years 2019, 2020 and 2021. Exercise of the Restricted Shares is conditional on the CEO being employed by the Company on the vesting date and on adherence to at least 90% of the cumulative quarterly sales budget from the first full quarter after the grant date until the last full quarter before the vesting date (inclusive), in the functional currencies of the cash generating units in geographies outside of Israel, according to the budgets approved by the board of directors. The fair value of the Restricted Shares is estimated at NIS 59.29 per Restricted Share and was calculated according to the share price on the eve of approval by the meeting of shareholders of the Company. 5.1.2 On September 29, 2016 the Group's remuneration committee approved the grant of 93,332 warrants to two executives (46,666 warrants each) in lieu of 140,000 warrants (70,000 each) which had been allotted to them in 2014. Following are details on the fair value of the new warrants granted:
Number of options and
entitled
Fair value
Share price
Exercise price
Expected life
Annualized
standard deviation
Discount rate
Grant date employees NIS M NIS NIS Years % %
0.75 – 1.06 21.29 –
24.37 4.2 – 5.2 63.29 59.31 1.0 93,332 to 2 executives
September 29, 2016
Entitlement to exercise the warrants will crystallize in two equal tranches, on September 28 of each of the years 2018 and 2019.
The benefit arising from these grants will be recorded as an expense on the financial statements over the above vesting periods. Further, in respect of the swap described above
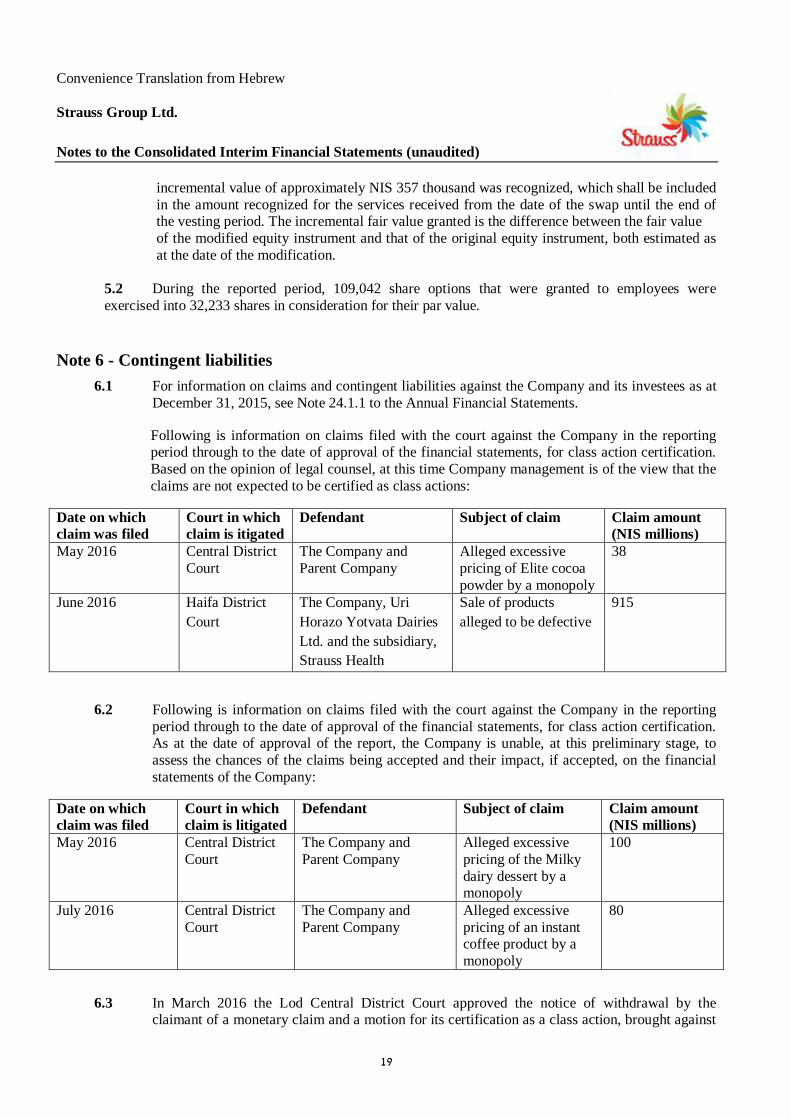
Convenience Translation from Hebrew Strauss Group Ltd.
Notes to the Consolidated Interim Financial Statements (unaudited)
19
incremental value of approximately NIS 357 thousand was recognized, which shall be included in the amount recognized for the services received from the date of the swap until the end of the vesting period. The incremental fair value granted is the difference between the fair value of the modified equity instrument and that of the original equity instrument, both estimated as at the date of the modification.
5.2 During the reported period, 109,042 share options that were granted to employees were exercised into 32,233 shares in consideration for their par value.
Note 6 - Contingent liabilities
6.1 For information on claims and contingent liabilities against the Company and its investees as at December 31, 2015, see Note 24.1.1 to the Annual Financial Statements.
Following is information on claims filed with the court against the Company in the reporting period through to the date of approval of the financial statements, for class action certification. Based on the opinion of legal counsel, at this time Company management is of the view that the claims are not expected to be certified as class actions:
Date on which claim was filed
Court in which claim is itigated
Defendant Subject of claim Claim amount (NIS millions)
May 2016 Central District Court
The Company and Parent Company
Alleged excessive pricing of Elite cocoa powder by a monopoly
38
June 2016 Haifa District Court
The Company, Uri Horazo Yotvata Dairies Ltd. and the subsidiary, Strauss Health
Sale of products alleged to be defective
915
6.2 Following is information on claims filed with the court against the Company in the reporting
period through to the date of approval of the financial statements, for class action certification. As at the date of approval of the report, the Company is unable, at this preliminary stage, to assess the chances of the claims being accepted and their impact, if accepted, on the financial statements of the Company:
Date on which claim was filed
Court in which claim is litigated
Defendant Subject of claim Claim amount (NIS millions)
May 2016 Central District Court
The Company and Parent Company
Alleged excessive pricing of the Milky dairy dessert by a monopoly
100
July 2016 Central District Court
The Company and Parent Company
Alleged excessive pricing of an instant coffee product by a monopoly
80
6.3 In March 2016 the Lod Central District Court approved the notice of withdrawal by the
claimant of a monetary claim and a motion for its certification as a class action, brought against

Convenience Translation from Hebrew Strauss Group Ltd.
Notes to the Consolidated Interim Financial Statements (unaudited)
20
the subsidiary Strauss Water Ltd., with no order for costs (see Note 24.1.2 to the Annual Financial Statements).
6.4 In November 2016 the Central District Court directed the abatement of a motion for class
certification of a claim in the amount of NIS 150 million, brought in June 2016 against the subsidiary, Uri Horazo Yotvata Dairies Ltd., in respect of the sale of allegedly defective products.
Note 7 - Equity-Accounted Investees 7.1 Concise information on material equity-accounted investees:
(a) Concise financial information on the financial position:
Sabra Dipping Company Três Corações Alimentos S.A
September 30 December 31 September 30 December 31 2016 2015 2015 2016 2015 2015 (Unaudited) (Audited) (Unaudited) (Audited)
NIS Millions
Current assets 337 307 336 995 804 773 Of which: Cash and cash equivalents 112 94 99 43 132 158 Non-current assets 686 690 691 627 450 468 Total assets 1,023 997 1,027 1,622 1,254 1,241 Current liabilities 219 268 257 616 500 405 Of which: Financial liabilities except Trade and other payables and provisions 100 164 140 241 263 192 Non-current liabilities 197 36 29 230 220 312 Of which: Financial liabilities except Trade and other payables and provisions 197 32 26 193 188 182
Total liabilities 416 304 286 846 720 717

Convenience Translation from Hebrew Strauss Group Ltd.
Notes to the Consolidated Interim Financial Statements
21
Note 7 - Equity-Accounted Investees (cont’d) 7.1 Concise information on material equity-accounted investees (cont’d)
(b) Concise financial information on operating results Sabra Dipping Company Três Corações Alimentos S.A For the nine months ended For the three months ended For the year
ended For the nine months
ended For the three months ended For the year
ended September 30 September 30 December 31 September 30 September 30 December 31 2016 2015 2016 2015 2015 2016 2015 2016 2015 2015 (Unaudited) (Unaudited) (Audited) (Unaudited) (Unaudited) (Audited) NIS Millions Income 1,095 1,078 371 384 1,422 2,377 2,262 924 710 2,982 Profit for the period 79 71 15 35 102 144 141 67 30 202 Other comprehensive income (loss) (28) 6 (22) 26 2 110 (285) (20) (144) (293) Total comprehensive income (loss) 51 77 (7) 61 104 254 (144) 47 (114) (91) Of which Depreciation and amortization 33 31 11 10 42 24 24 9 7 31 Interest income - - - - - 10 7 2 2 10 Interest expenses 5 7 2 2 9 26 17 10 6 25 Income tax expenses (1) 59 53 11 26 76 46 21 19 4 18
(1) Taxable income of Sabra Dipping Company is assessed in the holding company. S.E USA, Inc.

Convenience Translation from Hebrew Strauss Group Ltd.
Notes to the Consolidated Interim Financial Statements
22
Note 7 - Equity-Accounted Investees (cont'd) 7.2 The Group is enclosing to these interim consolidated financial statements the condensed interim
consolidated financial statements of Tres Coracoes Alimentos S.A, a joint venture in Brazil (50% ownership), accounted for under the equity method.
The investee's presentation currency is the Brazilian real.
7.3 The real-shekel exchange rate was 1.16 as of September 30, 2016.
The following are the average exchange rates and rates of change in the real exchange rates during the reporting period:
Real Exchange Rate
Average for the period Change in %
For the nine-month period ending on:
September 30, 2016 1.09 17.8
September 30, 2015 1.25 (33.0)
For the three month period ending on:
September 30, 2016 1.17 (2.7)
September 30, 2015 1.10 (19.2)
For the year ending December 31, 2015 1.19 (32.9)
Note 8 - Financial Instruments
8.1 Financial instruments measured at fair value for disclosure purposes only The carrying amount of the cash and cash equivalents, short and long term investments, trade receivables, other receivables and debit balances, trade payables and other payables and credit balances. There was no material change in the fair value (as stated in the annual financial statements) of long term loans. Presented below are the carrying amounts (including accrued interest) and fair values of the Company's debentures, based on the prices of the Tel Aviv Stock Exchange:
September 30, 2016 September 30, 2015 December 31, 2015 Carrying
amount
Fair value Carrying amount
Fair value
Carrying amount
Fair value
(Unaudited) (Audited) NIS millions
Series B Debentures 359 368 543 567 544 562 Series D Debentures 476 528 478 526 483 537

Convenience Translation from Hebrew Strauss Group Ltd.
Notes to the Consolidated Interim Financial Statements
23
Note 8 - Financial Instruments (cont'd) 8.2 Fair value hierarchy of financial instruments measured at fair value The different levels are defined as follows:
• Level 1: quoted prices (unadjusted) in active market for similar instruments. • Level 2: Inputs other than quoted prices within level 1. • Level 3: inputs that are not based on observable market data.
September 30, 2016 September 30, 2015 December 31, 2015 Level 1 Level 2 Level 3 Level 1 Level 2 Level 3 Level 1 Level 2 Level 3 Unaudited Audited NIS million
Financial assets (liabilities) Marketable securities 47 - - 46 - - 45 - - Receivables- derivatives 20 2 - 4 11 - 9 6 - Payables- derivatives (6) (33) - (29) (32) - (9) (36) - Available for sale financial asset 27 - - 27 - - 26 - - Option to purchase shares (1) - - - - - 6 - - 5 88 (31) - 48 (21) 6 71 (30) 5
(1) Option to purchase shares in an equity-accounted investee. The fair value of the option is measured using the Monte Carlo simulation technique based, inter alia, on the investee's value and projected income as well as on Peer Company's volatility. The revaluation is included in the statement of income under financing income.
For details regarding the determination of the fair value of derivative financial instruments measured at level 2, see Note 28.7.2.1 to the Annual Financial Statements.
Note 9 - Subsequent Events
9.1 On November 15, 2016 a company held by the group declared a dividend distribution in the amount of 25 million NIS. The part attributed to the company is about 13 million NIS.
9.2 For information on a claim closed after the statement of financial position date, see Note 6.4.

Strauss Group Ltd. Annex "B"
SEPARATE FINANCIAL INFORMATION AS AT September 30, 2016
Table of Contents: Page Auditors' Special Report 2 Information Pertaining to Financial Position 3 Information Pertaining to Statements of Income 5 Information Pertaining to Comprehensive Income 6 Information Pertaining to Cash Flows 7 Additional Information 9

Somekh Chaikin
KPMG Millennium Tower
17 Ha’arba’a Street, PO Box 609
Tel Aviv 6100601, Israel
+972 3 684 8000
Somekh Chaikin, an Israeli partnership and a member firm of the KPMG network of independent member firms affiliated with KPMG International Cooperative (“KPMG International”), a Swiss entity.
2
To the Shareholders of Strauss Group Ltd.
Special Auditors' Report on Separate Financial Information According to Regulation 38D of the Securities Regulations (Periodic and Immediate Reports) – 1970
We have reviewed the separate financial information presented in accordance with Regulation 38D of the Securities Regulations (Periodic and Immediate Reports) – 1970 of Strauss Group Ltd. (hereinafter – the "Company") as of September 30, 2016 and for the nine and three month periods then ended .The separate financial information is the responsibility of the Company's Board of Directors and its Management. Our responsibility is to express an opinion on the separate financial information based on our review.
We did not reviewed the financial statements of equity accounted investees the investment in which amounted to approximately NIS 20.2 million as of September 30, 2016, and the Group’s share in their profits amounted to approximately NIS 6.8 million and NIS 2.3 million for the nine and three month periods then ended, respectively.
Scope of Review
We conducted our review in accordance with Standard on Review Engagements 1, "Review of Interim Financial Information Performed by the Independent Auditor of the Entity" of the Institute of Certified Public Accountants in Israel. A review of interim financial information consists of making inquiries, primarily of persons responsible for financial and accounting matters, and applying analytical and other review procedures.
A review is substantially less in scope than an audit conducted in accordance with generally accepted auditing standards in Israel and consequently does not enable us to obtain assurance that we would become aware of all significant matters that might be identified in an audit. Accordingly, we do not express an audit opinion.
Conclusion
Based on our review and the review reports of other auditors, nothing has come to our attention that causes us to believe that the accompanying interim financial information does not follow, in all material respects, the disclosure directives of Section D of the Securities Regulations (Periodic and Immediate Reports),1970.
Somekh Chaikin
Certified Public Accountants (Isr.)
November 21, 2016

Strauss Group Ltd.
3
INFORMATION PERTAINING TO FINANCIAL POSITION
September 30 September 30 December 31 2016 2015 2015 (Unaudited) (Unaudited) (Audited) NIS Millions
Assets Cash and cash equivalents 126 74 232 Securities and deposits 23 29 30 Trade receivables 215 211 180 Income tax receivables 20 27 4 Other receivables and debit balances 34 42 28 Investee receivables 126 187 330 Inventory 102 123 142 Dividend receivable - 136 - Assets held for sale 36 36 62 Total current assets 682 865 1,008 Non-current assets Investments in investees 1,868 1,721 1,565 Other investments and long-term debit balances 638 691 618 Fixed assets 941 941 959 Intangible assets 53 61 56 Investment property - 23 - Total non-current assets 3,500 3,437 3,198 Total assets 4,182 4,302 4,206
Ofra Strauss Gadi Lesin Shahar Florence
Chairperson of the Board of Directors
Chief Executive Officer Chief Financial Officer
Date of approval of the separate financial information: November 21, 2016 The attached information is an integral part of the separate financial information.
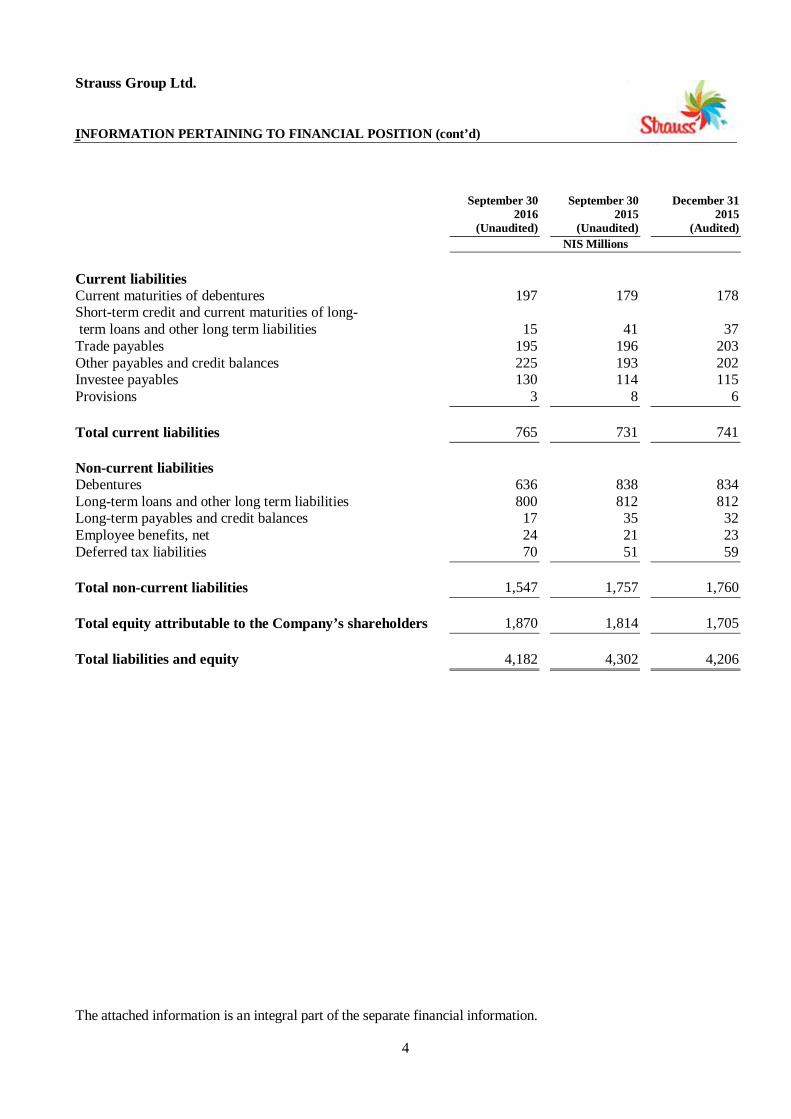
Strauss Group Ltd.
4
INFORMATION PERTAINING TO FINANCIAL POSITION (cont’d)
September 30 September 30 December 31 2016 2015 2015 (Unaudited) (Unaudited) (Audited) NIS Millions
Current liabilities Current maturities of debentures 197 179 178 Short-term credit and current maturities of long- term loans and other long term liabilities 15 41 37 Trade payables 195 196 203 Other payables and credit balances 225 193 202 Investee payables 130 114 115 Provisions 3 8 6 Total current liabilities 765 731 741 Non-current liabilities Debentures 636 838 834 Long-term loans and other long term liabilities 800 812 812 Long-term payables and credit balances 17 35 32 Employee benefits, net 24 21 23 Deferred tax liabilities 70 51 59 Total non-current liabilities 1,547 1,757 1,760 Total equity attributable to the Company’s shareholders 1,870 1,814 1,705 Total liabilities and equity 4,182 4,302 4,206 The attached information is an integral part of the separate financial information.

Strauss Group Ltd.
5
INFORMATION PERTAINING TO STATEMENTS OF INCOME
For the year For the nine months ended For the three months ended ended September 30 September 30 September 30 September 30 December 31 2016 2015 2016 2015 2015 (Unaudited) (Audited) NIS millions
Sales 785 673 262 256 904 Cost of sales 476 419 165 164 555 Gross profit 309 254 97 92 349 Selling and marketing expenses 198 154 67 50 226 General and administrative expenses 41 18 17 5 36 239 172 84 55 262 Operating profit before other expenses 70 82 13 37 87 Other income 2 1 1 - 5 Other expenses (8) (17) (1) (9) (18) Other expenses, net (6) (16) - (9) (13) Operating profit (loss) 64 66 13 28 74 Financing income 20 24 7 19 36 Financing expenses (74) (72) (31) (29) (99) Financing expenses, net (54) (48) (24) (10) (63) profit (loss) before taxes on income 10 18 (11) 18 11 Taxes on income (28) (23) (5) (10) (28) Loss after taxes on income (18) (5) (16) 8 (17) Share in profit of investees 260 197 85 60 274 Income for the year attributable to the shareholders of the Company 242 192 69 68 257
The attached information is an integral part of the separate financial information.

Strauss Group Ltd.
6
INFORMATION PERTAINING TO COMPREHENSIVE INCOME For the year For the nine months ended For the three months ended ended September 30 September 30 September 30 September 30 December 31 2016 2015 2016 2015 2015 (Unaudited) (Audited) NIS millions Income for the period attributable to the shareholders of the Company 242 192 69 68 257 Other comprehensive income (loss) items that will be transferred to profit or loss in subsequent periods:
Other comprehensive income (loss) from investees 61 (212) (29) (60) (289) Total other comprehensive income (loss) items that will be transferred to profit or loss, net of tax
61
(212)
(29)
(60)
(289) Comprehensive income (loss) for the period attributable to the shareholders of the Company
303
(20)
40
8
(32) The attached information is an integral part of the separate financial information.

Strauss Group Ltd.
7
INFORMATION PERTAINING TO CASH FLOWS For the year For the nine months ended For the three months ended ended September 30 September 30 September 30 September 30 December 31 2016 2015 2016 2015 2015 (Unaudited) (Audited) NIS millions Cash flows from operating activities Income for the year attributable to the shareholders of the Company 242 192 69 68 257 Adjustments: Depreciation 42 32 14 13 46 Amortization of intangible assets and deferred expenses 10 10 3 3 18 Other expenses (income), net (1) 2 - 1 (4) Expenses in respect of share- based payment 10 9 4 3 12 Share in gain of investees (260) (197) (85) (60) (274) Financing expenses, net 54 48 24 10 63 Income tax expense (Income) 28 23 5 10 28 Change in inventory 40 31 24 21 12 Change in trade and other receivables (38) (20) (29) (52) 24 Change in investee receivables 133 (36) 36 (5) (118) Change in long-term receivables - (15) - (20) (7) Change in trade and other payables 35 (21) 14 7 (51) Change in investee payables 15 (31) (4) 10 (30) Change in employee benefits - (1) (1) - 1 Interest paid (75) (83) (34) (38) (89) Interest received 1 2 1 1 20 Income tax received (paid), net (38) (10) (7) (3) 16 Net cash flows from (used in) operating activities 198 (65) 34 (31) (76) Cash flows from investing activities Sale (purchase)of marketable securities and deposits, net
6 50
- -
49
Proceeds from sale of fixed assets 25 4 1 - 4 Acquisition of fixed assets (38) (65) (11) (21) (90) Investment in intangible assets (7) (11) (3) (3) (13) Repayment of deposits and long-term loans 7 3 3 1 5 Long-term loans granted (7) (3) (1) (1) (3) Dividends from investees 65 45 - 1 340 Cash received in respect of investing activities with investees 90 6 87 - 35 Cash paid in respect of investing activities with investees (83) (60) (7) (23) (82) Net cash flows from (used in) investing activities 58 (31) 69 (46) 245 The attached information is an integral part of the separate financial information.

Strauss Group Ltd.
8
INFORMATION PERTAINING TO CASH FLOWS (cont’d) For the year For the nine months ended For the three months ended ended September 30 September 30 September 30 September 30 December 31 2016 2015 2016 2015 2015 (Unaudited) (Audited) NIS millions Cash flows from financing activities Repayment of debentures and long-term loans (212) (204) (20) (11) (211) Dividends paid (150) - (150) - (100) Net cash flows used in financing activities (362) (204) (170) (11) (311) Net increase (decrease) in cash and cash equivalents (106) (300) (67) (88) (142) Cash and cash equivalents as at January 1 232 374 193 162 374 Cash and cash equivalents as at end of period 126 74 126 74 232 The attached information is an integral part of the separate financial information.

Strauss Group Ltd.
9
Note 1 - Reporting Rules and Accounting Policies
1.1 General
1.1.1 The Company's business comprises the activity of the Group Headquarters and the Group's confectionery operation in Israel, which includes the development, manufacture and marketing of branded candy products. In addition, since the third quarter of 2015, the company operations also include the operations of the Group's salads in Israel.
1.1.2 The Interim Separate Financial Information of Strauss Group Ltd. (hereinafter: the "Company")
is presented in accordance with Regulation 38D of the Securities Regulations (Periodic and Immediate Reports), 1970 and the Tenth Addendum to the said regulations with respect to the separate financial information of the corporation. This financial information should be read in conjunction with the Financial Information as at and for the year ended on December 31, 2015, and in conjunction with the interim consolidated financial statements as at September 30, 2016 (hereinafter: the "Interim Consolidated Financial Statements").
The accounting policy applied in this Condensed Interim Separate Financial Information is in accordance with the accounting policy rules described in the Separate Financial Information as at December 31, 2015.
1.1.3 In this Separate Financial Information – the Company and investee companies as defined in Note 1 to the Consolidated Financial Statements of the Company as at December 31, 2015.
1.1.4 The Interim Separate Financial Information is presented in Shekels, which is the Company's functional currency. The financial information is presented in NIS millions and rounded to the nearest million.
Note 2 - Seasonality
Confectionery sales in Israel are characterized by seasonality and are generally higher in the first quarter of the year. Seasonality is mainly affected by the winter months, when greater consumption of chocolate products is typical, as well as by increased consumption of confectionery products as Passover approaches.
Note 3 - Material Events during the Reported Period
For information on material events during the Reported Period see Note 4 to the Consolidated Interim Financial Statements.
Note 4 – Share-Based Payments
For information on share based payment, see Note 5 to the Consolidated Interim Financial Statements.
Note 5 – Contingent liabilities
For information on contingent liabilities, see Note 6 to the Consolidated Interim Financial Statements.

Strauss Group Ltd.
10
Note 6 - Financial Instruments
6.1 Fair value of financial instruments
For information on the fair value of financial instruments, see Note 8.1 to the Consolidated Interim Financial Statements.
6.2 Fair value hierarchy For information on the Fair value hierarchy of financial instruments, see Note 8.2 to the Consolidated Interim Financial Statements.
Note 7 – Events after the Reporting Date
For information on events after the reporting date, see Note 9 to the Consolidated Interim Financial Statements.

STRAUSS GROUP LTD. ISOX DECLARATION
Quarterly Report on the Effectiveness of Internal Control over Financial Reporting and Disclosure Pursuant to Regulation 38c(a)
Management, under the supervision of the Board of Directors of Strauss Group Ltd. (the “Corporation”), is responsible for determining and maintaining proper internal control over financial reporting and disclosure within the Corporation. For this purpose, the members of Management are: 1. Gadi Lesin, President & CEO; 2. Giyora Bar Dea, Deputy Chief Executive Officer; 3. Shahar Florence, EVP & CFO; 4. Mike Avner, EVP, CLO, Company Secretary; 5. Nurit Tal Shamir, SVP HR; Internal control over financial reporting and disclosure includes controls and procedures existing within the Corporation, which were planned by or under the supervision of the CEO and the most senior financial officer, or by anyone actually performing such functions, under the supervision of the Board of Directors of the Corporation, which are designed to provide a reasonable level of assurance regarding the reliability of financial reporting and preparation of the reports according to the provisions of the law, and to ensure that information which the Corporation is required to disclose in reports released thereby according to the law is gathered, processed, summarized and reported within the time frames and in the format set forth in the law. Internal control includes, inter alia, controls and procedures which were planned to ensure that information which the Corporation is required to disclose as aforesaid, is gathered and transferred to the Management of the Corporation, including the CEO and the most senior financial officer, or anyone actually performing such functions, in order to enable timely decision-making in reference to the disclosure requirements. Due to its inherent limitations, internal control over financial reporting and disclosure is not designed to provide full assurance that misrepresentation or omission of information in the reports is prevented or discovered. In the Annual Report on the Effectiveness of Internal Control over Financial Reporting and Disclosure, which was attached to the Periodic Report for the period ended December 31, 2015 (hereinafter: the “Latest Annual Report on Internal Control”), the Board of Directors and Management evaluated internal control in the Corporation. Based on this evaluation, the Board of Directors and Management of the Corporation reached the conclusion that the above mentioned internal control as at December 31, 2015 is effective. Until the reporting date the Board of Directors and Management were not informed of any event or matter that are able to alter the evaluation of the effectiveness of financial control, as presented in the Latest Annual Report on Internal Control. As at the reporting date, based on the evaluation of the effectiveness of internal control in the Latest Annual Report on Internal Control, and based on information brought to the knowledge of Management and the Board of Directors as mentioned above, internal control is effective.
Statement of the Chief Executive Officer Pursuant to Regulation 38c(d)(1): Managers' Statement Statement of the Chief Executive Officer I, Gadi Lesin, warrant that: (1) I have reviewed the quarterly report of Strauss Group Ltd. (hereinafter: the “Corporation”) for the third quarter of 2016 (hereinafter: the “Reports”).
(2) To my knowledge, the Reports do not contain any misrepresentation of a material fact, nor omit any representation of a material fact which is required for the representations included therein, in view of the circumstances in which such representations were included, not to be misleading in reference to the period of the Reports. (3) To my knowledge, the Financial Statements and other financial information included in the Reports adequately reflect, from all material respects, the financial position, results of operations and cash flows of the Corporation for the dates and periods to which the Reports relate. (4) I have disclosed to the Corporation’s auditor and to the Corporation’s Board of Directors and the Audit and Financial Statement Committees, based on my most current assessment of the internal control over financial reporting and disclosure: a. Any and all significant flaws and material weaknesses in the determination or operation of internal control over financial reporting and disclosure, which may reasonably adversely affect the Corporation’s ability to gather, process, summarize or report financial information in a manner which casts doubt on the reliability of the financial reporting and preparation of the Financial Statements in accordance with the provisions of the law; and - b. Any fraud, either material or immaterial, which involves the CEO or anyone directly subordinate to him or which involves other employees who play a significant role in the internal control over financial reporting and disclosure. (5) I, either alone or jointly with others in the Corporation: a. Have determined controls and procedures, or confirmed the determination and existence of controls and procedures under my supervision, which are designed to ensure that material information in reference to the Corporation, including consolidated companies thereof as defined in the Securities Regulations (Annual Financial Statements), 2010, is presented to me by others within the Corporation and the consolidated companies, particularly during the period of preparation of the Reports; and – b. Have determined controls and procedures or confirmed the determination and existence of controls and procedures under my supervision, which are designed to provide reasonable assurance of the reliability of financial reporting and preparation of the Financial Statements according to the provisions of the law, including in accordance with GAAP. c. Was not informed of any event or matter occurring in the period between the date of the latest report (the Periodic Report as at December 31, 2015) and the date of the

Reports, which could alter the conclusion of the Board of Directors and Management regarding the effectiveness of the Corporation's internal control over financial reporting and disclosure. The aforesaid does not derogate from my responsibility or from the responsibility of any other person pursuant to any law. November 21, 2016 _________________________ Gadi Lesin, President & CEO

Statement of the Most Senior Financial Officer Pursuant to Regulation 38c(d)(2): Managers' Statement Statement of the Most Senior Financial Officer I, Shahar Florence, warrant that: (1) I have reviewed the Interim Financial Statements and the other financial information included in the interim reports of Strauss Group Ltd. (hereinafter: the “Corporation”) for the third quarter of 2016 (hereinafter: the “Reports” or the “Interim Reports”). (2) To my knowledge, the Interim Financial Statements and other financial information contained in the Interim Reports do not contain any misrepresentation of a material fact, nor omit any representation of a material fact which is required for the representations included therein, in view of the circumstances in which such representations were included, not to be misleading in reference to the period of the Reports. (3) To my knowledge, the Financial Statements and other financial information included in the Interim Reports adequately reflect, from all material respects, the financial position, results of operations and cash flows of the Corporation for the dates and periods to which the Reports relate. (4) I have disclosed to the Corporation’s auditor and to the Corporation’s Board of Directors and the Audit and Financial Statement Committees, based on my most current assessment of the internal control over financial reporting and disclosure:
a. Any and all significant flaws and material weaknesses in the determination or operation of internal control over financial reporting and disclosure to the extent that
it relates to the Interim Financial Statements and to the other financial information included in the Interim Reports, which may reasonably adversely affect the Corporation’s ability to gather, process, summarize or report financial information in a manner which casts doubt on the reliability of the financial reporting and preparation of the Financial Statements in accordance with the provisions of the law; and –
b. Any fraud, either material or immaterial, which involves the CEO or anyone directly subordinate to him or which involves other employees who play a significant role in the internal control over financial reporting and disclosure.
(5) I, either alone or jointly with others in the Corporation:
a. Have determined controls and procedures, or confirmed the determination and existence of controls and procedures under our supervision, which are designed to ensure that material information in reference to the Corporation, including companies thereof as defined in the Securities Regulations (Annual Financial Statements), 2010, is presented to me by others within the Corporation and the consolidated companies, particularly during the period of preparation of the Reports; and -
b. Have determined controls and procedures or confirmed the determination and
existence of controls and procedures under my supervision, which are designed to provide reasonable assurance of the reliability of financial reporting and preparation

of the Financial Statements according to the provisions of the law, including in accordance with GAAP.
c. Was not informed of any event or matter occurring in the period between the date of
the latest report (the Periodic Report as at December 31, 2015) and the date of the Reports that refers to the Interim Financial Statements and to any other financial information included in the Interim Report, which I estimate could alter the conclusion of the Board of Directors and Management regarding the effectiveness of the Corporation's internal control over financial reporting and disclosure.
The aforesaid does not derogate from my responsibility or from the responsibility of any other person pursuant to any law. November 21, 2016 _________________________ Shahar Florence, EVP & CF

STRAUSS GROUP LTD.
Inclusion of the financial
statements of an investee pursuant
to Regulation 44 of the Securities
Regulations, 1970

KPDS 157917
Três Corações Alimentos S.A. Condensed consolidated
interim financial statements as of
and for the three and nine month
periods ended 30 September 2016
and 2015 and independent auditors’
limited review report on condensed
consolidated interim
financial statements

Três Corações Alimentos S.A. Condensed consolidated interim financial statements as
of and for the three and nine month periods ended 30 September 2016 and 2015 and independent auditors’
limited review report on condensed consolidated interim financial statements
2
Contents Independent auditors’ report on review of interim financial statements 3
Consolidated interim statements of financial position 5
Consolidated interim statements of income 6
Consolidated interim statements of comprehensive income 7
Consolidated interim statements of changes in equity 8
Consolidated interim statements of cash flows 10
Notes to the condensed consolidated interim financial statements 11

KPMG Auditores Independentes, uma sociedade simples brasileira e firma-membro da rede KPMG de firmas-membro independentes e afiliadas à
KPMG International Cooperative (“KPMG International”), uma entidade suíça.
KPMG Auditores Independentes, a Brazilian entity and a member firm of the KPMG network of independent member firms affiliated
with KPMG International Cooperative (“KPMG International”), a Swiss entity.
3
KPMG Auditores Independentes
Rua Desembargador Leite Albuquerque, 635
Sala 501 e 502 - Aldeota
60150-150 - Fortaleza/CE - Brasil
Telefone +55 (85) 3307-5100, Fax +55 (85) 3307-5101
www.kpmg.com.br
Independent auditors’ report on review of interim financial
statements
To
Directors and shareholders of Três Corações Alimentos S.A.
Eusébio - Ceará
Introduction
We have reviewed the accompanying 30 September 2016 condensed consolidated interim financial
statements of Três Corações Alimentos S.A. (“the Company”), which comprises:
the condensed consolidated statement of financial position as at 30 September 2016;
the condensed consolidated statement of income and other comprehensive income for the three
and nine month periods ended 30 September 2016;
the condensed consolidated statement of changes in equity for the three and nine month periods
ended 30 September 2016;
the condensed consolidated statement of cash flows for the three and nine month period ended
30 September 2016; and
the notes to the condensed consolidated interim financial statements.
Management is responsible for the preparation and fair presentation of these condensed consolidated
interim financial statements in accordance with IAS 34‘Interim Financial Reporting’. Our
responsibility is to express a conclusion on these condensed consolidated interim financial statements based on our review.
Scope of Review
We conducted our review in accordance with the International Standard on Review Engagements
2410, “Review of Interim Financial Statement Performed by the Independent Auditor of the Entity”.
A review of interim financial statements consists of making inquiries, primarily of persons
responsible for financial and accounting matters, and applying analytical and other review
procedures. A review is substantially less in scope than an audit conducted in accordance with
International Standards on Auditing and consequently does not enable us to obtain assurance that we
would become aware of all significant matters that might be identified in an audit. Accordingly, we
do not express an audit opinion.
Conclusion

KPMG Auditores Independentes, uma sociedade simples brasileira e firma-membro da rede KPMG de firmas-membro independentes e afiliadas à
KPMG International Cooperative (“KPMG International”), uma entidade suíça.
KPMG Auditores Independentes, a Brazilian entity and a member firm of the KPMG network of independent member firms affiliated
with KPMG International Cooperative (“KPMG International”), a Swiss entity.
4
Based on our review, nothing has come to our attention that causes us to believe that the
accompanying 30 September 2016 condensed consolidated interim financial statements are not
prepared in all material respects in accordance with IAS 34, ‘Interim Financial Reporting’.
Fortaleza, 04 November 2016
KPMG Auditores Independentes
CRC 2SP014428/O-6 João Alberto da Silva Neto
CRC RS-048980/O-0 T-CE

Três Corações Alimentos S.A. Condensed consolidated interim financial statements as
of and for the three and nine month periods ended on 30 September 2016 and 2015and independent auditors’
limited review report on condensed consolidated interim financial statements
5
Três Corações Alimentos S.A.
Consolidated interim statements of financial position as of 30 September 2016 and 31 December 2015
(In thousand of Brazilian Reais)
30 September 31 December 30 September 31 December
Assets 2016 2015 Liabilities 2016 2015
(Reclassified) (Reclassified)
Current Current
Cash and cash equivalents 37,307 159,996 Short term loans 207,743 194,222
Deposits 1,977 3,478 Trade payables 113,485 101,180
Trade receivables 370,550 304,652 Income tax payables 5,789 1,056
Inventories 399,439 277,283 Employees and other payroll related liabilities 50,630 33,876
Recoverable taxes 23,531 18,813 Proposed dividends 100,001 100,001
Income tax receivable 7,181 6,594 Payable taxes 17,337 16,371
Derivative instruments 376 - Other current liabilities 35,521 23,239
Other current assets 16,726 14,117
530,506 469,945
857,087 784,933 Non-current
Non-current Long term loans 166,610 184,567
Judicial deposits 8,365 8,799 Proposed dividends - 34,548
Other non-current assets 9,965 10,135 Other non-current liabilities 2,511 -
Deferred tax assets 14,668 23,324 Deferred tax liabilities 9,851 11,424
Investments 4,487 - Provision for legal proceedings 19,334 20,688
Fixed assets 234,242 231,134
Intangible assets 268,773 195,219 198,306 251,227
540,500 468,611 Equity
Share capital 272,370 272,370
Translation reserve (96,660) (105,500)
Retained earnings 493,065 365,502
668,775 532,372
1,397,587 1,253,544 1,397,587 1,253,544
0 0
The accompanying notes are an integral part of these consolidated financial statements.

Três Corações Alimentos S.A. Condensed consolidated interim financial statements as
of and for the three and nine month periods ended on 30 September 2016 and 2015and independent auditors’
limited review report on condensed consolidated interim financial statements
6
Três Corações Alimentos S.A.
Consolidated Interim Statements of Income
Nine and three month periods ended 30 September 2016 and 2015
(In thousand of Brazilian Reais)
2016 2015 2016 2015
Revenue 2,170,441 1,825,264 787,293 647,547
Cost of sales (1,581,548) (1,284,131) (565,362) (462,244)
Gross profit 588,893 541,133 221,931 185,303
Selling and marketing expenses (338,836) (327,795) (117,297) (117,656)
General and administrative expenses (65,544) (58,309) (24,477) (21,164)
Equity method (118) - (115) -
Other income (expenses), net 383 (145) 155 (224)
Operating profit 184,778 154,884 80,197 46,259
Finance income 9,721 5,012 2,098 1,873
Finance expenses (23,051) (31,846) (9,658) (17,043)
Profit before income tax 171,448 128,050 72,637 31,089
Income tax expenses (41,590) (16,764) (15,884) (3,804)
Profit for the period 129,858 111,286 56,753 27,285
The accompanying notes are an integral part of these consolidated financial statements.
Three months period ended
30 September
Nine months period ended
30 September

Três Corações Alimentos S.A. Condensed consolidated interim financial statements as
of and for the three and nine month periods ended on 30 September 2016 and 2015and independent auditors’
limited reviewreport on condensed consolidated interim financial statements
7
Três Corações Alimentos S.A.
Consolidated Interim Statements of Comprehensive Income
Nine and three month periods ended 30 September 2016 and 2015
(In thousand of Brazilian Reais)
2016 2015 2016 2015
Profit for the period 129,858 111,286 56,753 27,285
Foreign currency translation differences 8,840 (29,803) 1,550 (16,501)
Comprehensive income for the period 138,698 81,483 58,303 10,784
The accompanying notes are an integral part of these consolidated financial statements.
Three months period ended
30 September
Nine months period ended
30 September

Três Corações Alimentos S.A. Condensed consolidated interim financial statements as
of and for the three and nine month periods ended on 30 September 2016 and 2015and independent auditors’
limited reviewreport on condensed consolidated interim financial statements
8
Três Corações Alimentos S.A.
Consolidated Interim Statements of Changes in Equity
Three month periods ended 30 September 2016 and 2015
(In thousand of Brazilian Reais)
Share Legal Tax Profit to Translation Accumulated
capital reserve incentives distribute adjustments profit Total
Balance as of 30 June, 2015 272,370 28,226 138,984 175,726 (81,876) - 533,430
Profit for the period - - - - - 27,285 27,285
Other comprehensive gain:
Foreign currency translation differences - - - - (16,501) - (16,501)
Total other comprehensive gain: - - - - (16,501) 27,285 10,784
Internal equity changes
State VAT and Federal tax incentives - - 8,376 - - (8,376) -
Profit destination:
Legal reserve - 1,364 - - - (1,364) -
Reserve for profit to be distributed - - - 17,545 - (17,545) -
- 1,364 8,376 17,545 - (27,285) -
Balance as of 30 September, 2015 272,370 29,590 147,360 193,271 (98,377) - 544,214
Balance as of 30 June, 2016 272,370 36,371 177,125 223,666 (98,210) - 611,322
Profit for the period - - - - - 56,753 56,753
Other comprehensive gain:
Foreign currency translation differences - - - - 1,550 - 1,550
Total other comprehensive gain: - - - - 1,550 56,753 58,303
Internal equity changes
State VAT and Federal tax incentives - - 10,673 - - (10,673) -
Profit destination:
Legal reserve - 2,838 - - - (2,838) -
Revaluation reserve adjustment in investee - - - (850) - - (850)
Reserve for profit to be distributed - - - 43,242 - (43,242) -
- 2,838 10,673 42,392 - (56,753) (850)
Balance as of 30 September, 2016 272,370 39,209 187,798 266,058 (96,660) - 668,775
The accompanying notes are an integral part of these consolidated financial statements.
Retained earnings

Três Corações Alimentos S.A. Condensed consolidated interim financial statements as
of and for the three and nine month periods ended on 30 September 2016 and 2015and independent auditors’
limited reviewreport on condensed consolidated interim financial statements
9
Três Corações Alimentos S.A.
Consolidated Statements of Changes in Equity
Nine month periods ended 30 September 2016 and 2015
(In thousand of Brazilian Reais)
Share Legal Tax Profit to Translation Accumulated
capital reserve incentives distribute adjustments profit Total
Balance as of 31 December, 2014 271,669 24,026 115,667 122,669 (68,574) - 465,457
Dividends distributed relative to 2014 - - - (2,726) - - (2,726)
Profit for the period - - - - - 111,286 111,286
Other comprehensive gain:
Foreign currency translation differences - - - - (29,803) - (29,803)
Total other comprehensive gain: - - - - (29,803) 111,286 81,483
Internal equity changes
Capitalization of tax incentive 701 - (701) - - - -
State VAT and Federal tax incentives - - 32,394 - - (32,394) -
Profit destination:
Legal reserve - 5,564 - - - (5,564) -
Reserve for profit to be distributed - - - 73,328 - (73,328) -
701 5,564 31,693 73,328 - (111,286) -
Balance as of 30 September, 2015 272,370 29,590 147,360 193,271 (98,377) - 544,214
Balance as of 31 December, 2015 272,370 32,716 157,782 175,004 (105,500) - 532,372
Dividends distributed - - - (1,445) - - (1,445)
Profit for the period - - - - - 129,858 129,858
Other comprehensive loss:
Foreign currency translation differences - - - - 8,840 - 8,840
Total other comprehensive loss: - - - - 8,840 129,858 138,698
Internal equity changes
State VAT and Federal tax incentives - - 30,016 - - (30,016) -
Profit destination:
Legal reserve - 6,493 - - - (6,493) -
Revaluation reserve adjustment in investee - - - (850) - - (850)
Reserve for profit to be distributed - - - 93,349 - (93,349) -
- 6,493 30,016 92,499 - (129,858) (850)
Balance as of 30 September, 2016 272,370 39,209 187,798 266,058 (96,660) - 668,775
The accompanying notes are an integral part of these consolidated financial statements.
Retained earnings

Três Corações Alimentos S.A. Condensed consolidated interim financial statements as
of and for the three and nine month periods ended on 30 September 2016 and 2015and independent auditors’
limited reviewreport on condensed consolidated interim financial statements
10
Três Corações Alimentos S.A.
Consolidated Interim Statements of Cash Flows
Nine and three month periods ended 30 September 2016 and 2015
(In thousand of Brazilian Reais)
2016 2015 2016 2015
(Reclassified) (Reclassified)
Cash flows from operating activities
Profit for the period 129,858 111,286 56,753 27,285
Adjustments for:
Depreciation and amortization 21,936 18,992 7,618 6,603
Provision for legal proceedings (1,354) (402) (136) (488)
Equivalence 118 - 115 -
Other expenses (income), net (383) 145 (155) 224
Financing expenses, net 13,330 26,834 7,560 15,170
Income tax expenses 41,590 16,764 15,884 3,804
Interest paid, net (16,909) (8,870) (8,293) (3,864)
Income tax paid (31,211) (20,259) (18,215) (7,319)
156,975 144,490 61,131 41,415
Change in:
Trade receivables (67,863) 8,925 8,514 37,075
Inventories (116,275) (101,563) (114,100) (85,445)
Recoverable and payable taxes, net (3,752) 681 (6,335) 4,390
Derivatives, net (376) - (376) -
Judicial deposits 434 (425) (123) (134)
Trade payables 2,218 14,443 (6,416) (2,148)
Employees and other payroll related liabilities 16,754 11,576 4,636 1,070
Other current and non-current assets and liabilities, net (5,998) (13,323) (7,448) (3,554)
Net cash flows provided by (used in) operating activities (17,883) 64,804 (60,517) (7,331)
Cash flows from investing activities
Change in deposits 1,223 991 3,765 (1,668)
Payment for acquisition of operations (53,582) (1,980) - -
Share capital increase in joint-venture (4,605) - - -
Proceeds from sales of fixed assets 1,529 2,357 361 388
Acquisition of fixed assets (26,935) (28,845) (7,230) (9,661)
Investments in intangible assets (3,701) (4,341) (1,340) (2,537)
Long-term loans to related parties - (33) - -
Net cash flows used in investing activities (86,071) (31,851) (4,444) (13,478)
Cash flows from financing activities
Proceeds from loans 280,276 258,347 114,318 214,709
Repayment of loans (263,018) (242,081) (72,194) (78,903)
Dividend paid (35,993) (2,726) - -
Net cash flows provided by (used in) financing activities (18,735) 13,540 42,124 135,806
Net increase (decrease) in cash and cash equivalents (122,689) 46,493 (22,837) 114,997
Net increase (decrease) in cash and cash equivalents
Cash and cash equivalents as of beginning of period 159,996 87,775 60,144 19,271
Cash and cash equivalents as of end of period 37,307 134,268 37,307 134,268
(122,689) 46,493 (22,837) 114,997
The accompanying notes are an integral part of these consolidated financial statements.
Three months period ended
30 September
Nine months period ended
30 September
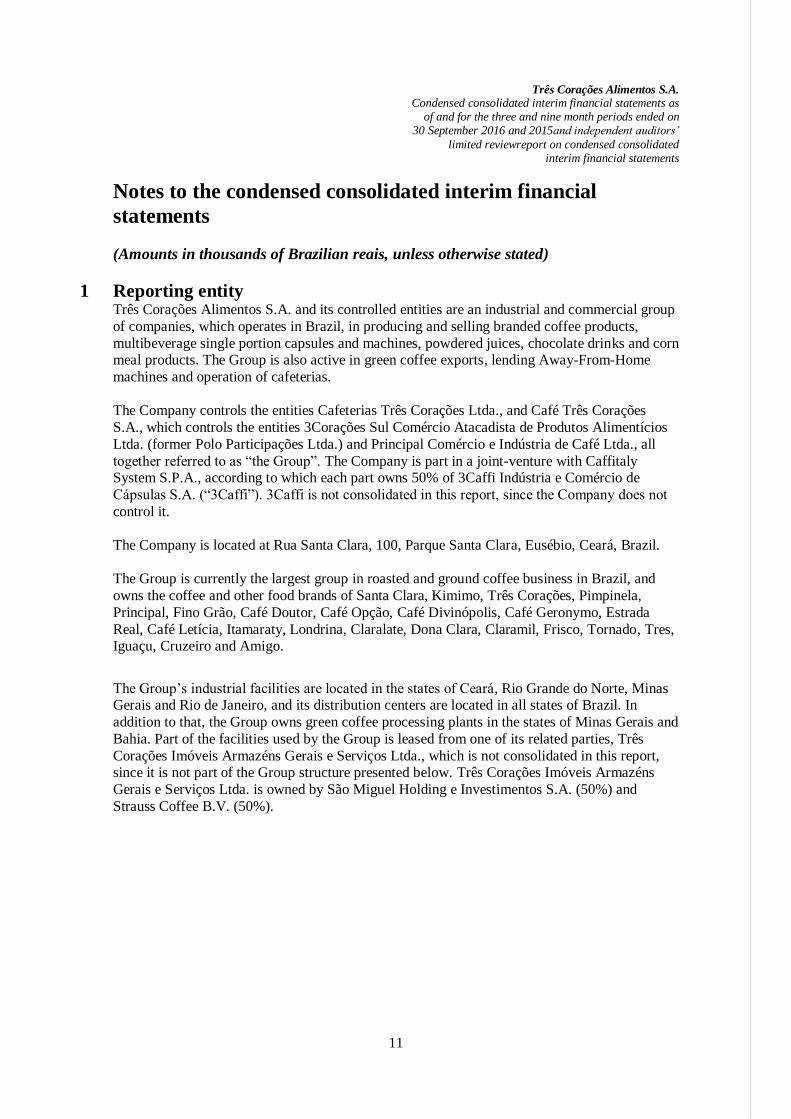
Três Corações Alimentos S.A. Condensed consolidated interim financial statements as
of and for the three and nine month periods ended on 30 September 2016 and 2015and independent auditors’
limited reviewreport on condensed consolidated interim financial statements
11
Notes to the condensed consolidated interim financial
statements
(Amounts in thousands of Brazilian reais, unless otherwise stated)
1 Reporting entity Três Corações Alimentos S.A. and its controlled entities are an industrial and commercial group
of companies, which operates in Brazil, in producing and selling branded coffee products,
multibeverage single portion capsules and machines, powdered juices, chocolate drinks and corn meal products. The Group is also active in green coffee exports, lending Away-From-Home
machines and operation of cafeterias.
The Company controls the entities Cafeterias Três Corações Ltda., and Café Três Corações
S.A., which controls the entities 3Corações Sul Comércio Atacadista de Produtos Alimentícios
Ltda. (former Polo Participações Ltda.) and Principal Comércio e Indústria de Café Ltda., all
together referred to as “the Group”. The Company is part in a joint-venture with Caffitaly System S.P.A., according to which each part owns 50% of 3Caffi Indústria e Comércio de
Cápsulas S.A. (“3Caffi”). 3Caffi is not consolidated in this report, since the Company does not
control it.
The Company is located at Rua Santa Clara, 100, Parque Santa Clara, Eusébio, Ceará, Brazil.
The Group is currently the largest group in roasted and ground coffee business in Brazil, and
owns the coffee and other food brands of Santa Clara, Kimimo, Três Corações, Pimpinela,
Principal, Fino Grão, Café Doutor, Café Opção, Café Divinópolis, Café Geronymo, Estrada
Real, Café Letícia, Itamaraty, Londrina, Claralate, Dona Clara, Claramil, Frisco, Tornado, Tres, Iguaçu, Cruzeiro and Amigo.
The Group’s industrial facilities are located in the states of Ceará, Rio Grande do Norte, Minas Gerais and Rio de Janeiro, and its distribution centers are located in all states of Brazil. In
addition to that, the Group owns green coffee processing plants in the states of Minas Gerais and
Bahia. Part of the facilities used by the Group is leased from one of its related parties, Três
Corações Imóveis Armazéns Gerais e Serviços Ltda., which is not consolidated in this report, since it is not part of the Group structure presented below. Três Corações Imóveis Armazéns
Gerais e Serviços Ltda. is owned by São Miguel Holding e Investimentos S.A. (50%) and
Strauss Coffee B.V. (50%).
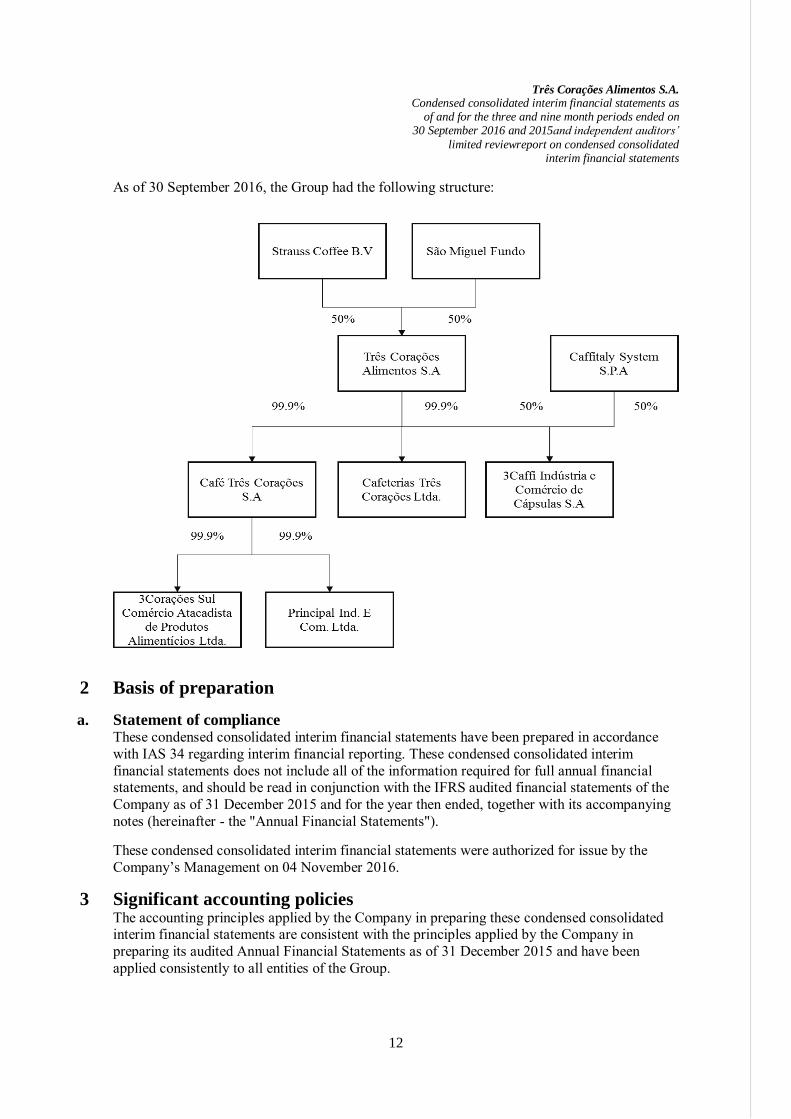
Três Corações Alimentos S.A. Condensed consolidated interim financial statements as
of and for the three and nine month periods ended on 30 September 2016 and 2015and independent auditors’
limited reviewreport on condensed consolidated interim financial statements
12
As of 30 September 2016, the Group had the following structure:
2 Basis of preparation
a. Statement of compliance These condensed consolidated interim financial statements have been prepared in accordance
with IAS 34 regarding interim financial reporting. These condensed consolidated interim
financial statements does not include all of the information required for full annual financial statements, and should be read in conjunction with the IFRS audited financial statements of the
Company as of 31 December 2015 and for the year then ended, together with its accompanying
notes (hereinafter - the "Annual Financial Statements").
These condensed consolidated interim financial statements were authorized for issue by the
Company’s Management on 04 November 2016.
3 Significant accounting policies The accounting principles applied by the Company in preparing these condensed consolidated interim financial statements are consistent with the principles applied by the Company in
preparing its audited Annual Financial Statements as of 31 December 2015 and have been
applied consistently to all entities of the Group.

Três Corações Alimentos S.A. Condensed consolidated interim financial statements as
of and for the three and nine month periods ended on 30 September 2016 and 2015and independent auditors’
limited reviewreport on condensed consolidated interim financial statements
13
4 Reclassification
(i) Reclassification of 30 September 2015 financial statements of fixed assets acquired
through loans and borrowings Fixed assets purchased through loans and borrowings were presented in the financial statements as of 30 September 2015 as a cash outflow in the cash flows from investing activities, while
cash inflows were presented as cash flows from financing activities, following the new loans or
borrowings contracted.
When preparing these 30 September 2016 condensed consolidated interim financial statements,
Management decided to treat these acquisitions as non-cash activities, once the funds raised
with the loans or borrowings are directly transferred by the banks to the supplier. The reclassification effect in the consolidated interim statement of cash flows for the three and nine-
month periods ended 30 September 2015 is presented below:
Originally
presented
nine month period
ended 30 September,
2015
Fixed assets
purchased with
through loans and
borrowings
reclassification
Reclassified
nine month period
ended 30
September, 2015
Cash flows from investing activities Change in deposits 991 - 991 Payment for acquisition of operations (1,980) - (1,980) Proceeds from sales of fixed assets 2,357 - 2,357 Acquisitions of fixed assets (34,267) 5,422 (28,845) Investments in intangible assets (4,341) - (4,341)
Long-term loans to related parties (33) - (33)
Net cash flows used in investing activities
(37,273)
5,422
(31,851)
Cash flows from financing activities
Proceeds from loans 267,074 (8,727) 258,347 Repayment of loans (245,386) 3,305 (242,081)
Dividend paid (2,726) - (2,726)
Net cash flows used in financing activities
18,962
(5,422)
13,540

Três Corações Alimentos S.A. Condensed consolidated interim financial statements as
of and for the three and nine month periods ended on 30 September 2016 and 2015and independent auditors’
limited reviewreport on condensed consolidated interim financial statements
14
Originally
presented
three month period
ended 30 September,
2015
Fixed assets
purchased with
through loans and
borrowings
reclassification
Reclassified
three month period
ended 30
September, 2015
Cash flows from investing activities
Change in deposits (1,668) - (1,668) Proceeds from sales of fixed assets 388 - 388 Acquisitions of fixed assets (8,491) (1,170) (9,661)
Investments in intangible assets (2,537) - (2,537)
Net cash flows used in investing activities
(12,308)
(1,170)
(13,478)
Cash flows from financing activities
Proceeds from loans 214,858 (149) 214,709
Repayment of loans (80,222) 1,319 (78,903)
Dividend paid - - -
Net cash flows used in financing activities
134,636
1,170
135,806
(ii) Reclassification of 31 December 2015 financial statements judicial deposit The Group has a legal obligation to pay the Accident Prevention Factor (FAP), but in
accordance with its assessment of the assigned FAP percentage, Management understands the applied percentage should be lower.
Due to the above, the amount paid in excess was recorded as judicial deposit, and a provision was made as employees and other payroll related liabilities. Both the provision and the deposit
will be settled on a net basis when the legal issue is concluded, and therefore Management
decided to present both in the net position.
The amount reclassified from judicial deposits to employees and other payroll related liabilities
as of 31 December 2015 is R$ 6,605.
5 Material events during the reported period
5.1 Caffi Indústria e Comércio de Cápsulas S.A. (“3Caffi”)
On 10 May 2016, Caffitaly System S.p.A. purchased 50% of the Company’s existing shares in 3Caffi, in the amount of R$ 5, then subscribed new shares issued by 3Caffi in the amount of R$
4,995, of which it paid-in the amount of R$ 4,600. On the same date, the Company increased its
participation in 3Caffi share capital subscribing new shares in the amount of R$ 4,995, of which it paid-in the amount of R$ 4,600 through capitalization of the Advance for Future Increase of
Share Capital made by the Company on February 18, 2016. This way, as of the same date, the
remaining amount that was subscribed but not paid-in was R$ 790, corresponding to R$ 395 for each shareholder, which may be paid in accordance with capital requirements within 10 years.
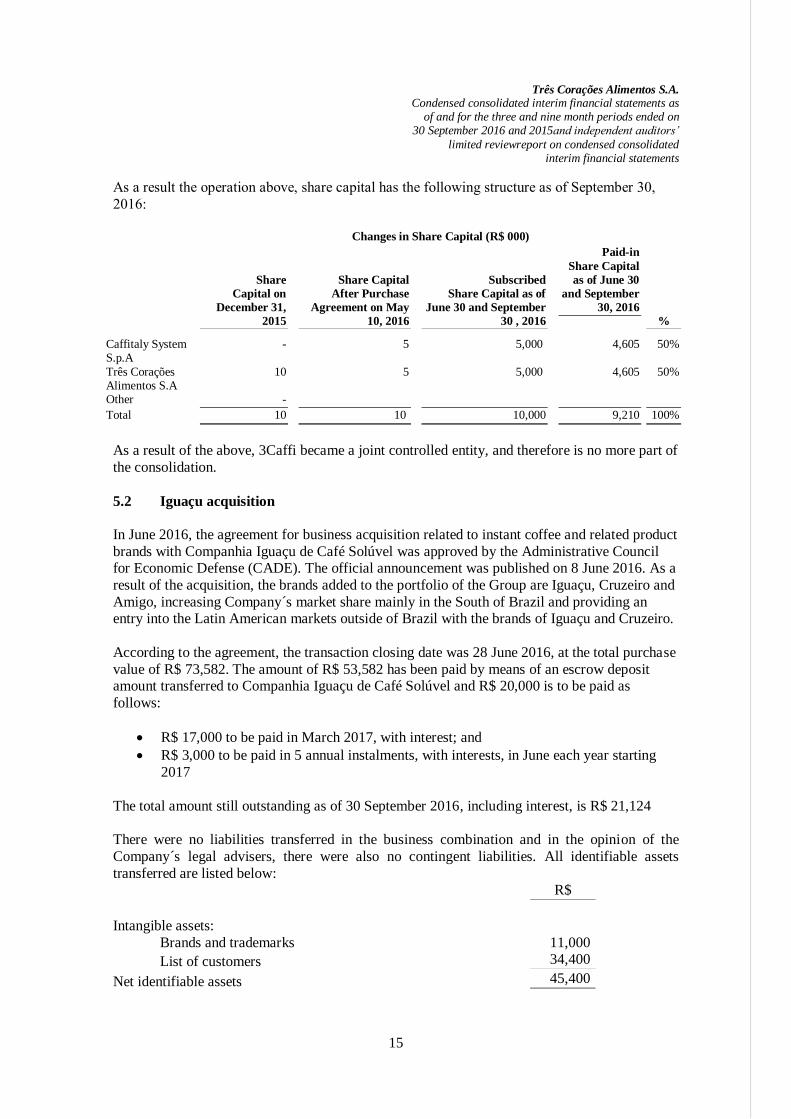
Três Corações Alimentos S.A. Condensed consolidated interim financial statements as
of and for the three and nine month periods ended on 30 September 2016 and 2015and independent auditors’
limited reviewreport on condensed consolidated interim financial statements
15
As a result the operation above, share capital has the following structure as of September 30,
2016:
Changes in Share Capital (R$ 000)
Share
Capital on
December 31,
2015
Share Capital
After Purchase
Agreement on May
10, 2016
Subscribed
Share Capital as of
June 30 and September
30 , 2016
Paid-in
Share Capital
as of June 30
and September
30, 2016
%
Caffitaly System S.p.A
- 5 5,000 4,605 50%
Três Corações Alimentos S.A
10 5 5,000 4,605 50%
Other -
Total 10 10 10,000 9,210 100%
As a result of the above, 3Caffi became a joint controlled entity, and therefore is no more part of
the consolidation.
5.2 Iguaçu acquisition
In June 2016, the agreement for business acquisition related to instant coffee and related product
brands with Companhia Iguaçu de Café Solúvel was approved by the Administrative Council for Economic Defense (CADE). The official announcement was published on 8 June 2016. As a
result of the acquisition, the brands added to the portfolio of the Group are Iguaçu, Cruzeiro and
Amigo, increasing Company´s market share mainly in the South of Brazil and providing an entry into the Latin American markets outside of Brazil with the brands of Iguaçu and Cruzeiro.
According to the agreement, the transaction closing date was 28 June 2016, at the total purchase
value of R$ 73,582. The amount of R$ 53,582 has been paid by means of an escrow deposit amount transferred to Companhia Iguaçu de Café Solúvel and R$ 20,000 is to be paid as
follows:
R$ 17,000 to be paid in March 2017, with interest; and
R$ 3,000 to be paid in 5 annual instalments, with interests, in June each year starting
2017
The total amount still outstanding as of 30 September 2016, including interest, is R$ 21,124
There were no liabilities transferred in the business combination and in the opinion of the
Company´s legal advisers, there were also no contingent liabilities. All identifiable assets
transferred are listed below:
R$
Intangible assets:
Brands and trademarks 11,000
List of customers 34,400
Net identifiable assets 45,400

Três Corações Alimentos S.A. Condensed consolidated interim financial statements as
of and for the three and nine month periods ended on 30 September 2016 and 2015and independent auditors’
limited reviewreport on condensed consolidated interim financial statements
16
The amounts above represent the best Management’s estimate of the fair value of the
identifiable assets transferred at the time of the acquisition and initial recognition of the purchase. The Group will reflect the impact of the fair value of all assets, including goodwill,
from new information obtained, including an independent valuation now in course, regarding
conditions existing at the time of the acquisition within the measurement period of 12 months, in accordance with IFRS 3.
As a result of the total valuation of the transaction and that of the above identifiable assests as
performed by the Management, the Goodwill from the business combination can been estimated at R$ 28,182.
5.3 State Tax Stability Funds (FEEF)
A requirement of maintaining the necessary tax balance, considering Brazilian economic
scenario, led the Federal Government to provide for establishment of the State Tax Stability
Funds (FEEF). The Funds establish temporary additional VAT tax payments, to be made by
companies with existing tax incentives granted by the individual states.
Considering state tax incentives applicable to the Group, only Ceará and Paraíba States´
regulations are applicable at this time. The Ceará FEEF is applicable during 24 months, from 1st
of September, 2016 to 31 August, 2018 and the Paraíba FEEF during 30 months, starting 1st of
October, 2016 to February 2019, and may be extended for thirty more months. On the other side, both states extend the subject tax incentives for an additional period equal to the period of
this temporary collection – in case of Paraíba – and for double of such period in case of
Ceará.The payments are calculated as a positive difference between 10% of the VAT payables for the month and the respective VAT tax payment, if compared to the same month of the
previous year, which indicates an increase in tax contribution by the taxpayer. This way, the
additional VAT tax payment due is zero in case the increase is equal or higher than 10% and is
the full 10% if there is no increase in the month. As this is an entirely new legislation, its
interpretation by individual states may still be subject to change.
5.4 Dividend paid
On 7 June 2016, additional dividends declared from the 2015 results in the amount of R$ 1,445,
were approved by the ordinary shareholders’ meeting. These additional dividends were paid in
June 2016. The amount of R$ 34,548, representing 50% of dividends declared from the 2014 results, was
paid together with the above additional dividend.
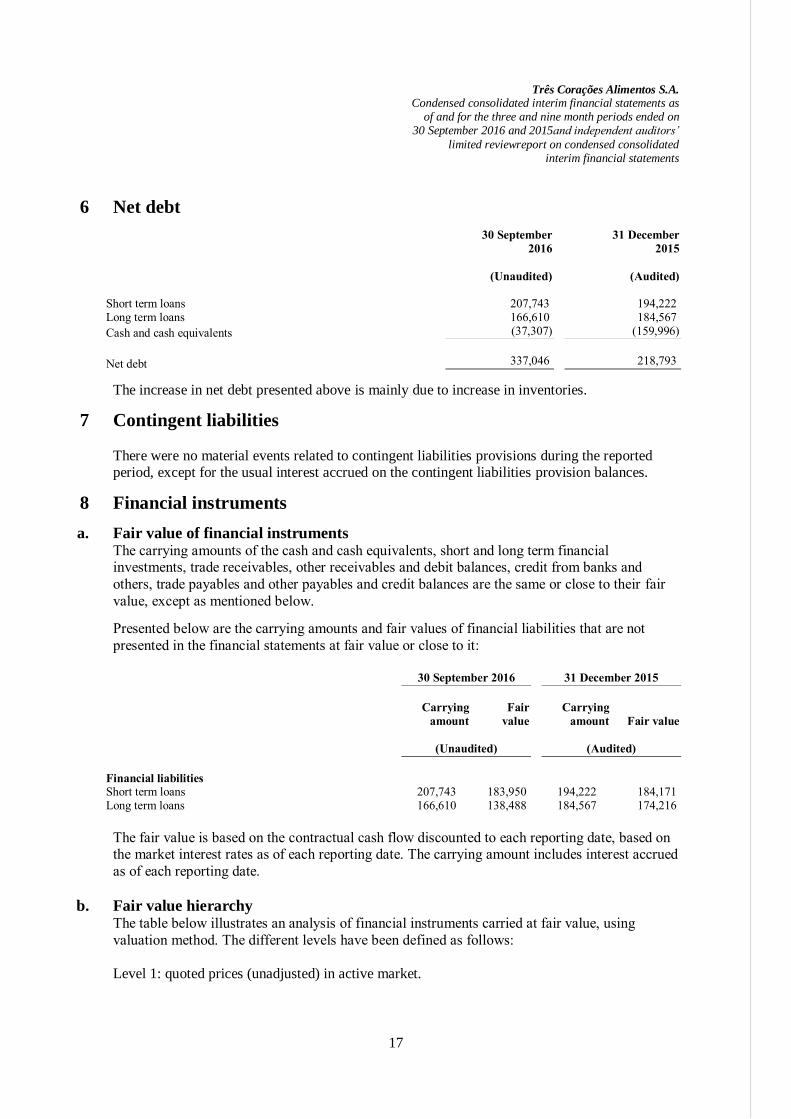
Três Corações Alimentos S.A. Condensed consolidated interim financial statements as
of and for the three and nine month periods ended on 30 September 2016 and 2015and independent auditors’
limited reviewreport on condensed consolidated interim financial statements
17
6 Net debt
30 September
2016
31 December
2015
(Unaudited) (Audited)
Short term loans 207,743 194,222 Long term loans 166,610 184,567
Cash and cash equivalents (37,307) (159,996)
Net debt 337,046 218,793
The increase in net debt presented above is mainly due to increase in inventories.
7 Contingent liabilities
There were no material events related to contingent liabilities provisions during the reported period, except for the usual interest accrued on the contingent liabilities provision balances.
8 Financial instruments
a. Fair value of financial instruments The carrying amounts of the cash and cash equivalents, short and long term financial investments, trade receivables, other receivables and debit balances, credit from banks and
others, trade payables and other payables and credit balances are the same or close to their fair
value, except as mentioned below.
Presented below are the carrying amounts and fair values of financial liabilities that are not
presented in the financial statements at fair value or close to it:
30 September 2016 31 December 2015
Carrying
amount
Fair
value
Carrying
amount Fair value
(Unaudited) (Audited)
Financial liabilities Short term loans 207,743 183,950 194,222 184,171 Long term loans 166,610 138,488 184,567 174,216
The fair value is based on the contractual cash flow discounted to each reporting date, based on the market interest rates as of each reporting date. The carrying amount includes interest accrued
as of each reporting date.
b. Fair value hierarchy The table below illustrates an analysis of financial instruments carried at fair value, using
valuation method. The different levels have been defined as follows:
Level 1: quoted prices (unadjusted) in active market.
Três Corações Alimentos S.A. Condensed consolidated interim financial statements as
of and for the three and nine month periods ended on 30 September 2016 and 2015and independent auditors’
limited reviewreport on condensed consolidated interim financial statements
18
Level 2: inputs other than quoted prices within level 1 that are observable for the assets or
liabilities, either directly (i.e., as prices) or indirectly (i.e., derived from prices). Level 3: inputs for the asset or liability that are not based on observable market data
(unobservable inputs).
As of 30
th of September 2016 and 31 December 2015, the Group did not have financial
instruments balances carried at fair value using valuation methods.
* * *
Pedro Alcântara Rêgo de Lima Danisio Costa Lima Barbosa
Adenise Evangelista de Melo
Chief Executive Officer Chief Financial Officer Accountant
CRC/CE nº 8.126/O-3
Três Corações Alimentos S.A. Três Corações Alimentos S.A. Três Corações Alimentos S.A.