Strategy Modeling and Classifier Training for Share Tradingfstasp/paper/dta2010.pdf · Strategy...
13
Strategy Modeling and Classifier Training for Share Trading Yain-Whar Si 1 , Weng-Lon Lei 2 , Chi-Chong Chiu 3 Faculty of Science and Technology, University of Macau {[email protected] 1 , [email protected] 2 , [email protected] 3 } Abstract. In technical analysis, each trading strategy can trigger a buy or sell action whenever the specified conditions are satisfied. When a set of strategies are applied to a particular stock, a trader often receives conflicting recommendations from each strategy. In this paper, we propose a unified data mining approach in which the outcomes of each strategy are taken into consideration for decision making. First, we develop a framework for composing complex trading strategies. Next, we show how to perform simulation analysis on constructed strategies using extracted historical prices. The result of the simulation analysis is then used for training classifiers which can be used for recommending stock trading actions. Experiments conducted with the price data from Hong Kong Stock Market show promising results. Keywords: Technical indicators, trading signals, trading strategies. 1 Introduction Trading securities based on technical analysis [3][4] is considered as one of the most important techniques in today stock markets. However, most of the existing online trading systems only provides functions such as configuring common technical indicators, generating predefined sets of trading signals, and triggering buy/sell actions based on simple if-then rules. Experienced traders often find these functions too rigid since they cannot be tailored for the individual needs. In this paper, we describe a decision support system for trading securities based on use-defined strategies. Through the developed system, traders can create complex trading strategies by combing trading signals incrementally. Optimization of technical indicators [19] and mining of trading strategies [20] based on evolutionary algorithms have been extensively studied in recent years. In these approaches, to achieve optimum results, selection of parameters for the technical indicators and composition of trading strategies are done automatically based on genetic operators through evolution process. Although automatic composition approaches are proven to be effective, manual composition and testing of complex trading strategies is equally vital in certain circumstances. For instance, a trader may have designed a set of strategies and they are frequently applied to a certain stock. However, these individual strategy can generate conflicting results (e.g. buy/sell suggestions) when they are applied simultaneously on a particular stock. In
Transcript of Strategy Modeling and Classifier Training for Share Tradingfstasp/paper/dta2010.pdf · Strategy...

Strategy Modeling and Classifier Training for Share
Trading
Yain-Whar Si1, Weng-Lon Lei2, Chi-Chong Chiu3
Faculty of Science and Technology, University of Macau {[email protected], [email protected], [email protected]}
Abstract. In technical analysis, each trading strategy can trigger a buy or sell action whenever the specified conditions are satisfied. When a set of strategies are applied to a particular stock, a trader often receives conflicting recommendations from each strategy. In this paper, we propose a unified data mining approach in which the outcomes of each strategy are taken into consideration for decision making. First, we develop a framework for composing complex trading strategies. Next, we show how to perform simulation analysis on constructed strategies using extracted historical prices. The result of the simulation analysis is then used for training classifiers which can be used for recommending stock trading actions. Experiments conducted with the price data from Hong Kong Stock Market show promising results.
Keywords: Technical indicators, trading signals, trading strategies.
1 Introduction
Trading securities based on technical analysis [3][4] is considered as one of the most important techniques in today stock markets. However, most of the existing online trading systems only provides functions such as configuring common technical indicators, generating predefined sets of trading signals, and triggering buy/sell actions based on simple if-then rules. Experienced traders often find these functions too rigid since they cannot be tailored for the individual needs. In this paper, we describe a decision support system for trading securities based on use-defined strategies. Through the developed system, traders can create complex trading strategies by combing trading signals incrementally.
Optimization of technical indicators [19] and mining of trading strategies [20] based on evolutionary algorithms have been extensively studied in recent years. In these approaches, to achieve optimum results, selection of parameters for the technical indicators and composition of trading strategies are done automatically based on genetic operators through evolution process. Although automatic composition approaches are proven to be effective, manual composition and testing of complex trading strategies is equally vital in certain circumstances. For instance, a trader may have designed a set of strategies and they are frequently applied to a certain stock. However, these individual strategy can generate conflicting results (e.g. buy/sell suggestions) when they are applied simultaneously on a particular stock. In

this case, the trader may have to decide which strategy should be used for actual trading. The trader may not be able to identify which strategy is the best for such circumstances and any wrong decision can cause devastating financial loss. To alleviate this problem, a unified approach is needed to incorporate individual strategy when making trading decisions. In this paper, we propose a novel approach for training classifiers based on the outcomes of user-defined strategies.
First, we perform a simulation analysis in which constructed trading strategies are applied on extracted historical prices. The result of the simulation analysis is then used for training classifiers. Whenever the price of the stock is updated, the trained classifiers can be used by the trader in making long and short decisions. Since classifiers are trained with the outcomes (signals) from all strategies defined for a particular stock, any potential conflicts which can be caused by these strategies are eliminated. Experiments conducted with some of the stocks from Hong Kong Stock Market shows promising results.
This rest of the paper is organized into 6 sections. A brief introduction to technical indicators, trading signals, and user-defined strategies is given in Section 2. Proposed simulation method in given in Section 3. In section 4, we describe the training process for clissifiers. In section 5, we detail the experimental results obtained from testing with price data from Hong Kong Stock Market. In Section 5, we briefly review recent work before summarizing our ideas and future work in Section 6.
2 Technical indicators, trading signals, and user-defined strategies
Trading strategies are often used to determine what kind of actions to be taken at specific point in time. Trading strategies may also be used to determine the relevant price and the volume of the financial instruments to maximize the profit while minimize the risk [18]. In this paper, we propose an incremental approach for composing strategies from trading signals and technical indicators. The steps for composing trading strategies are described in Figure 1.
Fig. 1. Steps for composing trading strategies
2.1 Technical indicators
Technical indicators can be derived from the price data of a security. In the following sections we briefly describe three common technical indicators which are used in this research. Simple Moving Average (SMA): Moving average is one of the most widely used technical indicators. A simple moving average (SMA) can be constructed by adding a set of price data and then dividing by the number of observations in the period

examined [3]. For example, an N-day simple moving average of closing price can be calculated as:
N
NPPPSMA
+++
=
...21 (1)
Where Pi is the closing price of i day and N is the number of days in the moving average (selected by the trader). In technical analysis, values for N are often chosen as 200, 60, 50, 30, 20, and 10. The choice of N depends on the kind of movement the trader would like to analyze, such as short, intermediate, or long term. A rising SMA indicates an upward trend whereas a falling SMA indicates a downward trend.
Exponential Moving Average (EMA): In calculating SMA, older price data outside of the specified days is not considered. Such omitting can be a problem when there is a large change in the neglected part of the data. EMA assigns larger weight to the latest price data. EMA also responds to changes faster than SMA. EMA can be calculated as follows [3]:
)100( kYesterdayEMAkTodayPTodayEMA −×+×= (2)
Where1
2
+
=
Nk , N is the number of days in the EMA (selected by the trader), PToday
is today’s price, and EMAYeserday is the EMA of yesterday.
Moving Average Convergence/Divergence (MACD): The Moving Average Convergence/Divergence indicator was developed by Gerald Appel. The MACD indicator consists of two lines: a Fast line and a slow line. The fast line (also called the MACD line) is usually the difference between 12-day EMA and 26-day EMA [4]. The slow line (also called the signal line) is usually a 9-day EMA of the fast line [4]. Based on the two lines, we can plot a MACD-histogram based on the following formula.
MACD-histogram = Fast line – Slow line (3)
MACD-histogram can be plotted as a series of vertical bars and often used to identify whether current trend is losing momentum or not. For instance, when the histogram is positive but starts to fall toward the zero line, it indicates that the uptrend is weakening [4]. When the histogram is negative and begins to move toward the zero line, it indicates that the downtrend is losing momentum [4].
2.2 Trading signals
In technical analysis, trading signals are used to trigger a buy/sell action. Trading signals can be calculated from technical indicators. In the following sections we briefly describe three common trading signals which can be constructed from SMA, EMA, and MACD. Basic trading signals based on SMA: “Golden Cross” [5] signal appears when SMA(10) crosses up through SMA(20) from bottom to top. It indicates a “Buy” signal. “Dead Cross” signal appears when SMA(10) crosses down through the line SMA(20) from top to bottom. It indicates a “Sell” signal. Example signals based on SMA(10) and SMA(20) are depicted in Figure 2. At point 1 and 3, SMA(10) line

cross up through SMA(20) line indicating buy signals. After the signal appeared, we can notice that the price of the stock rises. At point 2 and 4, SMA(10) line crosses down through SMA(20) line indicating sell signals. After the sell signals appeared the price of the stock drops.
Fig. 2. SMA(10) and SMA(20) of stock 00005.HK
Basic trading signals based on EMA: When EMA(10) crosses up through EMA(20) from bottom to top, it indicates a “Buy” signal. When EMA(10) crosses down through EMA(20) from top to bottom, it indicates a “Sell” signal. Example trading signals generated from EMA(10) and EMA(20) are shown in Figure 3.

Fig. 3. EMA(10) and EMA(20) of stock 00005.HK
Basic trading signals based on MACD: In this research, we use standard indicator settings (12, 26, 9) for MACD. When the MACD-histogram (blue line) crosses up through the zero line, it indicates a “Buy” signal. When the MACD-histogram crosses down through the zero line, it indicates a “Sell” signal. Example signals identified from MACD(12, 26, 9) are depicted in Figure 4.
Fig. 4. MACD(12, 26, 9) of stock 00005.HK
2.3 User defined strategies
A user defined strategy is a predefined set of conditions for making trading decisions. A strategy contains two groups of conditions: Signal Appear Conditions (SAC) and Signal Termination Conditions (STC). The system performs “Buy” action when all the conditions for SAC are satisfied. Likewise, the system performs “Sell” action when all the conditions for STC are satisfied. The structure for user defined strategies is depicted in Figure 5.

Fig. 5. The structure for user defined strategies
Operators which can be used in constructing conditions for the strategies are listed in Table 1. These operators can be categorized into either “Binary” or “Unary” depending on the indicators used in the strategies. Binary operators can be used for SMA and EMA indicators whereas only unary operators can only be used for MACD indicators.
Table. 1 Operators for indicator Operator Type Description Cross up Binary Indicator A cross up through Indicator B from bottom to top
Cross Down Binary Indicator A cross down through Indicator B from bottom to top
Above Binary The value of indicator A is greater than that of indicator B
Below Binary The value of indicator A is less than that of indicator B
Appear Buy Unary When the indicator matches its buy signal condition
Appear Sell Unary When the indicator matches its sell signal condition
First Appear Buy Unary When the indicator matches its buy signal condition at the first day
First Appear Sell Unary When the indicator matches its sell signal condition at the first day
A sample strategy based on EMA(10) and EMA(20) is depicted in Figure 6. In some indicators, the price of the stock can be directly used in composing strategies. For instance, the signal appear condition from Figure 6 can be revised as “Price Cross up through EMA(20)”.
Fig. 6. A strategy constructed from EMA(10) and EMA(20
3 Simulation with strategies
The strategies defined by the users can be tested against the historical price of the stock. To evaluate the performance, the system automatically downloads the historical price data from Yahoo beginning at a specified date. The daily closing price of the stock is then used for calculating required signals. The system simulates buy and sell actions whenever the specified conditions in the strategy are satisfied. The example actions performed during the simulation are shown in green (buy) and red (sell) circles in Figure 7.

Fig. 7. The buy and sell actions triggered by a strategy
The sample simulation result of the HSBC stock (00005.HK) is depicted in Figure 8. According to the simulation, the “Buy” and “Sell” signal pairs appeared 38 times during the simulation period and the signal has exceeded a predefined threshold (percentage of increase in the price) 11 times. The simulation uses the initial capital $10000 to buy and sell the stocks according to the user defined strategy. The total return is then calculated based on the initial capital.
Fig. 8. The sample performance report for 00005.HK (starting form 2003-01-01)
4 Classifiers Training
In this section we describe how the results of the simulation can be used to train classification models. Recall that in Section 2, a trader can compose more than one strategy for a particular stock. However, each strategy can trigger a “Buy” or “Sell” action whenever the SAC and STC are satisfied. If all strategies are used simultaneously for decision making, a trader may receive multiple or even conflicting buy/sell signals at the same time. Therefore, in order to resolve these conflicts, a

unified approach is required to take into account the outcomes (states) of each strategy.
Based on this underpinning, we developed a data mining approach to train classification models for stock recommendation. In this approach, the signals from each strategy and the price changes in the stocks are used for training. Our prototype system stores the training data in Attribute-Relation File Format (ARFF) from WEKA [2]. The training data contains two sets of columns: Change in Stock Price (CSP) and Outcomes from Applying Strategies (OAS). The output column is the recommended action which is either “Buy”, “Sell”, or “Nil”. A sample training data is given in Table 2.
First, the trader composes strategies for a targeted stock and set the start date for simulation. Next, the system automatically downloads the historical prices and performs simulation based on these strategies. During the simulation, the system automatically extracts the states of each strategy and the corresponding time period (denoted as start and end date in Table 2). During that period, the states of these strategies are constant. Whenever one of the strategies changes its state, the system automatically records the time and begins a new period. There are four possible states for a strategy: appear (A), ongoing (O), terminated (T), and nil (N). The outcomes of applying strategies (OAS) are then indexed by the dates as shown in Table 2.
Table 2. A sample training data after applying BAT and SAT
CSP(i): Change in stock price for i days, SA: Strategy A, SB: Strategy B, SC: Strategy C A: Appear, O: Ongoing, T: Terminated, N: Nil
Next, the system calculates the Change in Stock Price (CSP) for 1, 5, and 10 days
based on equation 4.
%100)( ×
−
−−
=
kiP
kiPiPkCSP (4)
Where Pi is the price of day i, and CSP(k) is the change in stock price of last k days. The system then calculates the Return (R) based on the price difference between the start and the end date as follows.
%100)(
×
−
=
StartDateP
StartDatePEndDatePR (5)
Finally, the action attribute from Table 2 can be obtained by comparing the return to the Buy Action Threshold (BAT) And Sell Action Threshold (SAT). These two

thresholds (see Figure 9) are set by the user before the training begins. The recommended action is “Buy” if the return is greater than BAT, the action is “Sell” if the return is less than SAT, otherwise action is Nil.
Fig. 9. Deciding action based on BAT and SAT
By varying the value of BAT and SAT, the trader can fine-tune the frequency and
profit consciousness of the trading. For instance, high BAT value will produce less “Buy” actions during the generation of training data. The recorded data is then used by the prototype system for training classifiers based on J48, Multi-layer Perceptron, and Naïve Bayes algorithms.
5 Experimental result
The trained classifiers have been tested against a number of stocks from Hong Kong Stock Market. Due to the limited space, we select three stocks (00001.HK: CHEUNG KONG, 00005.HK: HSBC Holdings, 00941.HK: China Mobile) for discussion. For these stocks, historical price data (closing price) from 1st Jan 2005 to 28th Feb 2009 is used for training and the price data from 1st Mar 2009 to 31st May 2010 is used for testing the classifiers. Both training and testing is performed daily. Therefore, the period considered for training increases as the time progresses. In our experiment, we consider following four strategies (see Table 3).
Table 3. Four strategies used in the experiment
Strategy 1: MACD(12,26,9) SAC MACD(12,26,9) Signal Appear
STC MACD(12,26,9) Signal Terminated
Strategy 2: SMA(10,20) SAC SMA(10) Cross up through SMA(20)
STC SMA(10) Cross down through SMA(20)
Strategy 3: EMA(2,19) SAC EMA(2) Cross up through EMA(19)
STC EMA(2) Cross down through EMA(19)
Strategy 4: EMA(price, 7) SAC PRICE Cross up through EMA(7)
STC PRICE Cross down through EMA(7)
In these experiments, we consider three combinations of BAT and SAT values:
(BAT 2%, SAT -2%), (BAT 3%, SAT -2%), and (BAT 2%, SAT -3%). J48, Multi-layer Perceptron, and Naïve Bayes classification models are used for training. The results of the testing are ranked by the total return as shown in Figure 10, 11, and 12.
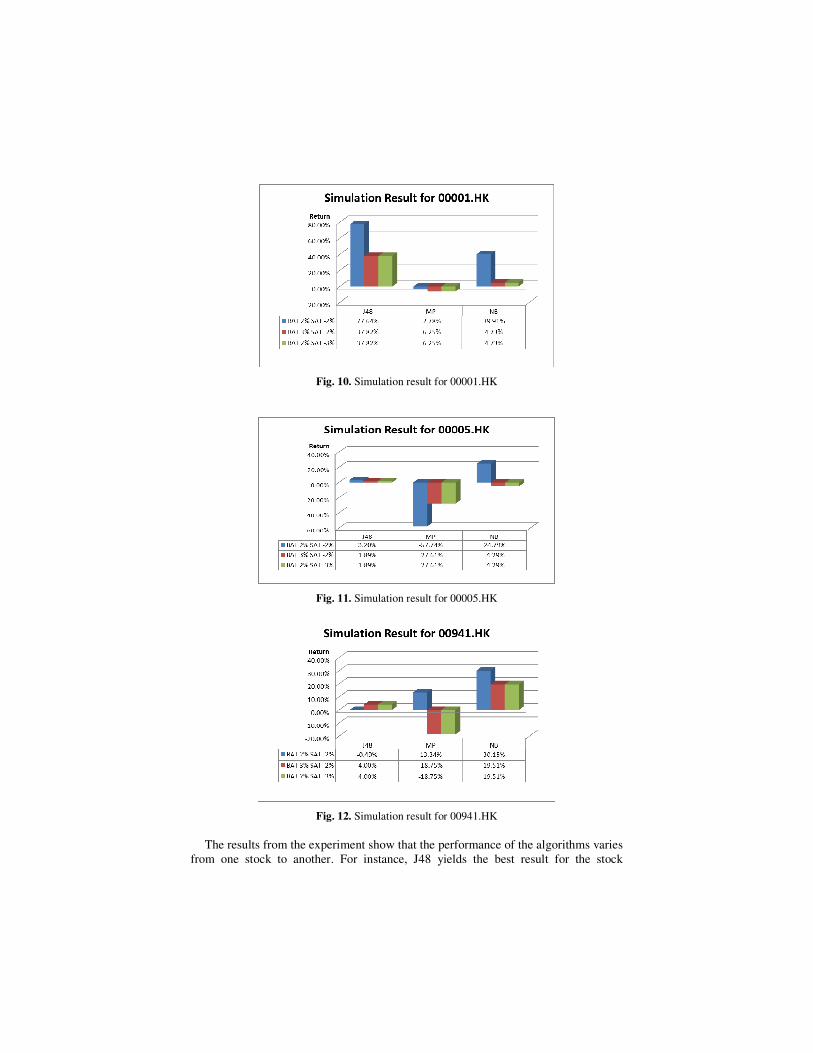
Fig. 10. Simulation result for 00001.HK
Fig. 11. Simulation result for 00005.HK
Fig. 12. Simulation result for 00941.HK
The results from the experiment show that the performance of the algorithms varies from one stock to another. For instance, J48 yields the best result for the stock

00001.HK whereas Naïve Bayes classification yields the best result for the remaining two stocks. In addition, the result also shows that the performance of the recommendation also depends on the BAT and SAT values. Larger BAT and SAT can result reduced trading frequencies whereas smaller BAT and SAT values can lead to risk-taking behavior in trading.
6 Related work
Soft computing techniques have been widely used by the researchers to forecast the stock returns. The survey by Atsalakis et al. [6] identified various studies on forecasting for more than 20 stock markets. Although our approach has been demonstrated through some of the selected stocks from Hong Kong stock market, it can be applied to any other markets.
Various input parameters have also been considered by researchers to forecast stock returns, such as stock prices [8], trading volume, dividend, yield, indexes [7], technical indicators [9], and technical analysis variables [10]. In our approach, we use the history of the stock price and the signals generated by the user-defined strategies. One of the important characteristics of our approach is that, in training classification models, we allow variable number of input parameters. Specifically, the number of attributes (columns) for OAS in Table 2 is equivalent to the total number of strategies defined by the trader.
Numerous modeling techniques have been studied in literature for forecasting stock markets. Similar to our approach, multilayer perceptron model (MLP) was used to forecast the return on the Spanish bIbex-35Q stock index [11] and TEPIX index from Tehran’s Stock Exchange [12]. In [13], C4.5 was used in predicting the direction of Taiwan Stock Index returns whereas in [14] C4.5 classifiers are used to forecast the short-term market reaction to news. Naïve Bayes classification was also used to forecasting movement direction of Hang Seng Index based on its opening price, high price, low price, S&P 500 index, and currency exchange rate between HK dollar and US dollar [16]. In [17], Naïve Bayes classification was used to predict sentiment about stock using financial message boards. Sentiments expressed by individual authors are extracted from financial message boards to learn the correlation between the sentiments and the stock values. The learned model is then be used to make future predictions about stock values.
7 Conclusion
In this paper, we describe a framework for modeling strategies based on technical indicators and trading signals. We show how classifiers can be trained based on the outcomes of the strategies. The trained classifiers are then used to assist traders in deciding when to long or short a particular stock. A prototype system including strategy modeling framework and classifier training/testing was developed in JAVA, WEKA [2], and amCharts [1]. Experiments conducted with the price data from Hong Kong Stock Market show promising results.

The main contribution of our approach is twofold. First, our approach allows incremental composition of complex trading strategies. Such capability is crucial for advanced traders who need to tailor their trading strategies. Second, based on the proposed approach, classifiers can be trained and tested against historical price data regardless of the complexity of these strategies. Instead of relying on a predefined set of technical indicators, our approach allows incorporation of all signals which can be generated from the user-defined strategies. Specifically, the data mining approach presented in this paper implictly eliminates any potential conflicting recommendations from the strategies.
As for the future work, we are currently testing other data mining techniques for recommending stock trading actions. To improve the performance, we are also planning to include additional market related attributes for training classifiers.
Acknowledgments. This research is funded by the Research Committee, University of Macau.
References
1. amCharts, http://www.amcharts.com/, last accessed: 27 April 2010. 2. Weka, http://www.weka.org/, last accessed: 27 April 2010. 3. Kirkpatrick, C.D.: Technical Analysis, The Complete Resource for Financial Market
Technicians. FT Press (2007) 4. Murphy, J.J.: Technical Analysis of the Financial Markets, A Comprehensive Guide to
Trading Methods and Applications. New York Institute of Finance Press (1999) 5. Fyfe, C., Marney, J., Tarbert, H.: Technical analysis versus market efficiency - a genetic
programming approach. Applied Financial Economics. 9, 183--191 (1999) 6. Atsalakis, G.S., Valavanis, K.P.: Surveying stock market forecasting techniques - Part II:
Soft computing methods. Expert Systems with Applications. 36(3), Part 2, 5932—5941 (2009)
7. Abraham, A., Philip, N.S., Saratchandran, P.: Modelling chaotic behaviour of stock indices using Intelligent Paradigms. Neural, Parallel & Scientific Computations Archive. 11, 143--160 (2003)
8. Doeksen, B., Abraham, A., Thomas, J., Paprzycki, M.: Real Stock Trading Using Soft Computing Models. In: Proceedings of the International Conference on Information Technology: Coding and Computing (ITCC'05) - Volume II, pp. 162--167 (2005)
9. Dourra, H., Siy, P.: Investment using technical analysis and fuzzy logic. Fuzzy Sets and Systems. 127, 221--240 (2002)
10. Motiwalla, L., Wahab, M.: Predictable variation and profitable trading of US equities: a trading simulation using neural networks. Computers and Operations Research, 27 (11-12), 1111--1129 (2000)
11. Pérez-Rodríguez, J.V., Torra, S., Andrada-Félix, J.: STAR and ANN models: Forecasting performance on the Spanish "Ibex-35" stock index. Journal of Empirical Finance. 12(3), 490--509 (2005)
12. Tabrizi, H.A., Panahian, H.: Stock price prediction by artificial neural networks: A study of Tehran’s Stock Exchange (T.S.E). http://www.abdoh.net/dbase/upload/TSE-PP.pdf, last accessed: 27 April 2010.
13. Cheng, J.H., Chen, H.P., Lin, Y.M.: A hybrid forecast marketing timing model based on probabilistic neural network, rough set and C4.5. Expert Systems with Applications. 37(3), 1814-1820 (2010)

14. Robertson, C., Geva, S., Wolff, R.: Predicting the Short-Term Market Reaction to Asset Specific News: Is Time Against Us? In: Industry Track Workshop, 11th Pacific-Asia Conference on Knowledge Discovery and Data Mining (PAKDD 2007), pp. 1--13 (2007)
15. Huang, T.T., Chang, C.H.: Intelligent Stock Selecting via Bayesian Naive Classifiers on the Hybrid Use of Scientific and Humane Attributes. In: Proceedings of 8th International Conference on Intelligent Systems Design and Applications (ISDA '08), pp. 617--621 ( 2008)
16. Ou, P., Wang, H.: Prediction of Stock Market Index Movement by Ten Data Mining Techniques. Modern Applied Science. 3(12), (2009)
17. Sehgal, V., Song, C.: SOPS: Stock Prediction Using Web Sentiment. In: Proceedings of the 7th IEEE International Conference on Data Mining Workshops (ICDMW 2007), pp. 21--26 (2007)
18. Cao, L., Luo, C., Zhang, C.: Developing Actionable Trading Strategies for Trading Agents. In: Proceedings of the 2007 IEEE/WIC/ACM international Conference on intelligent Agent Technology, pp. 72--75 (2007)
19. Bodas-Sagi, D.J., Fernández, P., Hidalgo, J.I., Soltero, F.J., Risco-Martín, J.L.: Multiobjective optimization of technical market indicators. In: Proceedings of the 11th Annual Conference Companion on Genetic and Evolutionary Computation Conference: Late Breaking Papers. pp. 1999--2004 (2009)
20. Ni, J., Zhang, C.: Mining Better Technical Trading Strategies with Genetic Algorithms. In: Proceedings of the International Workshop on Integrating AI and Data Mining (AIDM'06). pp. 26--33 (2006)