Strategii de PR - Saffron City Brand Barometer
13
The Saffron European City Brand Barometer. Revealing which cities get the brands they deserve. By Jeremy Hildreth, head of place branding, Saffron Brand Consultants
-
Upload
ayana-alexandra-stancu -
Category
Documents
-
view
220 -
download
0
Transcript of Strategii de PR - Saffron City Brand Barometer
8/6/2019 Strategii de PR - Saffron City Brand Barometer
http://slidepdf.com/reader/full/strategii-de-pr-saffron-city-brand-barometer 1/13
The Saffron
European CityBrand Barometer.
Revealing whichcities get the brandsthey deserve.By Jeremy Hildreth, head of place branding, Saffron Brand Consultants

8/6/2019 Strategii de PR - Saffron City Brand Barometer
http://slidepdf.com/reader/full/strategii-de-pr-saffron-city-brand-barometer 2/13
Contents
01 – Why a European City BrandBarometer?
02 – What we mean by ‘brand’— and why it matters.
03 – What we looked at in the study.04 – The results and what they show.05 – How to boost your brand—the
Saffron city brand criteria.
Appendix 1 – The full results.
Appendix 2 – Underlying methodology.
1
8/6/2019 Strategii de PR - Saffron City Brand Barometer
http://slidepdf.com/reader/full/strategii-de-pr-saffron-city-brand-barometer 3/13
01Why aEuropean City
BrandBarometer?
2
Having advised countries, regions
and cities on their branding, we
at Saffron are interested in what
factors inuence a place’s brand.
The impact of EU enlargement,
easier travel, and a rediscovery
of regional identity and cultures
is intensifying competition among
European cities for a share of
international tourism, trade and
investment. How successfully
these cities project their assets
and attractions is fundamental to
their future success.
We wanted to conduct a piece of
research that would compare and
contrast place brand strengths, and
we felt that cities offered the best
route. The European City Brand
Barometer offers a valid yardstick,
revealing how cities stack up
against one another, brand-wise.
The Barometer thus measures
the strength of cities’ brands and
assesses how well cities use
branding to exploit their assets.
We nd that while some cities’
brands are underperforming relative
to their innate qualities, others are
punching above the weight of
what they have to offer.
So what are the most important
factors that determine a city’s
image? Saffron concludes that
there are ten qualitative factors(the Saffron city brand criteria)
a city should work on if it wants to
improve its standing in the world.
3
8/6/2019 Strategii de PR - Saffron City Brand Barometer
http://slidepdf.com/reader/full/strategii-de-pr-saffron-city-brand-barometer 4/13
02What we mean by ‘brand’—and
why it matters.
4
First of all, let’s dene some
terms. A brand is an overall
image or set of perceptions and
associations that resides in people’s
heads. When we speak of ‘the
brand’ of a place, we mean the
average or common perceptions
and associations people have
with that place; it is always an
approximation, and it is always
subjective. Reasonable people
can thus disagree about ‘the brand’
of a particular place, but it is still
meaningful.
A city’s brand, although hard to
pin down exactly, derives from
factors which can be usefully,
if subjectively, measured and
evaluated. Certain assets, such as a
vibrant cultural scene or renowned
architecture, tend automatically to
confer strength on a city brand.
Such attributes give certain cities,
like London and Rome, a ‘head start’
in the branding race, while others,
such as Warsaw or Bradford,
begin at a natural disadvantage.
Other cities, like Dublin or Glasgow,
are somewhere in the middle in
terms of their attributes but have
succeeded in forging strong brands.
Which leads us to ‘branding ’.
Branding means the deliberate
actions taken to alter or improve an
image. This includes promotion but
mostly, in our experience, it means
improvement and coordination.
It entails a place gathering its
leaders together, actually or
guratively, and in effect deciding,
“We’ve got these assets to work
with and these liabilities to correct.
Let’s get to it.” An organised and
ofcial ‘branding programme’ of
the sort we consult on, when done
right, is far and away the most
effective—and certainly the most
formal—method for a city to
achieve a shift in its brand sooner
rather than later. But there are other
ways for it to happen, some
of which are more spontaneousor accidental than others.
Brands matter because they’re what
people base their decisions on:
decisions about where to live, where
to go on holiday, where to set up
a business, even (albeit perhaps to
a lesser degree, or at least in a
different way) where to invest.
Brand = substance + feeling.
Brand = reality + story.
Brand = truth + imagination.
Brand = fact + impression.
Indeed, sometimes it seems we’llforgive a city anything provided
it’s sexy and going there gives us
something to talk about when we
get home. And at the other end
of the spectrum, if we don’t
know about a place, if there’s no
story there for us, then we make
assumptions about how interesting
or prominent or attractive it is.
5

8/6/2019 Strategii de PR - Saffron City Brand Barometer
http://slidepdf.com/reader/full/strategii-de-pr-saffron-city-brand-barometer 5/13
03What welooked at in
the study.
6
We looked at European cities
with populations of 450,000
or more, plus M anchester, Bristol,
Cardiff, Leeds and Newcastle,
(important UK cities with
populations less than that).
Altogether there are 72 cities
in our analysis.
Our analysis looks at two
different qualities:
01 – City asset strength (which
asks: looking only at the
observable and measurable
features of the city how strong
could the city’s brand be?)
02 – City brand strength (which
asks: right now, how strong
is the city’s brand really?)
01 – City asset strength
City asset strength representsa city’s baseline brand potential
by telling us how a city fares
against the things that people
most want in a city.
Saffron conducted a poll to
discover what the most desirable
assets in a city were and then
analysed how each city measures
up against these desired assets.
The assets combine the ‘soft’
cultural factors and ‘harder’
amenity factors that people want
from a city. Saffron also included
the degree to which the cityis important or prosperous
economically.
To determine what people
want most in a place, Saffron
commissioned a YouGov poll of
2,000 people in the UK. We asked
two questions with a series of
multiple choice answers:
Cultural factors:
When considering a city break,
which of the following things are
most important to you? (respondents
were asked to choose 3 and
rank them in approximate order
of importance)
Amenity factors:
If you were considering a city break,
what kind of city might appeal to
you the most? (respondents were
asked to choose 3 and rank them in
approximate order of importance)
The most desirable assets in order
of weighted importance, were:
Cultural:
1. sightseeing and historical
attractions
2. cuisine and restaurants
3. friendly and helpful locals
4. good shopping
Amenity:
1. particularly low cost
2. good weather
3. ease of getting around on footor by public transport
7

8/6/2019 Strategii de PR - Saffron City Brand Barometer
http://slidepdf.com/reader/full/strategii-de-pr-saffron-city-brand-barometer 6/13
02 – City brand strength
How strong is a city’s brand right
now? Because a brand lives in
the heads of millions of people,
it is not actually measurable as a
uniform entity. And like Marmite,
there is no ‘average view’ that
you can discern meaningfully;
some love it, some hate it, some
have never tasted it. But just as
you can infer something about the
popularity of Marmite by seeing
how well it sells, you can also
make an educated guess abouthow a city is generally perceived.
We chose four factors, equally
weighted, to include in our
Barometer of a city’s current
brand strength. These are
subjective in that they are
Saffron’s chosen factors but
they are based on our extensive
place branding experience, and
we believe they are valid:
01 – Pictorially recognised
meaning, could many people
recognise the city from
a postcard without havingto read the description on
the back.
02 – Quantity/strength of positive/
attractive qualities meaning,
what prompted and unprompted
associations do people have
of the city.
03 – Conversational value
meaning, how interesting
would it be at a cocktail party
to say, “Hey, I just got back
from _________________.”).
04 – Media recognition, which
we determined statistically by
counting media references to
the city over a set period.
Scoring and outputs
We calculated city asset strength
(to a maximum of 100) and city
brand strength (also to a maximum
of 100). With these scores we
created the European City Brand
Barometer, which yielded a set of
quantitative results:
– City brand strength: reveals the
brand score and ranking for each
of the 72 cities
– City asset strength: shows the
asset score and ranking for each
of the 72 cities – Brand utilisation: reveals
quantitatively how well the
cities are living up to their brand
potential (by calculating brand
strength as a percentage of asset
strength for each city).
The quantitative data was then used
to create a visual interpretation of
the results:
– The City Brand Barometer:
graphical illustration of how
the cities match up against
one another (by plotting city
brand strength versus city assetstrength on an X-Y grid).
8
04The resultsand what they
show.
9

8/6/2019 Strategii de PR - Saffron City Brand Barometer
http://slidepdf.com/reader/full/strategii-de-pr-saffron-city-brand-barometer 7/13
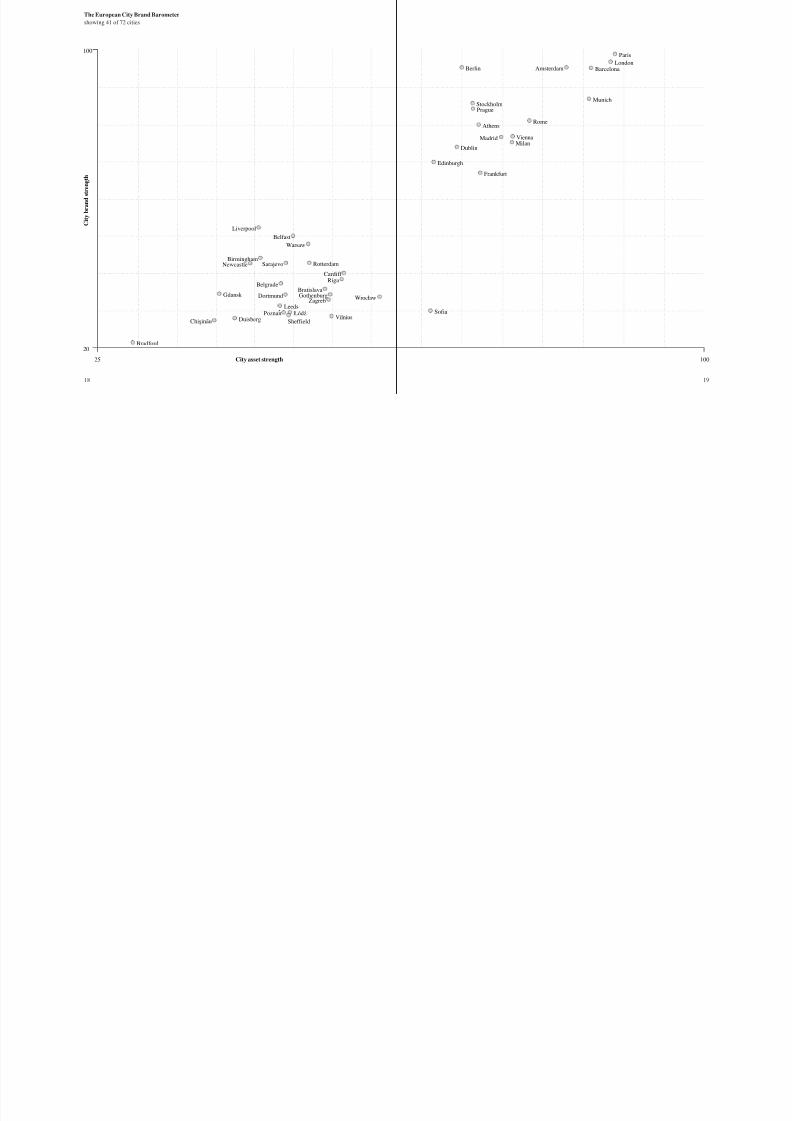
See the appendix for full tables of
results and visual illustration, The
European City Brand Barometer.
Cities get the brand they
deserve…mostly
The ndings support the intuitive
assumption that the stronger a
city’s assets, the stronger its brand.
The linear, positively sloping curve
revealed on the Matrix seems to
prove exactly what you would
think: that by and large, cities get
the brands they deserve. What’sinteresting, however, is where this
is not the case.
Indeed, the Barometer shows that
some cities, much like undervalued
stocks, seem to have a reality
(city asset strength) that is more
attractive and of higher quality than
is currently accounted for in their
brand (city brand strength).
Two cities whose brands appear
metaphorically undervalued, for
example, are Soa, Bulgaria and
Lisbon, Portugal. Soa has the same asset score as Edinburgh,
Scotland, yet a brand strength score
of just 30 versus Edinburgh’s 75.
Meanwhile Lisbon has the same
asset score as Berlin (70), yet only
some 65% of the German capital’s
brand strength.
Other cities with less potential
than Soa and Lisbon but who
utilise their brand potential even
less than those two cities are
Wrocław, Poland and Vilnius,
Lithuania. These latter two cities
appear to be using only about 50%
of their brand potential right now.
Needed: better branding
Vienna, according to the Barometer,
is the only European city to have
exactly the brand it deserves:
its brand utilisation score is
100%. Almost half the cities in
the Barometer are utilising less
80% of their brand potential
given their current actual level
of attractiveness.
What does this mean? It suggests
that higher awareness and better
salesmanship should be able to
help many cities, particularly‘hidden gems’ like Soa, Lisbon,
Wrocław and Vilnius to emerge
as much more prominent than they
are—in other words, to better
utilise their brand potential.
Our belief is that active branding
should in most cases be able,
in time, to push a city’s brand
utilisation closer to, or even
beyond, 100%.
Earn your reputation, then
dine out on it
Another interesting nding of the
Barometer is that there is a category
of cities whose brand strength
actually exceeds what their
asset strength would suggest
they ‘deserve’. In terms of how
strong a city’s brand is compared
to the city’s underlying assets—
what we’re calling brand utilisation
—the winner is Berlin, followed
by Stockholm, Liverpool, Prague
and Amsterdam.
Berlin has a 137% brand utilisation
rate; Stockholm 118%; Prague,
Liverpool and Amsterdam 115%;
Barcelona 112%; and Paris 111%.
For all of these cities, their brand
is better than their assets would
predict (even if the assets are
strong), meaning they are selling a
story above and beyond an urban
experience.
What does this mean? If you are
a city with an over 100% utilisation
rate, it means you are successfullyselling your image as well as a
reality. It means that through your
history and culture you have
fostered an aura about you.
10
Aside from Liverpool, all of the
cities in this category have a
good reality (high asset ranking),
suggesting it’s hard to sell a story
without having the attributes to
support it. Indeed, one of the issues
the Barometer raises for the place
branding profession—to put it in
old-fashioned marketing terms—is
how do you sell an underappreciated
sizzle when the steak is good but
not as good as others?
One conclusion we make hereis counterintuitive: that perhaps
the best way for a city to raise
its brand, even when lack of
awareness is the problem, is not
by communications (the standard
direct method of raising awareness)
but in fact by increasing its
attractiveness. In other words, the
best way to improve your image
is to keep improving your reality.
Use it or lose it
On the other hand, the cities at the
bottom of the brand utilisation rank-
ing—suggesting they have more tooffer than they are currently being
credited for in their brand—are
Wrocław (Poland), Vilnius (Lithu-
ania) and Soa (Bulgaria).
These ‘hidden gems’ have the
innate qualities to attract tourism
and business but are underselling
their potential. Other cities
before them have latched on to
the need to pursue branding to rea-
lise their potential: Barcelona is the
leading example of a city that has
got its leaders together and focused
on what it wants to be known
for by improving its assets and
exploiting what it already had.
To a lesser extent Liverpool is
successfully doing this—it’s decidedit wants to be a hip city and it has
a plan to achieve it. Achieving status
as European Capital of Culture in
2008 was a big step in the process.
Don’t be surprised if you hear
more about Wrocław, Vilnius
(European Capital of Culture in
2009) and Soa in the coming
months and years as, aided by more
sophisticated branding, people
catch on to their charms.
11
8/6/2019 Strategii de PR - Saffron City Brand Barometer
http://slidepdf.com/reader/full/strategii-de-pr-saffron-city-brand-barometer 8/13
05How to boostyour brand—the
Saffron city brand criteria.
12
We have thought about and
debated the factors we think are
most important in determining a
city’s image. We have boiled these
down to ten criteria: the Saffron
city brand criteria.
The criteria identify perspectives
on a place. Like a Cubist painting,
sometimes these perspectives
overlap, showing more than
one facet, more than one aspect
of a place, simultaneously.
Traditionalists would classifythis taxonomy as awed since
the categories are not all mutually
exclusive. For instance, London’s
Underground scores points for
London in three categories:
distinctive sense of place, easy/
access/comfort, and current
recognition.
But by recognising the overlapping
nature of perception, S affron’s
model is more robust, creating a
natural sense of weighting that
corresponds to the way people
actually experience the cities theyvisit (for business or pleasure or
education) and live in. Indeed,
in our view, all in all, these ten
criteria—overlapping just as
they are—are the perspectives
that matter.
A city that wants to improve its
standing in the world should work
on the criteria where it fares poorly.
The ten Saffron city brand
criteria are:
01 – Pride and personality of
its people
If the folks who live there
think it’s the greatest city in
the world, that counts for
something even if many
visitors wouldn’t agree. Onthe other hand, places where
the people are down on
themselves and down on
their place…well, that’s just
a downer, and it tends to
affect everything about the
visitor’s experience, even
if in subtle ways.
02 – Distinctive sense of place
(on the ground)
Place markers and landmarks,
like London’s double-decker
buses and black cabs, Paris’
wide boulevards, Barcelona’sGaudi architecture…any
un-ignorable signs while
you’re there and you couldn’t
possibly be anywhere else.
This covers culture and
people, architecture, and
natural or built features
(e.g. Amsterdam’s canals).
03 – Ambition/vision (policy)
and business climate
A rising tide lifts all boats.
Big plans, big investment,
economic incentives, and true
prospects for growth. Also,
governance: places that make
it are often well-governed.
Including ease and protability
of doing business. Example:
Budapest is hurt by the fact
that it’s in Hungary and
Hungary’s development has
been slow.
04 – Current recognition and
perceptions
This is similar to ‘momentum’
in stock-picking; and like a
stock, a place going somewhere
will already be showing signs
of getting there. Are there
independent guidebooks?
Helpful press (notice we don’t
say positive press…anything
helpful will do, thank you).
Are their obvious or even
must-have souvenirs? Is there
a big event or fair there (e.g.Oktoberfest in Munich) that
lots of people know about?
13
05 Worth going to see (the 08 L ocational context and value
A di 1

8/6/2019 Strategii de PR - Saffron City Brand Barometer
http://slidepdf.com/reader/full/strategii-de-pr-saffron-city-brand-barometer 9/13
05 – Worth going to see (the
Samuel Johnson test)
Samuel Johnson said about
the Giant’s Causeway in
Northern Ireland: “Worth
seeing? Yes. But not worth
going to see.”
06 – Ease, access and comfort
Riga would score higher
than Vilnius because it has
easyJet ights. Many things
under distinctive sense of
place may register under thiscategory also.
07 – Conversational value (the
‘cocktail party’ factor)
Is it going to be fun to talk
about when I get home?
Soa: maybe not, because
nobody’s heard of it. Paris:
maybe (on the one hand,
it’s not remotely exotic or
uncharted, on the other hand
people will have their own
Paris stories to share).
08 – L ocational context and value
(how much is it worth simply
because it is where it is?)
What this means really
depends on the place. It could
mean economic importance
or the fact that the city is a
capital city. It could be that
it’s close to other interesting
places. Or it could be that the
city’s isolation is played as
an asset.
09 – Attractions and anomalies Things you won’t nd any-
where else, things that are
quirky or exotic. This could
be signicant attractions,
or simply a pervading sense
of exoticism in the air.
We will ‘go quant’ on this
factor, looking at number of
restaurants, 24-hour diners,
business opening hours, etc.
10 – “Ooh, I could live here!”
(the Barcelona effect)
Some places undoubtedly
have this effect on people.It’s an unnameable X factor
that captures a wealth of place
attributes in one fell swoop
—a single, bottom-line net
present value on the experience
of being in a place.
14
Appendix 1The full results.
15
The European City Brand Barometer—results table:

8/6/2019 Strategii de PR - Saffron City Brand Barometer
http://slidepdf.com/reader/full/strategii-de-pr-saffron-city-brand-barometer 10/13
The European City Brand Barometer results table:
The tables opposite display the individual brand strength,
asset strength and brand utilisation scores for each city
and how the cities ranked out of 72 for each measurement:
Average score 60
20 Wrocław, Poland. . . . . . . . .61
20 Cologne, Germany . . . . . . .61
20 Düsseldorf, Germany . . . . .61
21 Leipzig, Germany . . . . . . . .60
21 Málaga, Spain . . . . . . . . . . .60
22 Budapest, Hungary . . . . . . .5923 Helsinki, Finland. . . . . . . . .58
23 Cardiff, UK . . . . . . . . . . . . .58
24 Essen, Germany . . . . . . . . .57
24 Riga, Latvia. . . . . . . . . . . . .57
25 Glasgow, UK . . . . . . . . . . . .56
25 Manchester, UK . . . . . . . . .56
25 Marseille, France . . . . . . . .56
26 Gothenburg, Sweden. . . . . .54
26 Zagreb, Croatia . . . . . . . . . .54
26 Vilnius, Lithuania . . . . . . . . 54
26 Zaragoza, Spain . . . . . . . . .54
27 Bratislava, Slovakia . . . . . .53
28 Rotterdam, Neth . . . . . . . . .52
28 Warsaw, Poland. . . . . . . . . .52
29 Bristol, UK . . . . . . . . . . . . .5130 Belfast, UK . . . . . . . . . . . . .50
31 Sarajevo, Bosnia . . . . . . . . .49
31 Shefeld, UK . . . . . . . . . . .49
32 Dortmund, Germany. . . . . .48
32 Łódź, Poland. . . . . . . . . . . .48
32 Poznań, Poland . . . . . . . . . .48
33 Belgrade, Serbia . . . . . . . . .47
33 Leeds, UK . . . . . . . . . . . . . .47
34 Birmingham, UK . . . . . . . .46
34 Liverpool, UK . . . . . . . . . . .46
35 Duisberg, Germany. . . . . . .44
36 Newcastle, UK . . . . . . . . . .43
37 Gdansk, Poland. . . . . . . . . .39
37 Chişinău, Moldova . . . . . . .39
38 Bradford, UK . . . . . . . . . . .29
Brand strength
Average score 60
1 Paris, France . . . . . . . . . . . .89
2 London, UK . . . . . . . . . . . .88
3 Munich, Germany. . . . . . . .86
3 Barcelona, Spain. . . . . . . . .86
4 Amsterdam, Neth . . . . . . . .83
5 Rome, Italy . . . . . . . . . . . . .796 Milan, Italy . . . . . . . . . . . . .77
6 Vienna, Austria . . . . . . . . . . 77
7 Madrid, Spain . . . . . . . . . . .75
8 Athens, Greece . . . . . . . . . .73
9 Frankfurt, Germany . . . . . .72
9 Stockholm, Sweden . . . . . .72
9 Antwerp, Belgium . . . . . . .72
9 Prague, Czech Republic . . . 72
10 Oslo, Norway . . . . . . . . . . .71
11 Berlin, Germany . . . . . . . . . 70
11 Lisbon, Portugal . . . . . . . . .70
12 Naples, Italy . . . . . . . . . . . .69
12 Dublin, Ireland . . . . . . . . . .69
13 Hamburg, Germany . . . . . .68
13 Palermo, Italy . . . . . . . . . . .6814 Edinburgh, UK . . . . . . . . . .67
14 Hannover, Germany . . . . . .67
14 Stuttgart, Germany . . . . . . .67
14 Soa, Bulgaria . . . . . . . . . .67
15 Dresden, Germany . . . . . . .66
15 Copenhagen, Denmark . . . .66
16 Bremen, Germany. . . . . . . .65
16 Seville, Spain . . . . . . . . . . .65
17 Nurenberg, Germany . . . . .64
17 Turin, Italy . . . . . . . . . . . . .64
18 Genoa, Italy. . . . . . . . . . . . .63
18 Kraków, Poland. . . . . . . . . .63
18 Valencia, Spain . . . . . . . . . . 63
19 Thessaloniki, Greece. . . . . .62
20 Bucharest, Romania . . . . . .61
Asset strength
Average score 59
1 Paris, France . . . . . . . . . . 99
2 London, UK . . . . . . . . . . 97
3 Barcelona, Spain. . . . . . . 96
3 Berlin, Germany . . . . . . . 96
3 Amsterdam, Neth . . . . . . 96
4 Munich, Germany. . . . . . 875 Stockholm, Sweden . . . . 85
6 Prague, Czech Republic . 83
7 Rome, Italy . . . . . . . . . . . 81
8 Athens, Greece . . . . . . . . 80
9 Madrid, Spain . . . . . . . . . 77
9 Vienna, Austria . . . . . . . . 77
10 Milan, Italy . . . . . . . . . . . 75
11 Dublin, Ireland . . . . . . . . 74
12 Edinburgh, UK . . . . . . . . 70
13 Frankfurt, Germany . . . . 67
14 Copenhagen, Denmark . . 65
14 Hamburg, Germany . . . . 65
15 Stuttgart, Germany . . . . . 64
16 Oslo, Norway . . . . . . . . . 60
17 Lisbon, Portugal . . . . . . . 5918 Valencia, Spain . . . . . . . . 58
19 Glasgow, UK . . . . . . . . . 56
19 Naples, Italy . . . . . . . . . . 56
20 Budapest, Hungary . . . . . 55
21 Málaga, Spain . . . . . . . . . 54
21 Helsinki, Finland. . . . . . . 54
22 Liverpool, UK . . . . . . . . 53
23 Cologne, Germany . . . . . 51
23 Dresden, Germany . . . . . 51
23 Essen, Germany . . . . . . . 51
24 Turin, Italy . . . . . . . . . . . 50
24 Belfast, UK . . . . . . . . . . . 50
24 Manchester, UK . . . . . . . 50
25 Zaragoza, Spain . . . . . . . 49
25 Palermo, Italy . . . . . . . . . 49
16
19 Oslo, Norway . . . . . . . . . 85%
20 Rotterdam, Neth.. . . . . . . 83%
20 Cologne, Germany . . . . . 83%
21 Naples, Italy . . . . . . . . . . 82%
22 Belgrade, Serbia . . . . . . . 80%
23 Marseille, France . . . . . . 79%24 Turin, Italy . . . . . . . . . . . 78%
25 Dresden, Germany . . . . . 77%
26 Bradford, UK . . . . . . . . . 76%
27 Seville, Spain . . . . . . . . . 75%
28 Bucharest, Romania . . . . 73%
29 Palermo, Italy . . . . . . . . . 71%
29 Dortmund, Germany. . . . 71%
29 Leipzig, Germany . . . . . . 71%
30 Chişinău, Moldova . . . . . 70%
30 Kraków, Poland. . . . . . . . 70%
30 Cardiff, UK . . . . . . . . . . . 70%
31 Bratislava, Slovakia . . . . 68%
31 Düsseldorf, Germany . . . 68%
32 Hannover, Germany . . . . 67%
32 Genoa, Italy. . . . . . . . . . . 67%33 Leeds, UK . . . . . . . . . . . . 66%
33 Thessaloniki, Greece. . . . 66%
33 Riga, Latvia. . . . . . . . . . . 66%
34 Antwerp, Belgium. . . . . . 65%
35 Gothenburg, Sweden. . . . 64%
36 Duisberg, Germany. . . . . 62%
37 Bremen, Germany. . . . . . 60%
37 Poznań, Poland . . . . . . . . 60%
37 Zagreb, Croatia . . . . . . . . 60%
37 Łódź, Poland. . . . . . . . . . 60%
37 Shefeld, UK . . . . . . . . . 60%
38 Nurenberg, Germany . . . 58%
39 Wrocław, Poland. . . . . . . 53%
40 Vilnius, Lithuania . . . . . . 52%
41 Soa, Bulgaria . . . . . . . . 45%
26 Warsaw, Poland. . . . . . . . 48
26 Seville, Spain . . . . . . . . . 48
27 Antwerp, Belgium. . . . . . 47
28 Hannover, Germany . . . . 45
28 Bristol, UK . . . . . . . . . . . 45
29 Marseille, France . . . . . . 4429 Bucharest, Romania . . . . 44
29 Kraków, Poland. . . . . . . . 44
29 Birmingham, UK . . . . . . 44
30 Rotterdam, Neth . . . . . . . 43
30 Sarajevo, Bosnia . . . . . . . 43
30 Leipzig, Germany . . . . . . 43
30 Newcastle, UK . . . . . . . . 43
31 Genoa, Italy. . . . . . . . . . . 42
32 Düsseldorf, Germany . . . 41
32 Thessaloniki, Greece. . . . 41
33 Cardiff, UK . . . . . . . . . . . 40
34 Bremen, Germany. . . . . . 39
35 Nurenberg, Germany . . . 38
35 Belgrade, Serbia . . . . . . . 38
36 Riga, Latvia. . . . . . . . . . . 3737 Bratislava, Slovakia . . . . 36
38 Gdansk, Poland. . . . . . . . 35
38 Gothenburg, Sweden. . . . 35
39 Dortmund, Germany. . . . 34
40 Zagreb, Croatia . . . . . . . . 33
40 Wrocław, Poland. . . . . . . 33
41 Leeds, UK . . . . . . . . . . . . 31
42 Soa, Bulgaria . . . . . . . . 30
43 Shefeld, UK . . . . . . . . . 29
43 Poznań, Poland . . . . . . . . 29
43 Łódź, Poland. . . . . . . . . . 29
44 Vilnius, Lithuania . . . . . . 28
45 Duisberg, Germany. . . . . 27
45 Chişinău, Moldova . . . . . 27
46 Bradford, UK . . . . . . . . . 22
Brand utilisation
Average score 91
1 Berlin, Germany . . . . . . 137%
2 Stockholm, Sweden . . . 118%
3 Prague, Czech Republic 115%
3 Liverpool, UK . . . . . . . 115%
3 Amsterdam, Neth . . . . . 115%
4 Barcelona, Spain. . . . . . 112%5 Paris, France . . . . . . . . . 111%
6 London, UK . . . . . . . . . 110%
6 Athens, Greece . . . . . . . 110%
7 Dublin, Ireland . . . . . . . 107%
8 Edinburgh, UK . . . . . . . 104%
8 Madrid, Spain . . . . . . . . 104%
9 Rome, Italy . . . . . . . . . . 102%
10 Munich, Germany. . . . . 101%
10 Belfast, UK . . . . . . . . . . 101%
10 Glasgow, UK . . . . . . . . . 101%
11 Vienna, Austria . . . . . . . 100%
12 Copenhagen, Denmark . . 99%
12 Newcastle, UK . . . . . . . . 99%
13 Milan, Italy . . . . . . . . . . . 97%
14 Stuttgart, Germany . . . . . 96%14 Birmingham, UK . . . . . . 96%
14 Hamburg, Germany . . . . 96%
15 Frankfurt, Germany . . . . 93%
15 Helsinki, Finland. . . . . . . 93%
15 Warsaw, Poland . . . . . . . 93%
15 Budapest, Hungary . . . . . 93%
16 Valencia, Spain . . . . . . . . 91%
16 Málaga, Spain . . . . . . . . . 91%
16 Zaragoza, Spain . . . . . . . 91%
17 Manchester, UK . . . . . . . 89%
17 Gdansk, Poland . . . . . . . . 89%
17 Bristol, UK . . . . . . . . . . . 89%
17 Essen, Germany . . . . . . . 89%
18 Sarajevo, Bosnia . . . . . . . 86%
19 Lisbon, Portugal . . . . . . . 85%
17
The European City Brand Barometer
8/6/2019 Strategii de PR - Saffron City Brand Barometer
http://slidepdf.com/reader/full/strategii-de-pr-saffron-city-brand-barometer 11/13
25
Bradford
Chişinău
Gdansk
Duisberg
100
20
City asset strength
C i t y b r a n d s t r e n g t h
100
Dortmund
Vilnius
ZagrebGothenburg Wrocław
Sofia
Barcelona
Munich
AmsterdamBerlin
StockholmPrague
Athens
Dublin
Edinburgh
Frankfurt
Madrid
Rome
ViennaMilan
London
Paris
Bratislava
RigaCardiff
RotterdamBirmingham
Warsaw
BelfastLiverpool
Belgrade
SarajevoNewcastle
Sheffield
ŁódźPoznanLeeds
p y
showing 41 of 72 cities
18 19
Appendix 2Saffron’s European City Brand 03 – Easy to get around on foot City brand strength—weightings,

8/6/2019 Strategii de PR - Saffron City Brand Barometer
http://slidepdf.com/reader/full/strategii-de-pr-saffron-city-brand-barometer 12/13
Appendix 2Underlyingmethodology.
20
Barometer is the result of applied
survey research, qualitative desk
research, and professional judgment
and experience, all of it interpreted
by Saffron in a way that is
methodical and evenhanded.
City asset strength—weightings,
sources and explanations
Saffron used a variety of
authoritative research sources to
score each city against each of theseven factors that make up asset
strength. To maintain consistency,
the same set of sources was used
to score each city.
01 – Sightseeing and historical
attractions (20%). Experience
and research. To a degree, we
also factored in the physical
charm of a place, since our
view is that people regard that
as an attraction in itself.
02 – Cuisine and restaurants (15%).
Experience and research.High scores went to cities with
particularly good food on
offer or special native cuisines
that we regard as particularly
worthwhile gastronomically;
low scores went to cities with
nothing awfully special to
offer the visitor in terms of
eating, even though a number
of good restaurants might be
found there. Cost was not
considered here.
and public transport (15%).
Experience and research.
The main idea is: can a
foreigner see everything he’d
want to see in the city easily,
in English, without having
to rent a car. Most cities on
this list did pretty well in
this area because they are
compact, at least in the
centre, European cities.
04 – Costs very little to enjoy(10%). Experience and data.
Poll respondents suggested
that at least for a short break,
something they put a lot of
value on is that a place is
cheap. We used price indices
and our own experience
to gauge the costliness of
these cities.
05 – Has good weather (10%).
Experience and data. With this
we wanted to elicit the degree
to which weather was an asset
or a liability for a place. So,having extremes of heat or
cold, which makes seasonality
a factor, is not a good thing.
06 – Shopping (10%). Experience
and research. Quality and
variety, but not costliness, were
taken into account. We relied
on our own familiarity with
these cities for this one.
07 – Economic signicance or
prosperity (20%). We looked
at GDP per capita, but also
at the importance of a city inits context.
sources and explanations
The rst three were “sense of
Saffron” metrics, which decided
on and scored by Saffron’s panel
of experts. These are of course
subjective but are based on
informed, methodical and even-
handed evaluation.
01 – Quantity/strength of positive/
attractive associations (25%).
02 – Pictorially recognised (the
postcard test) (25%).
03 – Conversational value (25%).
The fourth factor that constituted
brand strength was a purely
statistical count of press mentions
of each of the cities.
04 – Media recognition (25%).
21

8/6/2019 Strategii de PR - Saffron City Brand Barometer
http://slidepdf.com/reader/full/strategii-de-pr-saffron-city-brand-barometer 13/13
Saffron Brand Consultants
1-10 Praed Mews,
London W2 1QY
T +44 20 7087 3460
F +44 20 7087 3461
Zurbano 23
28010 Madrid
T +34 91 787 3200F +34 91 787 3232
Adeshwar Mahal
Buddha Mandir Road
Parel, Mumbai 400014
T +91 992 073 3356
441 Broadway, 5th oor
New York, NY 10013
T +1 917 388 3213
F +1 917 388 3413
www.saffron-consultants.com