
Strategies to Engage the Community in Addressing the Achievement Gap
20
Strategies to Engage the Community in Addressing the Achievement Gap Norma Gómez, Parent/Family Involvement Coordinator Tony Brown, Manager, Economic Self Sufficiency Brian Bonner, Ninth District PTA President
-
Upload
deirdre-davenport -
Category
Documents
-
view
25 -
download
4
description
Strategies to Engage the Community in Addressing the Achievement Gap. Norma G ómez, Parent/Family Involvement Coordinator Tony Brown, Manager, Economic Self Sufficiency Brian Bonner, Ninth District PTA President. Why are we here?. - PowerPoint PPT Presentation
Transcript of Strategies to Engage the Community in Addressing the Achievement Gap
Strategies to Engage the Community in Addressing the
Achievement Gap
Strategies to Engage the Community in Addressing the
Achievement Gap
Norma Gómez, Parent/Family Involvement Coordinator
Tony Brown, Manager, Economic Self Sufficiency
Brian Bonner, Ninth District PTA President
Norma Gómez, Parent/Family Involvement Coordinator
Tony Brown, Manager, Economic Self Sufficiency
Brian Bonner, Ninth District PTA President

Why are we here?Why are we here?

“There are three kinds of commonly recognized untruths: Lies, damn lies and statistics.”
- Mark Twain
“Think about how stupid the average person is; now realize half of them are dumber than that.” - George Carlin

California Statewide Enrollment
Source: http://dq.cde.ca.gov/dataquest
1995-96
N=5,467,224
2000-01
N=6,050,895
2005-06
N=6,312,393
White 40.42% 35.89% 30.34%
Latino 38.74% 43.19% 47.58%
African American 8.76% 8.44% 7.84%
Asian 8.23% 8.00% 8.19%
Pacific Islander 0.57% 0.64% 0.64%
Filipino 2.41% 2.39% 2.62%
American Indian 0.87% 0.86% 0.80%
Other NA 0.58% 1.97%
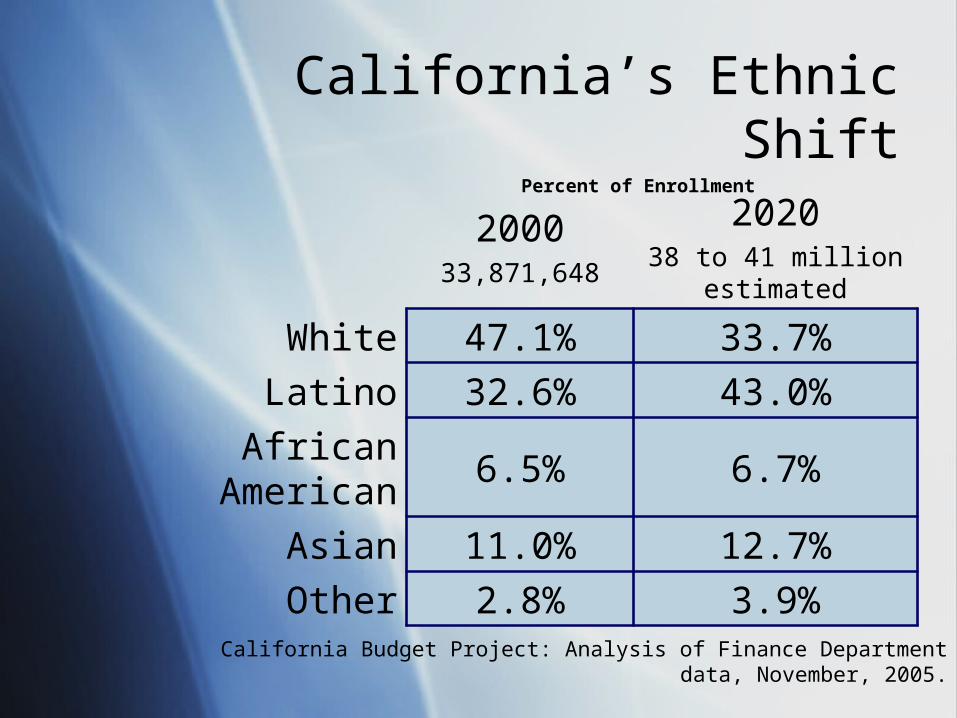
California’s Ethnic Shift
California Budget Project: Analysis of Finance Department data, November, 2005.
200033,871,648
202038 to 41 million
estimated
White 47.1% 33.7%
Latino 32.6% 43.0%
African American 6.5% 6.7%
Asian 11.0% 12.7%
Other 2.8% 3.9%
Percent of Enrollment
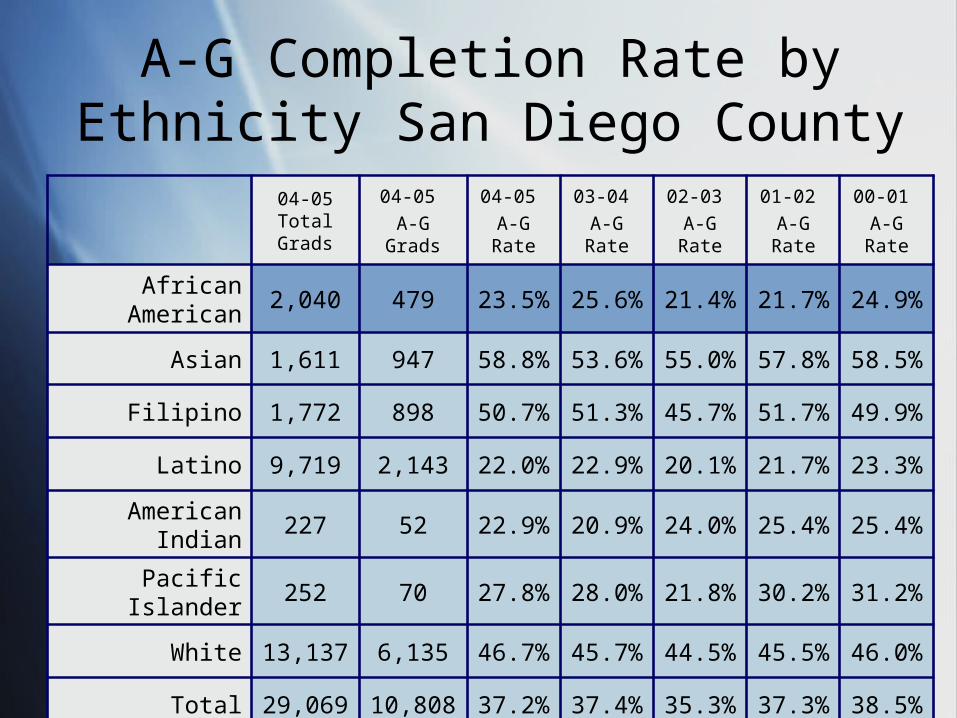
A-G Completion Rate by Ethnicity San Diego County
04-05 Total Grads
04-05
A-G Grads
04-05
A-G Rate
03-04
A-G Rate
02-03
A-G Rate
01-02
A-G Rate
00-01
A-G Rate
African American 2,040 479 23.5% 25.6% 21.4% 21.7% 24.9%
Asian 1,611 947 58.8% 53.6% 55.0% 57.8% 58.5%
Filipino 1,772 898 50.7% 51.3% 45.7% 51.7% 49.9%
Latino 9,719 2,143 22.0% 22.9% 20.1% 21.7% 23.3%
American Indian 227 52 22.9% 20.9% 24.0% 25.4% 25.4%
Pacific Islander 252 70 27.8% 28.0% 21.8% 30.2% 31.2%
White 13,137 6,135 46.7% 45.7% 44.5% 45.5% 46.0%
Total 29,069 10,808 37.2% 37.4% 35.3% 37.3% 38.5%
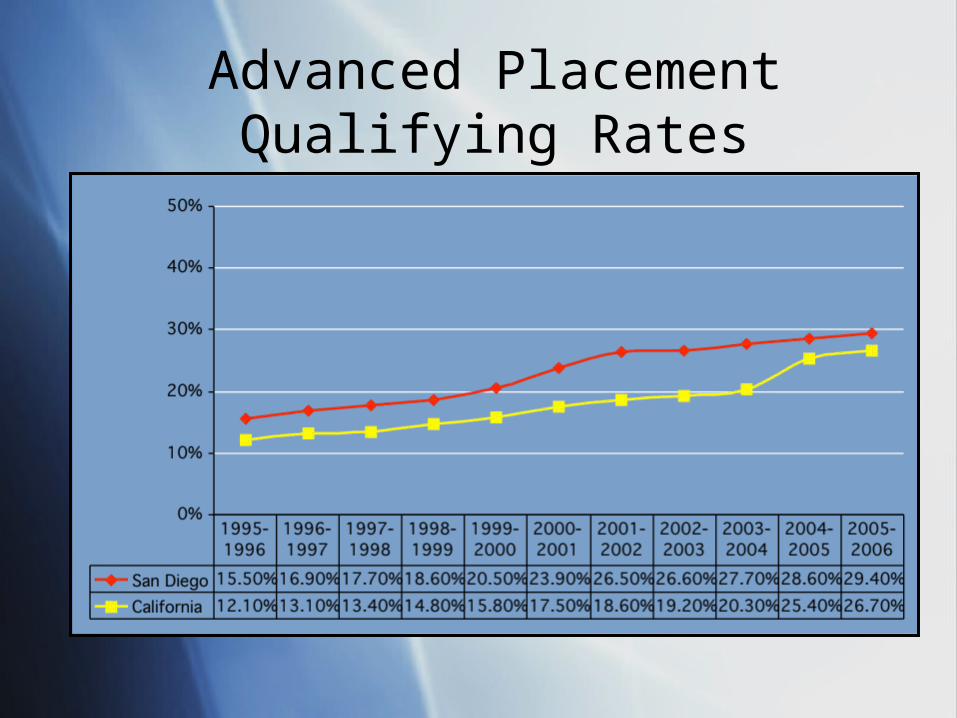
Advanced Placement Qualifying Rates

LATINOSNATIVE
AMERICANSAFRICAN
AMERICANWHITES
ASIANAMERICAN
100/100Elementary School
Students
100/100Elementary School
Students
100/100Elementary School
Students
100/100Elementary School
Students
100/100Elementary School
Students
54/51Graduate from High
School
72/70Graduate from High
School
73/71Graduate from High
School
84/83Graduate from High
School
78/83Graduate from High
School
11/10Graduate from
College
12/11Graduate from
College
15/13Graduate from
College
24/28Graduate from
College
40/48Graduate from
College
4/4Graduate from
Graduate School
4/4Graduate from
Graduate School
5/4Graduate from
Graduate School
8/11Graduate from
Graduate School
13/22Graduate from
Graduate School
0.3/0.4Graduate with
Doctorate
0.4/0.6Graduate with
Doctorate
0.3/0.5Graduate with
Doctorate
0.6/1.4Graduate with
Doctorate
1.4/4.4Graduate with
Doctorate
U.S. Educational Pipeline by Race, Ethnicity U.S. Educational Pipeline by Race, Ethnicity and Gender, 2000and Gender, 2000
Note: First/Second number in each box: Female/Male Source: U.S. Bureau of the Census, 2000Note: First/Second number in each box: Female/Male Source: U.S. Bureau of the Census, 2000

U.S. Median Income by Education Level, 2004
Source: National Center for Education Statistics, 2006
SomeCollege
NotHigh SchoolGraduates
High SchoolGraduates Bachelor’s
Master’sDegree
18,874 26,104 30,610 42,087 51,733
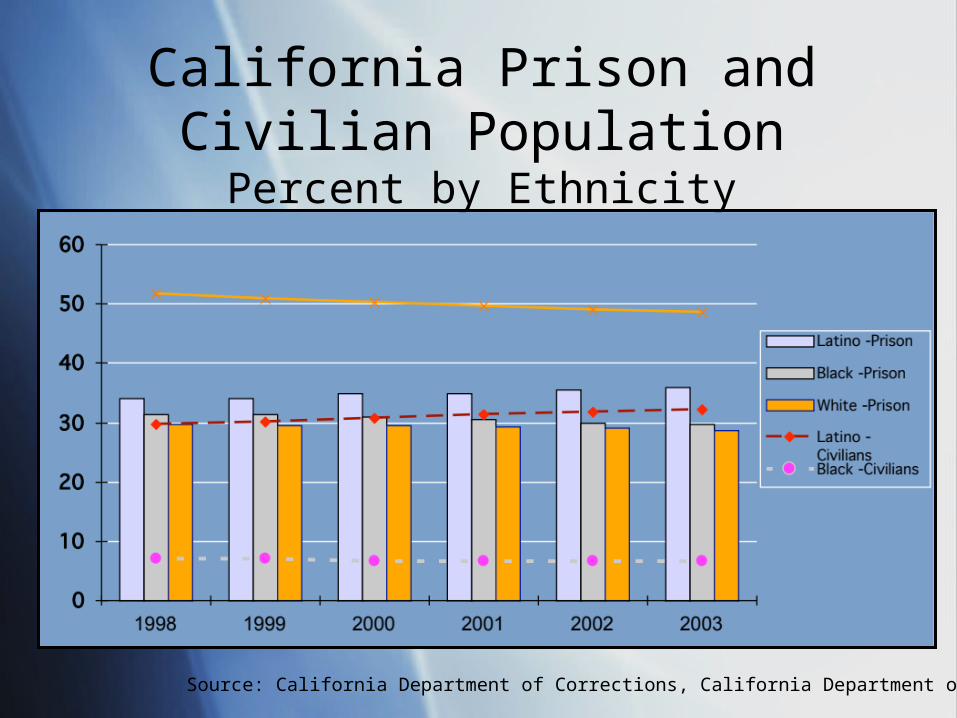
California Prison and Civilian Population
Percent by Ethnicity
Source: California Department of Corrections, California Department of Finance
Identified NeedsIdentified Needs
Cultural Competency
Differentiated Instruction
High Expectations/Curriculum Rigor
Community & Parent Involvement
Cultural Competency
Differentiated Instruction
High Expectations/Curriculum Rigor
Community & Parent Involvement
CA Parent StandardsCA Parent Standards
Standard 1 - Parenting
Standard 2 - Communicating
Standard 3 - Volunteering
Standard 4 - Learning at Home
Standard 5 - Governance and Decision Making
Standard 6 - Collaborating with the Community
Standard 1 - Parenting
Standard 2 - Communicating
Standard 3 - Volunteering
Standard 4 - Learning at Home
Standard 5 - Governance and Decision Making
Standard 6 - Collaborating with the Community
ProcessProcess
1. Create an Action Team
2. Examine Current Practice Identify Services Identify Resources
3. Conduct a Needs Assessment Identify Priorities
4. Develop a Plan of Action Who? What? Where? When? Funding Timeline
1. Create an Action Team
2. Examine Current Practice Identify Services Identify Resources
3. Conduct a Needs Assessment Identify Priorities
4. Develop a Plan of Action Who? What? Where? When? Funding Timeline
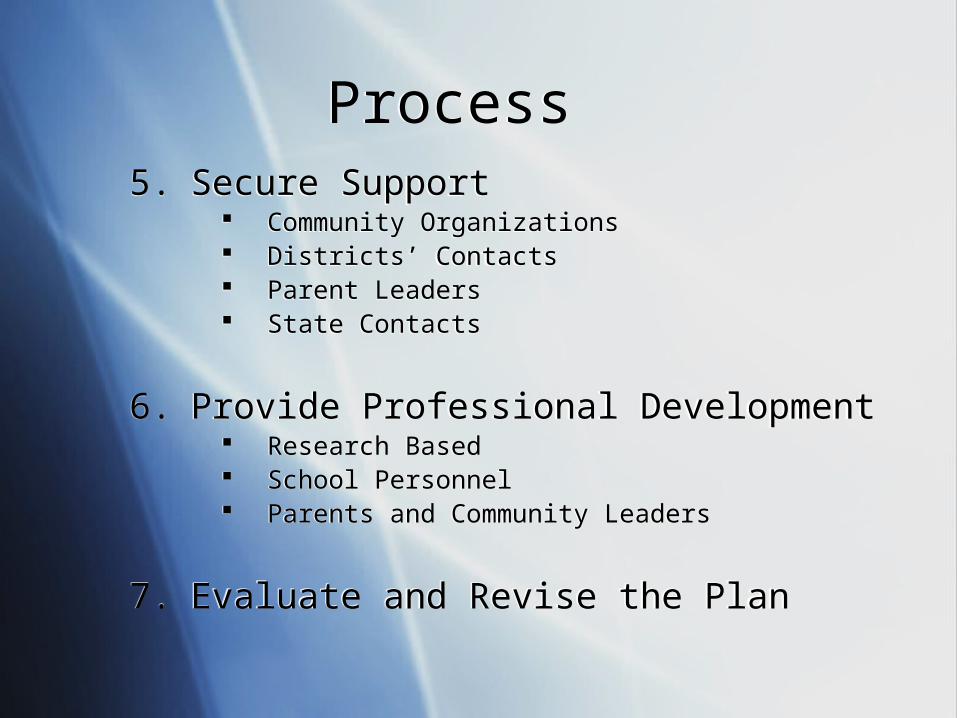
Process Process 5. Secure Support
Community Organizations Districts’ Contacts Parent Leaders State Contacts
6. Provide Professional Development Research Based School Personnel Parents and Community Leaders
7. Evaluate and Revise the Plan
5. Secure Support Community Organizations Districts’ Contacts Parent Leaders State Contacts
6. Provide Professional Development Research Based School Personnel Parents and Community Leaders
7. Evaluate and Revise the Plan

PTA/CommunityPTA/Community
Knowledge of Competence in the Community Cultural Sensitivity
Ownership of Trainings Key Keynote Speakers Respect
Knowledge of Competence in the Community Cultural Sensitivity
Ownership of Trainings Key Keynote Speakers Respect
PTA/CommunityPTA/Community
Resources Practical National Parent Standard
Recruitment Outreach to Minority Families
Resources Practical National Parent Standard
Recruitment Outreach to Minority Families

Fostering Home/School/Community Partnerships
Fostering Home/School/Community Partnerships
Source of expertise, financial support and volunteer services.
Developed with community organizations, individual families, local businesses, corporations and colleges/universities.
Source of expertise, financial support and volunteer services.
Developed with community organizations, individual families, local businesses, corporations and colleges/universities.
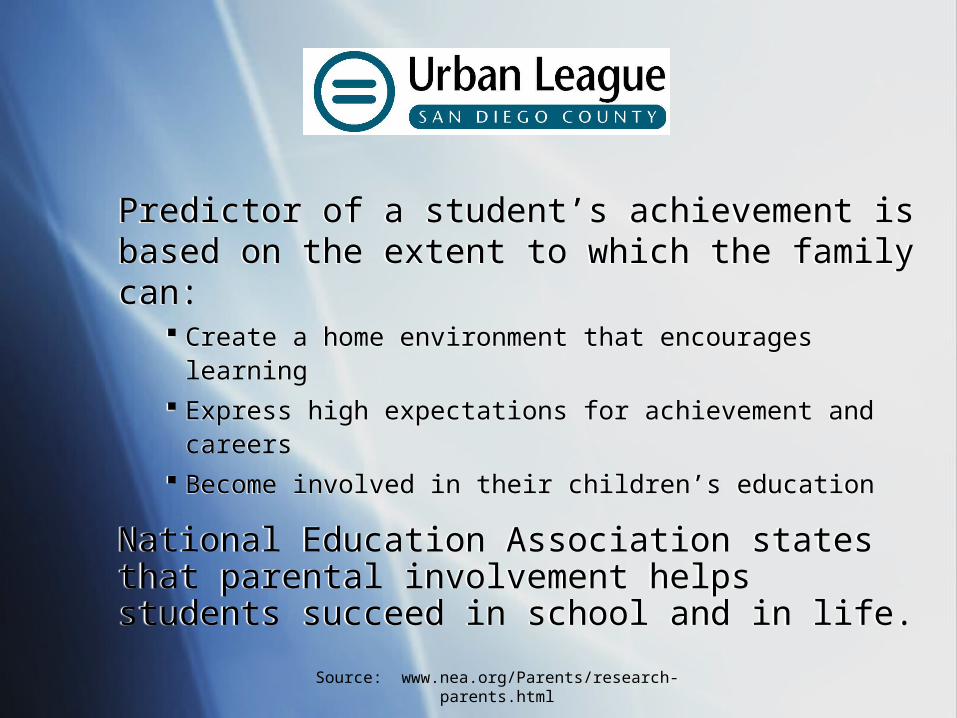
Source: www.nea.org/Parents/research-parents.html
Predictor of a student’s achievement is based on the extent to which the family can:
Create a home environment that encourages learning
Express high expectations for achievement and careers
Become involved in their children’s education
National Education Association states that parental involvement helps students succeed in school and in life.
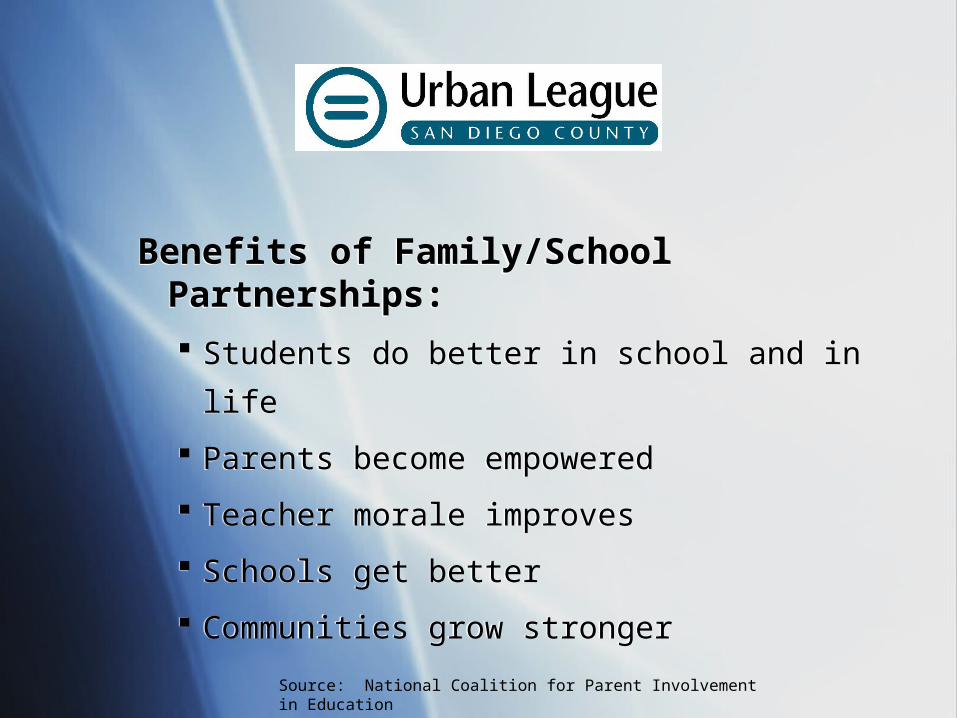
Source: National Coalition for Parent Involvement in Education
Benefits of Family/School Partnerships:
Students do better in school and in life
Parents become empowered
Teacher morale improves
Schools get better
Communities grow stronger
Benefits of Family/School Partnerships:
Students do better in school and in life
Parents become empowered
Teacher morale improves
Schools get better
Communities grow stronger
Norma Gómez (858) [email protected]
www.sdcoe.net/lret2/family
Brian Bonner (858) 268-8077
Tony Brown (619) 266-6254
Norma Gómez (858) [email protected]
www.sdcoe.net/lret2/family
Brian Bonner (858) 268-8077
Tony Brown (619) 266-6254


