
Strategies for Pulling the Goalie in Hockeytim/papers/goalie.pdf · Strategies for Pulling the...
27
Strategies for Pulling the Goalie in Hockey David Beaudoin and Tim B. Swartz * Abstract This paper develops a simulator for matches in the National Hockey League (NHL) with the intent of assessing strategies for pulling the goaltender. Aspects of the approach that are novel include breaking the game down into finer and more realistic situations, introducing the effect of penalties and including the home-ice advantage. Parameter estimates used in the simulator are obtained through the analysis of an extensive data set using constrained Bayesian estimation via Markov chain methods. Some surprising strategies are obtained which do not appear to be used by NHL coaches. Keywords : Bayes constrained estimation, Markov chain Monte Carlo, National Hockey League, Simulation. * David Beaudoin is Assistant Professor, D´ epartement Op´ erations et Syst` emes de D´ ecision, Facult´ e des Sciences de l’Administration, Pavillon Palasis-Prince, Bureau 2636, Universit´ e Laval, Qu´ ebec (Qu´ ebec), Canada G1V0A6. Tim Swartz is Professor, Department of Statistics and Actuarial Science, Simon Fraser University, 8888 University Drive, Burnaby BC, Canada V5A1S6. Both authors have been partially supported by research grants from the Natural Sciences and Engineering Research Council of Canada. Beaudoin thanks the Mathematics and Statistics Department at Laval for the use of its computing resources. The authors are appreciative of helpful comments provided by the Editor, the Associate Editor and two referees. 1
Transcript of Strategies for Pulling the Goalie in Hockeytim/papers/goalie.pdf · Strategies for Pulling the...
Strategies for Pulling the Goalie in Hockey
David Beaudoin and Tim B. Swartz ∗
Abstract
This paper develops a simulator for matches in the National Hockey League (NHL)
with the intent of assessing strategies for pulling the goaltender. Aspects of the
approach that are novel include breaking the game down into finer and more realistic
situations, introducing the effect of penalties and including the home-ice advantage.
Parameter estimates used in the simulator are obtained through the analysis of an
extensive data set using constrained Bayesian estimation via Markov chain methods.
Some surprising strategies are obtained which do not appear to be used by NHL
coaches.
Keywords : Bayes constrained estimation, Markov chain Monte Carlo, National Hockey
League, Simulation.
∗David Beaudoin is Assistant Professor, Departement Operations et Systemes de Decision, Faculte des
Sciences de l’Administration, Pavillon Palasis-Prince, Bureau 2636, Universite Laval, Quebec (Quebec),
Canada G1V0A6. Tim Swartz is Professor, Department of Statistics and Actuarial Science, Simon Fraser
University, 8888 University Drive, Burnaby BC, Canada V5A1S6. Both authors have been partially
supported by research grants from the Natural Sciences and Engineering Research Council of Canada.
Beaudoin thanks the Mathematics and Statistics Department at Laval for the use of its computing
resources. The authors are appreciative of helpful comments provided by the Editor, the Associate
Editor and two referees.
1
1 INTRODUCTION
We motivate our problem by considering game three of the semifinal series (tied at
one game apiece) between the Quebec Remparts and the Shawinigan Cataractes in the
QMJHL (Quebec Major Junior Hockey League) held on April 21st, 2009. The home
team, Shawinigan, is leading 3-0 in the third period, much to the delight of the capacity
crowd at the Bionest Centre. However, the referees call two consecutive penalties to the
Cataractes with 13:06 and 12:22 minutes remaining. With his team about to play 5-on-3,
the Remparts’ famous head coach, Patrick Roy, elects to “pull” his goalie in order to go
6-on-3 (i.e. replace his goaltender with a skater). Perhaps the best goaltender to ever play
the game, Roy was known as a fighter. This bold move shows he is no different in his
coaching duties. He believes that the Remparts have to score during the two-man advan-
tage to have a reasonable shot at coming back in the game, so he decides to go all-in.
The move backfires as the Cataractes score an empty-net goal with 11:58 left in the third
period. The game ends 4-1 in favor of Shawinigan. Some angry fans called the strategy
“stupid” in postgame radio shows. Others thought it was a good decision, even though
it did not turn out favorably in this particular game, reminding everyone that this very
same strategy led to a goal 16 days earlier in the Remparts previous series against Cape
Breton. So who was right? Does this strategy improve a team’s probability of winning the
game? This is a question that would be best served via an objective statistical analysis.
Before going further and to add some context to the above paragraph, we provide
some basic facts about the game of ice hockey, or hockey as it is known in North America.
Hockey is played with six players per side consisting of five “skaters” and a goaltender.
The goaltender generally remains close to his “net” and attempts to prevent “goals” which
occur when the “puck” enters the net. Typically, skaters are on the ice for intervals of
less than one minute, and are continuously replaced due to the exhaustive fast-paced
2
style of the game. During a game, “penalties” occur for player infractions and these are
assessed by the on-ice officials (referees and linesmen). When a minor or a major penalty
occurs (two minutes and five minutes in duration, respectively), the offending player is
sent to the “penalty box” and his team is forced to play “shorthanded”. This period of
time is known as a “power-play” for the opponent and it provides them with a better
opportunity to score a goal. If a goal is scored by the opponent during a power-play
resulting from a minor penalty, the offending player is released from the penalty box.
“Offsetting” penalties occur when each team is assessed a penalty of the same type; in
the case of offsetting major penalties, the two players are sent to the penalty box but the
teams do not play shorthanded. For multiple penalties that are not offsetting, the rules
are more complex and we refer the reader to www.nhl.com/ice/page.htm?id=26299.
Hockey is played at the highest level in the National Hockey League (NHL) which
consists of 30 teams located in the United States and Canada. A NHL season is 82 games
in length where a game is 60 minutes long, divided into three “periods” of 20 minutes. At
the end of regulation time in the NHL, the team which has the greatest number of goals
wins the game. If a game is tied at the end of regulation time, the game is extended for
five minutes of “sudden-death overtime” whereby the first team to score wins the match.
In overtime, the two teams play shorthanded, 4-on-4 with respect to skaters. If the game
remains tied at the end of overtime, there is a “shootout” where three players for each
team take a “penalty shot”. The team with the most penalty goals wins the game. If
the match is still tied, a single penalty shot is taken by each team, and this continues
in a sudden-death fashion until one team has scored and the other team has not scored.
The team which wins the game is awarded two points in the standings. If a team loses in
overtime or in a shootout, they are awarded a single point.
Finding better strategies for pulling the goalie in hockey is important to teams as it
3
may provide them with a few more points in the standings every year. This can be the
difference between making the playoffs or not. It can also result in home-ice advantage in
a playoff series. In other words, using improved strategies can provide additional millions
of dollars to a team. Yet, the topic is seldom discussed and very few statistical analyses
have investigated the problem. Coaches simply rely on conventional wisdom, or on what
has been done for decades in the world of hockey. According to St. Louis Blues head
coach Andy Murray, “I think a guide rule is if you’re down by two goals, you pull him
with about two minutes remaining. Or if you’re down by one goal, you’re looking at
the one-minute mark.” But is that really the correct strategy? And what about more
complex situations like the one described above, where a team trailing by three goals has
a two-man power-play with 12 minutes left?
The first paper on the subject of pulling the goaltender was written by Morrison
(1976). It contains a major flaw, as pointed out by Morrison and Wheat (1986): the
analysis compares the strategy of pulling the goalie at time t with the strategy of never
pulling the goalie. In other words, this paper omits the case where a coach pulls his goalie
later at some time t1 > t. Morrison and Wheat (1986) correct the mistake and investigate
the optimal time for pulling the goalie when teams are of equal strength. The paper
argues that teams have a general scoring rate of L goals per minute. When a team pulls its
goaltender, its scoring rate increases to 2.67L goals per minute, and the opponent’s scoring
rate increases to 7.83L goals per minute when facing the open net. This assumption is
referred to as the proportional assumption. Erkut (1987) generalizes the method to the
situation where teams have different scoring rates. Nydick and Weiss (1989) argue that
the proportional assumption for estimating the scoring rates in situations where a team
pulls its goalie may not be adequate. Therefore, they suggest the use of situational rates
which are constant across teams. Their work shows that results can be quite different
4
depending on the estimation method chosen.
Washburn (1991) proposes a dynamic programming approach for determining the
optimal time to pull the goalie. The author mentions that previous work concerns the
probability that the team currently trailing scores before the opponent scores, and also
before time expires in the game. He raises an important point: “Strictly speaking, scoring
first is neither necessary nor sufficient for victory.” A team trailing by a goal might tie
the game but give up another goal before regulation ends. Washburn (1991) finds the
optimal decision with respect to a recursive equation.
More recently, Berry (2000) assumes that the time until a goal is scored follows an
exponential distribution. Accordingly, he calculates the probability that a team trailing
by one goal scores within the next t minutes and scores before their opponent. The
author estimates various scoring rates by considering lower and upper bounds, claiming
that “The NHL does not keep track (or at least I couldn’t find them) of goals scored for
the team that pulled their goalie.”
Finally, Zaman (2001) considers the problem from a Markov chain point of view.
The author defines seven possible states for the Markov chain: Goal A, Shot A, Zone B,
Neutral, Zone A, Shot B, Goal B. He estimates transition probabilities based on data, and
he argues that symmetry allows one to reduce the number of parameters to be estimated.
The methodology suggests pulling the goalie when trailing by one goal with five to eight
minutes left, depending on the current location of the puck (defensive/neutral/offensive
zone).
This paper extends the approach of Berry (2000) in a number of ways to enhance
the realism of the problem. We develop a simulation program to simulate hockey games
under specified strategies with respect to pulling the goaltender. Under large numbers of
simulations, we are able to approximate expected results and therefore assess strategies.
5
Our approach incorporates penalties in the simulation, a non-negligible aspect of hockey.
We also consider the effect of the home-ice advantage, and the impact of overtime and
shootouts, reflecting the current state of affairs in the NHL. Previous papers are based
upon general scoring rates, whose estimation combines all possible situations (e.g. 5-on-5,
5-on-4, 4-on-5, etc. with respect to the number of skaters). We simulate games keeping the
situations distinct and we develop a Bayesian approach based on Markov chain methods
to obtain the scoring rates. In addition, we are able to modify scoring rates according to
whether a team is average, above average or below average. As a check of model adequacy,
the simulation model mimics actual NHL games extremely well. The simulation program
is very flexible, and we imagine that our contribution will be useful as more and more
teams adopt sports analytics.
Although it is tempting to discuss “optimal” strategies with respect to pulling the
goaltender, we believe that the notion of optimality is somewhat misguided. For example,
suppose that a team is interested in the best time to pull its goaltender when trailing by
a goal and the opponent has a penalty. Suppose further that this situation presents itself
with 9 minutes remaining in a hockey game. With 9 minutes left in the game on a power-
play and trailing by one goal, the decision that faces a coach is whether the goaltender
should be pulled now. He cannot ask himself whether he should pull the goaltender with
6 minutes left in the game as the situation may change. Most likely, one of the teams
will have scored or the penalty will have expired. In determining optimality, we note
that there are an enormous (possibly infinite) number of strategies concerning pulling the
goaltender as complete strategies are based on pre-planned rules for every conceivable
situation involving the score, the time remaining, the number of skaters on the ice, etc.
Therefore, the best one might do is create a list of plausible strategies and determine
optimality from the set.
6
In our enhanced analysis which considers game situations, teams are faced with an-
swering a simple question - should they pull the goalie now under the given situation?
What we can do is investigate the choice in comparison to standard strategies such as
pulling one’s goalie with one minute remaining when trailing given the current situation.
Therefore the focus of the paper is not on optimal strategies, but rather, we investigate
the effect of pulling the goalie under situations of interest. We can assess whether pulling
the goalie under a given situation is a wise decision. Moreover, there are many situations
that are tenable and are worthy of investigation.
In Section 2, we describe the data collection process, an enormously tedious task that is
essential in obtaining a realistic simulator. The data is taken from the 2007-2008 season of
the NHL. Hence, the results (being sensitive to scoring rates) are only directly applicable
to the NHL. In the process of collecting the data, various observations were made. We
present these in a series of Remarks in Section 2. Some of the Remarks are surprising,
while others address folklore that has not been previously investigated via data. Remark
#2 which concerns a comparison of penalty rates between home and visiting teams may
even be an officiating concern for the NHL. In Section 3, we provide a description of the
simulaton scheme where various assumptions are supported by statistical theory. The
realism of the simulator is dependent on the estimation of scoring rates and the Bayesian
estimation procedure is discussed in Section 4. In Section 5, we provide some of our
simulation results. Some of the proposed strategies are provocative, and to our knowledge,
have never been attempted. Our simulator is extremely flexible, and we encourage General
Managers to investigate specific strategies tailored to their own teams and opponents. We
conclude with a short discussion in Section 6.
7
2 DATA ANALYSIS
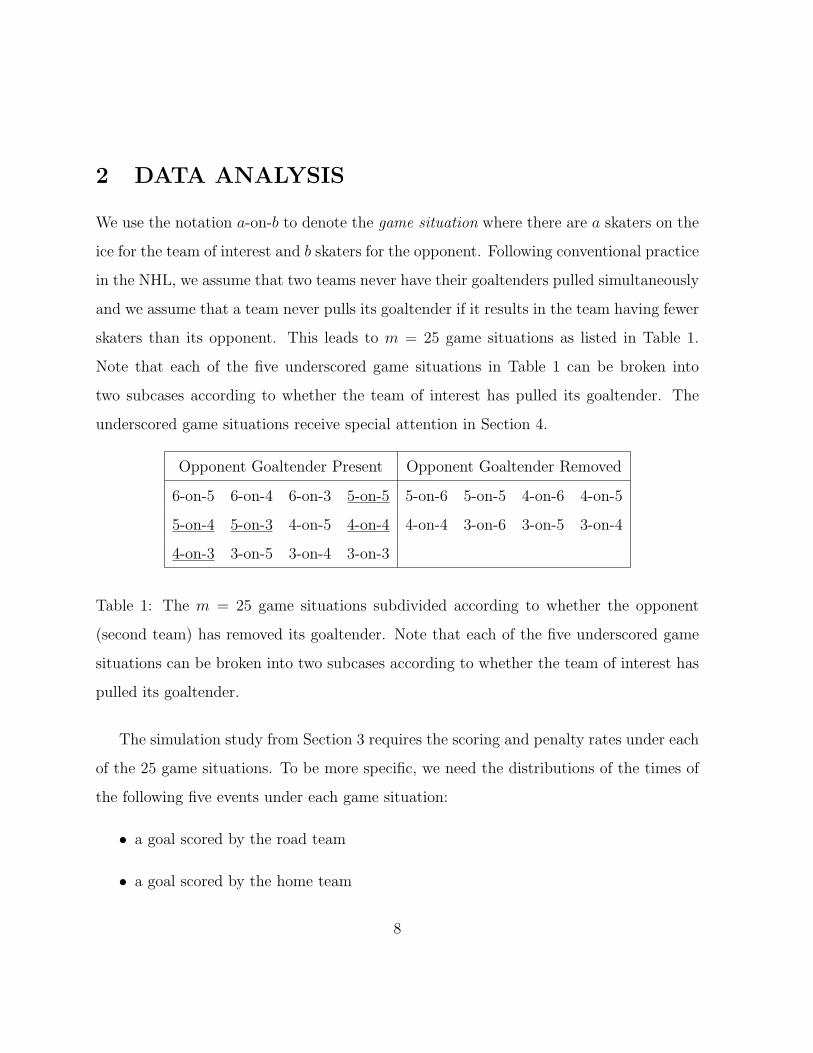
We use the notation a-on-b to denote the game situation where there are a skaters on the
ice for the team of interest and b skaters for the opponent. Following conventional practice
in the NHL, we assume that two teams never have their goaltenders pulled simultaneously
and we assume that a team never pulls its goaltender if it results in the team having fewer
skaters than its opponent. This leads to m = 25 game situations as listed in Table 1.
Note that each of the five underscored game situations in Table 1 can be broken into
two subcases according to whether the team of interest has pulled its goaltender. The
underscored game situations receive special attention in Section 4.
Opponent Goaltender Present Opponent Goaltender Removed
6-on-5 6-on-4 6-on-3 5-on-5 5-on-6 5-on-5 4-on-6 4-on-5
5-on-4 5-on-3 4-on-5 4-on-4 4-on-4 3-on-6 3-on-5 3-on-4
4-on-3 3-on-5 3-on-4 3-on-3
Table 1: The m = 25 game situations subdivided according to whether the opponent
(second team) has removed its goaltender. Note that each of the five underscored game
situations can be broken into two subcases according to whether the team of interest has
pulled its goaltender.
The simulation study from Section 3 requires the scoring and penalty rates under each
of the 25 game situations. To be more specific, we need the distributions of the times of
the following five events under each game situation:
• a goal scored by the road team
• a goal scored by the home team
8
• a two-minute penalty called on the road team
• a two-minute penalty called on the home team
• an offsetting minor penalty
This investigation omits 4-minute and 5-minute penalties because they are rare. Future
work could easily incorporate these events. For parameter estimation as described in
Section 4, we require the following match data under each game situation:
• total time played in minutes
• number of road goals
• number of home goals
• number of two-minute penalties called on the road team
• number of two-minute penalties called on the home team
• number of offsetting minor penalties
Data are not readily available in the form listed above. For example, whereas the
total number of penalties during a game is typically recorded, it is not the case that the
penalties are summarized in tandem with the corresponding game situation. However,
the information can be determined by looking carefully at detailed game records. This
enables us to determine the starting and ending times of every penalty.
We have collected data on all games from the 2007-2008 NHL season. The National
Hockey League’s official website (www.nhl.com) provides detailed ice time for each player,
including goaltenders. Our resultant data file contains over 28,000 rows where each row
9
corresponds to one of the five events described above with its corresponding situation, or
a game situation change (for example the expiration of a penalty, or a pulled goaltender).
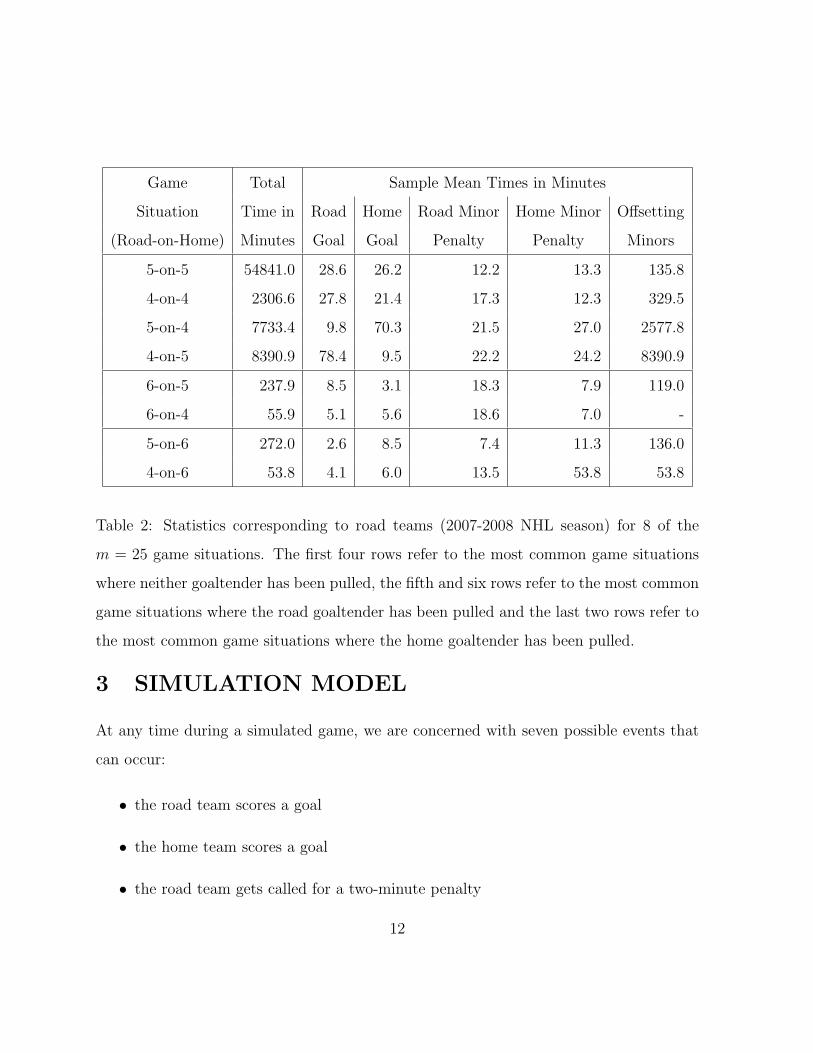
The data enables us to compute the sample mean times (in minutes) of the five events
for each team under each game situation. In Table 2, we present aggregate results for
road teams under 8 of the m = 25 game situations. Note that the sample mean times
for home teams can be deduced from Table 2. We now provide a series of remarks based
on the data. Remarks 3, 4 and 5 can be inferred directly from Table 2. The remaining
remarks are obtained from Table 2 combined with the 17 unreported situations (which
comprise only 1.1% of the total minutes played during the 2007-2008 NHL season).
Remark #1 As expected, home teams perform better than road teams. The number of
goals scored is 3497 to 3182 in favor of home teams (2.9 versus 2.6 per game).
Remark #2 Road teams are called for more penalties than home teams in an 11:10
ratio (5433 to 4939). This is in line with the common perception that referees are
influenced by the home crowd.
Remark #3 Combining road and home statistics, a goal is scored by either team every
13.7 minutes when playing 5-on-5 with both goaltenders. Common sense dictates
that more goals ought to be scored when teams are playing 4-on-4 with both goal-
tenders, which is the case here since a goal is scored every 12.1 minutes.
Remark #4 For the pulled goalie strategy to be effective, a necessary condition is that
the team pulling the goaltender has to score at a higher rate when playing 6-on-5
than 5-on-5 with both goaltenders. Combining road and home statistics, teams
playing 6-on-5 score a goal every 8.5 minutes, which is way below the sample means
of 28.6 and 26.2 minutes when playing 5-on-5 with both goaltenders for the road
10
and home teams, respectively. Therefore, the decision to pull a goalie when trailing
late in the game seems promising.
Remark #5 One feature of this work that has not previously been investigated is the
option of pulling the goalie during a power-play (just like the example described in
Section 1). Based on the data, teams that decide to put an extra attacker on the ice
to create a 6-on-4 situation score a goal every 5.5 minutes and allow an empty-net
goal every 4.8 minutes. In other words, not only does the strategy force a goal to
be scored more quickly, but teams that pull their goalie are almost as likely to score
a goal as to allow one.
Remark #6 Here is one very important argument in favor of pulling the goalie that has
not been discussed in the past: sending an extra attacker on the ice seems to induce
more penalties called on the team that is trying to defend its lead. In the 2007-2008
NHL season, 652.4 minutes were played with a goalie pulled. During that time, 44
penalties were called on the team which pulled the goalie versus 84 penalties on
their opponents. This is almost a 1:2 ratio. From a slightly different perspective,
penalties are called on the opponent more frequently when playing 6-on-5 (every
7.4 minutes and every 7.9 minutes for the road and home teams respectively) versus
playing 5-on-5 with both goaltenders (every 12.2 minutes and every 13.3 minutes
for the road and home teams respectively). As a result, pulling your goalie not only
increases the scoring rates, but it also makes your team much more likely to get a
power-play!
11
Game Total Sample Mean Times in Minutes
Situation Time in Road Home Road Minor Home Minor Offsetting
(Road-on-Home) Minutes Goal Goal Penalty Penalty Minors
5-on-5 54841.0 28.6 26.2 12.2 13.3 135.8
4-on-4 2306.6 27.8 21.4 17.3 12.3 329.5
5-on-4 7733.4 9.8 70.3 21.5 27.0 2577.8
4-on-5 8390.9 78.4 9.5 22.2 24.2 8390.9
6-on-5 237.9 8.5 3.1 18.3 7.9 119.0
6-on-4 55.9 5.1 5.6 18.6 7.0 -
5-on-6 272.0 2.6 8.5 7.4 11.3 136.0
4-on-6 53.8 4.1 6.0 13.5 53.8 53.8
Table 2: Statistics corresponding to road teams (2007-2008 NHL season) for 8 of the
m = 25 game situations. The first four rows refer to the most common game situations
where neither goaltender has been pulled, the fifth and six rows refer to the most common
game situations where the road goaltender has been pulled and the last two rows refer to
the most common game situations where the home goaltender has been pulled.
3 SIMULATION MODEL
At any time during a simulated game, we are concerned with seven possible events that
can occur:
• the road team scores a goal
• the home team scores a goal
• the road team gets called for a two-minute penalty
12
• the home team gets called for a two-minute penalty
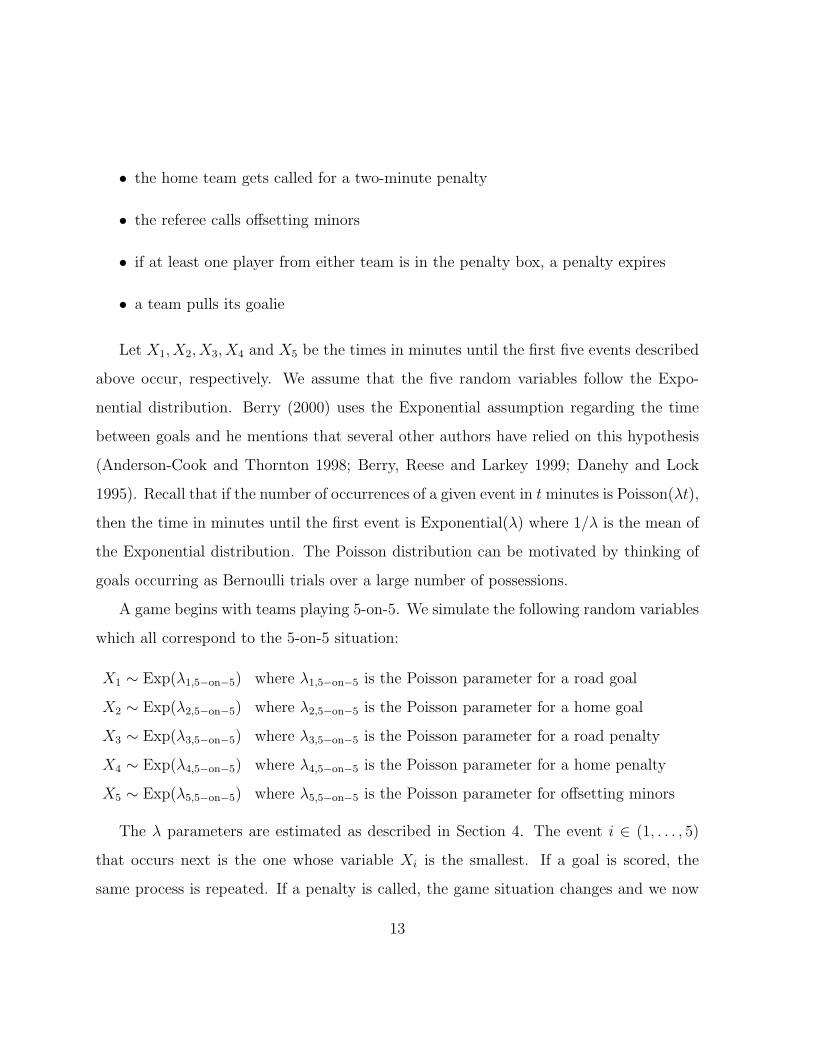
• the referee calls offsetting minors
• if at least one player from either team is in the penalty box, a penalty expires
• a team pulls its goalie
Let X1, X2, X3, X4 and X5 be the times in minutes until the first five events described
above occur, respectively. We assume that the five random variables follow the Expo-
nential distribution. Berry (2000) uses the Exponential assumption regarding the time
between goals and he mentions that several other authors have relied on this hypothesis
(Anderson-Cook and Thornton 1998; Berry, Reese and Larkey 1999; Danehy and Lock
1995). Recall that if the number of occurrences of a given event in t minutes is Poisson(λt),
then the time in minutes until the first event is Exponential(λ) where 1/λ is the mean of
the Exponential distribution. The Poisson distribution can be motivated by thinking of
goals occurring as Bernoulli trials over a large number of possessions.
A game begins with teams playing 5-on-5. We simulate the following random variables
which all correspond to the 5-on-5 situation:
X1 ∼ Exp(λ1,5−on−5) where λ1,5−on−5 is the Poisson parameter for a road goal
X2 ∼ Exp(λ2,5−on−5) where λ2,5−on−5 is the Poisson parameter for a home goal
X3 ∼ Exp(λ3,5−on−5) where λ3,5−on−5 is the Poisson parameter for a road penalty
X4 ∼ Exp(λ4,5−on−5) where λ4,5−on−5 is the Poisson parameter for a home penalty
X5 ∼ Exp(λ5,5−on−5) where λ5,5−on−5 is the Poisson parameter for offsetting minors
The λ parameters are estimated as described in Section 4. The event i ∈ (1, . . . , 5)
that occurs next is the one whose variable Xi is the smallest. If a goal is scored, the
same process is repeated. If a penalty is called, the game situation changes and we now
13
simulate according to the parameters associated with the new game situation. Simulating
under a game situation that involves a minor penalty, if all five random variables take
values which are larger than 2.0, the penalty expires and the teams go back to playing
5-on-5.
Now, how is a goalie pulled in a simulated game? We have defined several indicators
that dictate the coach’s strategy with respect to pulling the goalie. More specifically,
one needs to input the time that the goalie is pulled when trailing by g goals under each
game situation s for all values of g = 1, . . . , 5. For example, one may want to pull the
goalie when currently playing 5-on-5 with 57 minutes played (i.e. three minutes left in
the third period) if trailing by a single goal. As a result, when a team trails by one goal
with three minutes or less left in the game, the simulator pulls the goalie whereby the
Exponential parameters reset to the 6-on-5 situation, and the five random variables are
simulated accordingly.
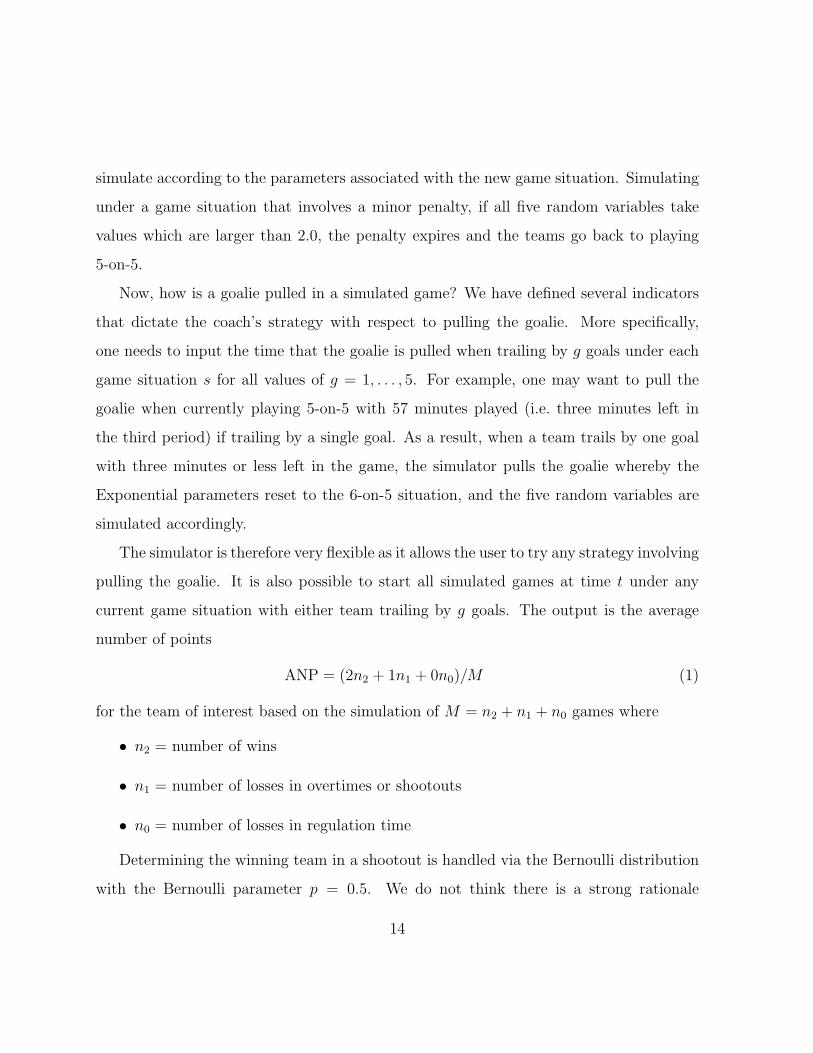
The simulator is therefore very flexible as it allows the user to try any strategy involving
pulling the goalie. It is also possible to start all simulated games at time t under any
current game situation with either team trailing by g goals. The output is the average
number of points
ANP = (2n2 + 1n1 + 0n0)/M (1)
for the team of interest based on the simulation of M = n2 + n1 + n0 games where
• n2 = number of wins
• n1 = number of losses in overtimes or shootouts
• n0 = number of losses in regulation time
Determining the winning team in a shootout is handled via the Bernoulli distribution
with the Bernoulli parameter p = 0.5. We do not think there is a strong rationale
14
for giving either the home or the road team an advantage once the overtime period is
over. The crowd and the referees do not have much impact during shootouts. The data
substantiates the claim as there is no statistically significant difference in shootout victory
rates when comparing home and road teams. Although there is mild evidence that some
teams may be superior at shootouts to other teams, we have not incorporated this effect
into our simulator.
4 BAYESIAN PARAMETER ESTIMATION
As described in Section 3, the NHL game simulator requires distributional parameters for
the generation of Exponential variates corresponding to the times of goals and penalties.
A simple approach to parameter estimation involves the calculation of sample rates cor-
responding to the events of interest, and this is done in the case of penalties. However, in
the case of goal scoring, the simple approach fails to take into account constraints which
are imposed by logic but may not be satisfied when using sample rates. For example, it
is clear that a team should score at a higher rate when playing 5-on-3 than when playing
5-on-4. Sample rates can sometimes be out of alignment due to the rarity of the situation
(e.g. 3-on-3). We take a Bayesian approach to parameter estimation for goal scoring where
constraints are handled in a convenient fashion via a sampling framework. The Bayesian
approach also allows the inclusion of prior beliefs.
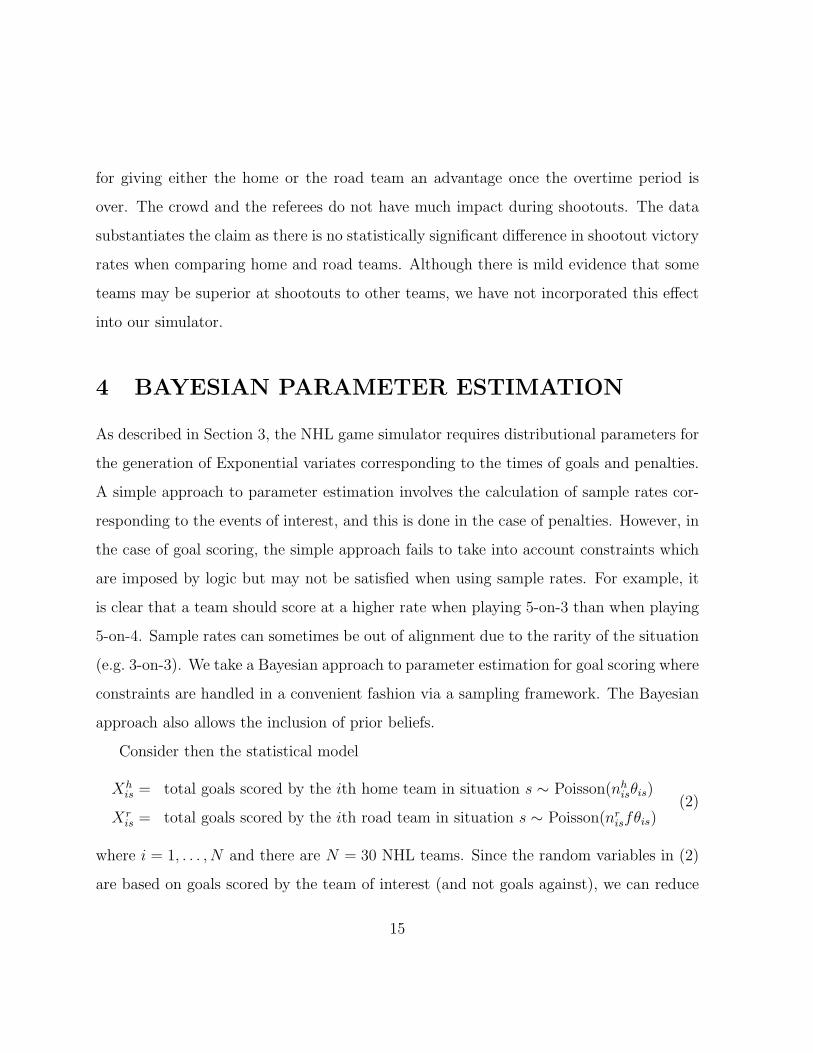
Consider then the statistical model
Xhis = total goals scored by the ith home team in situation s ∼ Poisson(nh
isθis)
Xris = total goals scored by the ith road team in situation s ∼ Poisson(nr
isfθis)(2)
where i = 1, . . . , N and there are N = 30 NHL teams. Since the random variables in (2)
are based on goals scored by the team of interest (and not goals against), we can reduce
15
the number of game situations from m = 25 to m = 20 where we note that the scoring
rates are assumed equal for the pairs of underscored game situations listed in Table 1.
In the statistical model (2), nhis is the total number of minutes played by the ith team
when at home in game situation s and nris is the total number of minutes played by the
ith team when on the road in game situation s. The fraction f is introduced so that the
ratio of the goal scoring rate for home versus away is constant across all situations. The
unknown parameters θis are team and situation specific.
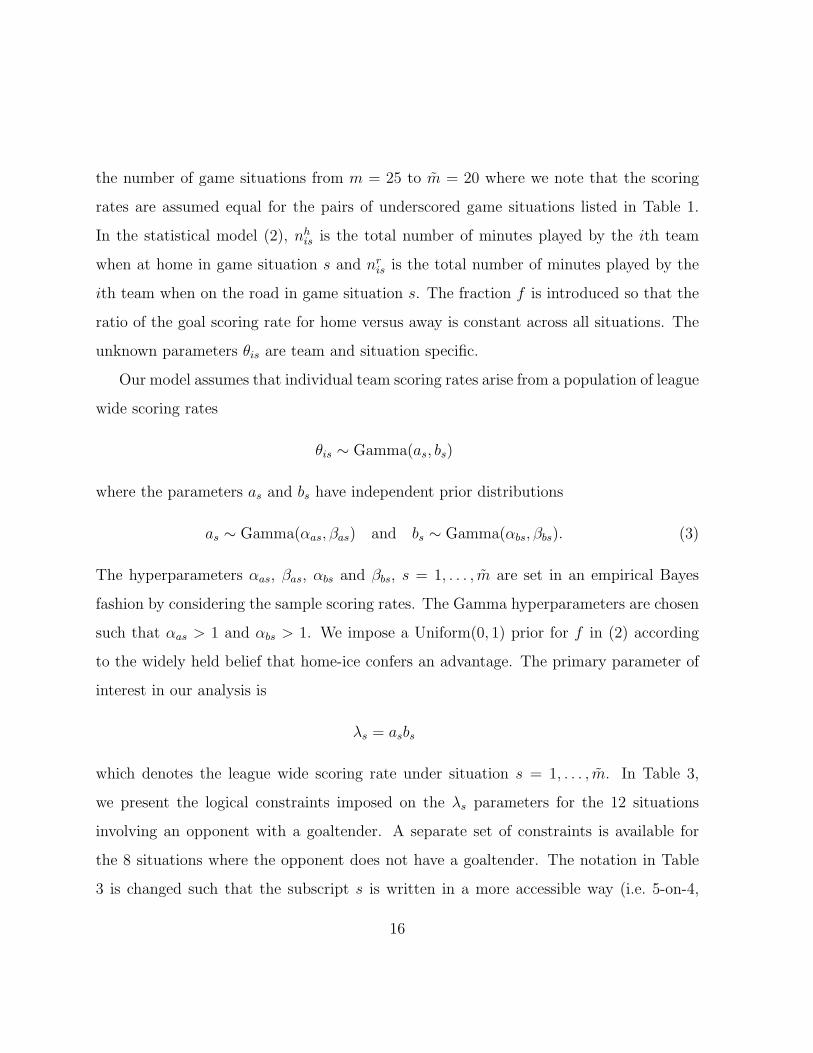
Our model assumes that individual team scoring rates arise from a population of league
wide scoring rates
θis ∼ Gamma(as, bs)
where the parameters as and bs have independent prior distributions
as ∼ Gamma(αas, βas) and bs ∼ Gamma(αbs, βbs). (3)
The hyperparameters αas, βas, αbs and βbs, s = 1, . . . , m are set in an empirical Bayes
fashion by considering the sample scoring rates. The Gamma hyperparameters are chosen
such that αas > 1 and αbs > 1. We impose a Uniform(0, 1) prior for f in (2) according
to the widely held belief that home-ice confers an advantage. The primary parameter of
interest in our analysis is
λs = asbs
which denotes the league wide scoring rate under situation s = 1, . . . , m. In Table 3,
we present the logical constraints imposed on the λs parameters for the 12 situations
involving an opponent with a goaltender. A separate set of constraints is available for
the 8 situations where the opponent does not have a goaltender. The notation in Table
3 is changed such that the subscript s is written in a more accessible way (i.e. 5-on-4,
16
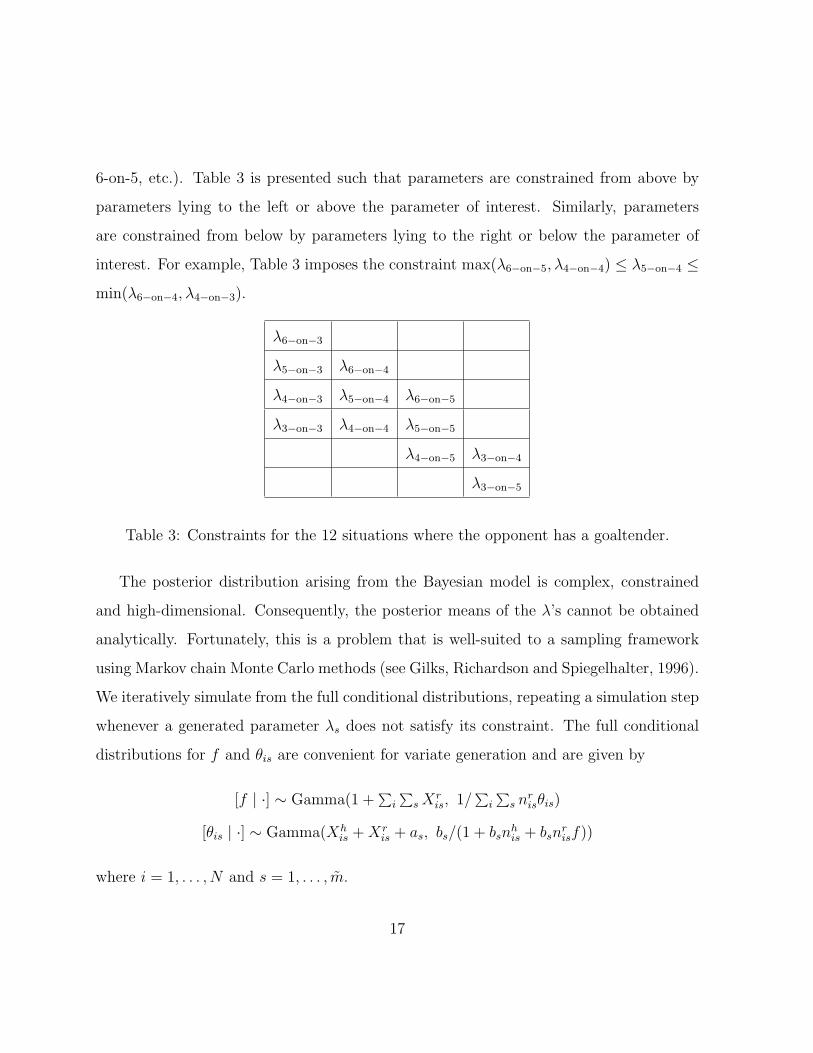
6-on-5, etc.). Table 3 is presented such that parameters are constrained from above by
parameters lying to the left or above the parameter of interest. Similarly, parameters
are constrained from below by parameters lying to the right or below the parameter of
interest. For example, Table 3 imposes the constraint max(λ6−on−5, λ4−on−4) ≤ λ5−on−4 ≤
min(λ6−on−4, λ4−on−3).
λ6−on−3
λ5−on−3 λ6−on−4
λ4−on−3 λ5−on−4 λ6−on−5
λ3−on−3 λ4−on−4 λ5−on−5
λ4−on−5 λ3−on−4
λ3−on−5
Table 3: Constraints for the 12 situations where the opponent has a goaltender.
The posterior distribution arising from the Bayesian model is complex, constrained
and high-dimensional. Consequently, the posterior means of the λ’s cannot be obtained
analytically. Fortunately, this is a problem that is well-suited to a sampling framework
using Markov chain Monte Carlo methods (see Gilks, Richardson and Spiegelhalter, 1996).
We iteratively simulate from the full conditional distributions, repeating a simulation step
whenever a generated parameter λs does not satisfy its constraint. The full conditional
distributions for f and θis are convenient for variate generation and are given by
[f | ·] ∼ Gamma(1 +∑
i
∑sX
ris, 1/
∑i
∑s n
risθis)
[θis | ·] ∼ Gamma(Xhis +Xr
is + as, bs/(1 + bsnhis + bsn
risf))
where i = 1, . . . , N and s = 1, . . . , m.
17
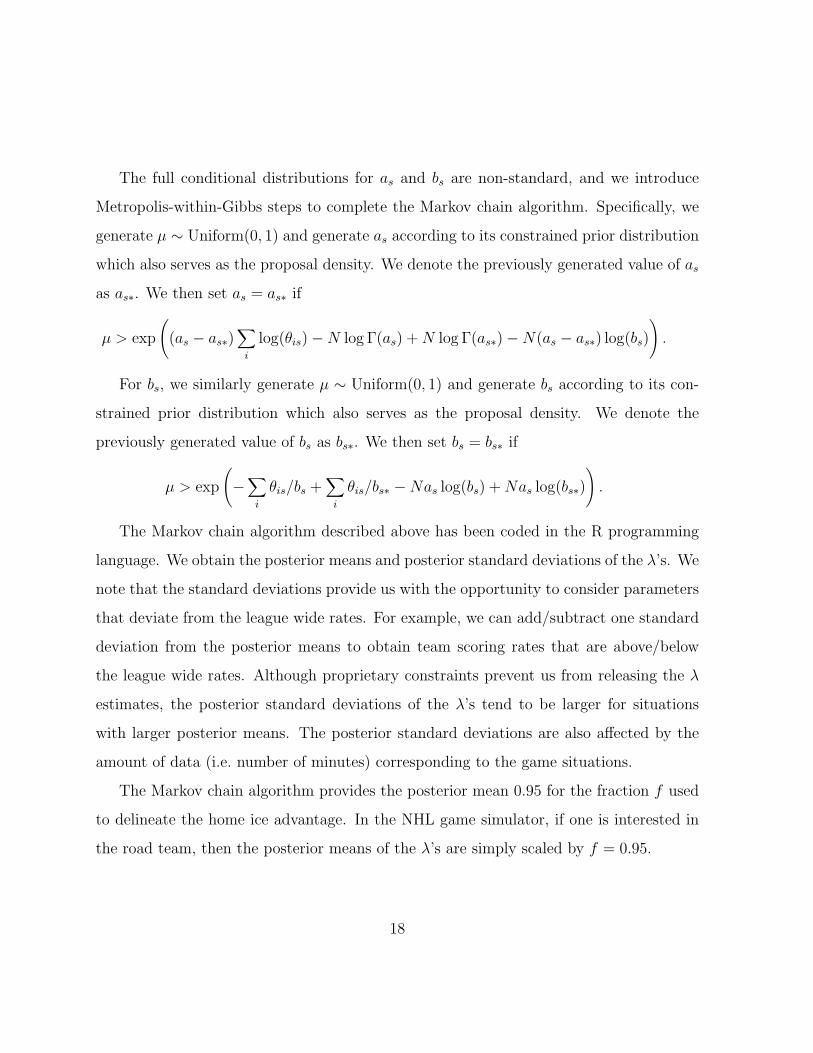
The full conditional distributions for as and bs are non-standard, and we introduce
Metropolis-within-Gibbs steps to complete the Markov chain algorithm. Specifically, we
generate µ ∼ Uniform(0, 1) and generate as according to its constrained prior distribution
which also serves as the proposal density. We denote the previously generated value of as
as as∗. We then set as = as∗ if
µ > exp
((as − as∗)
∑i
log(θis)−N log Γ(as) +N log Γ(as∗)−N(as − as∗) log(bs)
).
For bs, we similarly generate µ ∼ Uniform(0, 1) and generate bs according to its con-
strained prior distribution which also serves as the proposal density. We denote the
previously generated value of bs as bs∗. We then set bs = bs∗ if
µ > exp
(−∑
i
θis/bs +∑
i
θis/bs∗ −Nas log(bs) +Nas log(bs∗)
).
The Markov chain algorithm described above has been coded in the R programming
language. We obtain the posterior means and posterior standard deviations of the λ’s. We
note that the standard deviations provide us with the opportunity to consider parameters
that deviate from the league wide rates. For example, we can add/subtract one standard
deviation from the posterior means to obtain team scoring rates that are above/below
the league wide rates. Although proprietary constraints prevent us from releasing the λ
estimates, the posterior standard deviations of the λ’s tend to be larger for situations
with larger posterior means. The posterior standard deviations are also affected by the
amount of data (i.e. number of minutes) corresponding to the game situations.
The Markov chain algorithm provides the posterior mean 0.95 for the fraction f used
to delineate the home ice advantage. In the NHL game simulator, if one is interested in
the road team, then the posterior means of the λ’s are simply scaled by f = 0.95.
18
5 SIMULATION RESULTS
Our simulator is flexible as it can generate matches from any time point and game situation
under any set of proposed strategies. The simulator also appears to mimic actual NHL
games extremely well. For example, the average number of goals per game by the road
and home teams during the 2007-2008 NHL season are 2.65 and 2.91 respectively. This
compares favorably with the simulated average number of goals per game, 2.68 and 2.91,
by the road and home teams respectively.
We investigate several strategies under different scenarios. The effectiveness of each
strategy is measured by a team’s average number of points ANP given by (1) based on
M = 150 million simulated games. Let yi be the number of points obtained in the ith
simulated hockey game and note that yi takes on the values 0, 1 and 2. Then the half
length of the approximate 95% confidence interval for the mean of ANP is 1.96s/√M <
1.96/√M since max(s2) =
∑max(yi − y)2/(M − 1) ≤ ∑ 12/(M − 1) = M/(M − 1) ≈ 1.
Therefore choosing M = 150 million simulated games provides estimates that are typically
precise to three decimal places.
An analysis of the time when goaltenders were pulled by their coaches during the
2007-2008 NHL season shows that this move is typically done with 1 minute remaining if
a team is trailing by one goal and with 1:30 remaining in the case of a two-goal deficit.
The strategy is generally adopted by NHL coaches no matter the game situation, except
for shorthanded situations, in which case the goaltender is almost never pulled. Let us
call the above decision rules the current strategy. In Tables 4 through 7, we investigate
four scenarios along with various strategies which are listed in order of effectiveness as
measured by their ANP. In each scenario, the opponent uses the same strategy as the
team of interest. The four scenarios are given as follows:
19
A - The road team is trailing by 1 goal with 3 minutes left. Both teams are playing at
full strength (5-on-5).
B - The home team is trailing by 2 goals with 6 minutes left. Both teams are playing at
full strength (5-on-5).
C - The home team is trailing by 1 goal with 1:54 minutes left. The home team is playing
shorthanded (4-on-5) as they just got called for a penalty.
D - The scenario described in Section 1 where the road team is trailing by 3 goals with
12:22 left. The road team has a 5-on-3 power-play with 2:00 minutes and 1:16
minutes remaining in the penalties.
The best strategy with respect to scenario A (see Table 4) is to be extremely ag-
gressive by pulling the goalie until either the game ends, or until the road team ties the
game. In other words, the road team should go all-in. Note that ANP decreases if you
slightly modify this strategy by leaving your goalie in net when playing shorthanded. The
difference between strategies 3 and 4 is that the road team does not wait until there is
one minute left in the game to pull its goalie if trailing by a single goal in any power-play
situation. In such a case, the road coach pulls the goalie immediately.
In scenario B (see Table 5), the current strategy can be improved upon in various
ways. Leaving the home goalie in net, the score will likely remain the same until there is
1:30 left in the game (this is the moment where NHL coaches start thinking about making
a move). At this point, it is pretty much a lost cause for the home team. It’s too late
to reasonably hope for a comeback. The home team needs to be a lot more aggressive.
They need to score quickly, even if it means increasing the risk of being scored against.
Note that the all-in strategy does not do quite as well as the strategy which suggests
pulling the goalie under any circumstance unless shorthanded. In other words, the roles
20
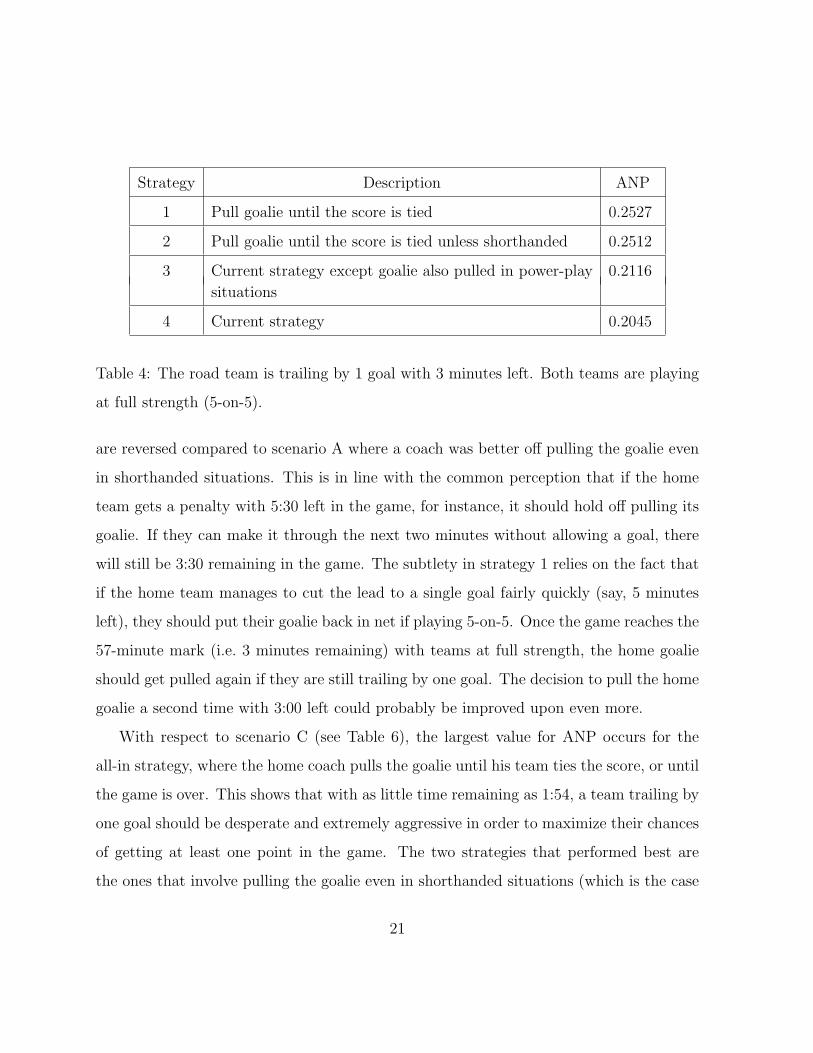
Strategy Description ANP
1 Pull goalie until the score is tied 0.2527
2 Pull goalie until the score is tied unless shorthanded 0.2512
3 Current strategy except goalie also pulled in power-play 0.2116
situations
4 Current strategy 0.2045
Table 4: The road team is trailing by 1 goal with 3 minutes left. Both teams are playing
at full strength (5-on-5).
are reversed compared to scenario A where a coach was better off pulling the goalie even
in shorthanded situations. This is in line with the common perception that if the home
team gets a penalty with 5:30 left in the game, for instance, it should hold off pulling its
goalie. If they can make it through the next two minutes without allowing a goal, there
will still be 3:30 remaining in the game. The subtlety in strategy 1 relies on the fact that
if the home team manages to cut the lead to a single goal fairly quickly (say, 5 minutes
left), they should put their goalie back in net if playing 5-on-5. Once the game reaches the
57-minute mark (i.e. 3 minutes remaining) with teams at full strength, the home goalie
should get pulled again if they are still trailing by one goal. The decision to pull the home
goalie a second time with 3:00 left could probably be improved upon even more.
With respect to scenario C (see Table 6), the largest value for ANP occurs for the
all-in strategy, where the home coach pulls the goalie until his team ties the score, or until
the game is over. This shows that with as little time remaining as 1:54, a team trailing by
one goal should be desperate and extremely aggressive in order to maximize their chances
of getting at least one point in the game. The two strategies that performed best are
the ones that involve pulling the goalie even in shorthanded situations (which is the case
21
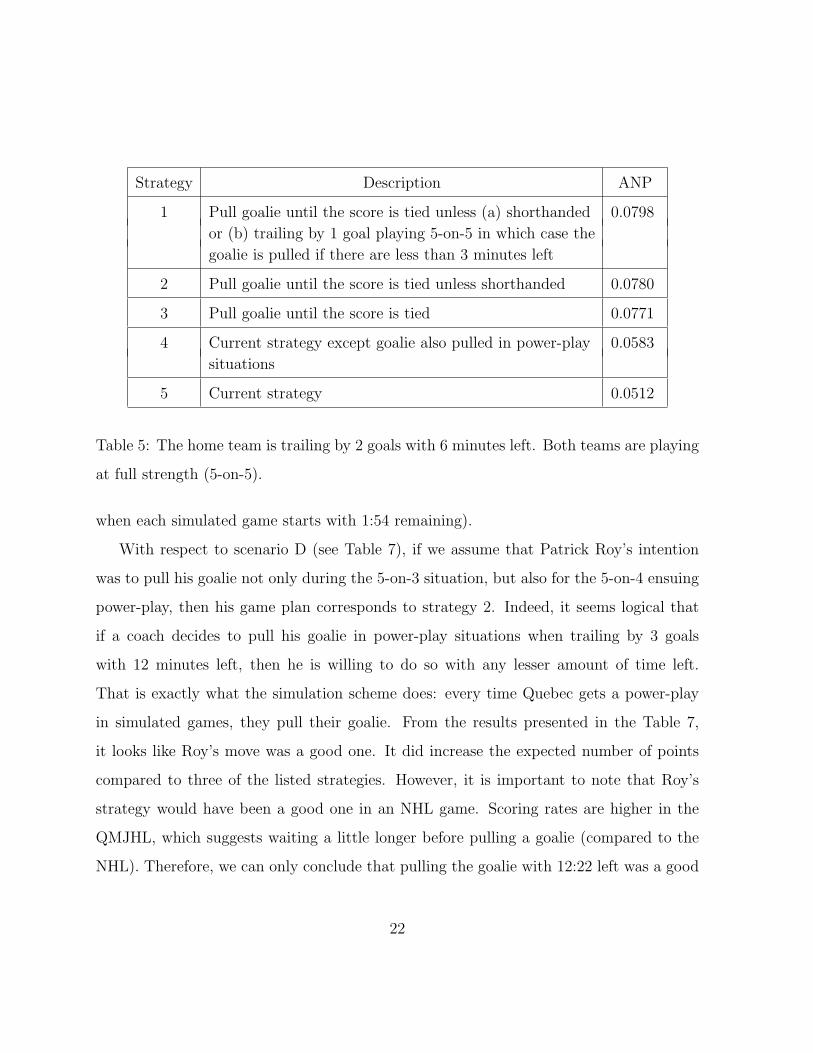
Strategy Description ANP
1 Pull goalie until the score is tied unless (a) shorthanded 0.0798
or (b) trailing by 1 goal playing 5-on-5 in which case the
goalie is pulled if there are less than 3 minutes left
2 Pull goalie until the score is tied unless shorthanded 0.0780
3 Pull goalie until the score is tied 0.0771
4 Current strategy except goalie also pulled in power-play 0.0583
situations
5 Current strategy 0.0512
Table 5: The home team is trailing by 2 goals with 6 minutes left. Both teams are playing
at full strength (5-on-5).
when each simulated game starts with 1:54 remaining).
With respect to scenario D (see Table 7), if we assume that Patrick Roy’s intention
was to pull his goalie not only during the 5-on-3 situation, but also for the 5-on-4 ensuing
power-play, then his game plan corresponds to strategy 2. Indeed, it seems logical that
if a coach decides to pull his goalie in power-play situations when trailing by 3 goals
with 12 minutes left, then he is willing to do so with any lesser amount of time left.
That is exactly what the simulation scheme does: every time Quebec gets a power-play
in simulated games, they pull their goalie. From the results presented in the Table 7,
it looks like Roy’s move was a good one. It did increase the expected number of points
compared to three of the listed strategies. However, it is important to note that Roy’s
strategy would have been a good one in an NHL game. Scoring rates are higher in the
QMJHL, which suggests waiting a little longer before pulling a goalie (compared to the
NHL). Therefore, we can only conclude that pulling the goalie with 12:22 left was a good
22
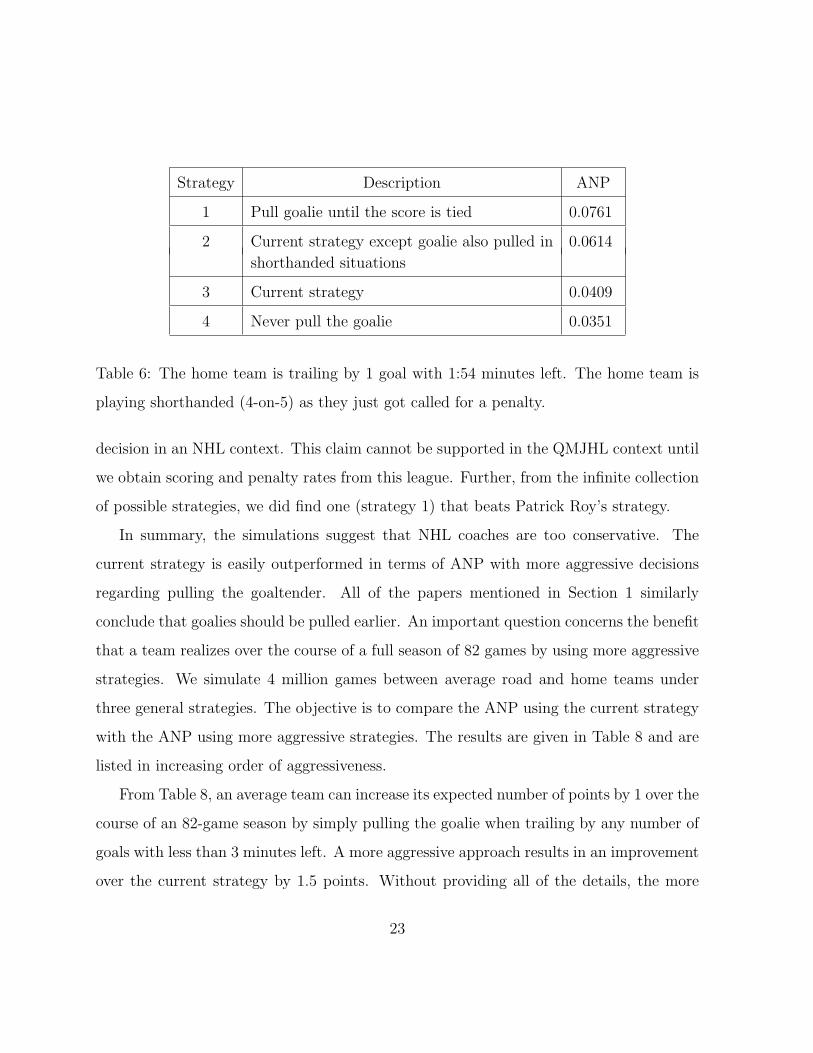
Strategy Description ANP
1 Pull goalie until the score is tied 0.0761
2 Current strategy except goalie also pulled in 0.0614
shorthanded situations
3 Current strategy 0.0409
4 Never pull the goalie 0.0351
Table 6: The home team is trailing by 1 goal with 1:54 minutes left. The home team is
playing shorthanded (4-on-5) as they just got called for a penalty.
decision in an NHL context. This claim cannot be supported in the QMJHL context until
we obtain scoring and penalty rates from this league. Further, from the infinite collection
of possible strategies, we did find one (strategy 1) that beats Patrick Roy’s strategy.
In summary, the simulations suggest that NHL coaches are too conservative. The
current strategy is easily outperformed in terms of ANP with more aggressive decisions
regarding pulling the goaltender. All of the papers mentioned in Section 1 similarly
conclude that goalies should be pulled earlier. An important question concerns the benefit
that a team realizes over the course of a full season of 82 games by using more aggressive
strategies. We simulate 4 million games between average road and home teams under
three general strategies. The objective is to compare the ANP using the current strategy
with the ANP using more aggressive strategies. The results are given in Table 8 and are
listed in increasing order of aggressiveness.
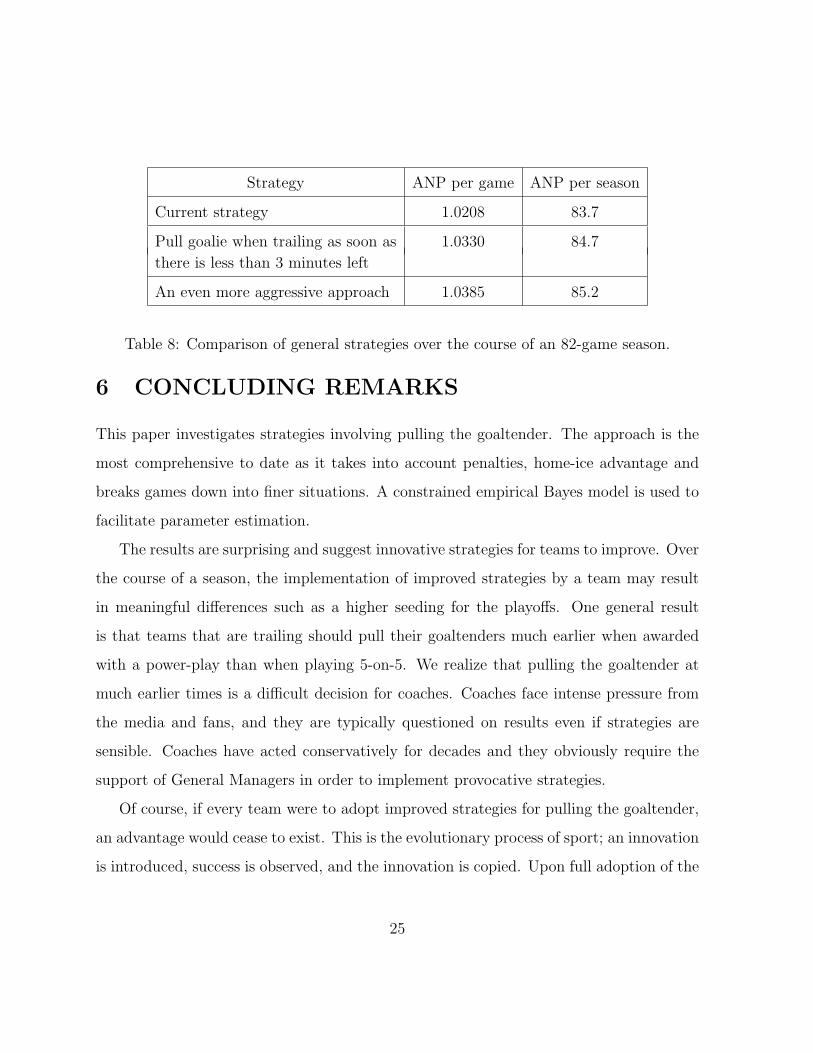
From Table 8, an average team can increase its expected number of points by 1 over the
course of an 82-game season by simply pulling the goalie when trailing by any number of
goals with less than 3 minutes left. A more aggressive approach results in an improvement
over the current strategy by 1.5 points. Without providing all of the details, the more
23
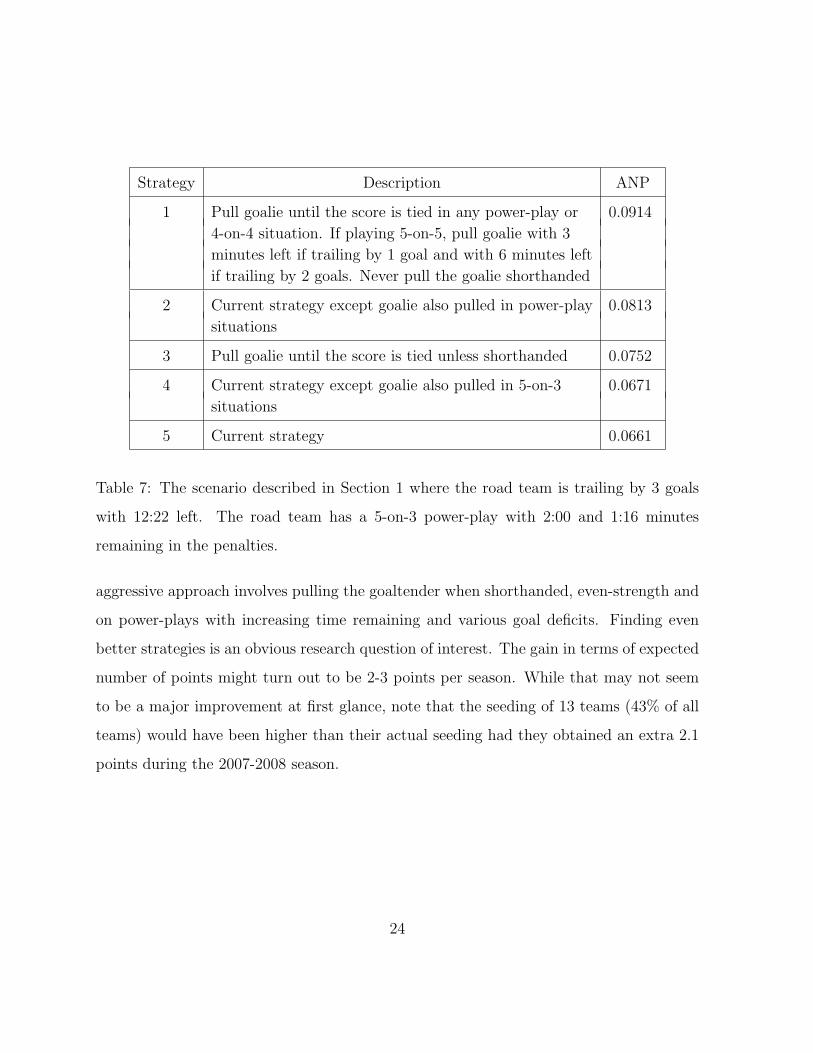
Strategy Description ANP
1 Pull goalie until the score is tied in any power-play or 0.0914
4-on-4 situation. If playing 5-on-5, pull goalie with 3
minutes left if trailing by 1 goal and with 6 minutes left
if trailing by 2 goals. Never pull the goalie shorthanded
2 Current strategy except goalie also pulled in power-play 0.0813
situations
3 Pull goalie until the score is tied unless shorthanded 0.0752
4 Current strategy except goalie also pulled in 5-on-3 0.0671
situations
5 Current strategy 0.0661
Table 7: The scenario described in Section 1 where the road team is trailing by 3 goals
with 12:22 left. The road team has a 5-on-3 power-play with 2:00 and 1:16 minutes
remaining in the penalties.
aggressive approach involves pulling the goaltender when shorthanded, even-strength and
on power-plays with increasing time remaining and various goal deficits. Finding even
better strategies is an obvious research question of interest. The gain in terms of expected
number of points might turn out to be 2-3 points per season. While that may not seem
to be a major improvement at first glance, note that the seeding of 13 teams (43% of all
teams) would have been higher than their actual seeding had they obtained an extra 2.1
points during the 2007-2008 season.
24
Strategy ANP per game ANP per season
Current strategy 1.0208 83.7
Pull goalie when trailing as soon as 1.0330 84.7
there is less than 3 minutes left
An even more aggressive approach 1.0385 85.2
Table 8: Comparison of general strategies over the course of an 82-game season.
6 CONCLUDING REMARKS
This paper investigates strategies involving pulling the goaltender. The approach is the
most comprehensive to date as it takes into account penalties, home-ice advantage and
breaks games down into finer situations. A constrained empirical Bayes model is used to
facilitate parameter estimation.
The results are surprising and suggest innovative strategies for teams to improve. Over
the course of a season, the implementation of improved strategies by a team may result
in meaningful differences such as a higher seeding for the playoffs. One general result
is that teams that are trailing should pull their goaltenders much earlier when awarded
with a power-play than when playing 5-on-5. We realize that pulling the goaltender at
much earlier times is a difficult decision for coaches. Coaches face intense pressure from
the media and fans, and they are typically questioned on results even if strategies are
sensible. Coaches have acted conservatively for decades and they obviously require the
support of General Managers in order to implement provocative strategies.
Of course, if every team were to adopt improved strategies for pulling the goaltender,
an advantage would cease to exist. This is the evolutionary process of sport; an innovation
is introduced, success is observed, and the innovation is copied. Upon full adoption of the
25
innovation, an advantage is no longer conferred. As an example of this, see Lewis (2006)
who chronicles the rise in importance of the left tackle position in the National Football
League.
An important aspect of the paper is that the results may be tailored for specific pairs of
teams by using team-specific parameters. Also, although our attention has been focused
on strategies for pulling the goaltender, it is clear that our general purpose NHL simulator
has applications to various problems involving prediction. For example, teams may want
to know the impact of substituting a particular combination of players with an alternative
combination of players in a specific game situation (e.g. power-plays). Such an application
requires parameters specific to various player combinations.
7 REFERENCES
Anderson-Cook, C.M. and Thornton, T. (1998). “Measuring hockey’s special teams efficiency”,
Chance, 11(4), 26-34.
Berry, S.M. (2000). “My triple crown - First leg: pulling the goalie”, Chance, 13(3), 56-57.
Berry, S.M., Reese, C.S. and Larkey, P.L. (1999). “Bridging different eras in sports”, Journal
of the American Statistical Association, 94, 661-686.
Danehy, J.T. and Lock, R.H. (1995). “CHODR - Using statistics for predict college hockey”,
Stats, 13, 10-14.
Erkut, E. (1987). “Note: More on Morrison and Wheat’s ‘Pulling the goalie revisited”’, Inter-
faces, 17, 121-123.
Gilks, W.R., Richardson, S. and Spiegelhalter, D.J. (editors) (1996). Markov Chain Monte
Carlo in Practice, London: Chapman and Hall.
26
Lewis, M.M. (2006). The Blind Side, New York: W.W. Norton and Company.
Morrison, D.G. (1976). “On the optimal time to pull the goalie: A Poisson model applied to
a common strategy used in ice hockey”, TIMS Studies in Management Sciences, Volume
4, North Holland, New York, 137-144.
Morrison, D.G. and Wheat, R.D. (1986). “Misapplications reviews: Pulling the goalie revis-
ited”, Interfaces, 16, 28-34.
Nydick, R.L. and Weiss, H.J. (1989). “More on Erkut’s ‘More on Morrison and Wheat’s
‘Pulling the goalie revisited”’, Interfaces, 19, 45-48.
Washburn, A. (1991). “Still more on pulling the goalie”, Interfaces, 21, 59-64.
Zaman, Z. (2001). “Coach Markov Pulls Goalie Poisson”, Chance, 14(2), 31-35.
27